Plants regenerated from tissue culture contain stable epigenome changes in rice
- University of California, Los Angeles, United States
- Ohio State University, United States
- Delaware Biotechnology Institute, University of Delaware, United States
- Howard Hughes Medical Institute, University of California, Los Angeles, United States
Abstract
Most transgenic crops are produced through tissue culture. The impact of utilizing such methods on the plant epigenome is poorly understood. Here we generated whole-genome, single-nucleotide resolution maps of DNA methylation in several regenerated rice lines. We found that all tested regenerated plants had significant losses of methylation compared to non-regenerated plants. Loss of methylation was largely stable across generations, and certain sites in the genome were particularly susceptible to loss of methylation. Loss of methylation at promoters was associated with deregulated expression of protein-coding genes. Analyses of callus and untransformed plants regenerated from callus indicated that loss of methylation is stochastically induced at the tissue culture step. These changes in methylation may explain a component of somaclonal variation, a phenomenon in which plants derived from tissue culture manifest phenotypic variability.
https://doi.org/10.7554/eLife.00354.001eLife digest
Rice is one of the most important food crops and is estimated to provide more than a fifth of the calories consumed by the world's population. For several decades, rice has been modified by conventional breeding methods to produce plants with increased yields and greater resistance to pests and harsh weather conditions. Efforts are also being made to create rice plants with superior yield traits and resistance to biotic and abiotic stresses using genetic engineering techniques.
Genetically modified plants are usually produced using tissue culture. New genes are introduced into plant cells that are growing in a dish, and each cell then replicates to form a mass of genetically identical cells. The application of plant hormones triggers the tissue to produce roots and shoots, giving rise to plantlet clones.
In addition to the genes that comprise its genome, the genetic make-up of an organism also includes its epigenome—a collection of chemical modifications that influence whether or not a given gene is expressed as a protein. The addition of methyl groups to specific sequences within the DNA, for example, acts as an epigenetic signal to reduce the transcription, and thus expression, of the genes concerned.
Now, Stroud et al. reveal that the techniques used to modify a plant's genome—in particular, the process of tissue culture—also affect its epigenome. They prepared high-resolution maps of DNA methylation in several regenerated rice lines, and found that regenerated plants produced in culture showed less methylation than control plants. The changes were relatively over-represented around the promoter sequences of genes—regions of DNA that act as binding sites for the enzymes that transcribe DNA into RNA—and were accompanied by changes in gene expression. Crucially, the plants' descendants frequently also inherited the changes in methylation status. These results are likely part of the explanation for a phenomenon called somaclonal variation, first observed before the era of modern biotechnology, in which plants regenerated from tissue culture sometimes show heritable alterations in the phenotype of the plant.
https://doi.org/10.7554/eLife.00354.002Introduction
Rice is one of the world's most important food crops, and genetic modifications are extensively used for various purposes such as to increase yield and tolerate harsh environments. Tissue culture has been heavily used for decades for transformation procedures to generate transgenic crops such as rice and maize (Rao et al., 2009). A previous study has reported that Arabidopsis cell suspension culture has a different epigenomic profile compared to wild-type plants, such that certain transposable elements (TEs) become hypomethylated and certain genes become hypermethylated (Tanurdzic et al., 2008). This raised the question of how tissue culture processes affect the epigenome of regenerated plants derived from tissue culture. Changes in the epigenome have been proposed to be a source of somaclonal variation (i.e., phenotypic variation among regenerated plants) for decades (Kaeppler and Phillips, 1993; Kaeppler et al., 2000; Thorpe, 2006; Rhee et al., 2010; Miguel and Marum, 2011; Neelakandan and Wang, 2012). Indeed, some evidence suggesting changes in the epigenome of regenerated plants have been reported at several specific loci or by methods such as methylation sensitive restrictive enzyme digestion (Neelakandan and Wang, 2012). However, the extent of methylation changes on a genome-wide level has not been previously assessed. Because, unlike most crops, Arabidopsis is almost exclusively transformed via Agrobacterium-mediated floral dip methods that do not utilize tissue culture (Clough and Bent, 1998), Arabidopsis is not a good model for the study of the effect of plant regeneration on the epigenome. The study of the model plant rice, however, may have practical implications for other crop species that are transformed using similar tissue culture methods.
The rice genome is DNA methylated in all three cytosine contexts (CG, CHG, CHH, where H=A, T, or C), with high levels of CG and CHG methylation and very low levels of CHH methylation (Feng et al., 2010; Zemach et al., 2010). Whole genome bisulfite sequencing (BS-seq) enables measurement of DNA methylation at single nucleotide resolution and thus allows one to distinguish DNA methylation in different cytosine contexts (Cokus et al., 2008; Lister et al., 2008).
To investigate the effect that tissue culture processes have on regenerated rice epigenomes, we generated genome-wide, single-nucleotide maps of DNA methylation in several regenerated rice lines that had been transformed with various transgenes, callus, and rice regenerated from tissue culture without transformation. We observed that the tissue culture procedure induced stable changes in DNA methylation in regenerated plants, such that all regenerated lines had ectopic losses of DNA methylation. We found that loss of DNA methylation occurred stochastically, affecting individual plants somewhat differently, was associated with loss of small RNAs, and changes were enriched at promoters of genes. Loss of DNA methylation at promoters was associated with altered expression of particular genes.
Results
We performed deep BS-seq to map DNA methylation in nine regenerated rice lines in the Nipponbare ecotype background that were transformed by various transgenes and were at various stages of inbreeding after transformation: rice blast resistance lines PiZ-t, PiZ-t-839 (a non-functional PiZ-t), Pi9, and an RNAi line for flowering time regulator Spin1 (Zhou et al., 2006; Vega-Sanchez et al., 2008; Table 1). For the PiZ-t line, both transgenic and non-transgenic T2 and T4 plants were available by genetic segregation of the PiZ-t transgene (Table 1). For comparison, we profiled an untransformed wild-type line, which was used to generate all the regenerated lines, WT2003 (sample 1). WT2003 was also inbred 5–7 generations to produce WT2007 (sample 2), and WT2007 was inbred 5–7 additional generations to produce WT2011 (sample 3). We obtained an average genome coverage of 15× and error rates were low at 1.5%, 1.2%, 0.8%, for CG, CHG, CHH methylation, respectively, indicating high quality data (Table 1).
Table 1
BS-Seq samples analyzed in this study
| Sample | Description | Raw reads | Uniquely mapping reads | Coverage (X) | CG error rate | CHG error rate | CHH error rate |
| 1 | WT2003 | 231568902 | 100572780 | 13.5178 | 0.0176 | 0.0122 | 0.0099 |
| 2 | WT2007 | 203541357 | 104376988 | 14.0292 | 0.0107 | 0.0087 | 0.0082 |
| 3 | WT2011 | 187803109 | 84301904 | 11.3309 | 0.0158 | 0.0095 | 0.0065 |
| 4 | T2-PiZt-11-R | 229650259 | 118710094 | 15.9557 | 0.0139 | 0.0099 | 0.0069 |
| 5 | T2-PiZt-11-S | 263329602 | 136471411 | 18.3429 | 0.0101 | 0.0096 | 0.0076 |
| 6 | T4-PiZt-11-R | 270670871 | 131056700 | 17.6151 | 0.0117 | 0.0100 | 0.0074 |
| 7 | T4-PiZt-11-S | 252150298 | 128467721 | 17.2672 | 0.0096 | 0.0076 | 0.0074 |
| 8 | T6-PiZt-11-R | 237280137 | 121966745 | 16.3934 | 0.0105 | 0.0096 | 0.0064 |
| 9 | T6-Pi9-R | 204752699 | 86995742 | 11.6930 | 0.0106 | 0.0093 | 0.0050 |
| 10 | T6-Spin1i-1-R | 215451022 | 90468236 | 12.1597 | 0.0113 | 0.0088 | 0.0061 |
| 11 | T2-PiZt-839-8-R (non functional PiZt) | 238730281 | 117471332 | 15.7892 | 0.0129 | 0.0079 | 0.0056 |
| 12 | T2-PiZt-839-8-S (non functional PiZt) | 211006119 | 106172872 | 14.2705 | 0.0178 | 0.0129 | 0.0095 |
| 13 | WT Callus 1 | 217121522 | 96145279 | 12.9228 | 0.0185 | 0.0178 | 0.0070 |
| 14 | WT Callus 2 | 199261493 | 82617643 | 11.1045 | 0.0232 | 0.0222 | 0.0084 |
| 15 | WT regenerated from tissue culture 1 | 218008835 | 116367626 | 15.6408 | 0.0170 | 0.0155 | 0.0078 |
| 16 | WT regenerated from tissue culture 2 | 225202113 | 97905142 | 13.1593 | 0.0262 | 0.0206 | 0.0093 |
| 17 | WT regenerated from tissue culture 3 | 252306428 | 106544735 | 14.3205 | 0.0194 | 0.0160 | 0.0073 |
| 18 | WT2011 (replicate) | 253971827 | 118140062 | 15.8790 | 0.0172 | 0.0148 | 0.0086 |
-
Number of raw sequencing reads, number of uniquely mapping reads (post-removal of identical reads), genome coverage (rice genome size = 372 Mb), and error rates are listed. DNA methylation levels of the chloroplast genome were used to estimate error rates. Samples 1–12 and samples 13–18 were prepared separately. “R” and “S” correspond to plants that either contain the transgene (R) or plants in which the transgene was segregated away (S).
We observed strong losses of DNA methylation at certain sites in the genome in the regenerated plants but not in wild-type plants (Figure 1A). To further characterize these sites, we defined differentially methylated regions (DMRs) in CG contexts by applying stringent thresholds (see ‘Materials and methods'). We found that all regenerated plants tested were significantly enriched with CG hypomethylation DMRs (Figure 1B). On average, we identified 1344 CG hypomethylation DMRs in the regenerated plants, whose sizes ranged from 100 to 3200 bp (Figure 1C), whereas on average we identified only eight CG hypomethylation DMRs in the inbred wild-type lines (Figure 1—source data 1). Importantly, we observed hypomethylation even in the T2/T4 non-transgenic plants in which the transgenes had been segregated away (samples 5, 7 and 12), suggesting that loss of DNA methylation is likely due to the tissue culture or transformation process, but not due to the fact that the plants contain transgenes. While loss of DNA methylation in different regenerated lines did not always occur at the same sites (Figure 1D), there were significant overlaps of hypomethylation DMRs among regenerated lines (Figure 1E). This suggests that certain sites in the genome are susceptible to loss of DNA methylation in regenerated plants.
Figure 1

Aberrant loss of DNA methylation in regenerated rice.
(A) Genome browser views of fractional CG methylation levels. Sample numbers correspond to those listed in Table 1. Regenerated samples of the same line are grouped together in red boxes. (B) Genome coverage of identified CG hypermethylation and hypomethylation DMRs. DMRs were defined relative to sample 1 (wild type). (C) Distribution of sizes of CG hypomethylation DMRs in regenerated plants. (D) Heat map representation of hierarchical clustering based on CG methylation levels within DMRs. Rows represent all 3610 CG-DMRs identified and columns represent the samples. (E) Overlap of CG-DMRs between samples. The bottom triangle represents the percent overlap of elements listed in the x-axis with those listed in the y-axis. The upper triangle on the other hand represents the percent overlap of elements listed in the y-axis with those listed in the x-axis.
-
Figure 1—source data 1
List of CG, CHG, CHH DMRs identified in this study.
Defined hypomethylation DMRs for each sample are listed.
- https://doi.org/10.7554/eLife.00354.005
We next investigated the stability of DNA methylation losses across generations. To test this, we analyzed a line for which we had plants in T2, T4, and T6 generations (samples 4, 6, 8). 84% of sites that lost CG methylation in the T2 did not recover methylation in the T4 and T6 generations (Figure 2). This suggests that most sites do not regain DNA methylation over several subsequent generations during the process of inbreeding. Approximately 10% of sites recovered methylation in T4, and this methylation was maintained in T6. In addition, 4.4% of sites recovered methylation in T6 but not in T4. This suggests that certain sites are able to regain methylation over generations. Approximately 2% of sites regained methylation in T4, but methylation was lost again in T6, suggesting that a small fraction of sites are epigenetically unstable and continue to switch states. Our results suggest that most of the DNA hypomethylation in regenerated plants was stable over generations.
Figure 2
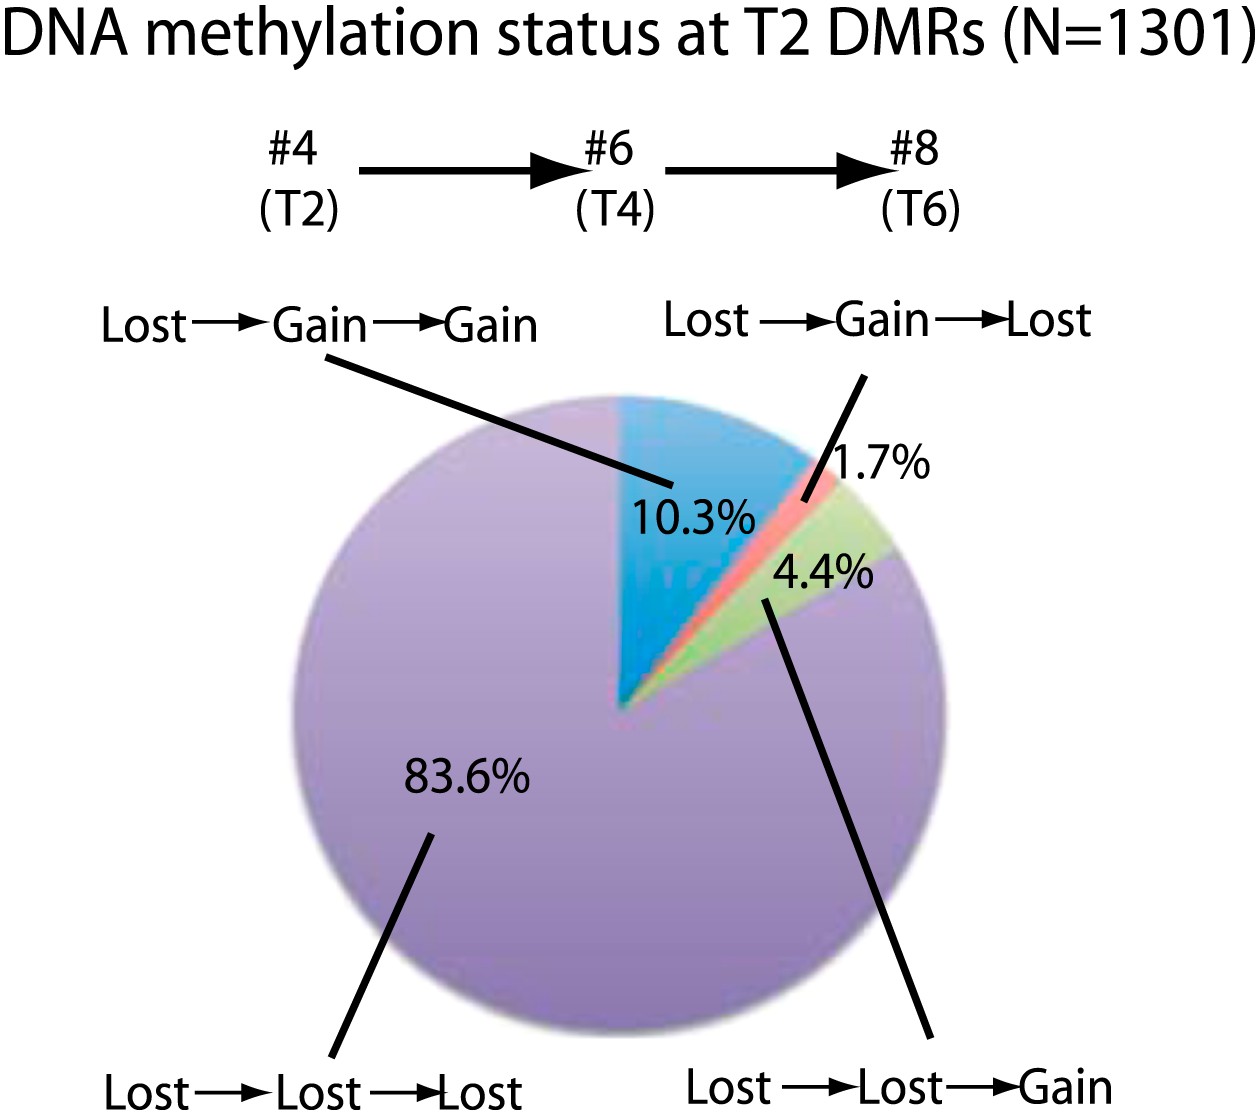
Stability of loss of DNA methylation over generations.
Methylation status of sample 4 (T2) DMRs in T4 and T6 generations are indicated. Loss: less than half of respective wild-type CG methylation levels. Gain: more than half of respective wild-type CG methylation levels.
Loss of DNA methylation in regenerated plants also occurred in non-CG contexts (Figure 1—source data 1). Loss of CG methylation was generally associated with loss of CHG methylation and to a lesser extent with loss of CHH methylation (Figure 3A,B). Small interfering RNAs of 24-nt in length (24-nt siRNAs) are associated with DNA methylation, and are required to guide CHH methylation to particular sites (Law and Jacobsen, 2010). We performed small RNA sequencing (smRNA-seq) on seven randomly chosen regenerated plants along with wild type (Table 2). We examined the distribution of 24-nt siRNAs over CHH hypomethylation DMRs and found that siRNAs are enriched over these sites in wild type, but eliminated in regenerated plants (Figure 3C). Hence loss of DNA methylation is associated with loss of 24 nt siRNAs. Moreover, these siRNA alterations independently confirm our findings showing loss of epigenetic marks at these loci.
Figure 3

Loss of DNA methylation occurs in all three cytosine contexts.
(A) Average distributions of DNA methylation in wild type (faded) and regenerated plants (solid) were plotted over defined CG hypomethylation DMRs in the indicated samples. Flanking regions are the same lengths as the middle region. (B) Heat map of DNA methylation levels within all defined hypomethylation DMRs (CG + CHG + CHH). (C) Average distribution of smRNA-seq reads in wild type (black) and regenerated plants (red) over defined CHH hypomethylation DMRs in indicated samples. Flanking regions are the same lengths as the middle region.
Table 2
smRNA-seq samples analyzed in this study
| Sample | Description | Raw reads | Uniquely mapping reads |
| 1 | WT2003 | 22030663 | 3186666 |
| 2 | WT2007 | 17069498 | 2598780 |
| 3 | WT2011 | 14860767 | 2399713 |
| 4 | T2-PiZt-11-R | 22024881 | 3965317 |
| 5 | T2-PiZt-11-S | 17641623 | 3127938 |
| 6 | T4-PiZt-11-R | 18999415 | 3090933 |
| 7 | T4-PiZt-11-S | 22115074 | 4258752 |
| 8 | T6-PiZt-11-R | 12995193 | 2044615 |
| 9 | T6-Pi9-R | 16700524 | 3114923 |
| 10 | T6-Spin1i-1-R | 17275813 | 2973100 |
-
Number of raw sequencing reads and number of uniquely mapping reads are listed.
We next examined the genomic characteristics of sites that lost DNA methylation in regenerated plants. We tested the extent of overlap between 3597 CG DMRs, 1875 CHG DMRs, and 2298 CHH DMRs defined in the regenerated lines within gene bodies, gene promoters, downstream regions of genes, gene coding sequences, gene introns, and TE genes. Although loss of DNA methylation occurred at a variety of sites, we found the most significant enrichments of DMRs at the promoters of genes (Figure 4A). These genes were not significantly associated with any particular biological processes (data not shown). Rather, they appeared to be a random set of genes involved in different processes (Figure 4—source data 1). Recent studies in Arabidopsis have shown that spontaneous changes in methylation over generations predominantly occurred in gene bodies (Becker et al., 2011; Schmitz et al., 2011). It is possible that hypomethylation observed in regenerated plants occurs through an accelerated process of whatever mechanism causes spontaneous methylation changes over generations. Alternatively, since the DNA methylation changes we observed in regenerated plants was enriched in gene promoters, and was primarily in the direction of methylation loss, it could be a distinct phenomenon from the spontaneously occurring methylation changes in wild type.
Figure 4 with 4 supplements see all

Loss of DNA methylation at promoters may impact gene expression.
(A) Overlap of hypomethylation DMRs with indicated genomic elements. Observed overlap (dark bars) is compared to randomized regions of similar number and size distribution as the DMRs (light bars). Gene body: transcribed region of protein coding genes. Gene promoter: TSS to 2 kb upstream of TSS. 3' downstream of gene TTS (transcription termination site): TTS to 2 kb downstream of TTS. CDS: Coding sequence. TE: Transposable element. Error bars represent standard deviation. *Significant enrichment, p<0.01. (B) Percentages of genes with CG hypomethylation DMRs near TSSs that have significantly altered expression levels (fourfold up/down regulation, FDR<0.01). Genes with zero mRNA-seq reads in both wild type and regenerated samples were removed from the analyses. An average of 11.3 genes were deregulated. (C) Genome browser views of DNA methylation and gene expression levels.
-
Figure 4—source data 1
List of genes with CG hypomethylation DMRs at promoters and their expression levels.
Genes with CG hypomethylation DMRs at the promoter regions (TSS minus 2 kb to TSS) in samples 4–10 along with their normalized expression levels are listed. Also indicated are whether they were significantly up- or down-regulated based on fourfold and FDR < 0.01 cutoffs. Descriptions of genes were directly taken from the rice genome annotation project website (http://rice.plantbiology.msu.edu/).
- https://doi.org/10.7554/eLife.00354.010
While the losses of DNA methylation in regenerated plants occurred within a relatively small proportion of the rice genome, they were concentrated near protein-coding gene promoters and therefore in regions of the genome that are more prone to alter gene expression. We therefore examined the impact of hypomethylation on gene expression by performing mRNA-seq on the same seven randomly chosen regenerated plants as well as on wild-type plants (Table 3). We found that loss of DNA methylation at promoters was associated with higher expression levels of certain genes (Figure 4B,C, Figure 4—source data 1, Figure 4—figure supplement 1, 2). Notably, the closer the hypomethylation was to the gene transcription start site, the more likely the gene tended to be misregulated (Figure 4B). Furthermore, the expression of these genes was much more frequently increased, rather than decreased, suggesting that the misexpression of these genes is likely a direct consequence of losses of DNA methylation (Figure 4B). Hence loss of DNA methylation in regenerated plants is associated with deregulated transcription of certain protein-coding genes.
Table 3
mRNA-seq samples analyzed in this study
| Sample | Description | Raw reads | Uniquely mapping reads |
| 2 | WT2007 | 44029089 | 29461162 |
| 3 | WT2011 | 33997755 | 22657098 |
| 4 | T2-PiZt-11-R | 42550136 | 27839598 |
| 5 | T2-PiZt-11-S | 43173764 | 28688381 |
| 6 | T4-PiZt-11-R | 46624891 | 35826861 |
| 7 | T4-PiZt-11-S | 31729173 | 22667633 |
| 8 | T6-PiZt-11-R | 46624532 | 35335627 |
| 9 | T6-Pi9-R | 38978541 | 30623633 |
| 10 | T6-Spin1i-1-R | 42280235 | 32485204 |
-
Number of raw sequencing reads and number of uniquely mapping reads are listed.
We further sought to determine whether it was the tissue culture process or the transformation process that induced loss of DNA methylation in regenerated plants. To test this, we performed BS-seq on callus and three individual plants regenerated from untransformed callus, all of which were derived from a single parent plant (WT2011; Table 1). We were not able to perform BS-seq on individual calli because calli at the stage of transformation did not yield enough genomic DNA. Instead, we pooled multiple calli, and sequenced two separate batches. We found a strong loss of DNA methylation in plants regenerated from untransformed callus (Figure 5A). Loss of DNA methylation in callus was much more modest, though significant (Figure 5A). This relatively weak loss of DNA methylation may be because individual calli lose DNA methylation at different sites (despite being derived from the same parent plant), and pooling multiple calli diluted the loss of DNA methylation. Consistent with this notion, individual plants regenerated from untransformed callus showed differences in sites that lost DNA methylation (Figure 5B). Furthermore, when examining methylation levels of these samples at CG hypomethylation DMRs that were common in all regenerated plants, we found significant losses of DNA methylation at these sites in callus (Figure 5C,D), indicating that the methylation losses observed in callus were at largely the same sites as those observed in regenerated plants. Like in the regenerated lines, the losses of DNA methylation in the non-transformed regenerated plants occurred stochastically, affecting DNA methylation in each plant somewhat differently (Figure 5A–D). In summary, the loss of DNA methylation in regenerated plants is likely caused by the tissue culture step, and not due to the transformation process.
Figure 5

Tissue culture step induces loss of DNA methylation.
(A) Genome coverage of identified CG hypermethylation and hypomethylation DMRs. DMRs were defined relative to sample 18 (wild type). (B) Heat map of CG methylation levels within all 1074 CG hypomethylation DMRs identified in samples 13 to 17 (callus samples and wild-type plants regenerated from callus). (C) Heat map of CG methylation levels within 241 CG hypomethylation DMRs that were observed in all tested regenerated plants. (D) Boxplot representations of (C). Red lines, median; edges of boxes, 25th (bottom) and 75th (top) percentiles; error bars, minimum and maximum points within 1.5 × IQR (Interquartile range); red dots, outliers.
Previous reports have indicated that certain genes are hypermethylated in Arabidopsis cell suspension culture and callus (Berdasco et al., 2008; Tanurdzic et al., 2008). Consistent with those data we found that rice callus showed hypermethylation throughout the genome (Figure 6A). Interestingly we found that the hypermethylation occurred specifically in CHH contexts (Figure 6A,B, Figure 6—figure supplement 1A), and showed high coincidence between the two callus samples (13 and 14) (Figure 6—figure supplement 1B). These CHH hypermethylated regions mostly corresponded to promoter regions (Figure 6C, Figure 6—figure supplement 1A). Hence in callus, certain promoters are CHH hypermethylated, while others are hypomethylated in all cytosine contexts. Interestingly, CHH hypermethylation observed in callus was completely lost in regenerated plants (Figure 6A,B, Figure 6—figure supplement 1A). This suggests that unlike tissue culture-induced DNA hypomethylation that is largely stable after regeneration, CHH hypermethylation is eliminated after regeneration.
Figure 6 with 1 supplement see all
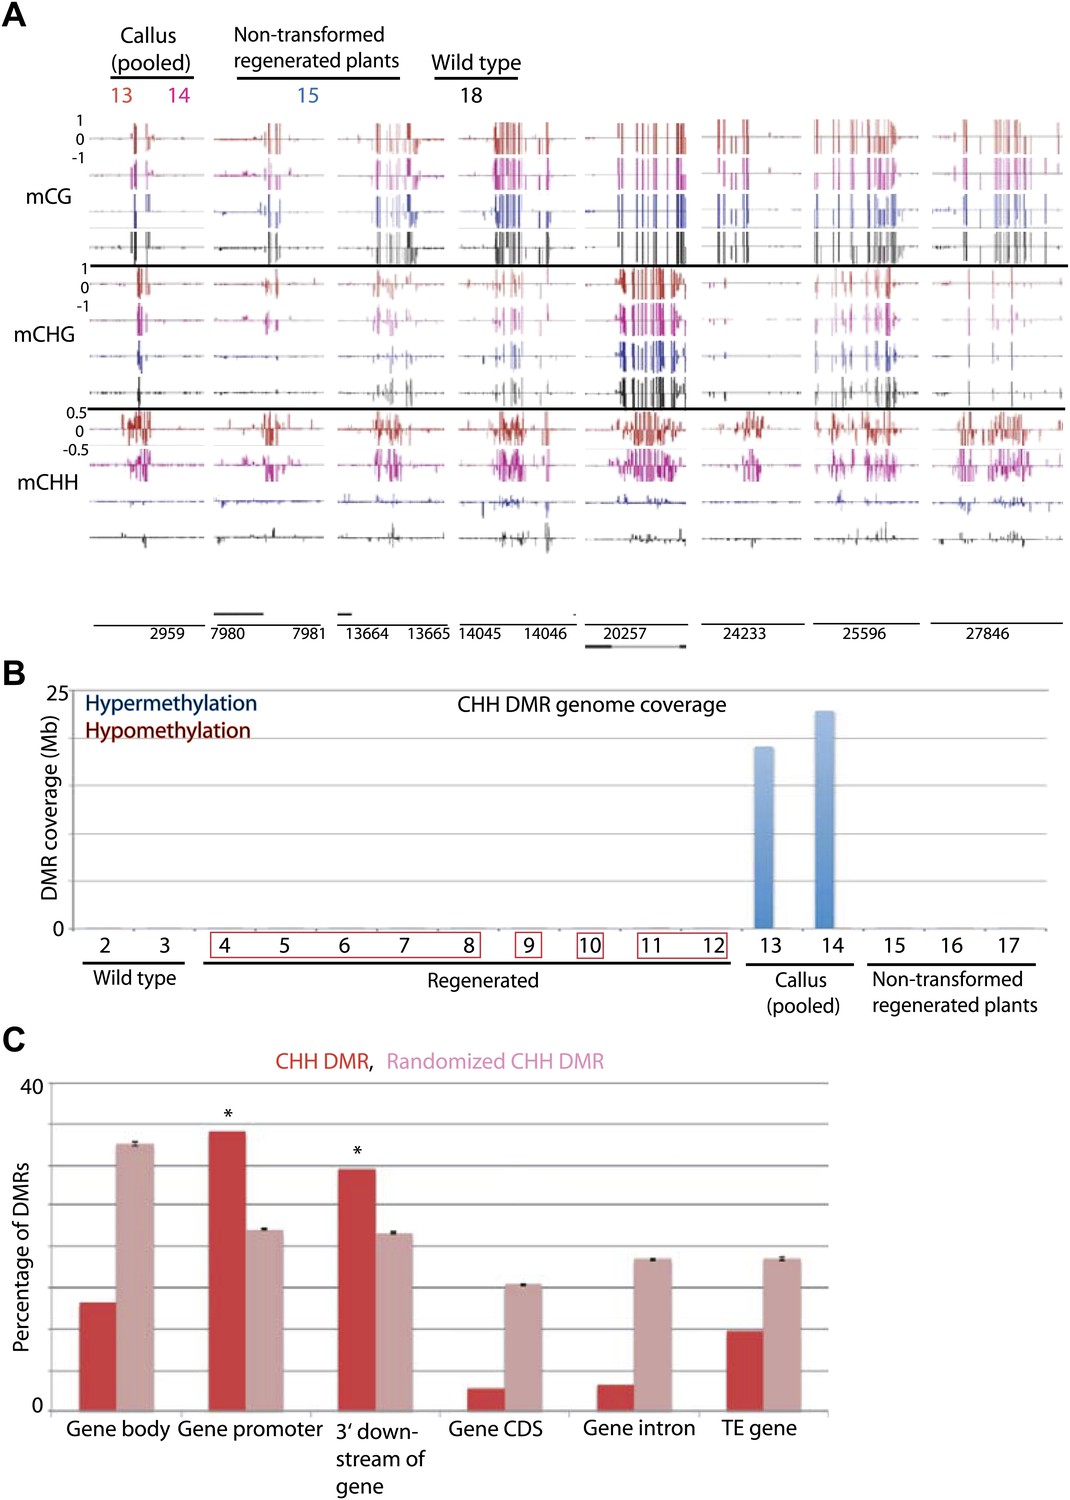
Tissue culture-induced CHH hypermethylation is eliminated upon regeneration.
(A) Genome browser views of DNA methylation. (B) Genome coverage of identified CHH hypermethylation and hypomethylation DMRs. Regenerated samples of the same line are grouped together in red boxes. (C) Overlap of callus CHH hypermethylation DMRs with indicated genomic elements. Observed overlap (dark bars) is compared to randomized regions of a similar number and size distribution as the DMRs (light bars). Error bars represent standard deviation.
Discussion
In this report, we have investigated the effect that tissue culture processes have on the epigenome of regenerated plants by generating high-resolution maps of DNA methylation. Consistent with a previous study in Arabidopsis cell culture using microarray hybridization on chromosome 4 (Tanurdzic et al., 2008), we observed hypermethylation at certain genes in rice callus. We extend this observation by showing that hypermethylation predominantly occurs in CHH sequence contexts, most notably occurring at the promoters of genes. Interestingly, we found that this CHH hypermethylation was completely eliminated upon regeneration, suggesting that CHH hypermethylation may be linked specifically to the dedifferentiated state.
In contrast to Arabidopsis cell culture, we did not observe global hypomethylation at TEs in rice callus. Instead, we found that DNA methylation was specifically lost at certain sites in the genome, appearing to affect individual plants somewhat differently despite coming from the same parent plant. We found that loss of DNA methylation was maintained upon plant regeneration, and was largely stable over subsequent generations. It is possible that some of the DMRs affected only one homologous chromosome and were segregating. However, because we required DMRs to have at least 70% reduction in DNA methylation compared to wild-type, the sites we analyzed in Figure 2 are likely homozygous for loss of DNA methylation, consistent with their stability across generations. Loss of DNA methylation occurred in all sequence contexts, and was associated with loss of 24-nt siRNAs. Notably, these sites were frequently associated with promoters of genes, and loss of DNA methylation was associated with misregulation of expression of proximal protein-coding genes, indicating a biological importance of this phenomenon. Interestingly, genes significantly up-regulated (fourfold upregulated compared to wild type, p<0.01) in each regenerated line were somewhat different (Figure 4—figure supplement 3). For this reason, it is difficult to assess the severity of impact of misregulated gene expression for any particular regenerated line, since some lines may have more biologically important genes affected than others. This would correlate with the observation that somoclonal variation affects only a proportion of plants that arise from regeneration experiments (Kaeppler and Phillips, 1993; Kaeppler et al., 2000; Thorpe, 2006; Rhee et al., 2010; Miguel and Marum, 2011; Neelakandan and Wang, 2012).
Previous studies have shown that certain TEs such as Tos17 and mPing are reactivated in tissue culture, and are associated with changes in DNA methylation (Neelakandan and Wang, 2012). While our results suggest that most DNA hypomethylation occurs near genes and are relatively depleted at TE related sequences (Figure 4A), some of the hypomethylation did occur proximal to TE genes (average of 62.1 TE genes per line). The association of loss of methylation with TE gene reactivation was not clear (data not shown), however very subtle depletion of DNA methylation was observed over reactivated TE genes (Figure 4—figure supplement 4), suggesting that loss of methylation may in part be responsible for reactivation of TEs.
Our results suggest that each regenerated plant has distinct DNA methylation profiles despite coming from the same parent (Figure 5A–D). It therefore appears that the tissue culture step induces DNA hypomethylation in a rather stochastic manner affecting individual plants differently. We further show that descendants of regenerated plants stably maintain most hypomethylation across plant generations (Figure 2). Indeed, lines derived from the same original regenerated plant show very similar methylation profiles (Figure 1E; samples 4–8 and 11–12). It has long been proposed that changes in the epigenome may be a source of somaclonal variation (Thorpe, 2006; Rhee et al., 2010; Miguel and Marum, 2011; Neelakandan and Wang, 2012). Our genome-wide data support this notion since we show that stochastic hypomethylation in individual regenerants is associated with misregulated expression of certain genes. These epigenetic changes likely explain a component of somaclonal variation that has been observed for decades in a number of plant species.
In summary, our results suggest that use of tissue culture leaves behind an epigenetic footprint in regenerated plants that is stable over multiple generations and may partially explain somaclonal variation. Whereas the material used in this study were self-fertilized plants, a common practice in the development of agricultural biotechnology traits is to introgress new transgene loci into commercial genetic backgrounds, meaning that the plants used in agriculture are many generations removed from the initial regenerated plants (Bregitzer et al., 2008; Bennetzen and Hake, 2009; Johnson, 2009; Yang et al., 2012). The crosses utilized in these introgression schemes are likely to correct the vast majority of tissue culture-induced epigenetic changes.
Material and methods
Rice material
Request a detailed protocolWild-type rice (Oryza sativa ssp japonica cv Nipponbare) and regenerated rice lines (in Nipponbare background) were used in this study (Zhou et al., 2006; Vega-Sanchez et al., 2008). Hygromycin was used as the selection marker in rice transformation. All the resistant plants were selfed for indicated generations (Table 1). Homozygosity was confirmed by PCR analysis of the transgene. Rice seeds were surface-sterilized and transferred to 1/2 MS medium. After germination, rice seedlings were transplanted into soil and kept in a growth chamber at 26/20°C under a 14-hr light/10-hr dark cycle. The rice plants regenerated from untransformed rice callus induced from Nipponbare seeds (WT2011) were prepared as previously described (Zhou et al., 2006; Vega-Sanchez et al., 2008). Rice leaf samples were collected at 3 weeks after transplanted into soil and the rice callus were harvested from the callus inducing media.
Bisulfite sequencing (BS-seq) and analysis
Request a detailed protocolBS-seq libraries were generated as previously described using premethylated adapters (Feng et al., 2011) using 1 μg of genomic DNA isolated using DNeasy Plant Maxi Kit (Qiagen, Hilden, Germany). Libraries were single-end sequenced on a HiSeq 2000, and reads were base-called using the standard Illumina software. The read counts for these libraries are listed in Table 1. Reads (50 nt) were mapped to the MSU 6.1 version genome using BS-seeker (Chen et al., 2010) allowing up to two mismatches. Identical reads were collapsed into one read. Fractional methylation levels were calculated by #C/(#C+#T).
DMRs for each sample were defined by comparing methylation levels to wild type in 100 bp bins across the genome. Fischer's exact test was used to identify bins that were significantly differentially methylated by comparing #C and #T (Benjamini-Hochberg corrected FDR < 0.01). In addition, we required an absolute methylation difference of 0.7, 0.5, 0.1, for CG, CHG, CHH methylation, respectively. Bins that were within 100 bp were merged. Finally, only bins that contained 10 informative cytosines (i.e., covered by ≥4 reads) in both the sample and wild type were considered as DMRs. Sample 1 was used for the wild type control for samples 2–12, whereas sample 18 was used for the wild type control for samples 13–17. This was because sample preparation (i.e., growth of plants and library constructions) were performed in two batches: 1∼12 and 13∼18.
All heat maps in this study were generated by complete linkage and using Euclidean distance as a distance measure. Rows with missing values were omitted for presentation purposes but did not affect the conclusions in the paper.
For determining overlap of DMRs with different genomic elements, we considered 1 bp overlap as an overlap. To assess significance, we generated 100 sets of ‘randomized DMRs' which mimicked both the number and size distributions as the observed DMRs, and examined their overlaps with the different genomic elements.
mRNA/smRNA sequencing and analysis
Request a detailed protocolRNA-seq libraries were constructed from total RNA isolated using TRIzol reagent (Invitrogen, Life Technologies, Carlsbad, CA) from leaf tissues of samples 2∼10. Total RNA (10 μg) for each sample was used to purify poly-A mRNA; this mRNA was used for synthesis and amplification of cDNA. The RNA-seq libraries were prepared using the TruSeq RNA Sample Preparation Kit from Illumina (San Diego, CA). Libraries were sequenced on an Illumina HiSeq 2000. The read counts for these libraries are listed in Table 3.
smRNA-seq libraries were constructed from total RNA isolated from the same tissues as described for the mRNA libraries, using the TruSeq Small RNA Sample Prep Kit from Illumina (San Diego, CA). The libraries were sequenced on the same Illumina HiSeq 2000 as the mRNA-seq libraries. The read counts for these libraries are listed in Table 2.
Gene annotations (MSU 6.1) were obtained from the Rice Genome Annotation Project website (http://rice.plantbiology.msu.edu/). mRNA-seq reads were mapped and processed as previously described (Stroud et al., 2012). Briefly, reads were uniquely mapped to the genome using Bowtie (Langmead et al., 2009) allowing two mismatches, and differentially expressed genes were defined by applying fourfold and FDR < 0.01 cutoffs. smRNA-seq reads were uniquely mapped to the genome using Bowtie allowing no mismatches, and reads were categorized by their lengths for analyses. Reads per kilobase per million mapped reads (RPKM) was used to quantify RNA-seq datasets.
Accession numbers
Request a detailed protocolAll sequencing data have been deposited in the NCBI Gene Expression Omnibus with accession number GSE42410.
Data availability
-
Plants regenerated from tissue culture contain stable epigenome changes in riceID GSE42410. In the public domain at GEO: http://www.ncbi.nlm.nih.gov/geo/.
References
-
BS Seeker: precise mapping for bisulfite sequencingBMC Bioinformatics 11:203.https://doi.org/10.1186/1471-2105-11-203
-
Conservation and divergence of methylation patterning in plants and animalsProc Natl Acad Sci USA 107:8689–8694.https://doi.org/10.1073/pnas.1002720107
-
Determining DNA methylation profiles using sequencingMethods Mol Biol 733:223–238.https://doi.org/10.1007/978-1-61779-089-8_16
-
BookMaize and biotech industryIn: Bennetzen JLH, Hake SC, editors. Handbook of Maize. New York: Springer. pp. 115–140.
-
Epigenetic aspects of somaclonal variation in plantsPlant Mol Biol 43:179–188.https://doi.org/10.1023/A:1006423110134
-
Tissue culture-induced DNA methylation variation in maizeProc Natl Acad Sci USA 90:8773–8776.https://doi.org/10.1073/pnas.90.19.8773
-
The myth of plant transformationBiotechnol Adv 27:753–763.https://doi.org/10.1016/j.biotechadv.2009.04.028
-
History of plant tissue cultureMethods Mol Biol 318:9–32.https://doi.org/10.1385/1-59259-959-1:009
-
Effect of successive backcrossing on eliminating somaclonal variation caused by Agrobacterium-mediated transformation in riceActa Agron Sin 38:814–819.
Article and author information
Author details
Funding
US National Science Foundation Plant Genome Research Program (0701745)
- Matteo Pellegrini
- Guo-Liang Wang
- Blake C Meyers
- Steven E Jacobsen
Dissertation Year Fellowship, University of California, Los Angeles
- Hume Stroud
Special Fellow of the Leukemia & Lymphoma Society
- Suhua Feng
Howard Hughes Medical Institute
- Steven E Jacobsen
The funders had no role in study design, data collection and interpretation, or the decision to submit the work for publication.
Acknowledgements
We thank Mahnaz Akhavan for Illumina sequencing. Sequencing of BS-seq samples was performed at the UCLA BSCRC BioSequencing Core Facility, and sequencing of mRNA-seq and smRNA-seq samples was performed at the Delaware Biotechnology Institute. We also thank Nathan Springer (University of Minnesota), Shawn Kaeppler (University of Wisconsin), Hugh Dickinson (University of Oxford), Mike Nuccio (Syngenta), Steven Ritchie (Syngenta) and Qiudeng Que (Syngenta) for helpful comments on the manuscript.
Reviewing Editor
- David Baulcombe, University of Cambridge, United Kingdom
Version history
- Received: November 5, 2012
- Accepted: February 11, 2013
- Version of Record published: March 19, 2013 (version 1)
Copyright
© 2013, Stroud et al.
This article is distributed under the terms of the Creative Commons Attribution License, which permits unrestricted use and redistribution provided that the original author and source are credited.
Metrics
-
- 5,627
- views
-
- 1,252
- downloads
-
- 201
- citations
Views, downloads and citations are aggregated across all versions of this paper published by eLife.
Download links
A two-part list of links to download the article, or parts of the article, in various formats.
Downloads (link to download the article as PDF)
Open citations (links to open the citations from this article in various online reference manager services)
Cite this article (links to download the citations from this article in formats compatible with various reference manager tools)
Plants regenerated from tissue culture contain stable epigenome changes in rice
eLife 2:e00354.
https://doi.org/10.7554/eLife.00354
Further reading
-
- Chromosomes and Gene Expression
Splicing is the stepwise molecular process by which introns are removed from pre-mRNA and exons are joined together to form mature mRNA sequences. The ordering and spatial distribution of these steps remain controversial, with opposing models suggesting splicing occurs either during or after transcription. We used single-molecule RNA FISH, expansion microscopy, and live-cell imaging to reveal the spatiotemporal distribution of nascent transcripts in mammalian cells. At super-resolution levels, we found that pre-mRNA formed clouds around the transcription site. These clouds indicate the existence of a transcription-site-proximal zone through which RNA move more slowly than in the nucleoplasm. Full-length pre-mRNA undergo continuous splicing as they move through this zone following transcription, suggesting a model in which splicing can occur post-transcriptionally but still within the proximity of the transcription site, thus seeming co-transcriptional by most assays. These results may unify conflicting reports of co-transcriptional versus post-transcriptional splicing.
-
- Chromosomes and Gene Expression
- Genetics and Genomics
Heterogeneity in endothelial cell (EC) sub-phenotypes is becoming increasingly appreciated in atherosclerosis progression. Still, studies quantifying EC heterogeneity across whole transcriptomes and epigenomes in both in vitro and in vivo models are lacking. Multiomic profiling concurrently measuring transcriptomes and accessible chromatin in the same single cells was performed on six distinct primary cultures of human aortic ECs (HAECs) exposed to activating environments characteristic of the atherosclerotic microenvironment in vitro. Meta-analysis of single-cell transcriptomes across 17 human ex vivo arterial specimens was performed and two computational approaches quantitatively evaluated the similarity in molecular profiles between heterogeneous in vitro and ex vivo cell profiles. HAEC cultures were reproducibly populated by four major clusters with distinct pathway enrichment profiles and modest heterogeneous responses: EC1-angiogenic, EC2-proliferative, EC3-activated/mesenchymal-like, and EC4-mesenchymal. Quantitative comparisons between in vitro and ex vivo transcriptomes confirmed EC1 and EC2 as most canonically EC-like, and EC4 as most mesenchymal with minimal effects elicited by siERG and IL1B. Lastly, accessible chromatin regions unique to EC2 and EC4 were most enriched for coronary artery disease (CAD)-associated single-nucleotide polymorphisms from Genome Wide Association Studies (GWAS), suggesting that these cell phenotypes harbor CAD-modulating mechanisms. Primary EC cultures contain markedly heterogeneous cell subtypes defined by their molecular profiles. Surprisingly, the perturbations used here only modestly shifted cells between subpopulations, suggesting relatively stable molecular phenotypes in culture. Identifying consistently heterogeneous EC subpopulations between in vitro and ex vivo models should pave the way for improving in vitro systems while enabling the mechanisms governing heterogeneous cell state decisions.


