Physiological and stem cell compartmentalization within the Drosophila midgut
- Howard Hughes Medical Institute, Carnegie Institution for Science, United States
Figures
Figure 1 with 2 supplements

The Drosophila midgut is comprised of multiple subregions.
(A) Drawings are shown to scale of representative enterocytes from each of 10 consecutive regions located along the anterior-posterior (a/p) axis of the midgut, as determined from electron microscopy, including parietal cells (orange) and interstitial cells (sky blue). Cells enriched in glycogen (navy blue), lipid (purple or teal), or iron (green) are shown. (B) A midgut from a Fer-GFP protein trap stained anti-GFP (red) to highlight the Fe region, and with Nile red (green) to highlight lipid-rich regions A2, P1, and P3. Inset: lipid staining in the indicated zones is shown at higher magnification. (C) Midgut drawing showing the average number of enterocyte cell diameters along the a/p axis within the 10 subregions (± SEM). (D) Gene expression borders in enterocytes (ECs, purple) or enteroendocrine cells (ees, blue) at the indicated subregion junctions are totaled for 49 Janelia lines with patterned midgut expression. (E) Gene expression borders in midgut–associated muscle relative to subregion junctions are totaled for the eight Janelia lines with patterned circular muscle expression. (F and G) Midguts from a R45D10-GAL4; UAS-GFP female (F) or R50A12-GAL4; UAS-GFP female (G) stained with anti-Cut (red polyploid Cu cells), anti-Prospero (red diploid cells throughout), and anti-GFP antibody shows expression restricted to A1 or to Cu, P2, P3 and P4, respectively.
Figure 1—figure supplement 1
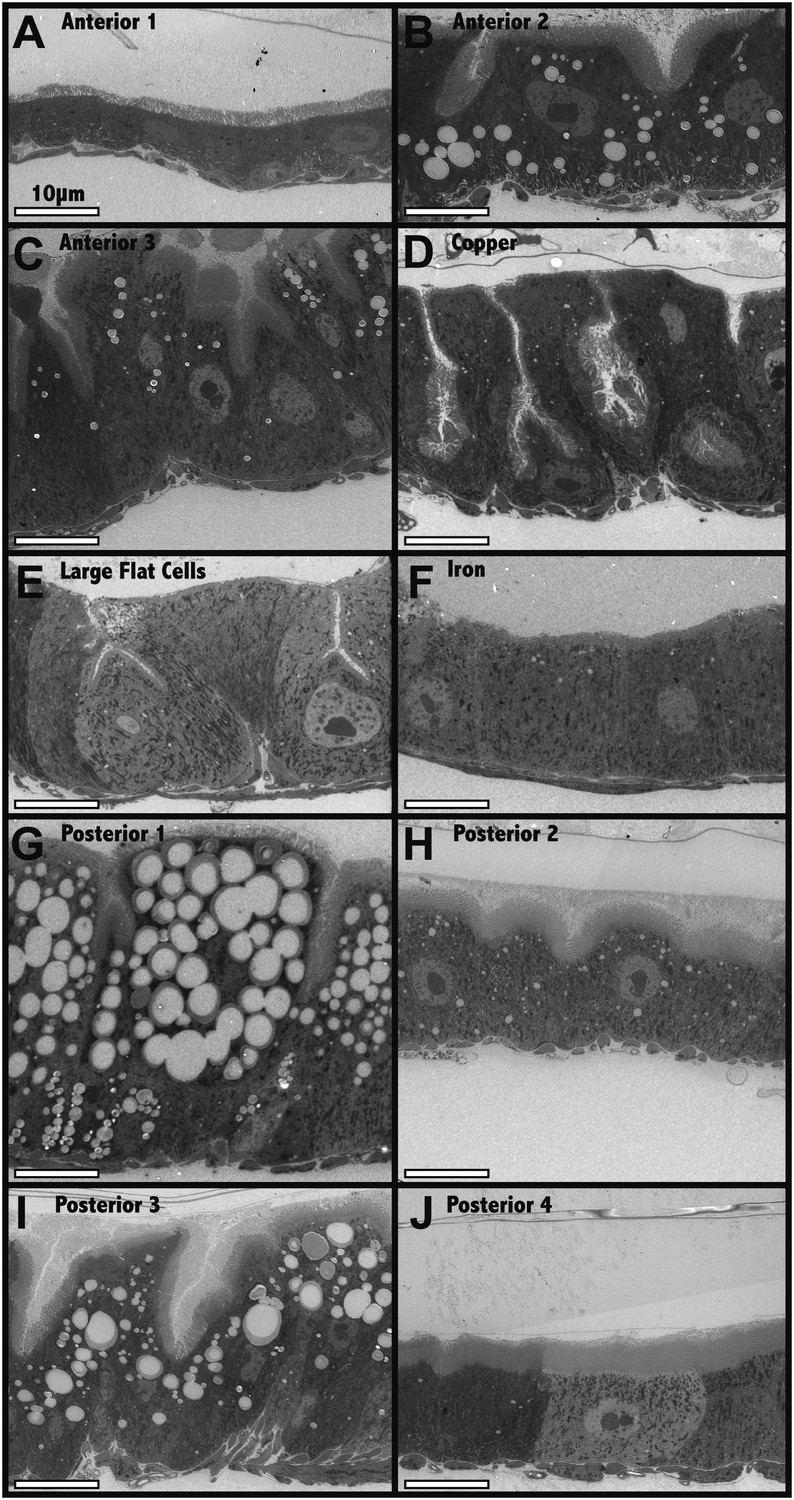
Electron microscopic analysis of midgut enterocytes reveals ten subregions along the anterior-posterior axis (see diagram above).
(A–J) Representative electron micrographs of enterocytes within the indicated regions are shown. Scale bars are shown.
Figure 1—figure supplement 2
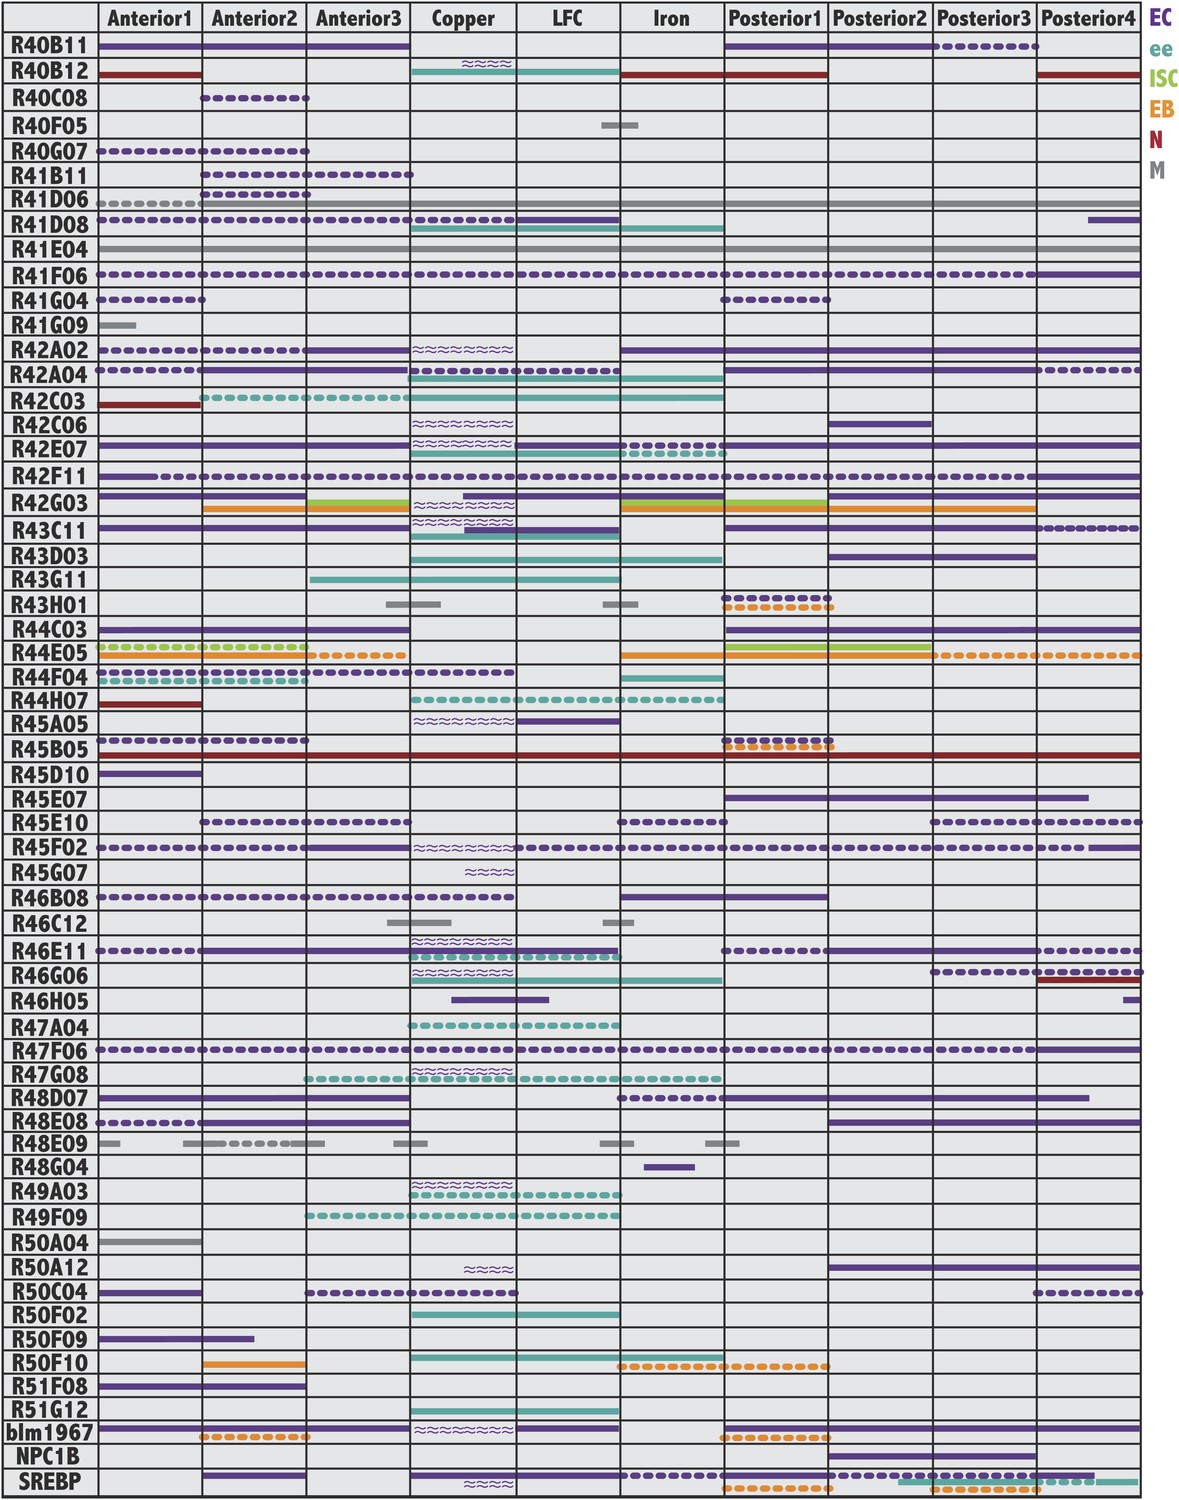
Gene expression patterns of Janelia and other useful Gal4 lines.
For each GAL4 line shown on the left, colored bars indicate its pattern and cell type specificity of expression within the ten midgut subregions (columns). Cell type is indicated by color: enterocytes (EC:purple), enteroendocrine cells (ee:blue), intestinal stem cells (ISC:green), enteroblasts (EB:orange), enteric neurons (N:burgundy), circular visceral muscle (M:grey). A continuous line indicates strong expression (over 50% of cells), whereas a dashed line indicates weaker expression (less than 50% of cells). Purple wavy lines indicate parietal cell expression. Not all patterns corresponded to regional boundaries, as indicated by lines that cross their borders.
Figure 2

RNAseq analysis of midgut subregions.
(A) Schematic of the 10 samples collected. Bars represent isolated portions of gut tissue, either containing single regions (A1, Cu, Fe, P1) or pooled regions (A1-3, Cu-LFC-Fe, P1-4, A2-3, LFC-Fe, P2-4). (B) Expression profile of select hormones showing regional specificity. (C) Expression profile of PGRP isoforms showing regional specificity. (D) Regionalized gene expression validates RNAseq method and rules out cross contamination. For each gene (key at right), its mean expression level (fpkm) by RNAseq in the three replicate isolated regions (x axis) is plotted. CG10725 (peritrophic membrane), Gal (beta-Galactosidase), lab (homeobox transcription factor), CG15570 (unknown), ZIP1 x 0.5 (zinc-iron transporter), CG3106 x 0.1 (acyl transferase), Ast (Allatostatin). (E) Regionalized expression of caudal (cad) and two PGRP genes implicated in immune interactions with the midgut microbiome.
Figure 3
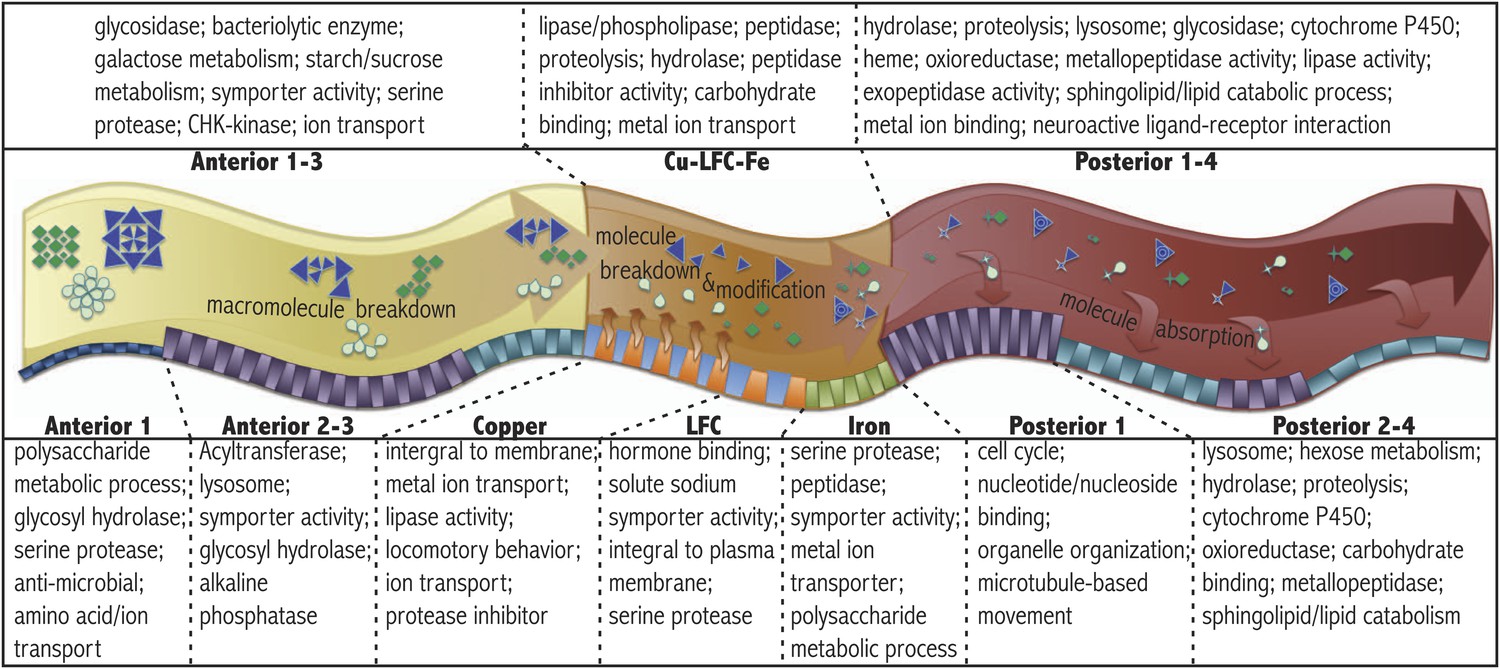
Regional gene expression.
Pathways and gene ontology analysis using DAVID (see ‘Materials and methods’) enriched in the anterior (A1–3 pooled sample), middle (Cu-LFC-Fe pooled sample), and posterior (P1–4 pooled sample) midgut are listed in the upper panel. Below, a schematic diagram illustrates sequential strategy of digestion suggested by RNAseq analysis. Orange arrows from orange parietal cells in copper region indicate acidification process. Bottom panel indicates pathways and gene ontology analysis using DAVID enriched in subregions.
Figure 4
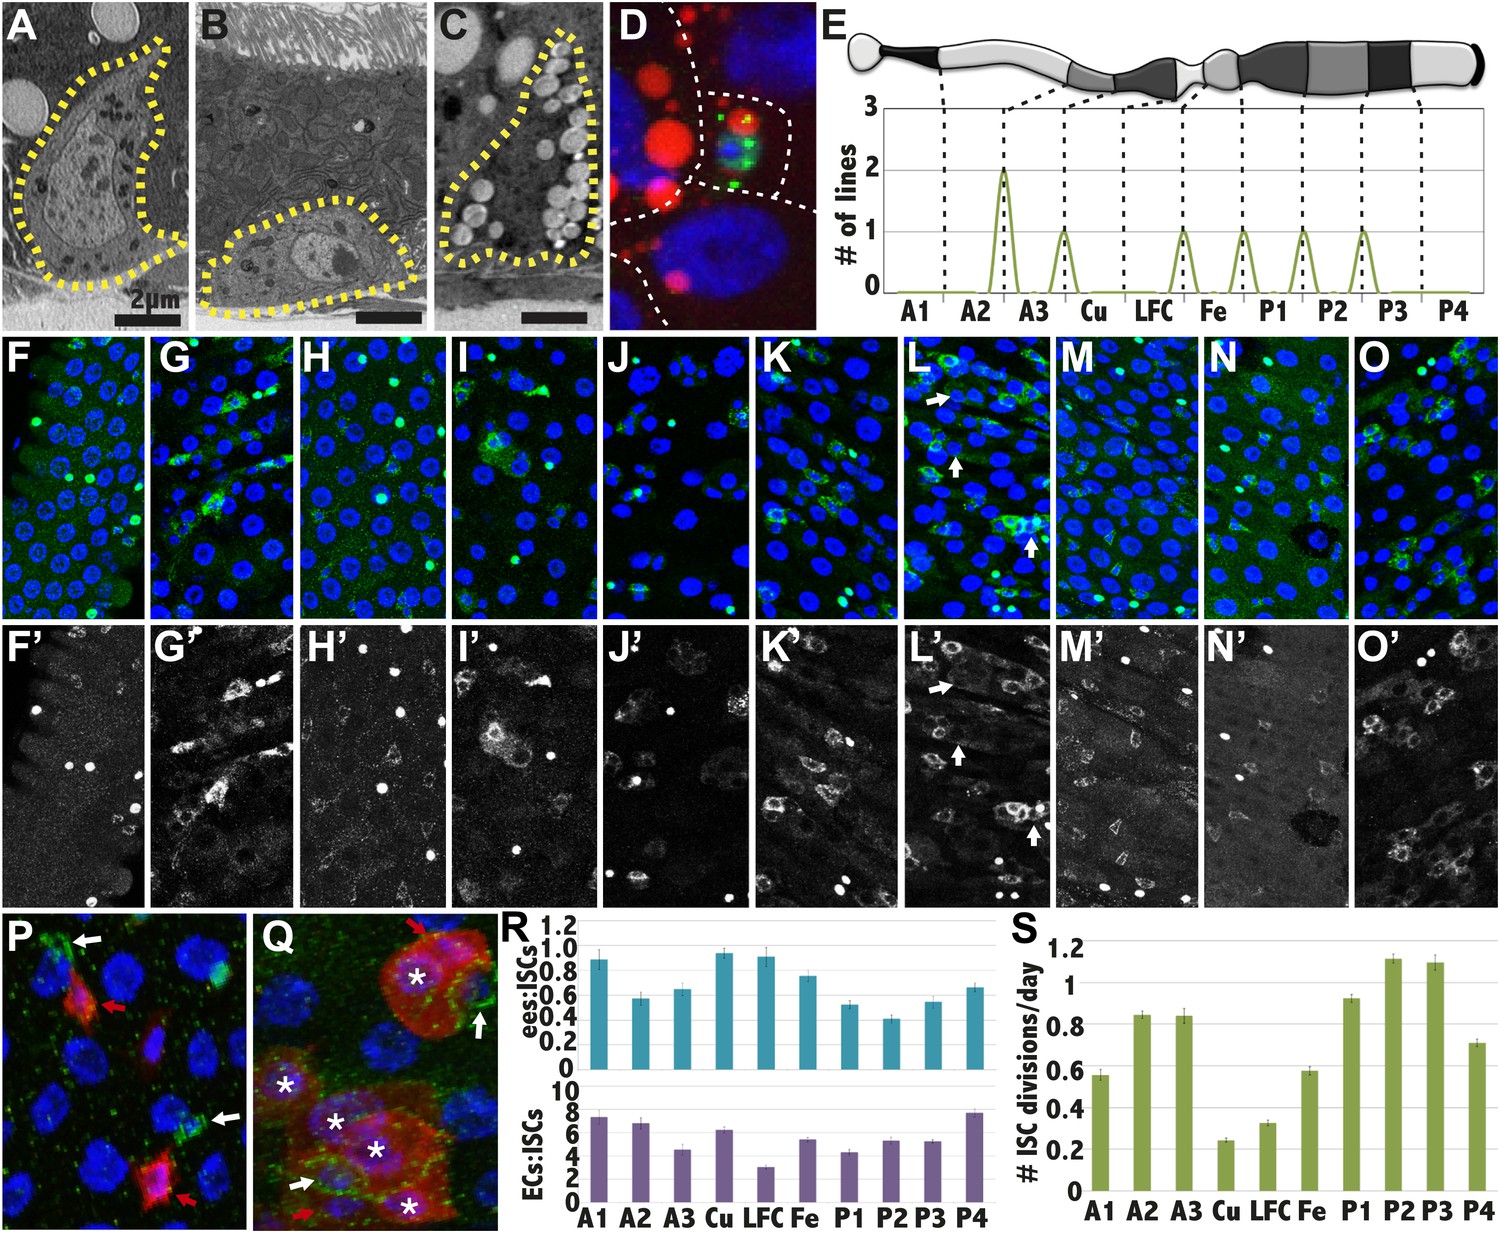
Stem cells also differ between subregions.
(A–C) Electron micrographs of an intestinal stem cell from regions: A3—representing typical stem cell morphology—(A), A1 showing its flatter shape (B), P1 showing the presence of lipid droplets. (D) Light micrograph of a P1 ISC stained with anti-Delta (green), Nile red (red) and DAPI (blue). (E) Expression boundaries in two GAL4 lines with ISCs expression. (F–O) Light micrograph of ISCs (green cytoplasm), ees (green nuclear), and enterocytes (polyploid DAPI nuclei) displaying regional cell ratios. (F) A1, (G) A2, (H) A3, (I) Cu, (J) LFC, (K) Fe, (L) P1, (M) P2, (N) P3, (O) P4, (P–Q) Light micrograph of midgut regions stained for Delta (green) and for Notch reception activity as assayed by GbeSu(H)-LacZ (red). White arrow: Dl+ ISC. Red arrow: GbeSu(H)-LacZ+ EB. White asterisk: GbeSu(H)-LacZ+ EC. (P) A2 region showing recently decided call pairs with Delta staining (green) confined to ISCs (white arrows) and Notch reporter activity (red) in EBs. (Q) P1 region stained as in (P), showing that Notch activation (red) and Delta expression (green) persists downstream from the EB into young ECs. (R) Ratio of enteroendocrine cells to ISCs (blue, top) and ratio of enterocytes to ISCs (purple, bottom) in different midgut regions. (S) ISC divisions per day in different midgut regions as determined from clonal analysis.
Figure 5 with 1 supplement
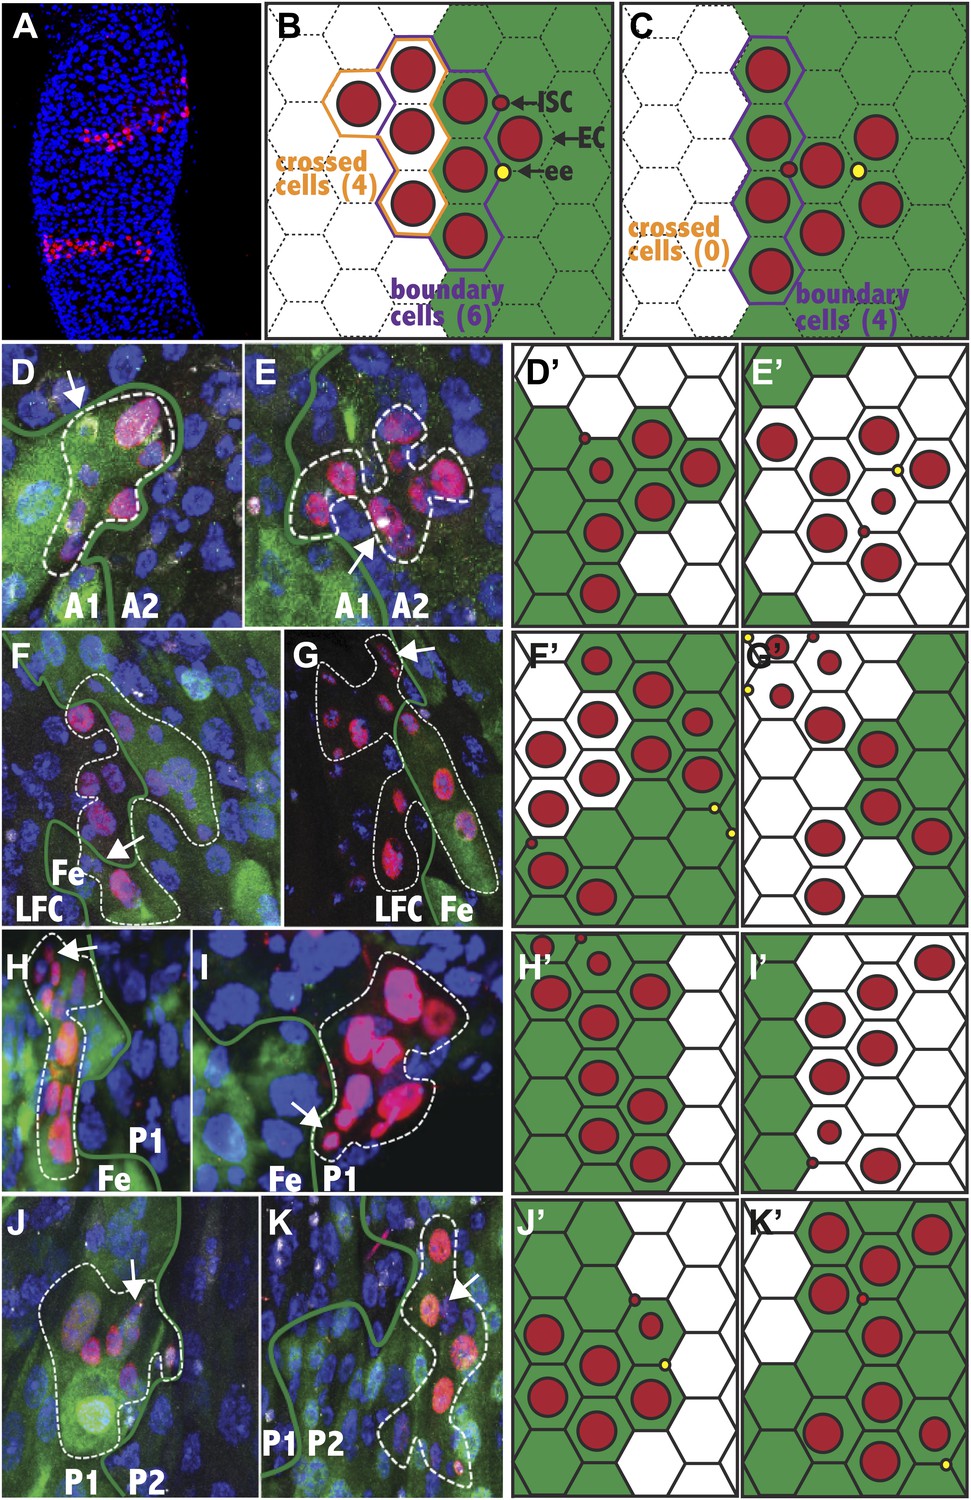
Stem cells are frequently compartmentalized.
(A) Two clones from a 25dphs gut showing elongation perpendicular to the a/p axis. (B–C) Expected stem cell clonal (red circles) distribution near a regional boundary (green line) in the absence (B) or presence (C) of stem cell regional autonomy. (B) Regionally multipotent stem cells are predicted to produce progeny on both sides of the boundary. (C) Regionally autonomous stem cells generate clones that do not cross the boundary. The diagrams show how boundary clones were scored: boundary cells (purple outline) crossed cells (orange outline), enterocyte (large red circle), stem cell (small red circle), enteroendocrine cell (open red circle). (D–K) Fluorescence micrographs showing ISC clones (red), region specific EC expression (green), ISCs (white cytoplasmic), ee’s (white nuclear), and DAPI (blue). Green lines: regional boundary determined by region-specific GFP expression (green). White dashed line: outline of clone. White arrow: Isc. (D and E) Green: 45D10-Gal4,UAS-GFP labels A1. (D) Clone originating and remaining in A1. (E) Clone originating and remaining in A2. (F and G) Green: 46B08-Gal4,UAS-GFP labels Fe. (F) Clone originating in the Fe region that crossed the LFC-Fe boundary. (G) Clone originating in the LFC region that crossed the LFC-Fe boundary. (H and I) Green: Ferritin-GFP labels Fe region. (H) Clone originating in and remaining in Fe. (I) Clone originating and remaining in P1. (J) Green: 46B08-Gal4,UAS-GFP labels P1. Clone originating and remaining in P1. (K) Green: 50A12-Gal4,UAS-GFP labels P2. Clone originating and remaining in P2. (D′–K′) Schematic diagrams of clones in respect to regional boundaries extrapolated from (D–K).
Figure 5—figure supplement 1
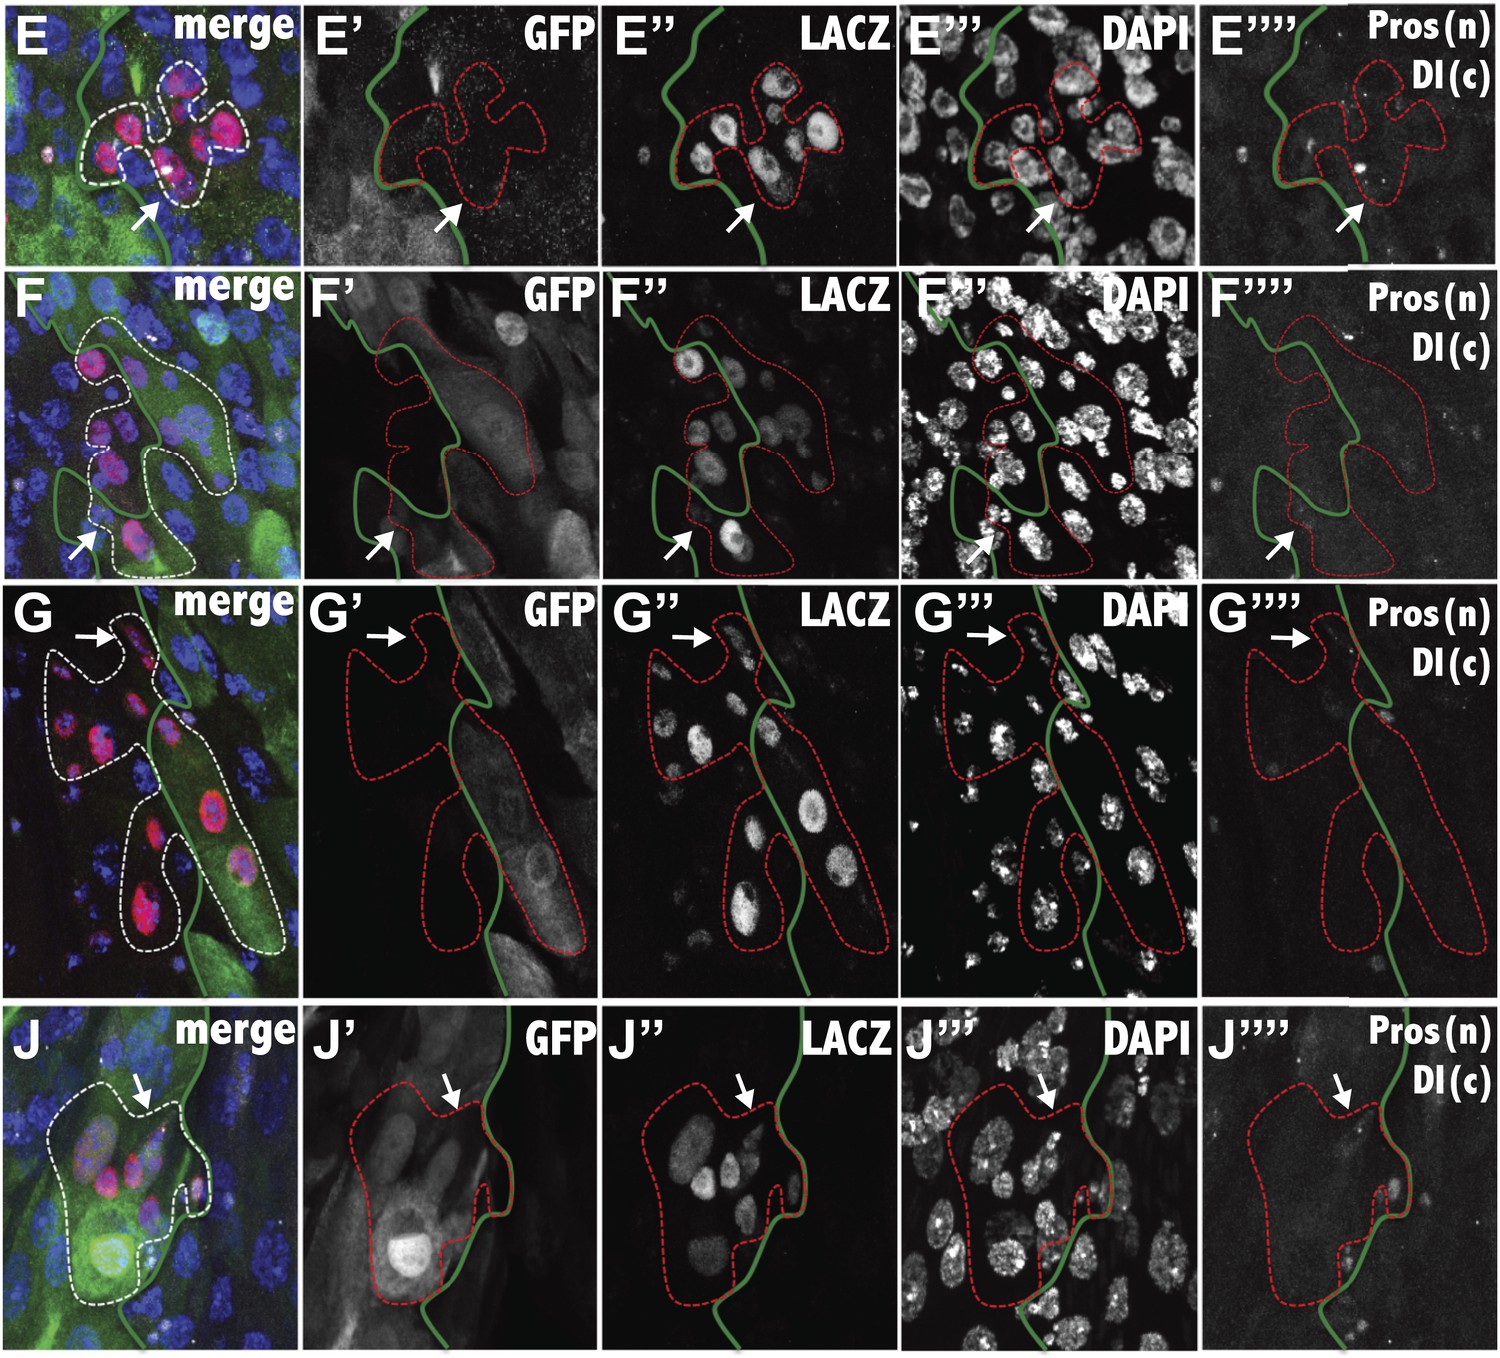
Analysis of boundary clones at single cell resolution.
The composite image, and the separated channels (GFP: green, LacZ: red, DAPI; blue, Prospero: white nuclear, Delta: white cytoplasmic) are shown for the fluorescence micrographs of Figure 5E–J. The white arrow indicates the ISC, white the green line indicates the region boundary, as determined from GFP staining.
Figure 6
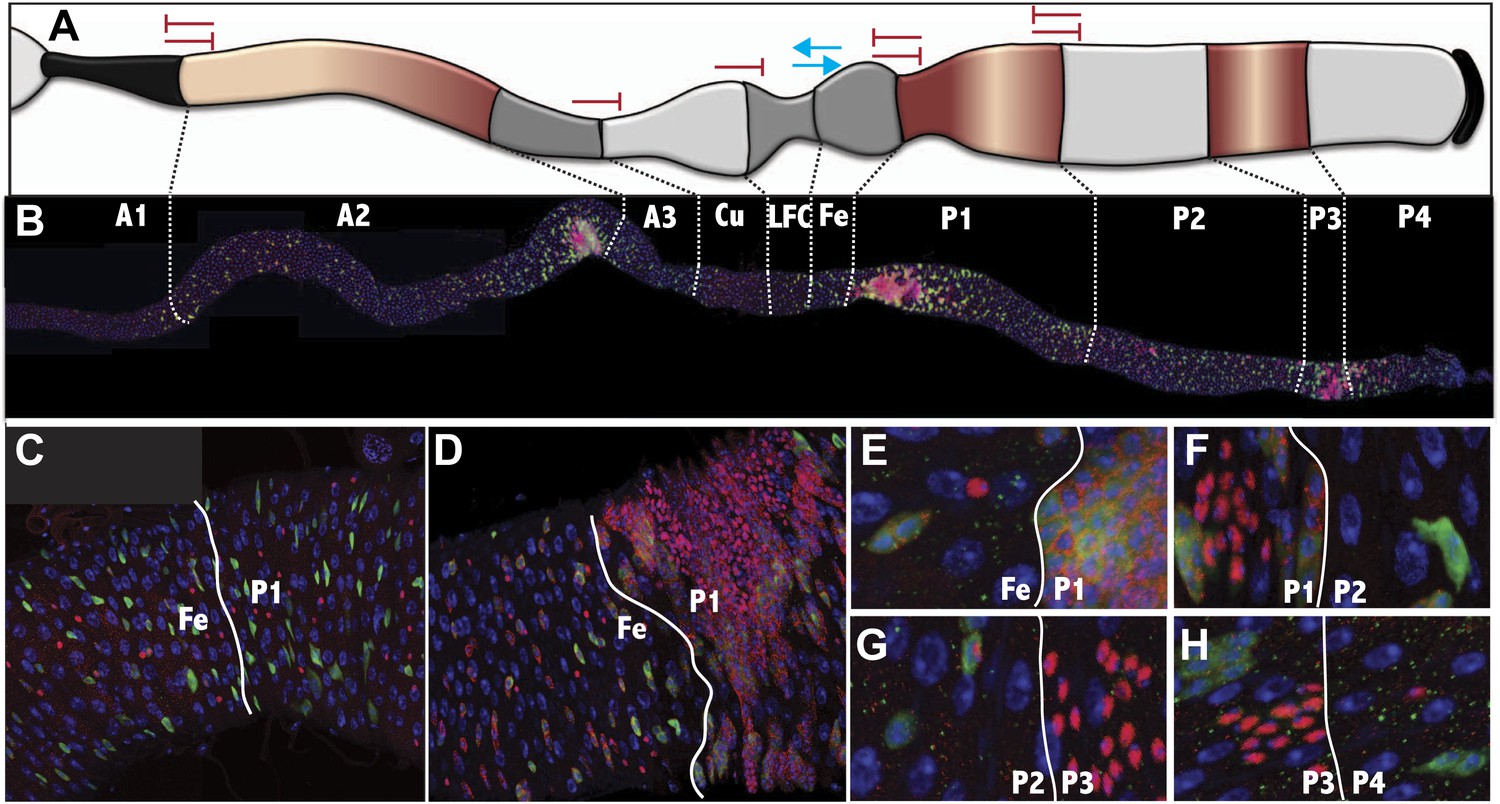
Midgut subregions differ in the production and movement of ISC/enteroendocrine tumor cells.
(A) Summary of barriers to cross-regional stem cell differentiation. The results of testing whether stem cell clones are able to span six of the midgut regional boundaries are indicated graphically. Blue arrows indicate that stem cell progeny could cross the indicated boundary in the direction shown, and differentiate into regionally appropriate cells. Red inhibitor symbols indicate that clonal crossing and differentiation from the indicated directions were not observed. Maroon shading shows the regions of the midgut in which enteroendocrine tumors arise preferentially when Notch signaling is inhibited. (B) Low magnification view of the entire midgut from an animal expressing UAS-NRNAi driven by esg-GAL4 showing accumulation of tumor cells in regions A2, P1 and P3. (Green: UAS-GFP expression, Red cytoplasmic: Delta expression in ISCs, Red nuclear: Prospero expression in ee’s, Blue: DAPI in all nuclei, White lines: regional boundaries). (C) Control expression in the Fe and P1 regions in the absence of UAS-NRNAi. (D and E) Higher magnification of a midgut as in (B) ee and ISC-like cells are evident in P1 but not in Fe; (F–H) tumor cells induced by esg-GAL4 driven expression of Notch[DN] appear to respect regional borders between P1/P2 (F), P2/P3 (G), and P3/P4 (H). Markers are as in (B–E).
Tables
Table 1
Clonal analysis of stem cell autonomy
| Region 1 (ISC) | Region 2 | Clones | Boundary clones | Clones crossed | Total cells | Boundary cells | Crossed cells | p value1 | Note |
|---|---|---|---|---|---|---|---|---|---|
| A1 | A2 | 52 | 2 | 0 | 21 | 10 | 0 | p<0.05 | |
| A2 | A1 | 250 | 4 | 0 | 34 | 12 | 0 | p<0.01 | |
| A3 | Cu | 86 | 3 | 0 | 29 | 14 | 0 | p<0.01 | |
| Cu | A3 | 0 | 0 | 0 | 0 | 0 | n.a. | ||
| Cu | LFC | 94 | 3 | 0 | 16 | 7 | 0 | p<0.05 | |
| LFC | Cu | 24 | 1 | 0 | 8 | 3 | 0 | n.s. | |
| LFC | Fe | 67 | 7 | 7 | 52 | 37 | 23 | ||
| Fe | LFC | 235 | 10 | 8 | 63 | 36 | 25 | ||
| Fe | P1 | 172 | 4 | 0 | 26 | 12 | 0 | p<0.01 | |
| P1 | Fe | 833 | 3 | 0 | 24 | 9 | 0 | p<0.01 | |
| P1 | P2 | 560 | 7 | 0 | 62 | 28 | 0 | p<0.01 | |
| P2 | P1 | 952 | 5 | 0 | 45 | 25 | 0 | p<0.01 | 2 dying |
Additional files
-
Supplementary file 1
(A) RNASeq analysis of Drosophila midgut. (B) Regional expression of midgut genes.
- https://doi.org/10.7554/eLife.00886.013
Download links
A two-part list of links to download the article, or parts of the article, in various formats.
Downloads (link to download the article as PDF)
Open citations (links to open the citations from this article in various online reference manager services)
Cite this article (links to download the citations from this article in formats compatible with various reference manager tools)
Physiological and stem cell compartmentalization within the Drosophila midgut
eLife 2:e00886.
https://doi.org/10.7554/eLife.00886


