A high-resolution morphological and ultrastructural map of anterior sensory cilia and glia in Caenorhabditis elegans
- Brandeis University, United States
- University of Utah School of Medicine, United States
Figures
Figure 1 with 2 supplements
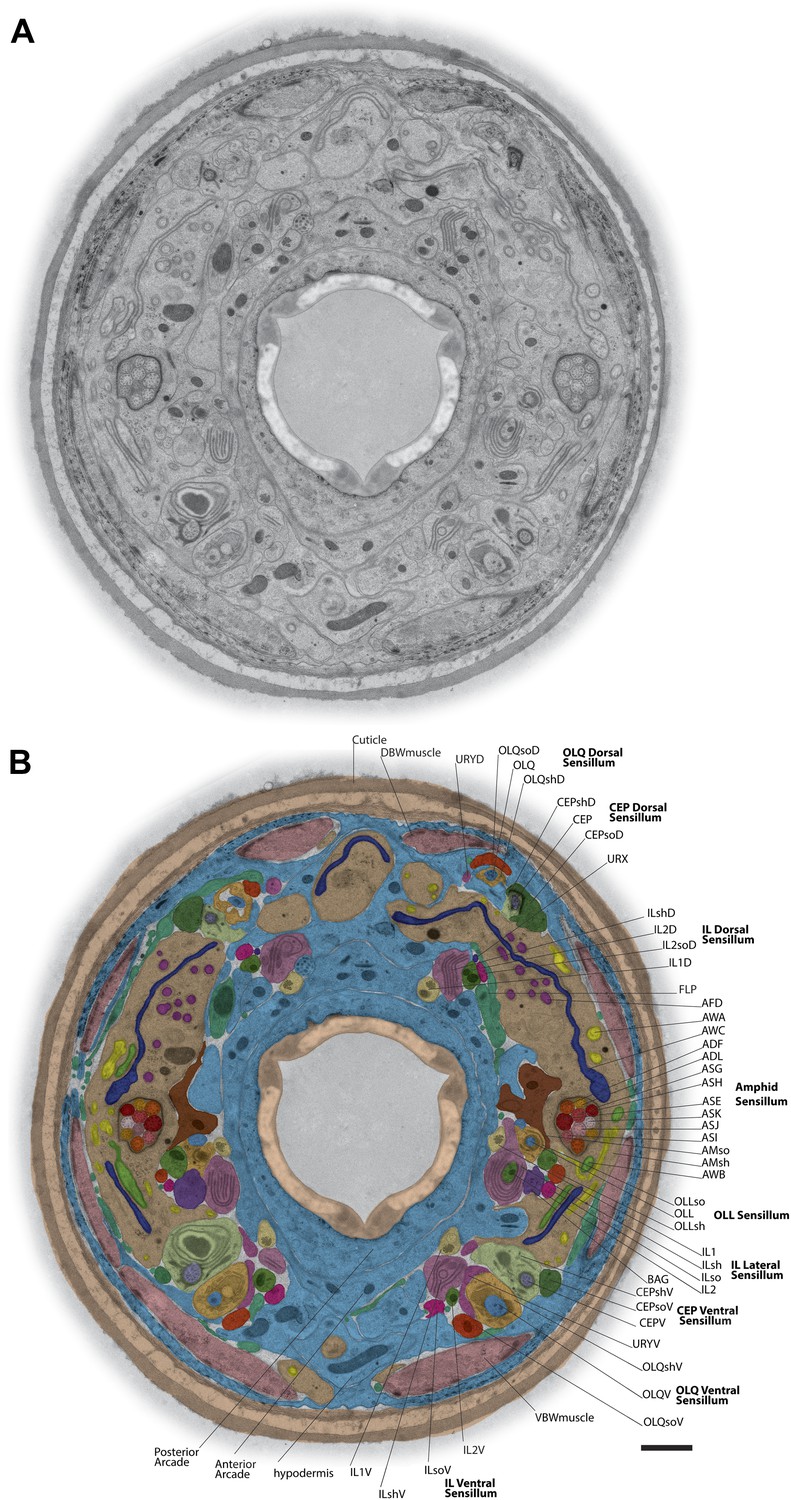
TEM cross-section with identified ciliary and glial endings.
(A) Example TEM cross-section of a high-pressure frozen/freeze-substituted (HPF-FS) C. elegans hermaphrodite animal (70-nm cross-section, 5.9 µm from the anterior nose tip). Edges surrounding the cuticle were feather-cropped. See Figure 1—figure supplement 1 for examples of preservation of subcellular structures in cilia, muscle, and junctions. (B) Endings of identified cells in the indicated bilateral sensilla within the cross-section TEM; only the right side of the animal is labeled. Cell endings are marked with a false-color overlay. Dorsal up, ventral down. Scale bar: 1 µm. See Figure 1—figure supplement 2 for additional cross-section views.
Figure 1—figure supplement 1
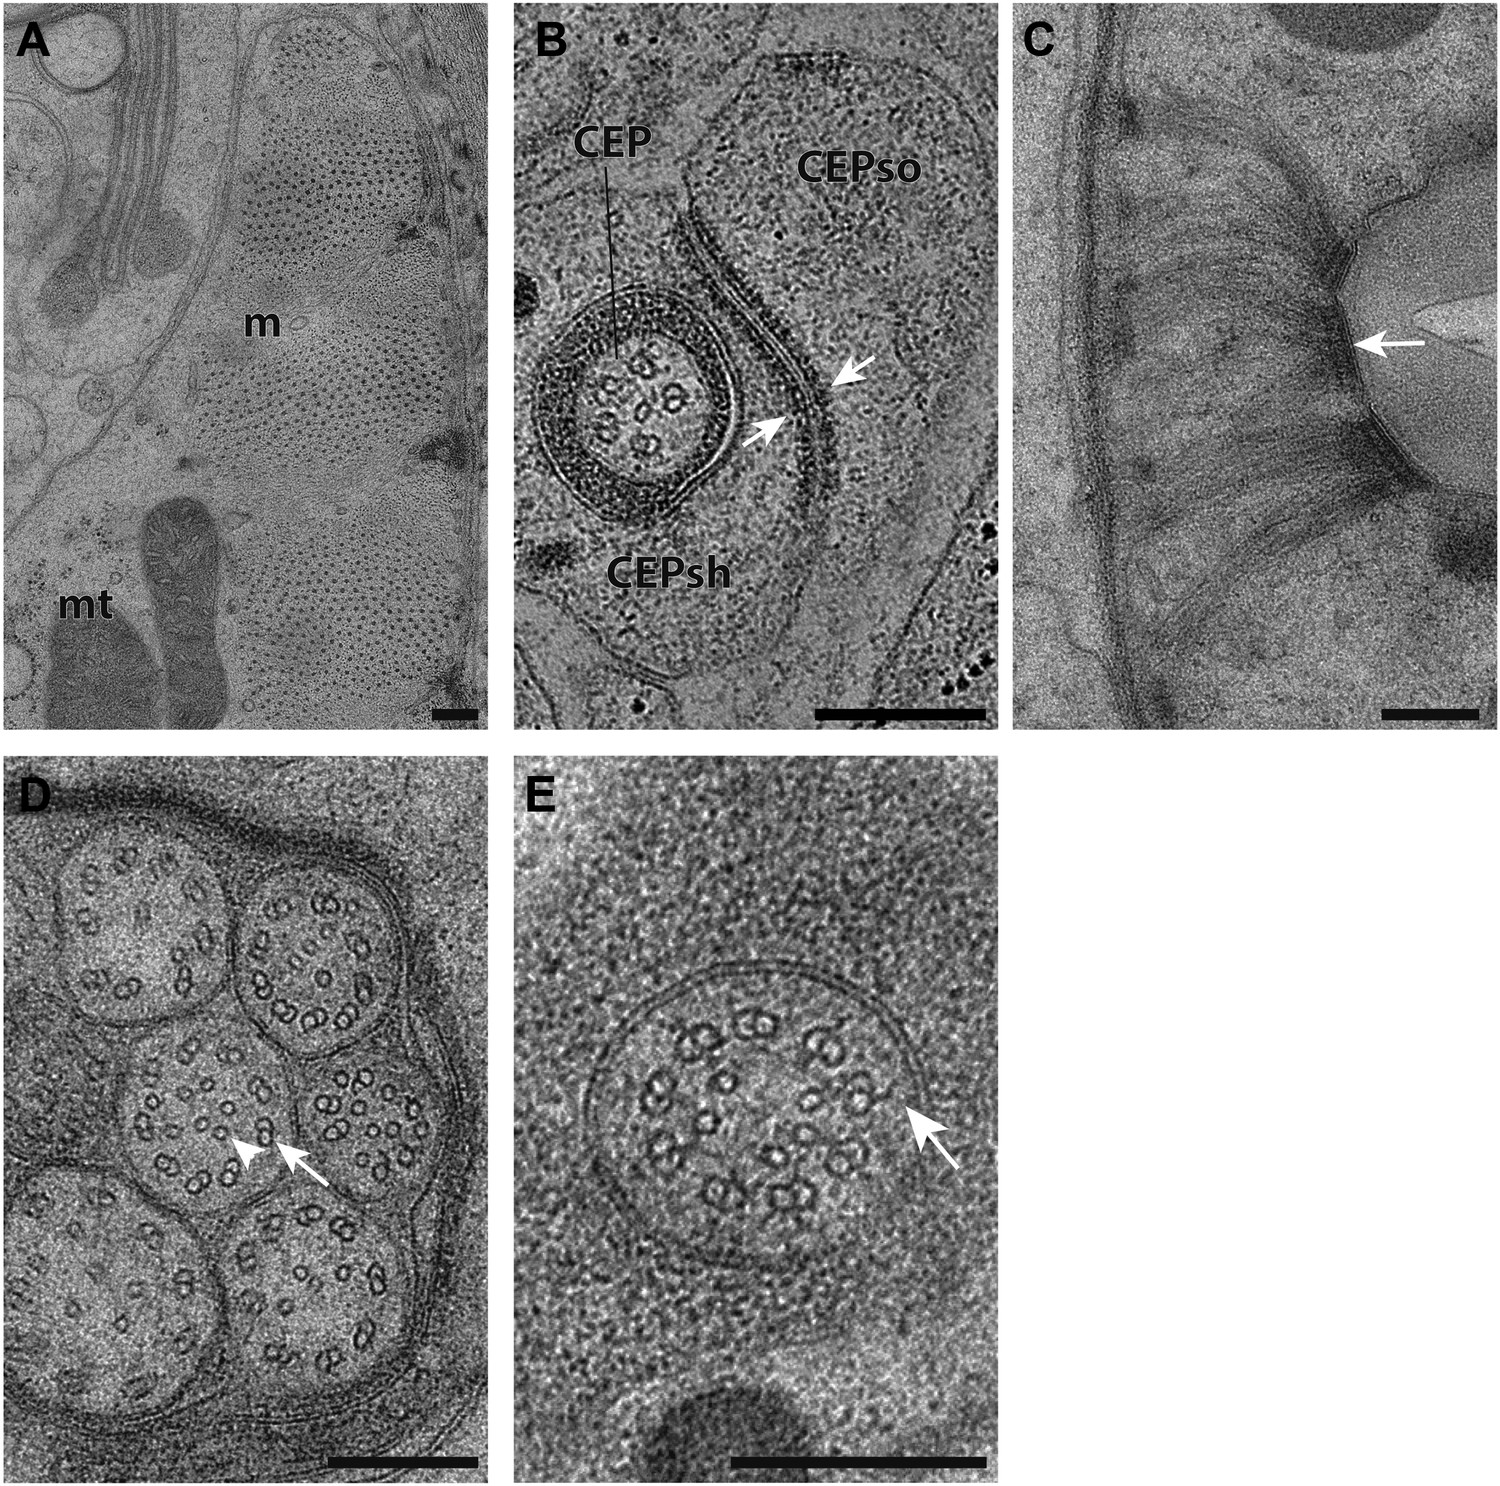
Ultrastructural features maintained by HPF-FS.
(A) TEM cross-section images of striated ventral body wall muscle (m) with myosin and actin filaments. Mitochondria (mt) with cristae are also shown. (B) Cross-section TEM image showing an apical junction (arrows) between glial cell processes associated with the CEP neuron (CEPso–socket; CEPsh–sheath). (C) Hemi-desmosome-like structures (arrow) found within pharyngeal epithelium. (D) Cross-section TEM image of amphid channel cilia showing bilayer plasma membranes, doublet MTs (arrow) and inner singlet MTs (arrowhead). (E) TZ showing Y-link (arrow). Scalebars: 200 nm.
Figure 1—figure supplement 2
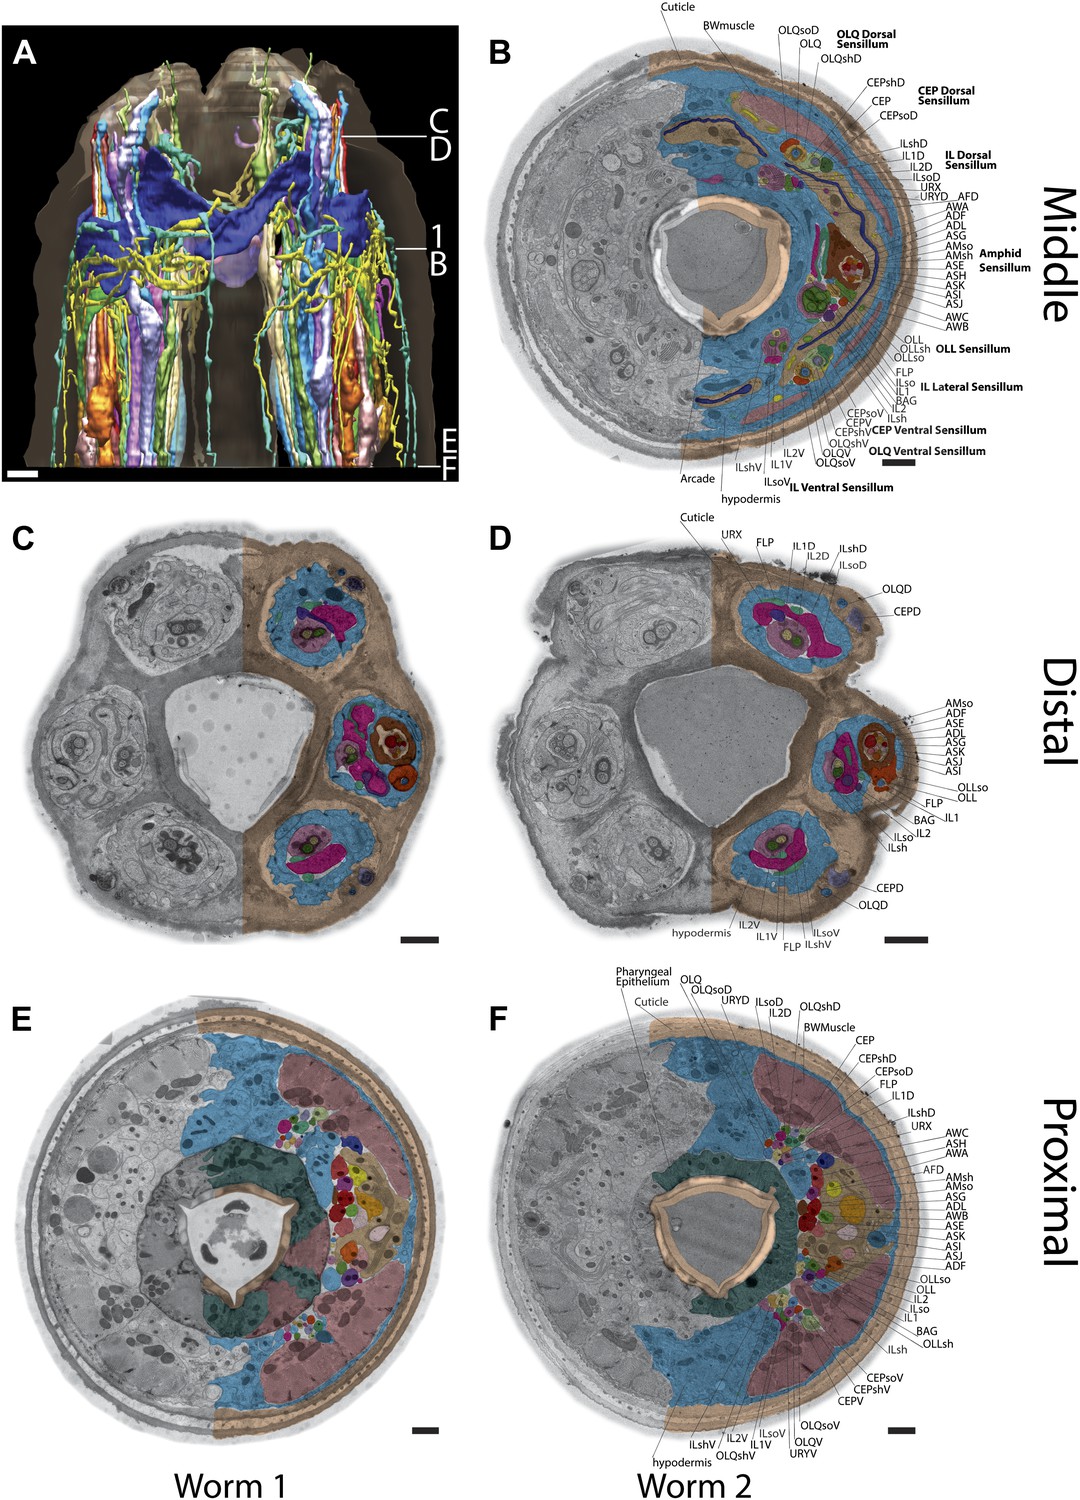
Example TEM cross-section images of the C. elegans nose.
(A) 3D reconstruction of the anterior endings. The location of sections B–F and the section shown in Figure 1 are indicated. (B–F) Anterior cross-section TEM images from two animals (B, D, F–animal 2; C, E–animal 1) showing invariant location of neuronal endings. Only the right side is labeled as in Figure 1. Scale bars: 1 µm.
Figure 2
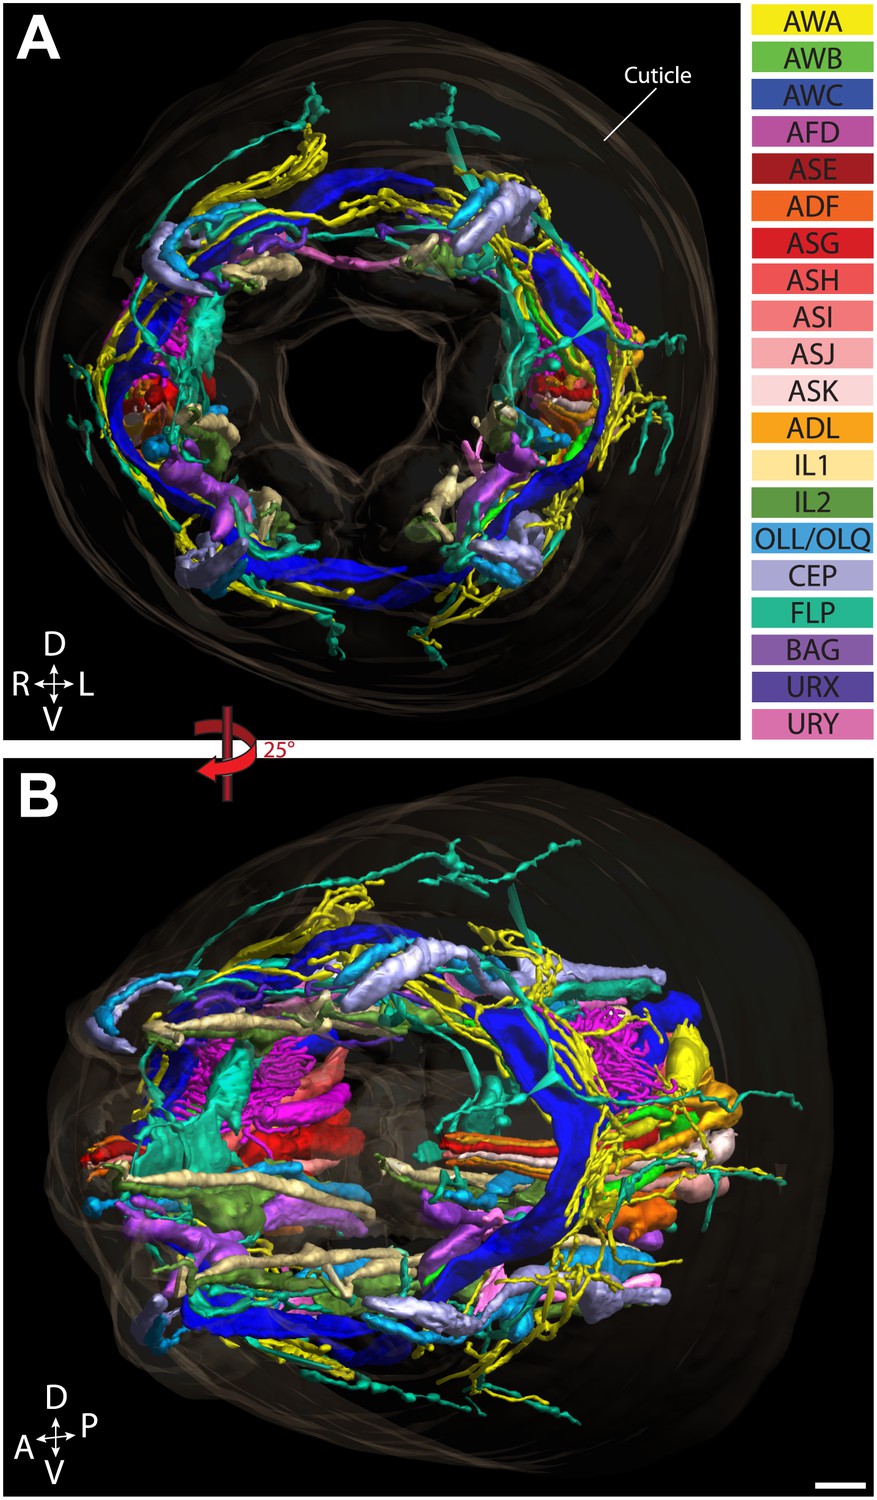
Graphical model of a high-resolution ssTEM 3D reconstruction of the anterior sensory endings.
3D reconstruction of the cilia and dendritic endings of anterior sensory neurons modeled from 166 thin serial sections (14 µm, starting at the nose). Front (A) and angled (B) profile views are shown. Cell projections are color-coded as indicated in upper right panel. D, dorsal; V, ventral; A, anterior; P, posterior. Scale bar: 1 µm.
Figure 3 with 2 supplements
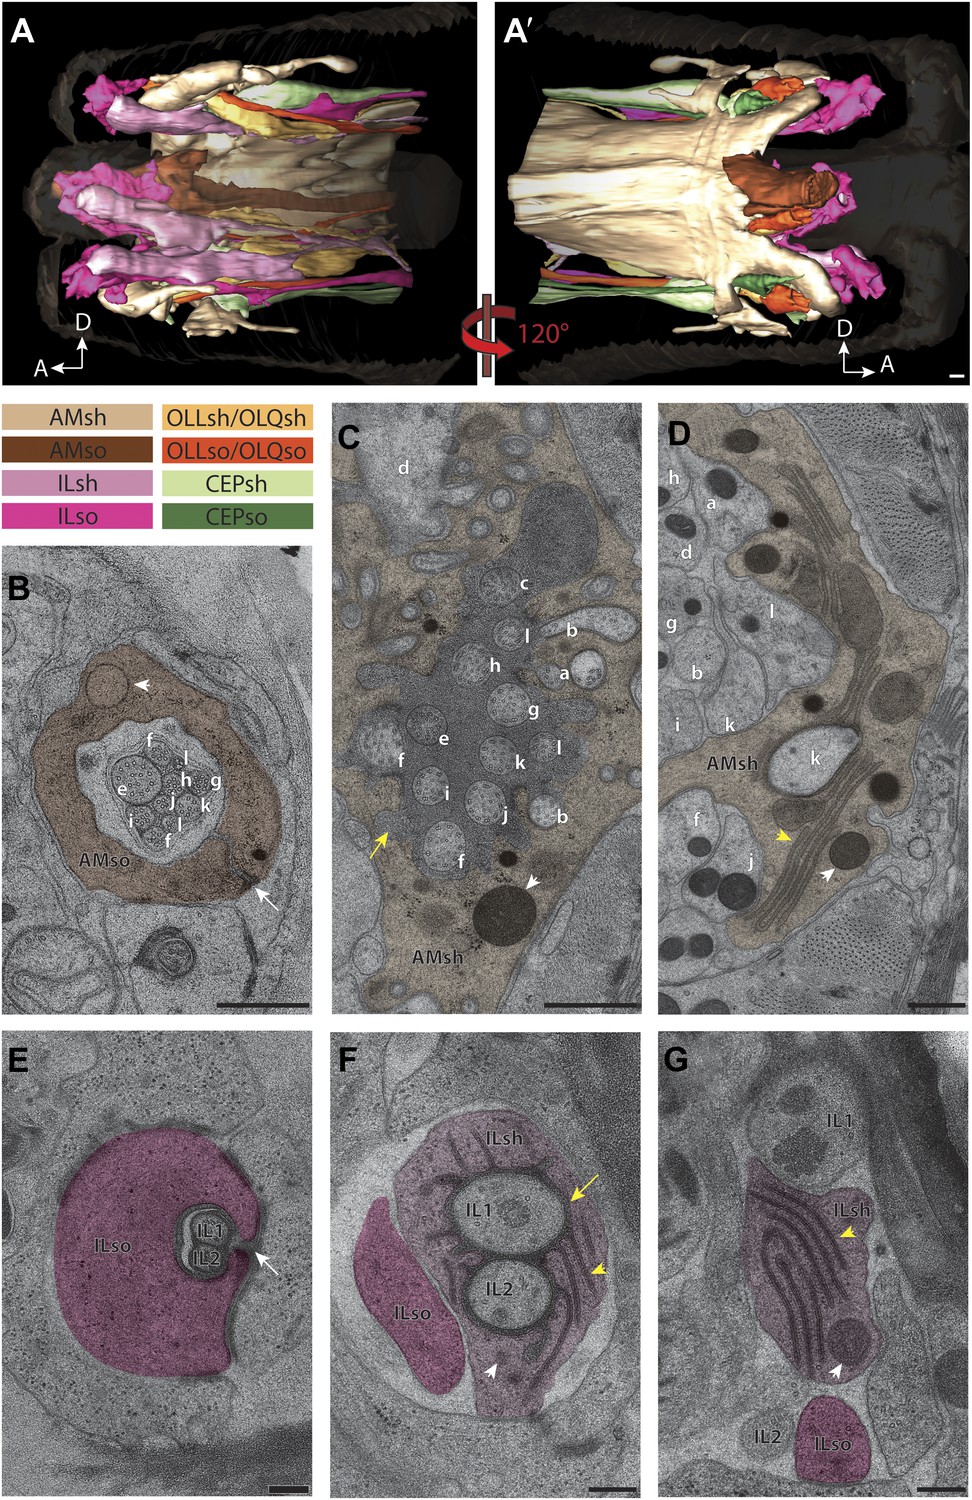
Two glial cell types are associated with each ciliated sensillum.
(A and A′) 3D reconstruction models of sheath (sh) and socket (so) glia for left side of the worm for amphid (AM), inner labial (IL), outer labial (OLL/OLQ), and cephalic (CEP) glia. Glial types are color coded as indicated. See Figure 3—figure supplement 1 for 3D models of glia associated with individual anterior sensilla. (B–D) Distal (B), middle (C) and region proximal to the amphid cilia TZ (D). Channel cilia of individual neurons are labeled with the last letter in their names. Arrow indicates the autocellular junction; arrowhead indicates vesicle present in the AMso process. (C) The AMsh glial cell process surrounds the proximal regions of amphid neuron cilia; the lumen contains electron-dense matrix (yellow arrow). White arrowhead indicates vesicle in the AMsh process. (D) The AMsh process contains extensive Golgi lamellae (yellow arrowhead) and secretory vesicles (white arrowhead). Cilia are labeled as above. (E–G) Distal (E), middle (F), and region proximal to the TZs (G) of the IL neurons. Autocellular junction in the ILso process is indicated by an arrow in (E). The lumen of the ILsh glial cell process surrounding the IL1/IL2 proximal cilia region also contains electron-dense matrix (yellow arrow in F), and a network of ER/Golgi (yellow arrowheads in F and G). Vesicles are indicated by white arrowheads. Scale bars: (A–D) 500 nm; (E–G) 200 nm. Figure 3—figure supplement 2 shows additional examples of CeAJs among glial and neuronal cells in individual sensilla.
Figure 3—figure supplement 1
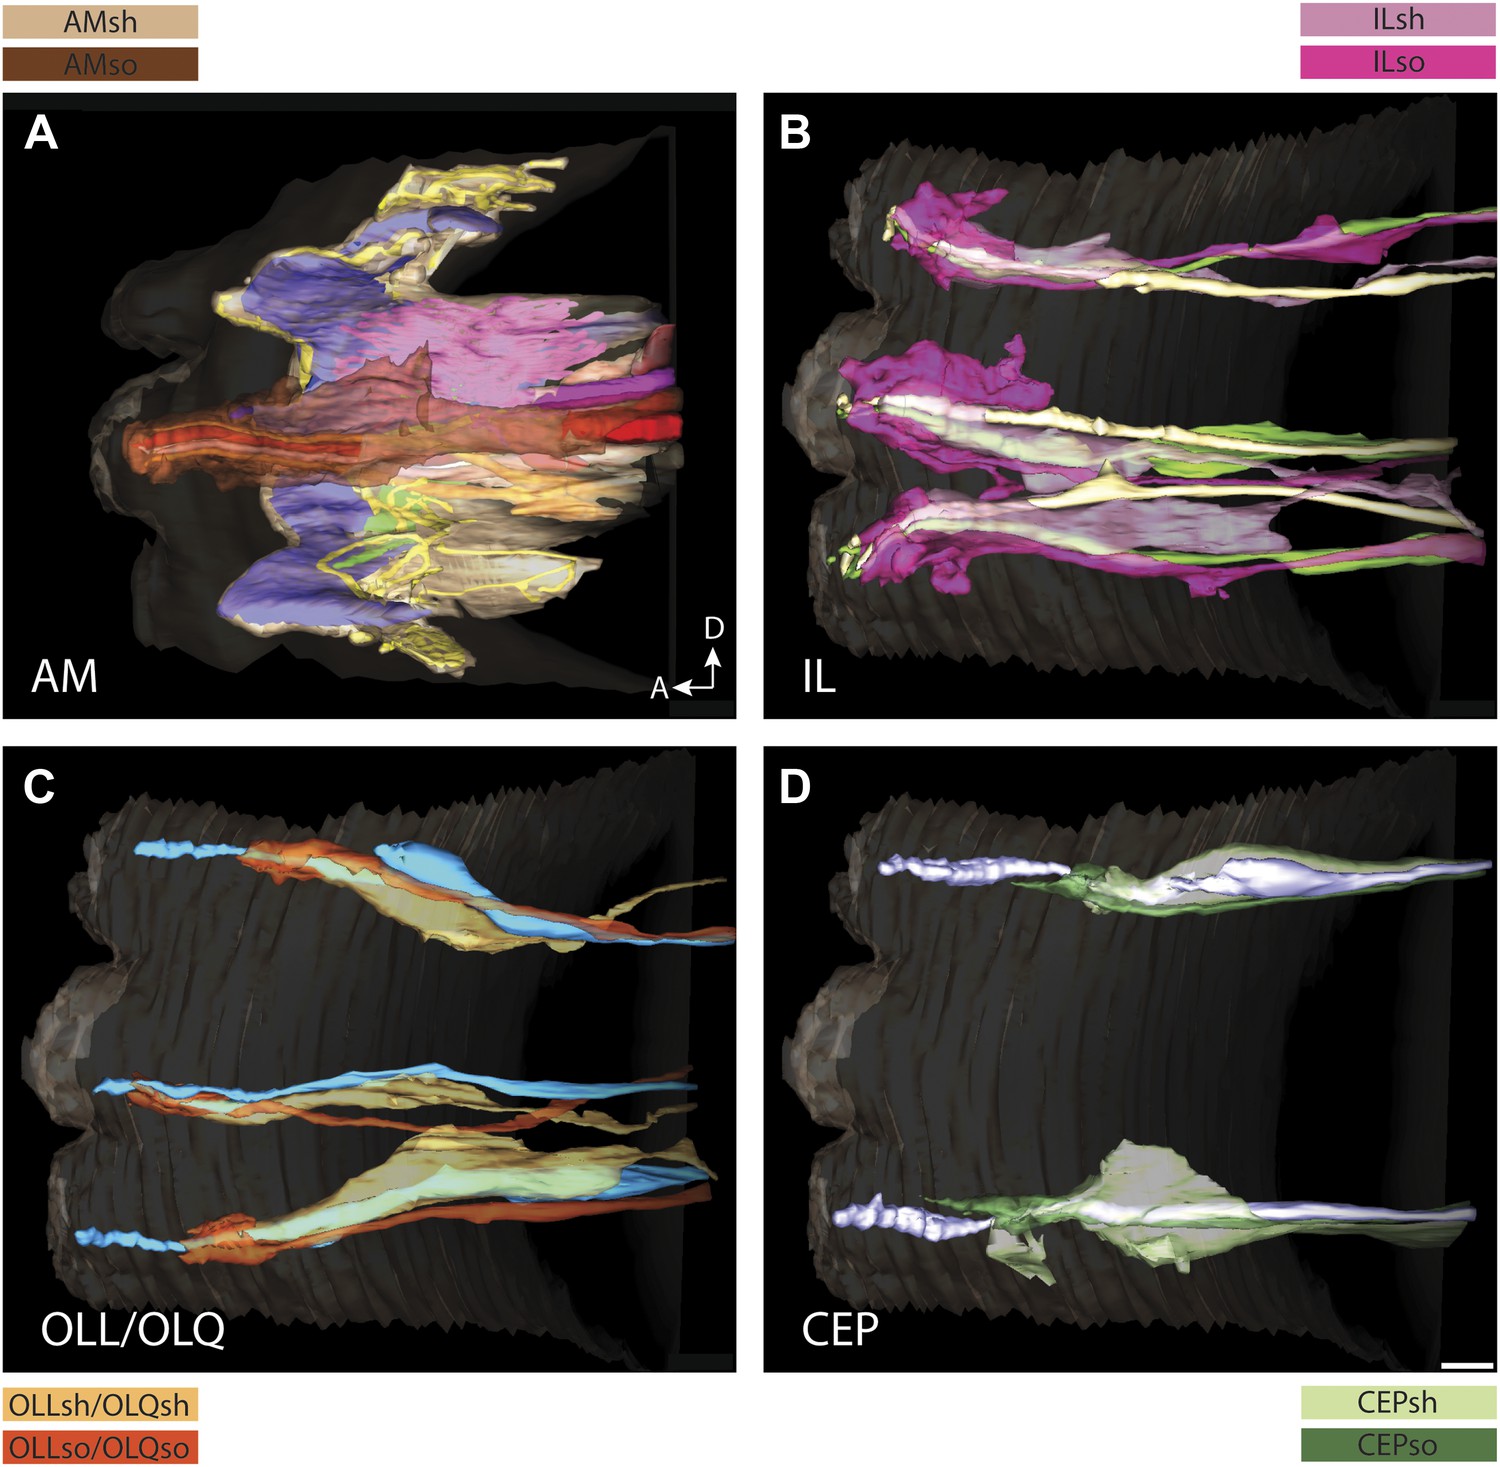
3D reconstruction models of glia associated with different sensilla.
(A) amphid, (B) IL, (C) OLL/OLQ, and (D) CEP sheath and socket glial endings associate closely with the cilia of their respective neurons. Glial subtypes are color coded. Scale bars: 1 µm.
Figure 3—figure supplement 2
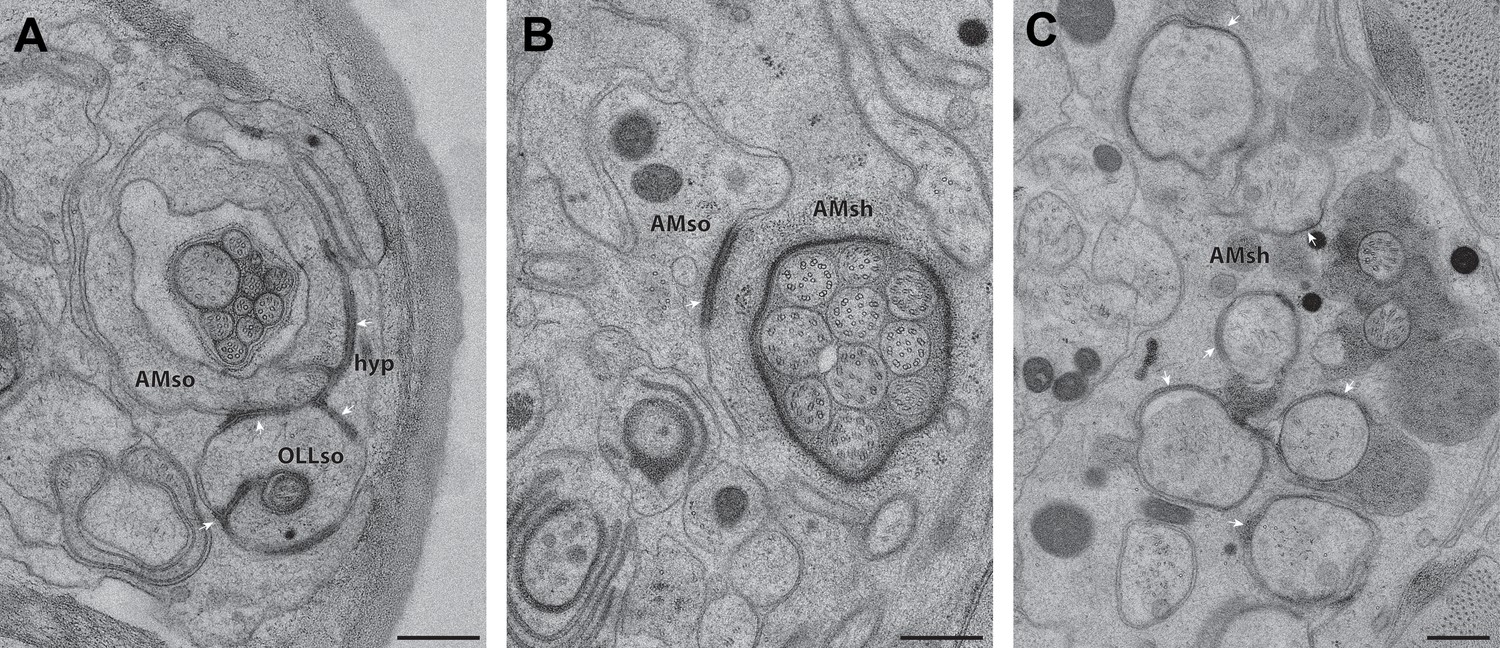
CeAJ connections between glial processes and surrounding cells.
ssTEM cross-section images showing CeAJ connections (arrowheads) between (A) AMso, OLLso and hypodermal (hyp) syncytial cells, (B) AMso and AMsh, and (C) AMsh and amphid neuron cilia at their PCMCs. Scale bars: 200 nm.
Figure 4 with 2 supplements
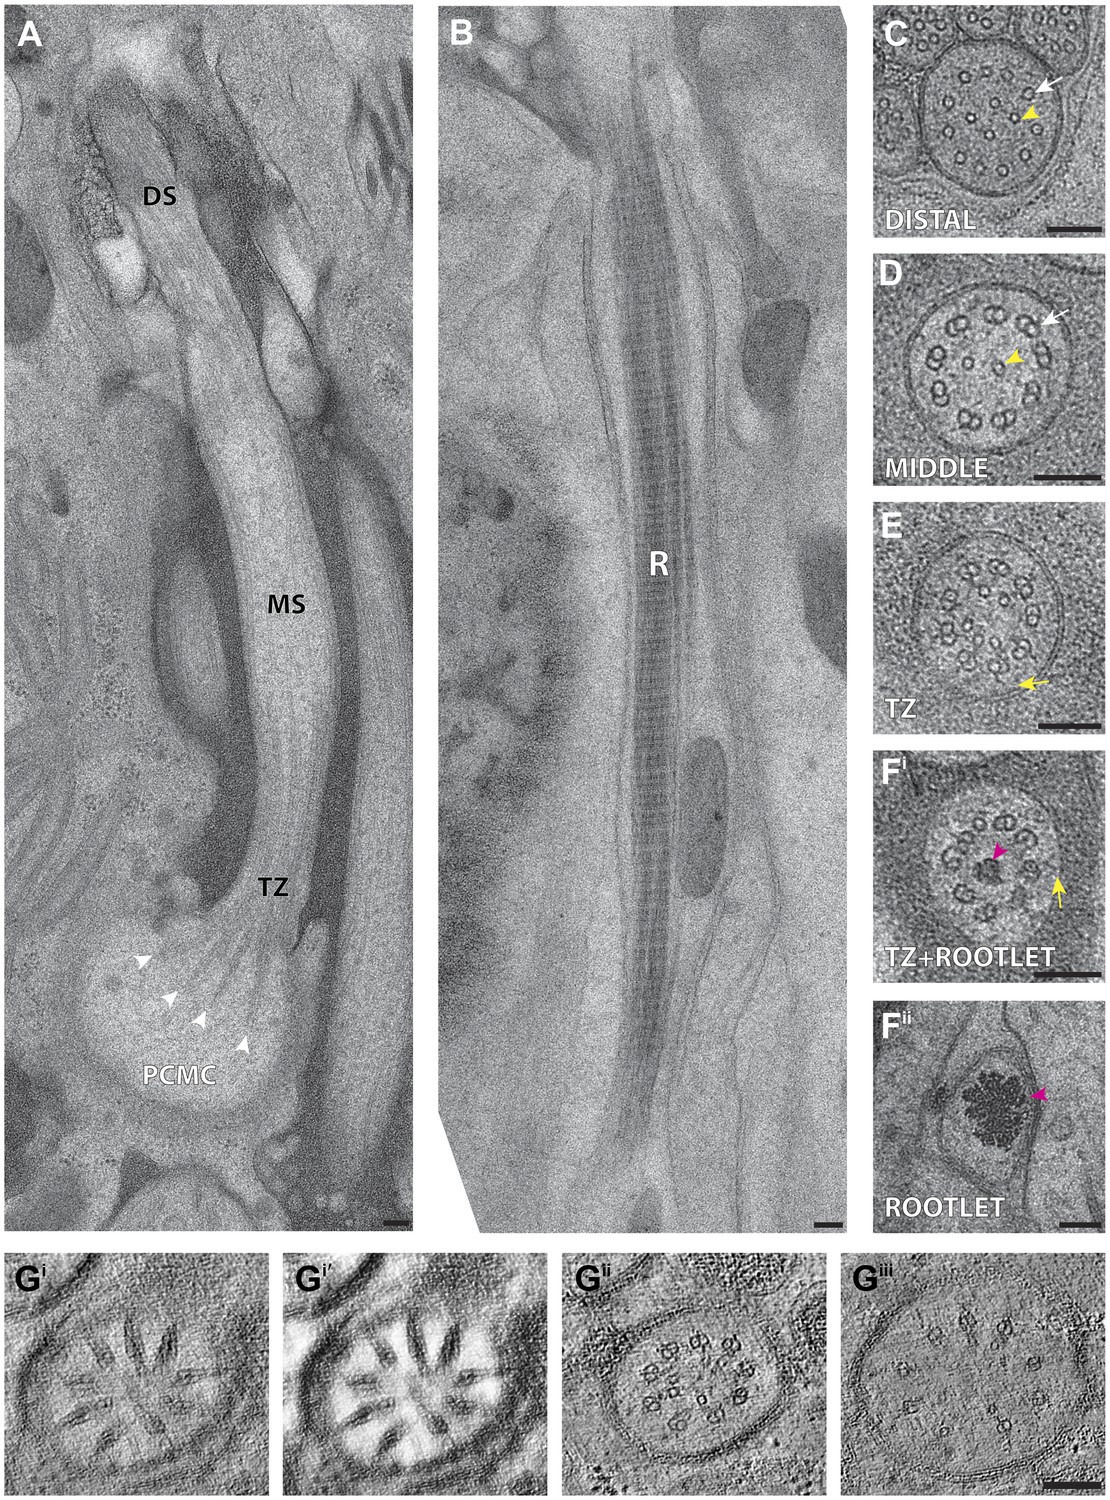
C. elegans ciliary ultrastructure.
(A) Longitudinal section of an amphid channel cilium (ASE), showing distal segment (DS), middle segment (MS), TZ and PCMC. Flaring of the MTs at the ciliary base is indicated by arrowheads. (B) Longitudinal section of a long striated rootlet (R) within the dendrite of an IL1 neuron. Cross-section TEMs of (C) distal segment (ASE cilium), (D) middle segment (ASI cilium), and (E) TZ (ASI cilium). (Fi) Cross-section TEM of the rootlet-like material within the IL1 TZ, and (Fii) the rootlet within the IL1 dendrite. White arrows indicate outer sMTs (C) or dMTs (D). Yellow arrows indicate Y-links. Yellow and pink arrowheads indicate isMTs and rootlet, respectively. (Gi–iii) ssET of flared dMTs in cross-section at the TZ of ASI cilium. (Gi) Binned serial section tomogram (140 slices) and (Gi′) filtered image simulating a thick plastic section of the proximal ASI TZ. Serial section tomogram (10 slices binned) of the (Gii) distal and (Giii) proximal part of the same TZ region as in (Gi) shows distinct dMTs and isMTs. Scale bars: 100 nm. See Figure 4—figure supplement 1 for additional views of MTs, apical rings and rootlet-like structures, and Figure 4—figure supplement 2 for further ET analyses of the flared dMTs at the ciliary base.
Figure 4—figure supplement 1
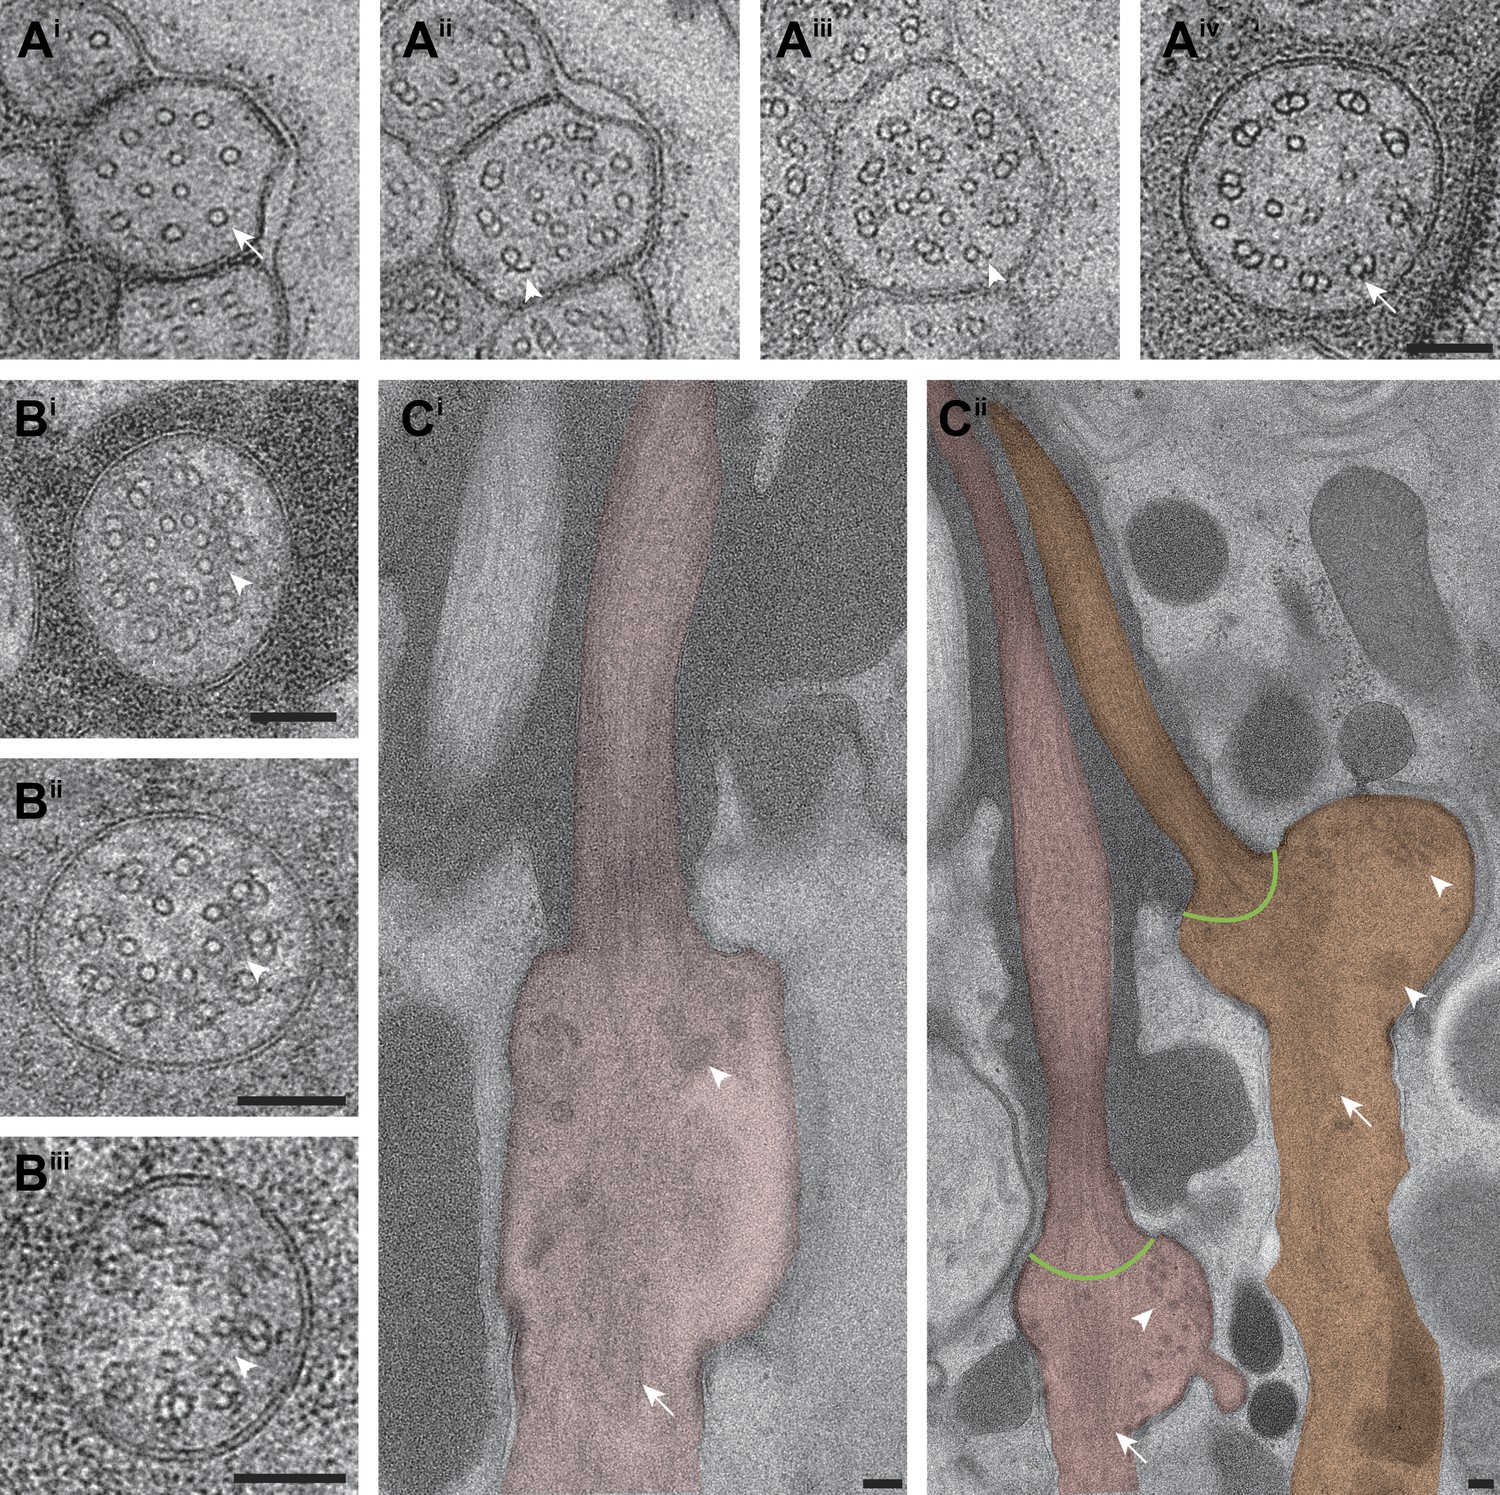
Subcellular features of amphid cilia.
(Ai–iv) Cross-section TEM series of an ASE cilium showing doublet-to-singlet MT transition from distal (Ai) to proximal (Aiv). B-tubule hooks are indicated by arrowheads; dsMTs and sMTs are indicated by arrows. (Bi–iii) ssTEM images showing different amphid channel cilium TZs (Bi—AWC; Bii—ADF; Biii—ASI); apical rings are indicated by arrowheads. (Ci–ii) Longitudinal-section TEM images of the base of amphid channel cilia (Ci) ASJ and (Cii) ASI (left) and ADF (right; only one cilium shown), showing vesicles (arrowheads) and rootlet-like structures (arrows). Green lines at the proximal ends of dMTs represent possible localization site of proteins thought to be localized to transition fibers in C. elegans. Scale bar: 100 nm.
Figure 4—figure supplement 2
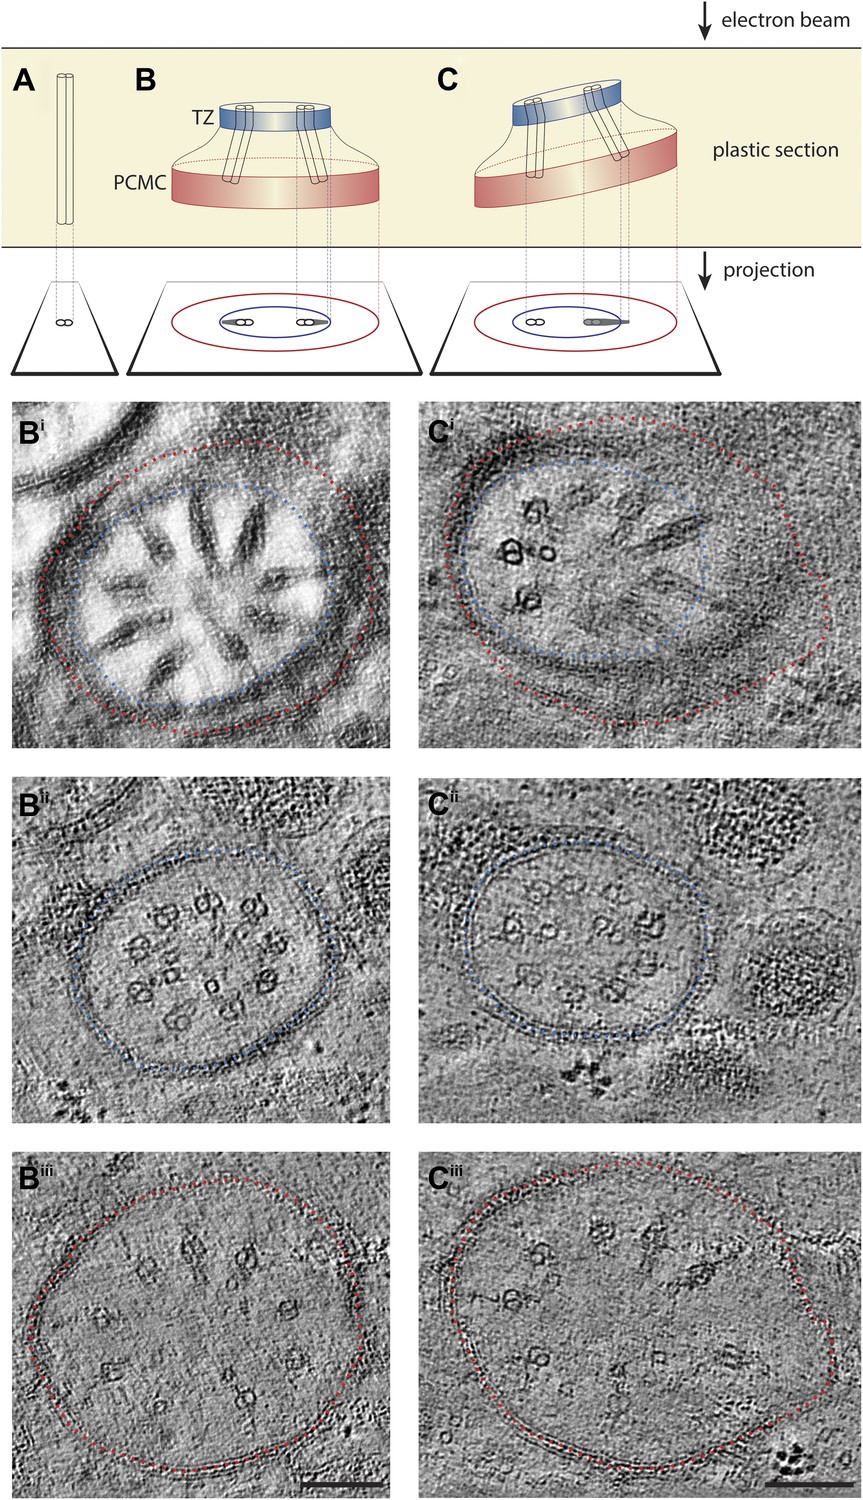
ET analyses of flared dMTs at the ciliary base.
(A–C) Diagrammatic representations of 2D TEM projections of ciliary structures through plastic sections and images of corresponding ET slices below. Only one or two dMTs are represented in the diagrams for simplicity. (A) A dMT in perfect cross-sectional orientation. (B) A 2D projection TEM image of a plastic section with the cilium base in cross-sectional orientation would show the proximal flared dMTs as wedge-shaped electron-dense structures. This 2D projection image also often displays both a smaller diameter membrane from the TZ (blue circle) and a larger diameter membrane from the PCMC (red circle). In such projections (diagrammatic in B, and the simulated projection image Bi corresponding to Figure 4Gi′ through a ∼140-nm thick serial section electron tomogram), the flared dMTs appear to radiate outwards contacting the inner membrane (blue). However, our 3D ssET data clearly reveal that this is due to the 2D projection, since the inner membrane (blue) corresponds to the membrane in the TZ region, whereas the peripheral tips of the wedge-shaped dMT projections correspond with the PCMC region (membrane indicated in red) and are in reality distant from the PCMC membrane in 3D. This can be observed more clearly in the distal and proximal 10-nm thick ET slices (Bii and Biii, corresponding to Figure 4Gii,Giii) of the same ciliary base region shown in Bi. Note that the diameter of the axoneme in Biii is larger than that in Bii due to the dMT flaring. (C) A tilted 2D projection view shown diagrammatically (C) and simulated (Ci) displays both doublets (dMTs viewed in cross-section) and and wedge-shaped structures (dMTs viewed obliquely). Distal (Cii) and proximal (Ciii) ET slices of the same region shown in Ci further again clearly reveal dMTs that remain distant from the membrane and flare proximally (Ciii). Scale bar: 100 nm.
Figure 5
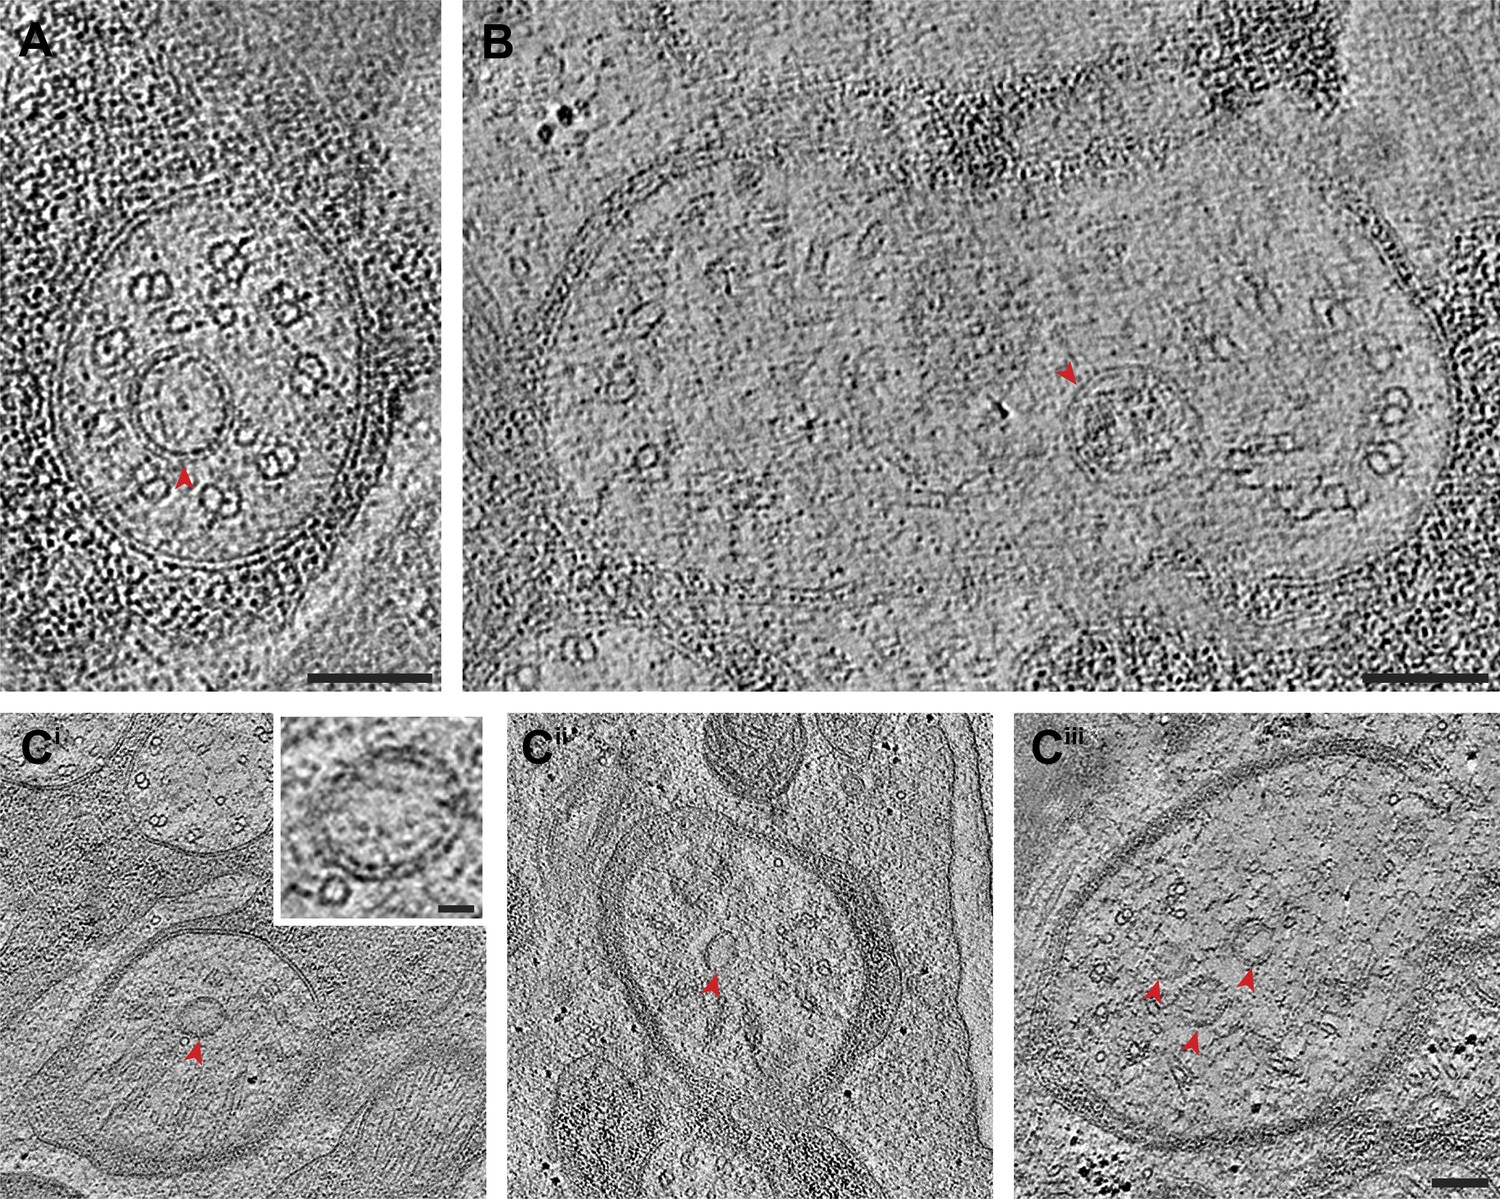
Vesicles at the ciliary base and in the TZ.
Cross-section ET slices showing vesicles (red arrowheads) present (A) at the cylindrical region of the TZ in the ASI amphid neuron cilium, (B) between the axoneme and ciliary membrane of one of the two AWB amphid neuron cilia, and (C) between the flared dMTs at the base of ASG (Ci), ASJ (Cii), and ASE (Ciii) amphid neuron cilia. The bilayer membrane of the vesicles is visible in most examples. Scale bars: (A–C) 100 nm (Ci inset) 20 nm.
Figure 6
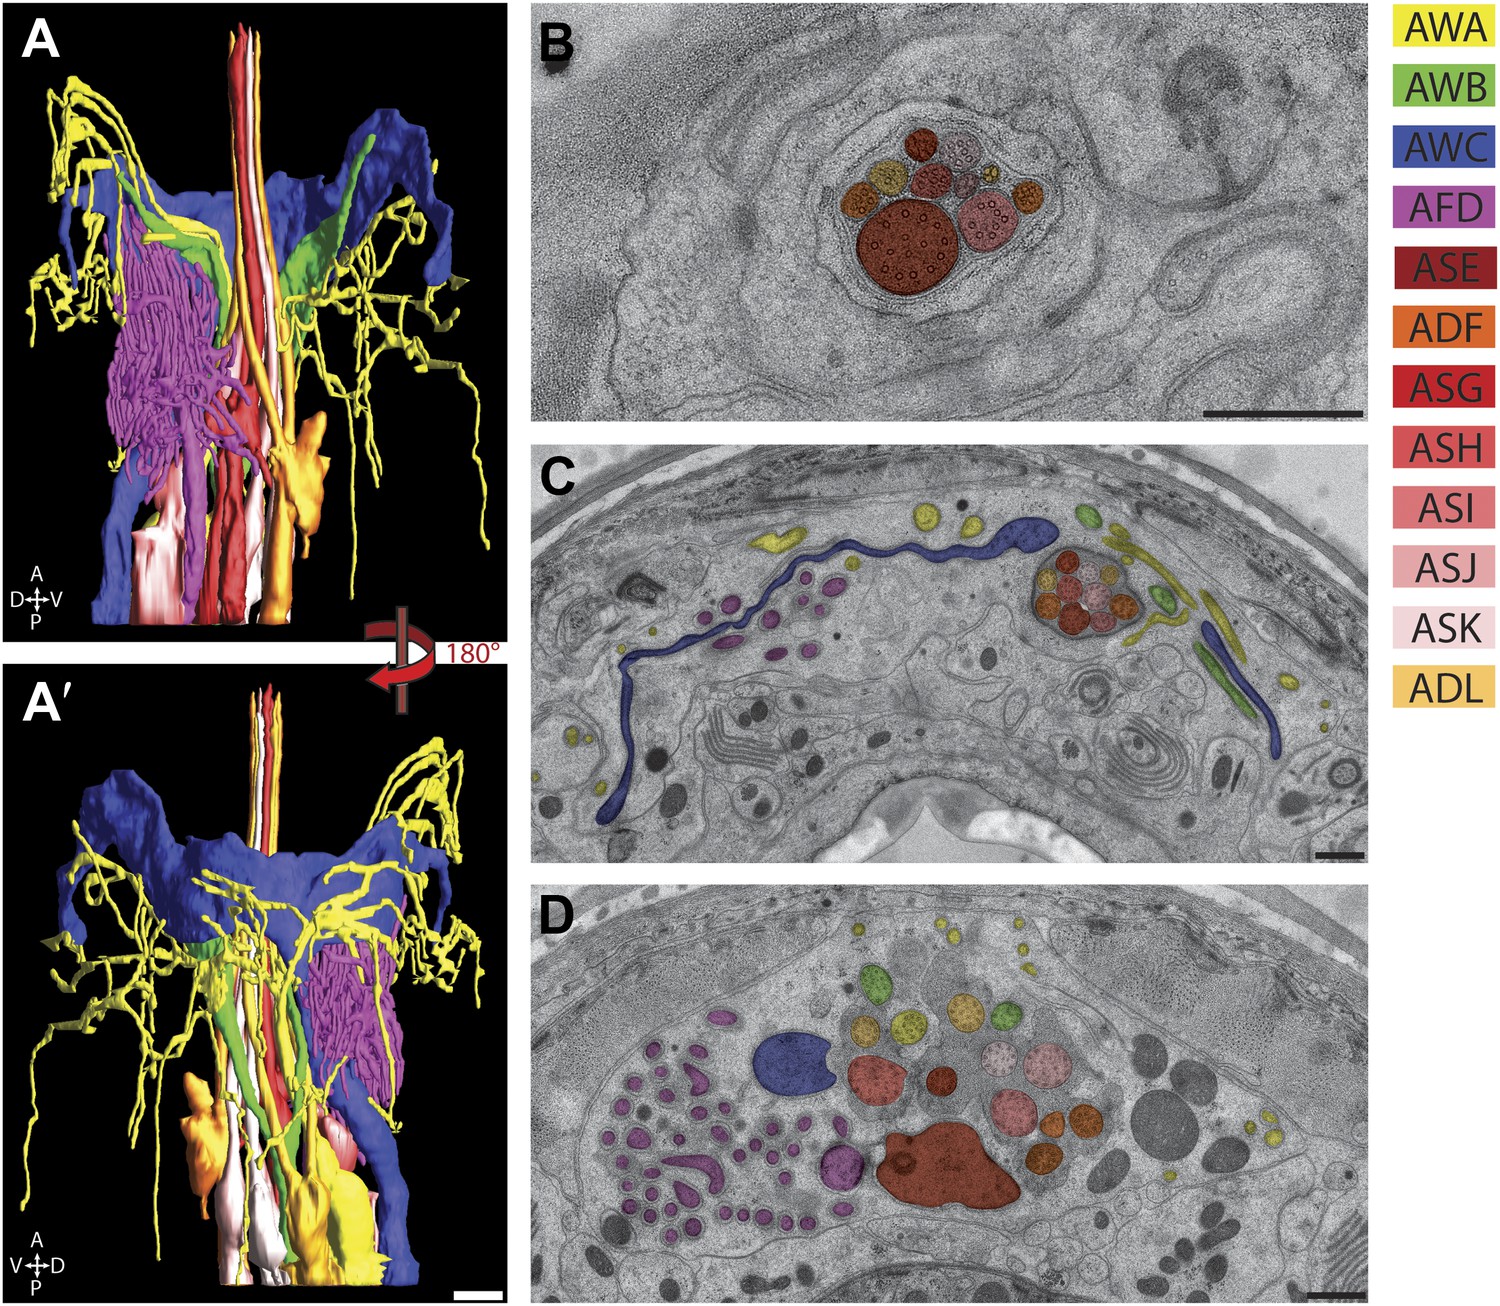
The amphid sensillum.
(A and A′) 3D graphical model of the reconstructed amphid sensilla on the right side indicating the endings of twelve sensory neurons. Scale bar: 1 µm. (B) Distal, (C) middle, and (D) proximal TEM cross-sections of an amphid sensillum. Endings of individual amphid neurons are color coded as indicated. Scale bars: 500 nm.
Figure 7
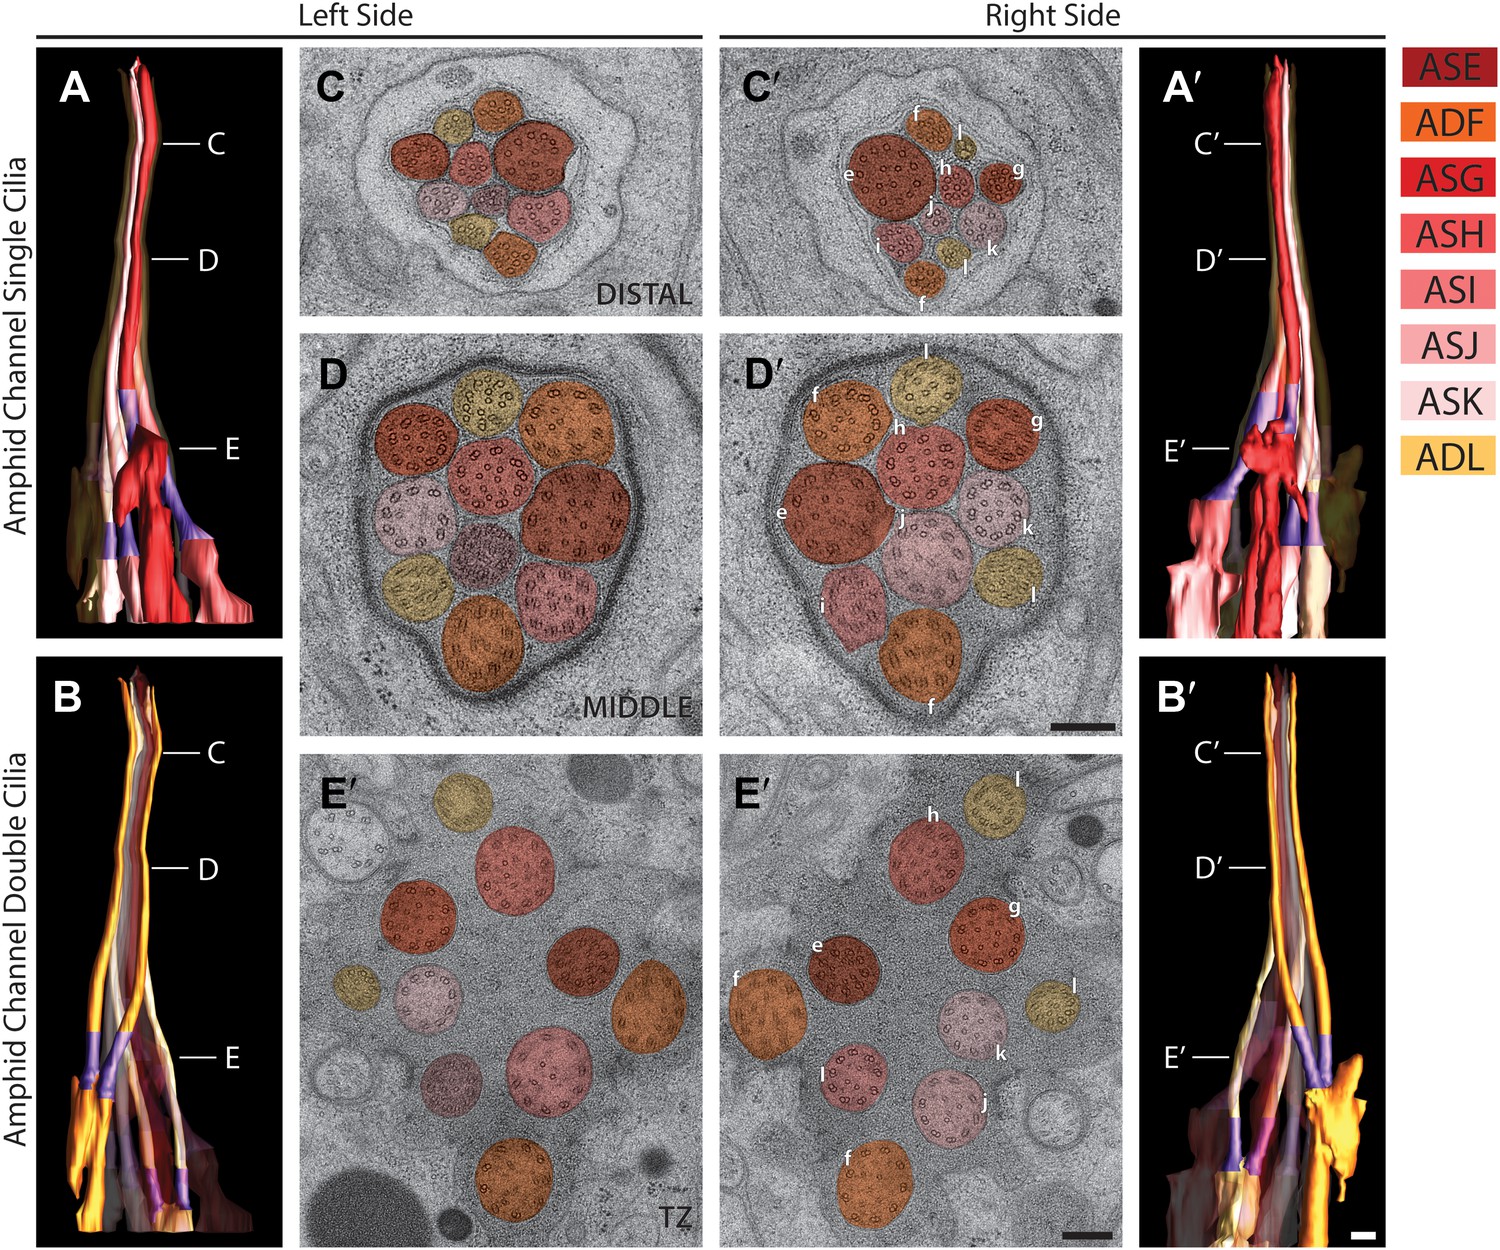
Morphology and ultrastructure of amphid channel cilia.
Reconstructed 3D models of amphid channel cilia containing single (A and A′) or double (B and B′) rods on the left (A and B) and right (A′ and B′) sides. Labels indicate approximate positions of cross-sections shown in C–E′. TZs (purple) are indicated. Scale bar: 500 nm. (C–E′) Cross-section TEM images of amphid channel at the level of distal segment (C and C′), middle segment (D and D′), and TZ (E and E′). Individual cilia are identified on the right only by the last letter in their names. Scale bars: 200 nm. See Figure 3—figure supplement 2C for additional views of the TZs and rootlet-like structures at the base of amphid neuron cilia.
Figure 8 with 1 supplement
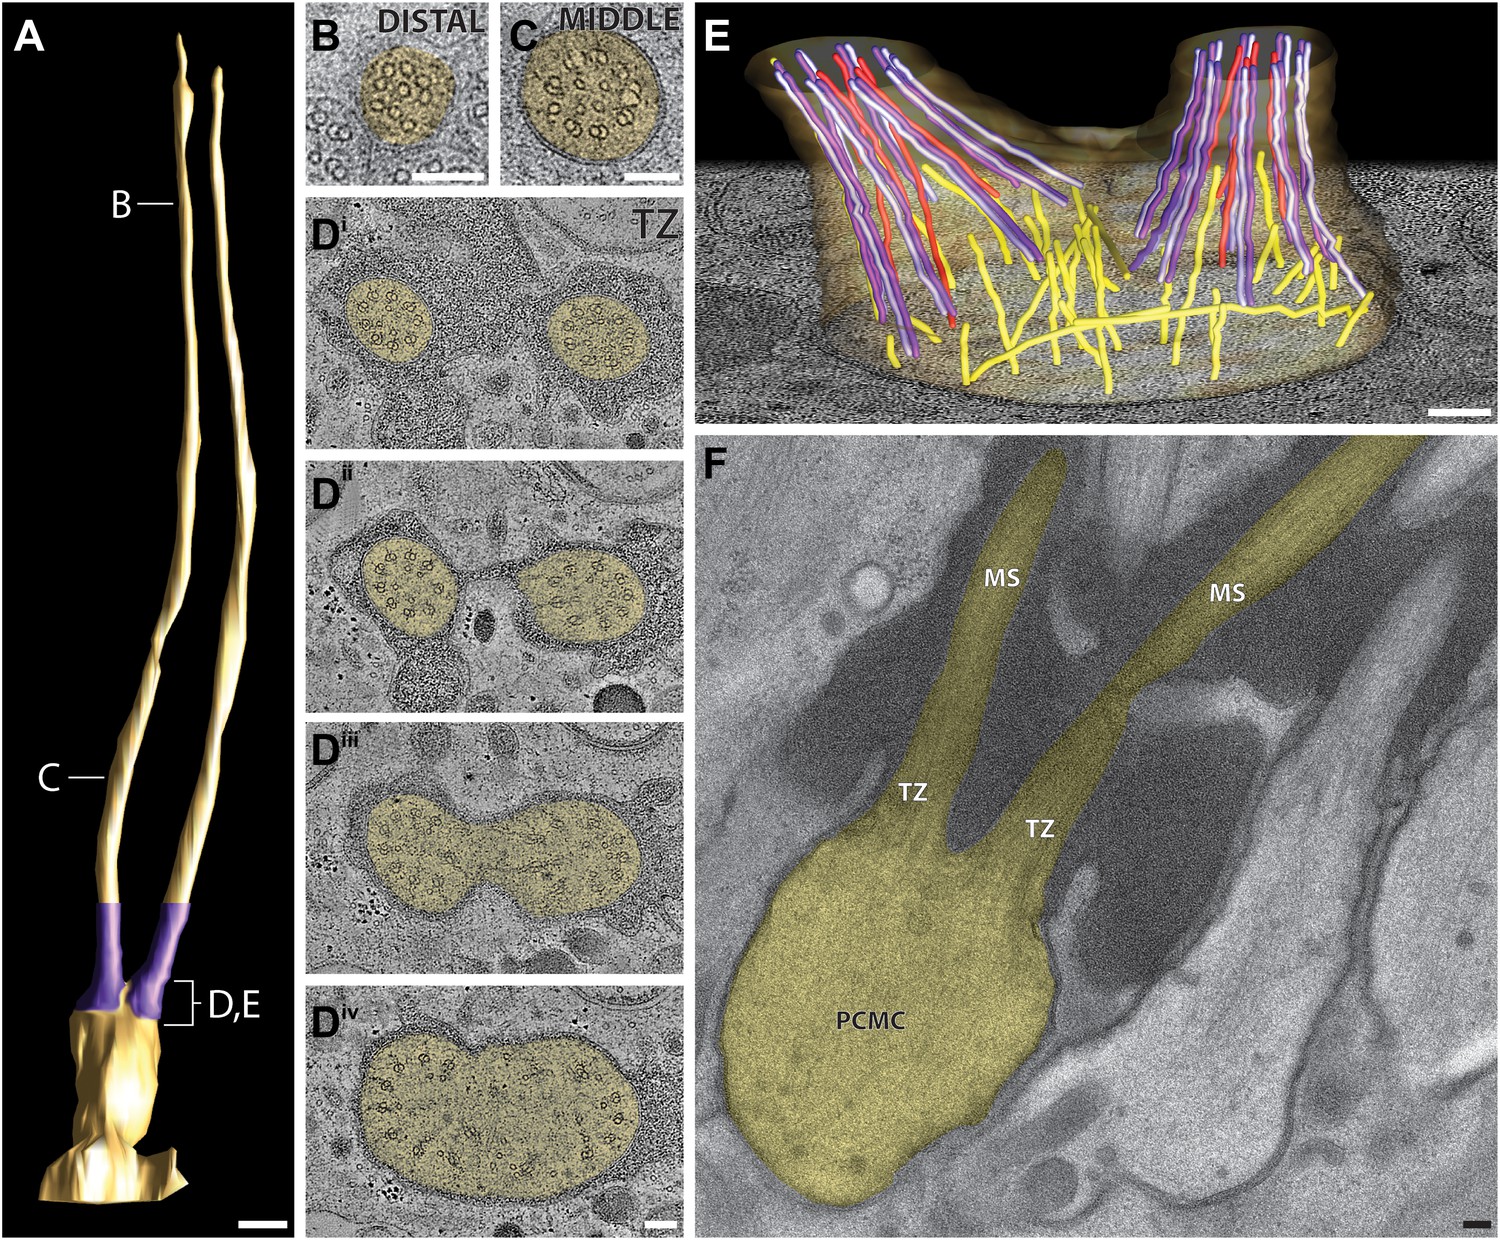
Ultrastructure of the ADL neuron cilia.
(A) 3D reconstruction model of the two ADL channel cilia, indicating TZs (purple) at the base of each cilium. Labels indicate approximate location of sections shown in B–E. Scale bar: 500 nm. (B and C) Cross-section TEM images of distal (B) and middle segments (C) of the two ADL cilia. (Di–iv) ssET images of the ADL TZs (distal to proximal). (E) 3D reconstruction model of the ADL TZ area (indicated in A). Color code: dark purple—A-tubules; light purple—B-tubules; red—isMTs; yellow—other MTs in the dendrite. The ADL cell membrane is modeled in brown/tan. (F) Longitudinal TEM section of ADL, indicating PCMC, TZs, and middle segment (MS). Scalebars: 100 nm. See Figure 8—figure supplement 1 for ultrastructure of ADF cilia.
Figure 8—figure supplement 1
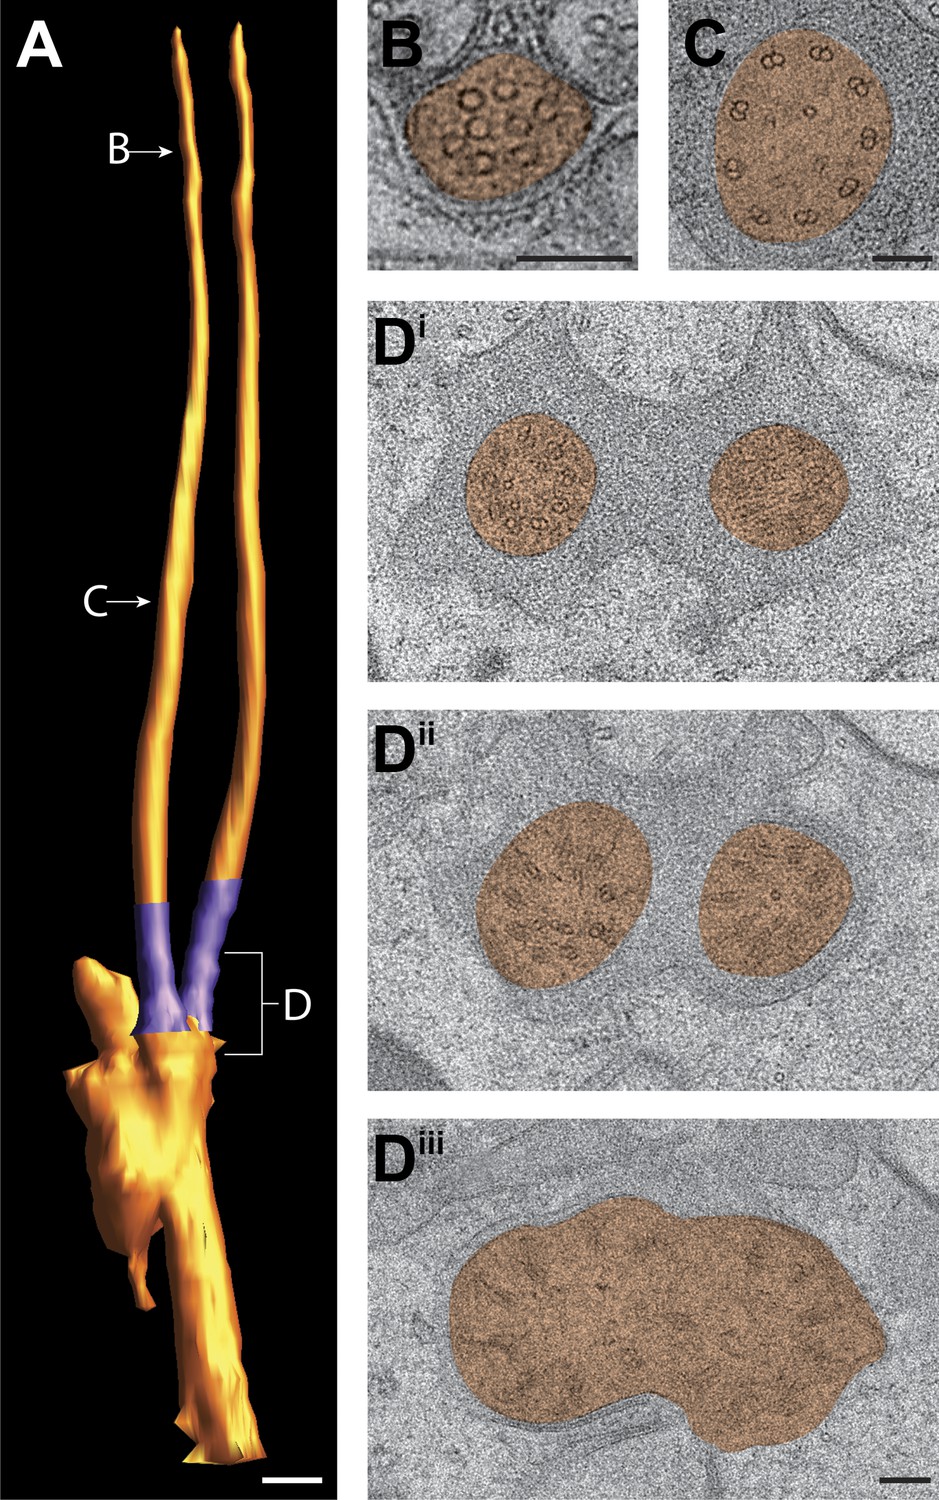
Ultrastructure of the ADF neuron cilia.
(A) 3D reconstruction model of ADF channel cilia, indicating two TZs (purple). Labels indicate approximate location of sections shown in B–D. (B and C) Cross-section TEM images of distal segment (B) and middle segment (C) of an ADF cilium. (Di–iii) TEM images of the ADF TZs (distal to proximal). Scale bars: (A) 500 nm; (B–D) 100 nm.
Figure 9
Ultrastructure of the AWB neuron cilia.
(A) 3D reconstruction model of AWB cilia, indicating TZs (purple). Labels indicate approximate location of sections and models shown in B–E. Scale bar: 500 nm. (B and C) Cross-section TEM images of far-distal (B) and distal segment (C) of the two AWB cilia. Arrowhead indicates a MT in B. (Di–iii) ssET images of the AWB TZs (distal to proximal). B-tubule hooks are indicated by arrows; vesicles are indicated by arrowheads. (E) 3D reconstruction model of the AWB TZ region. Color code: dark purple—A-tubules; light purple—B-tubules; red—isMTs; yellow—other MTs in the dendrite. The AWB cell membrane is modeled in green. (F) Longitudinal TEM section of AWB, indicating PCMC and TZs. Scale bars: 100 nm.
Figure 10
Ultrastructure of the AWA cilium.
(A) 3D reconstruction model of an AWA cilium, indicating TZ (purple). Scale bar: 1 μm. (B) 3D reconstruction model of AWA cilia with a single cross-sectional view indicating the spread of AWA ciliary branches from the lateral/amphid lips to adjacent dorsal and ventral lips. Anterior at left. Scale bar: 1 μm. (C) Model of MTs in the region indicated in (A). Dark purple—A tubules; light purple—B tubules; red—isMTs. Anterior at top. (Di–v) Cross-section TEM series showing MT distribution upon branching from distal (Di) to proximal (Dv). (E) Cross-section TEM of an organized AWA TZ. Scale bar 100 nm.
Figure 11
Ultrastructure of the AWC cilium.
(A) 3D reconstruction model of an AWC winged cilium, indicating TZ (purple) and MTs. Light purple—dMTs; red—isMTs; green—MTs (undetermined). Labels indicate approximate location of sections shown in C–G. Scale bar: 1 μm. (B) 3D reconstruction model of left and right AWC cilia with a single cross-sectional view indicating the extension of the AWC wings from their lateral/amphid lip to adjacent dorsal and ventral lips. Anterior is at left. Scale bar: 1 μm. (C and C′) Distal segment of AWC indicating few sMTs. In lighter blue is the AWC cilium from the opposite side. (D and D′) Middle segment of AWC indicating few sMTs and dMTs. (E and E′) Proximal middle segment of AWC indicating spreading of the AWC wing and disorganized isMTs and dMTs. (F) dMTs and isMTs become disorganized in the middle segment of AWC. (G) The AWC TZ with nine dMTs and isMTs. Scale bar: 100 nm.
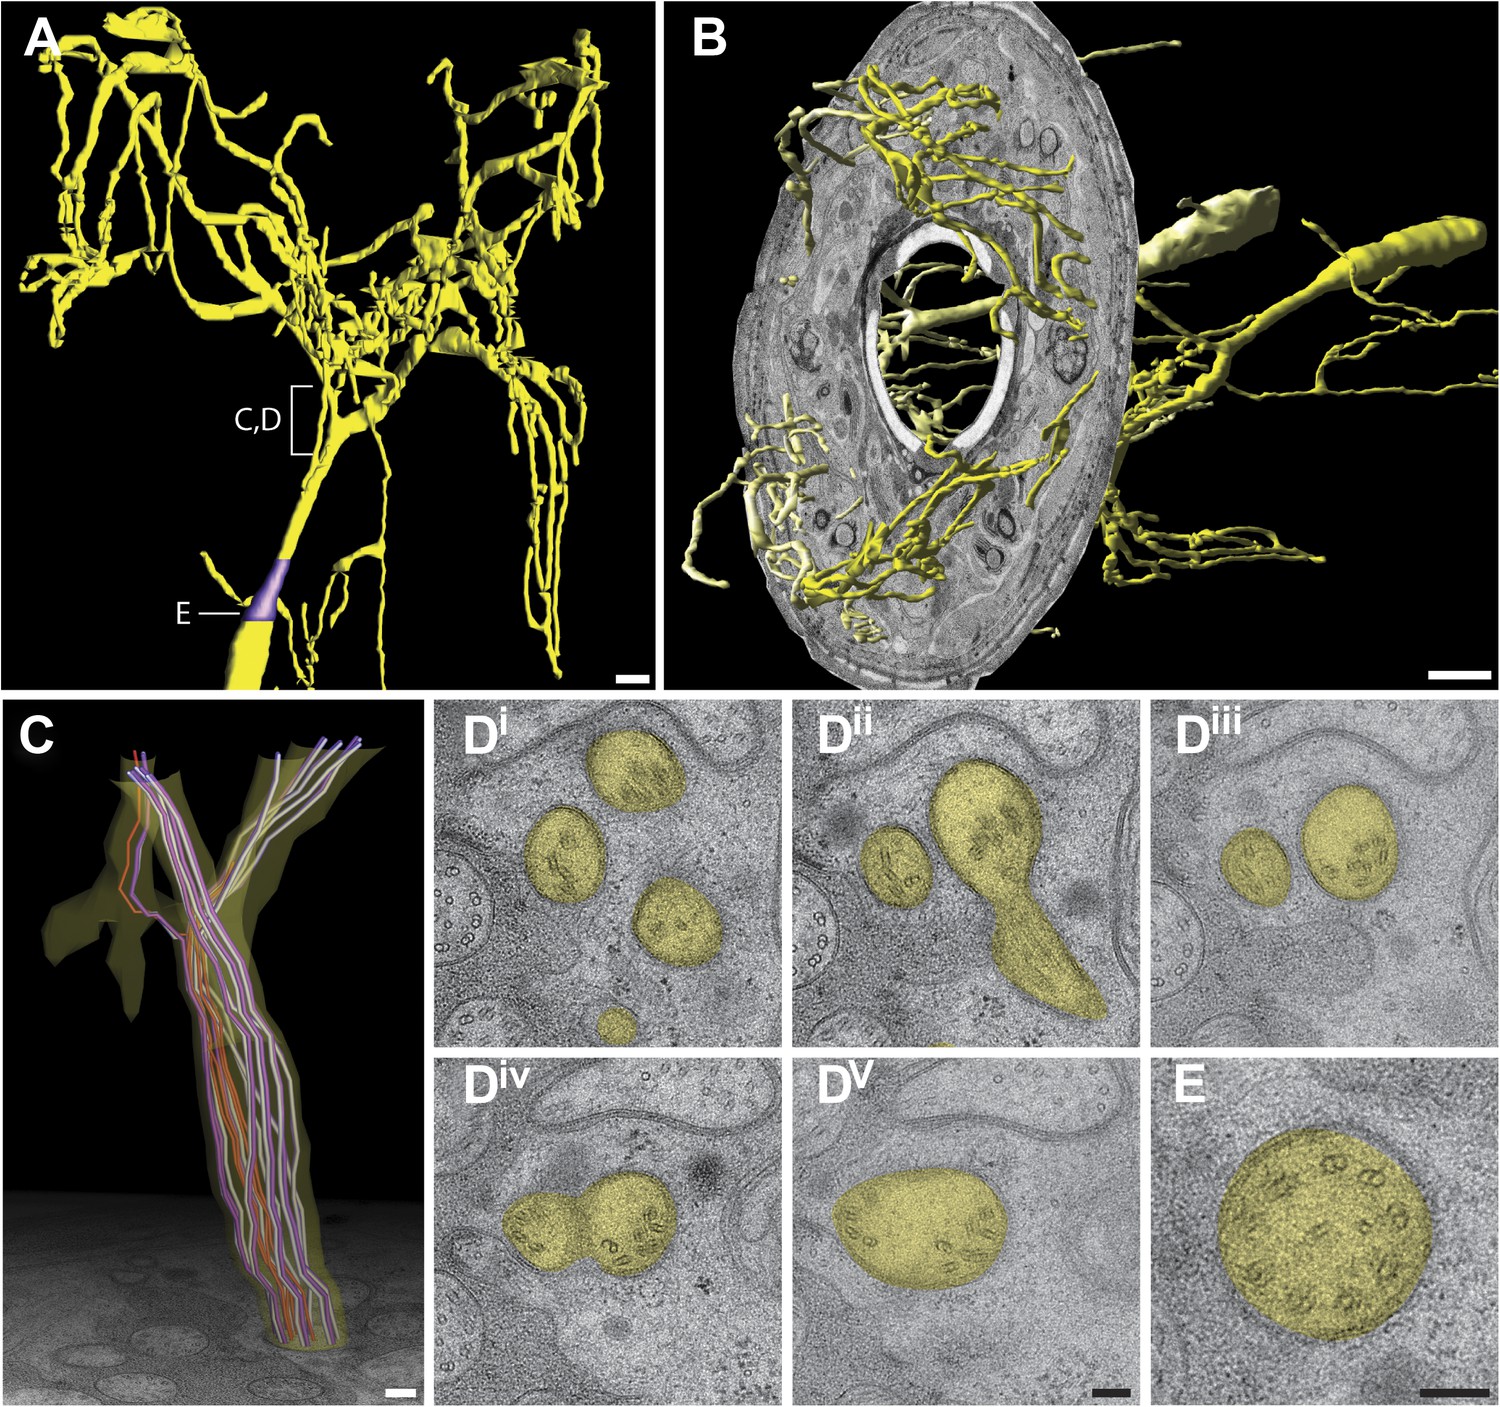
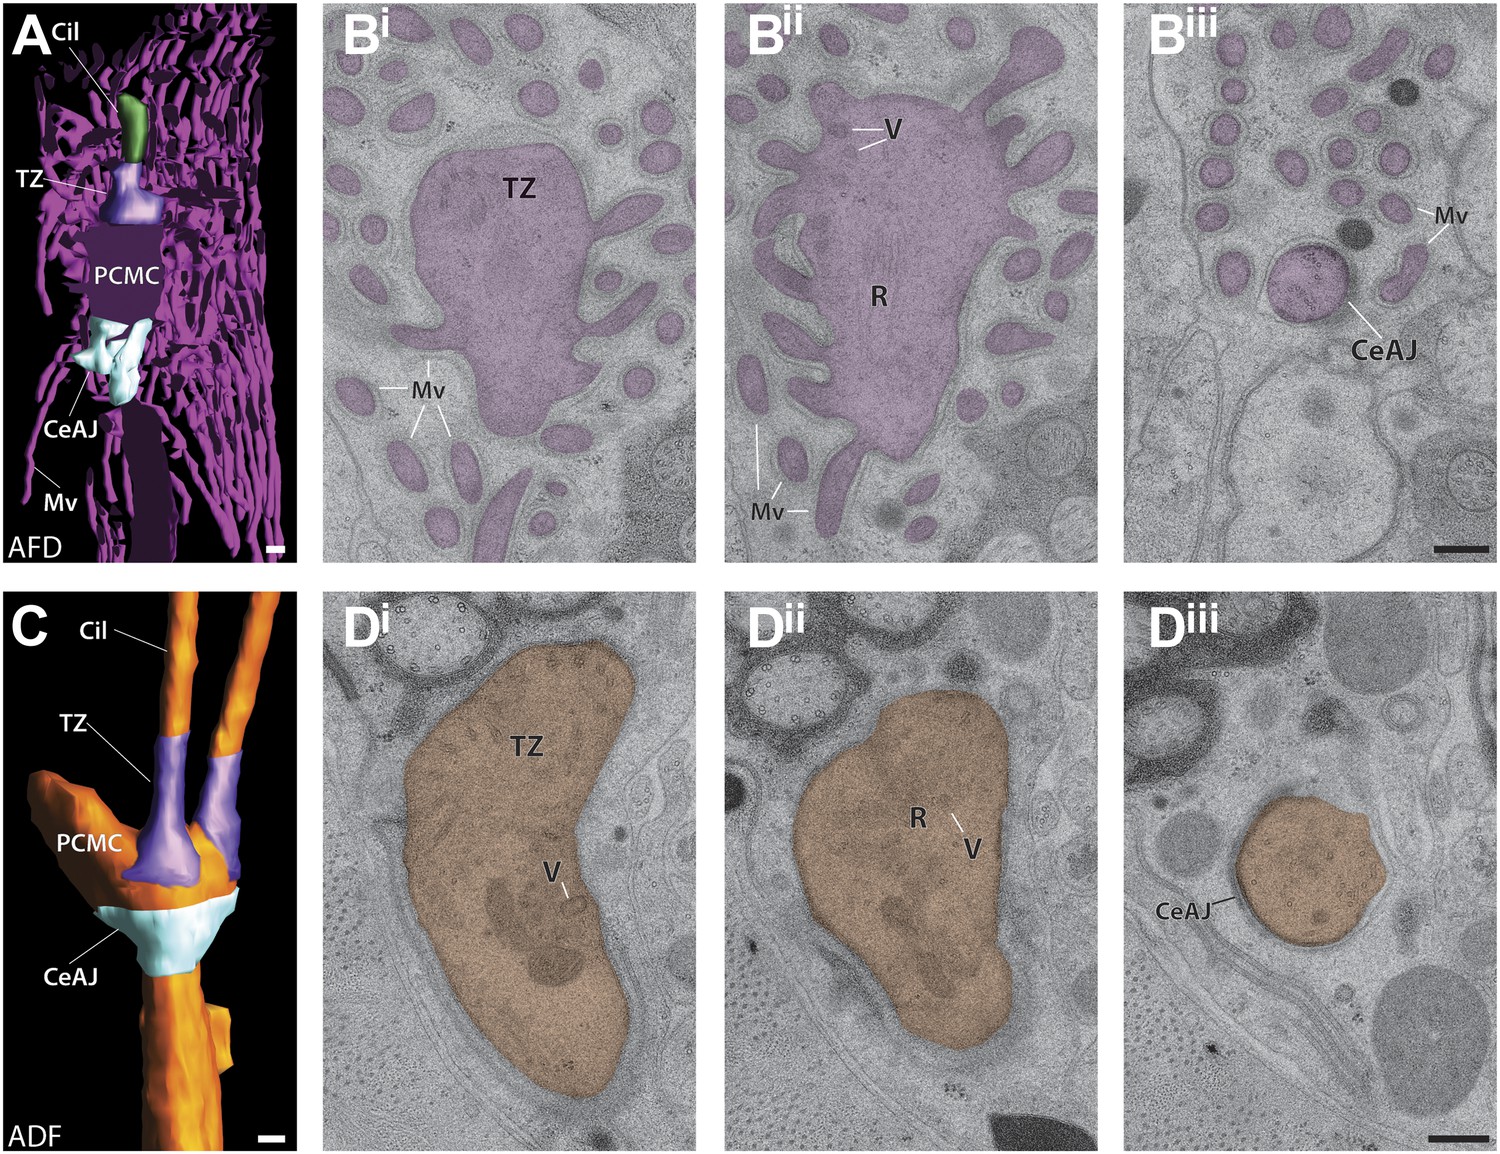
Figure 12 with 2 supplements
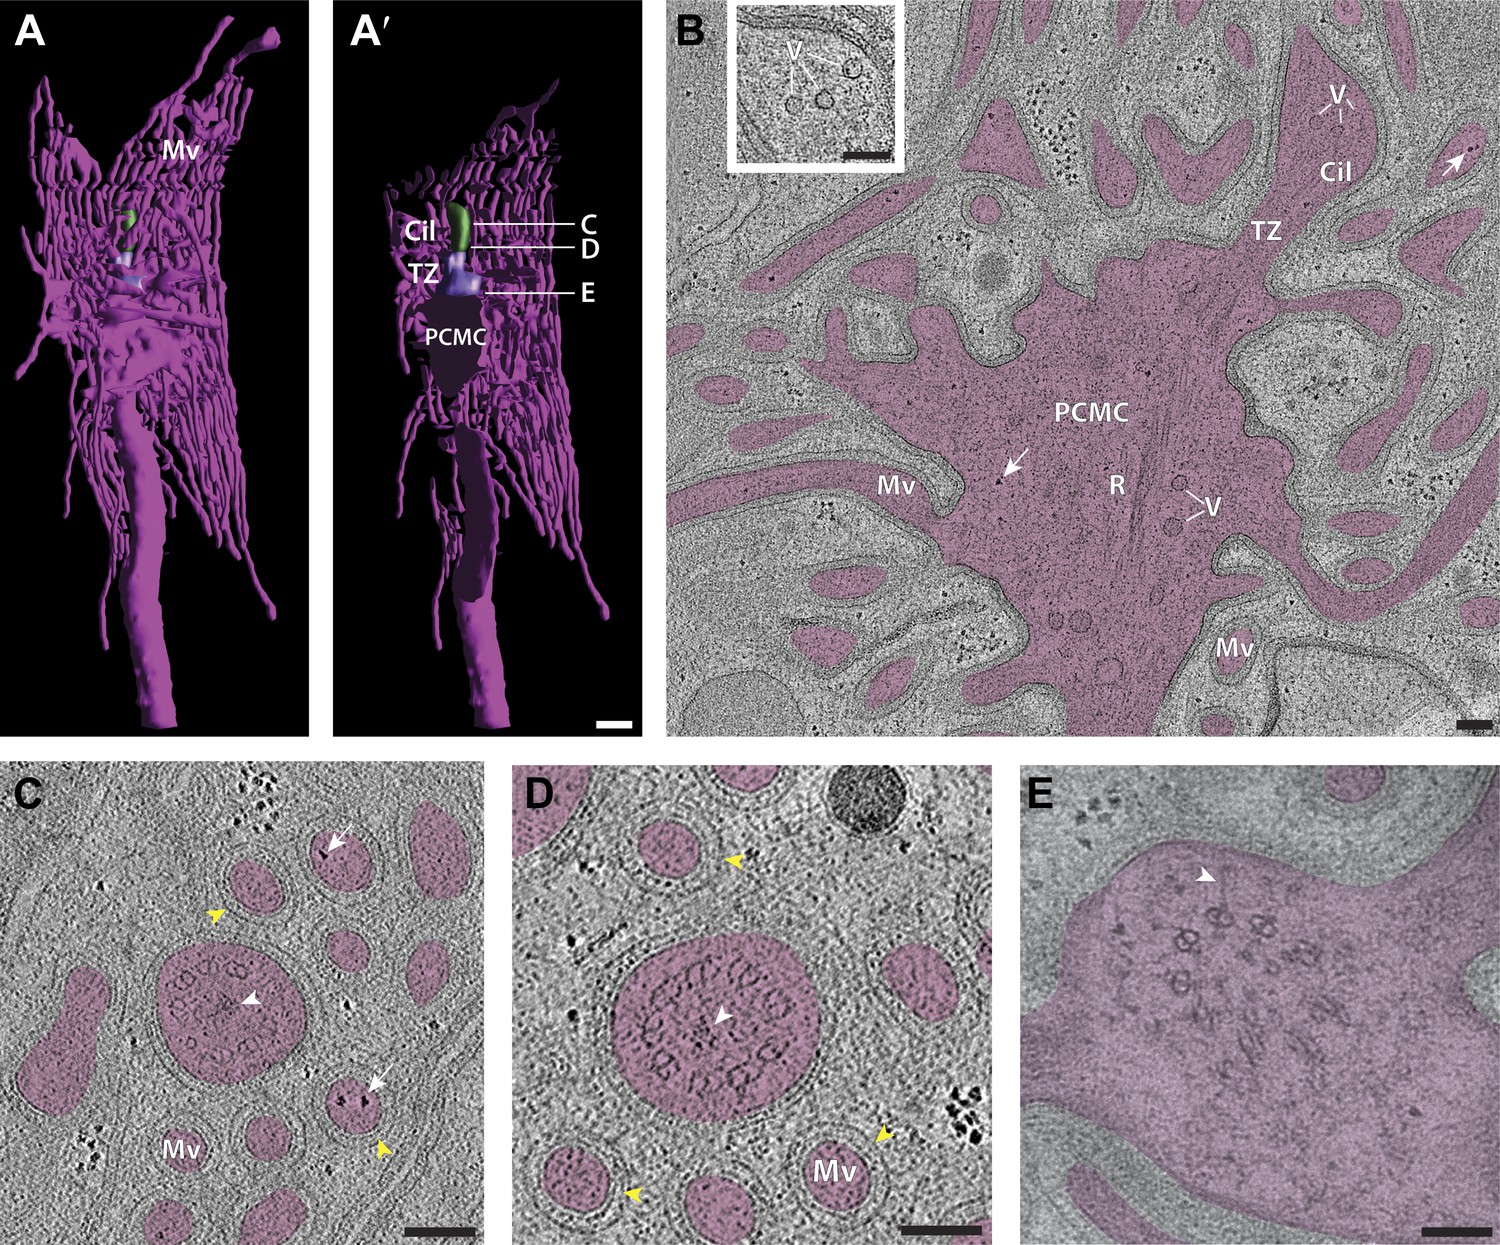
Ultrastructure of the sensory endings of AFD.
(A and A′) 3D reconstruction model of an AFD finger cell sensory ending with microvilli branches (magenta) and cilium (green). (A′) Clipped view allowing visualization of the TZ (purple) and PCMC. Scale bar: 500 nm. (B) Longitudinal ET slice of the AFD sensory ending indicating cilium (Cil), TZ, PCMC, and microvilli (Mv). Vesicles (V) and rootlet-like structures (R) are also marked. Ribosome-like structures are indicated by arrows. (C and D) Cross-sectional ET slice of AFD cilium distal-middle segment (C) and proximal-middle segment (D). Ribosome-like structures are indicated by white arrows; electron-dense rootlet-like material is indicated by white arrowheads; rings of regularly arranged particles of unknown composition between the AMsh and AFD cell membranes are visible (yellow arrowheads). (E) Cross-section TEM of the AFD TZ indicating long Y-links (white arrowhead). Scale bars: 100 nm. Figure 12—figure supplement 1 shows additional views of AFD morphology and ultrastructure. Figure12—figure supplement 2 shows interaction between the PCMCs of AFD and ASE.
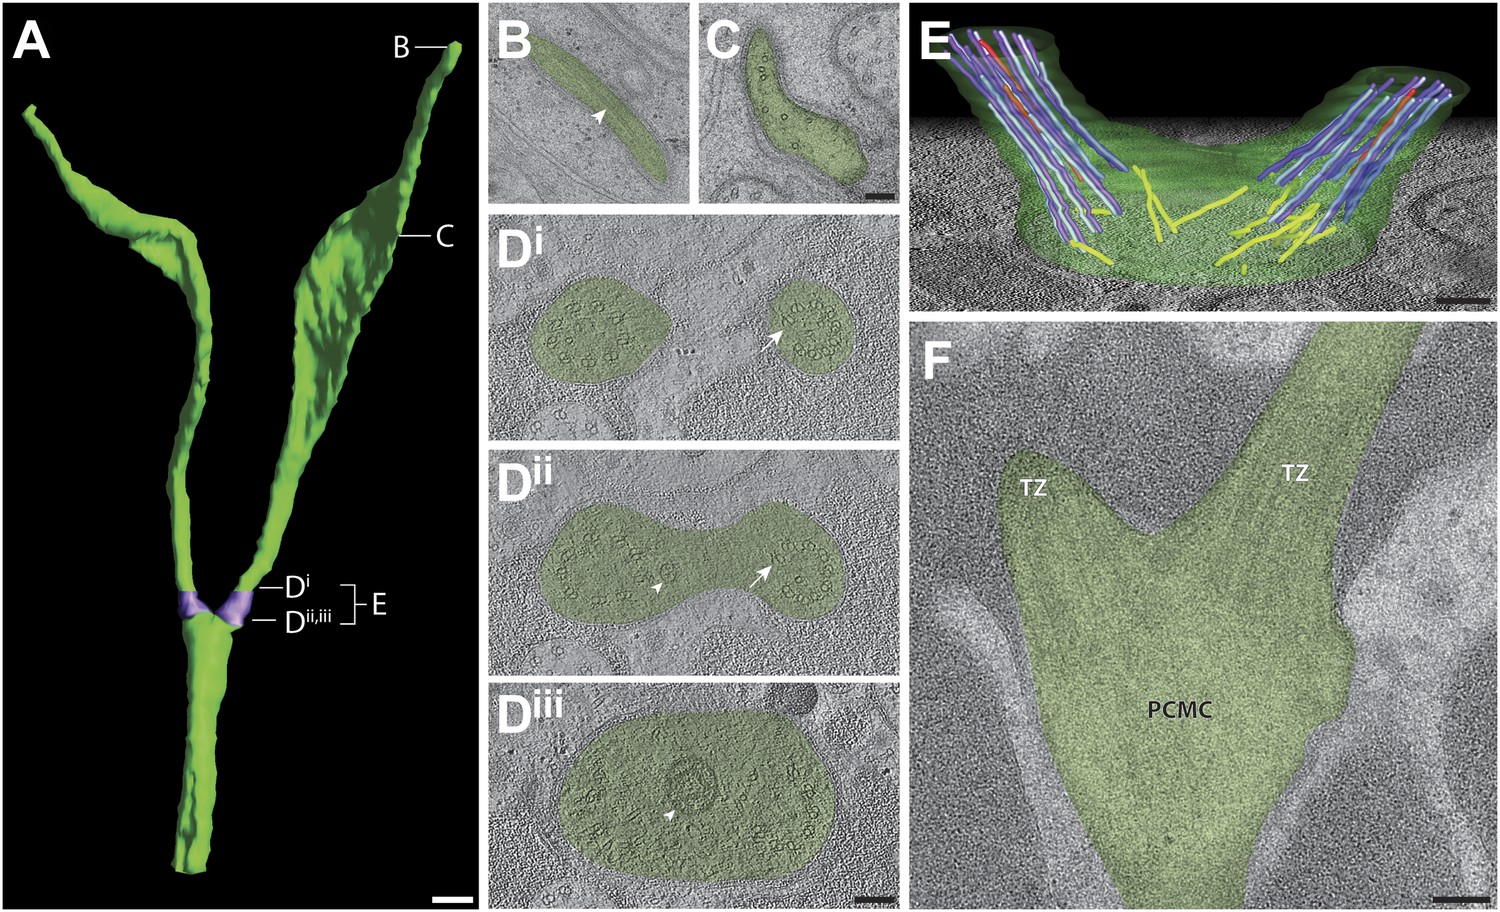
Figure 12—figure supplement 1
Periciliary membrane compartments.
(A) Clipped view of a 3D reconstruction model of AFD and its PCMC, TZ (purple) and the CeAJ (light blue). Scale bar: 200 nm. (Bi–iii) ssTEM images of the (Bi) TZ/apical region of the PCMC, (Bii) middle plane with vesicles (V), and rootlet-like structures (R), and the CeAJ between the AFD cilium and sheath cell process (Biii). Note that microvilli (Mv) branch from the PCMC. Scale bar: 100 nm. (C) 3D reconstruction of the ADF PCMC indicating its boundaries: TZ (purple) and the CeAJ (light blue). Scale bar: 200 nm. (Di–iii) ssTEM images of the apical part of the ADF PCMC with the basal portion of the TZ and vesicles (Di), middle PCMC plane with vesicles, unorganized MTs and rootlet-like structure (Dii), and (Diii) the CeAJ at the PCMC base. Scale bar: 100 nm.
Figure 12—figure supplement 2
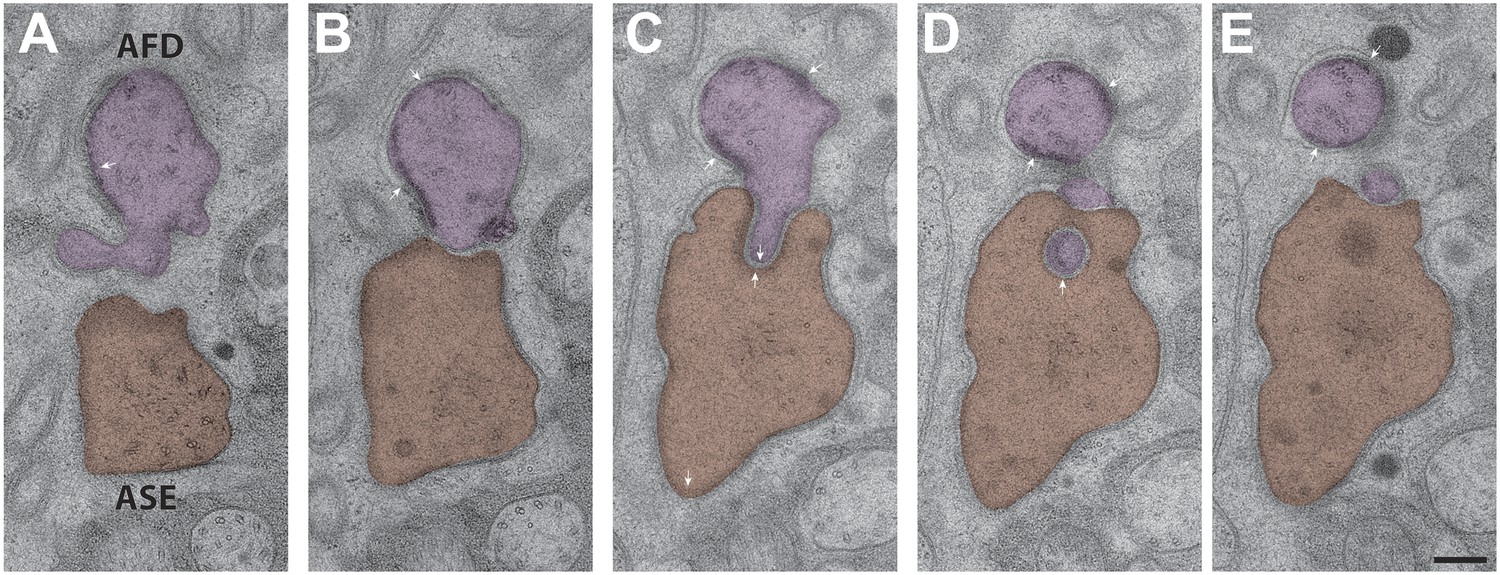
Interactions between the PCMCs of AFD and ASE.
The AFD PCMC has a stereotypical projection into the ASE PCMC. Both of these PCMC regions are bound by CeAJs (arrowheads) between the cilium and the sheath cell process. Sections are from distal (A) to proximal (E). Scale bar: 200 nm.
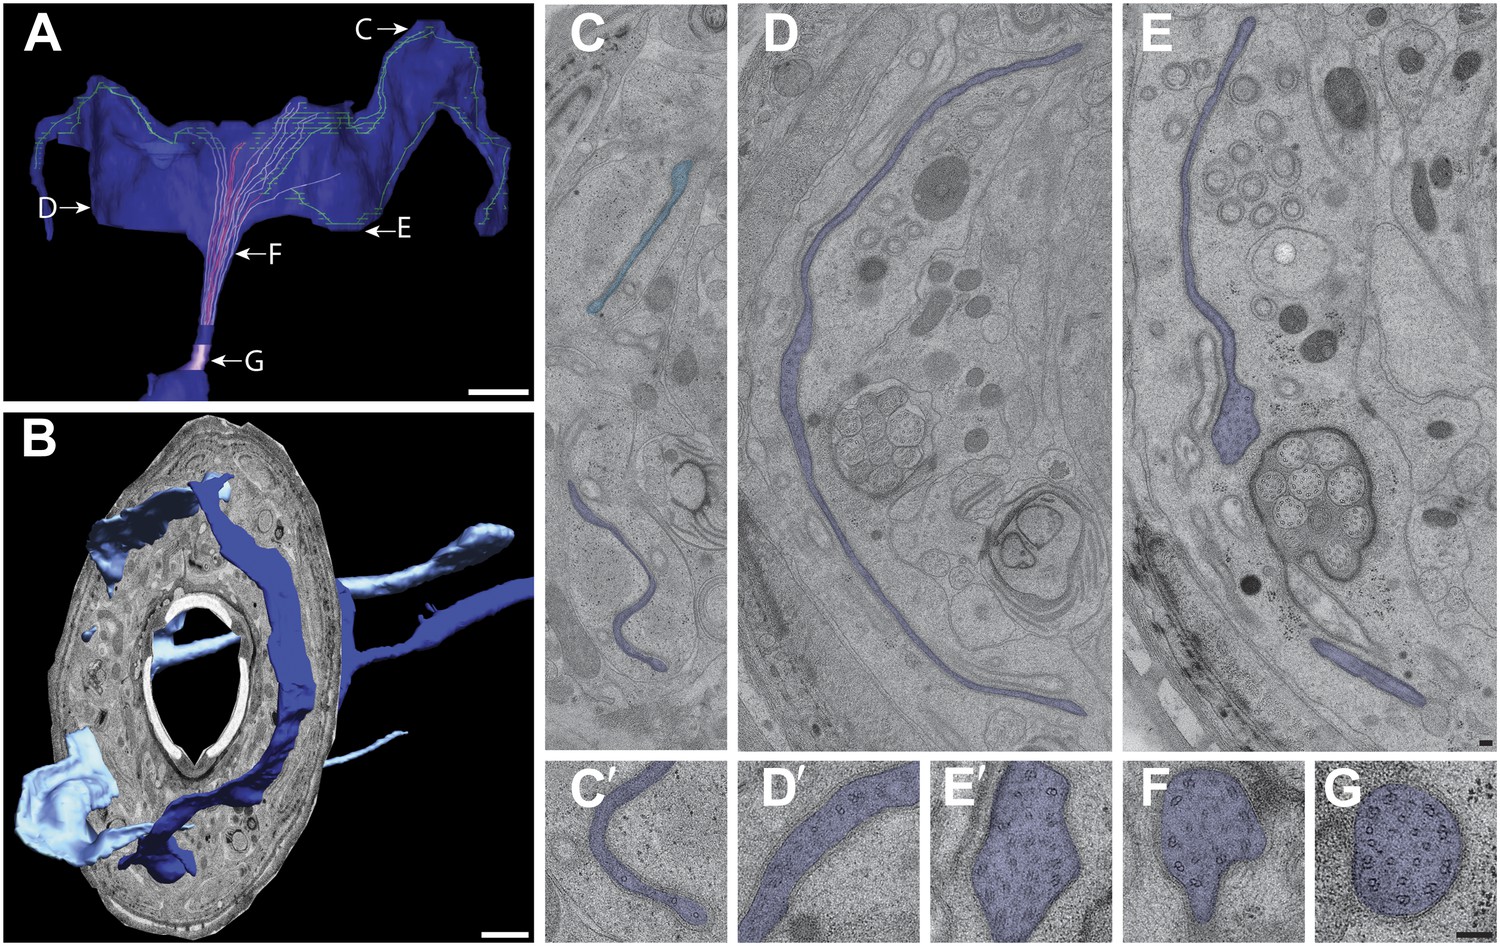
Figure 13 with 1 supplement
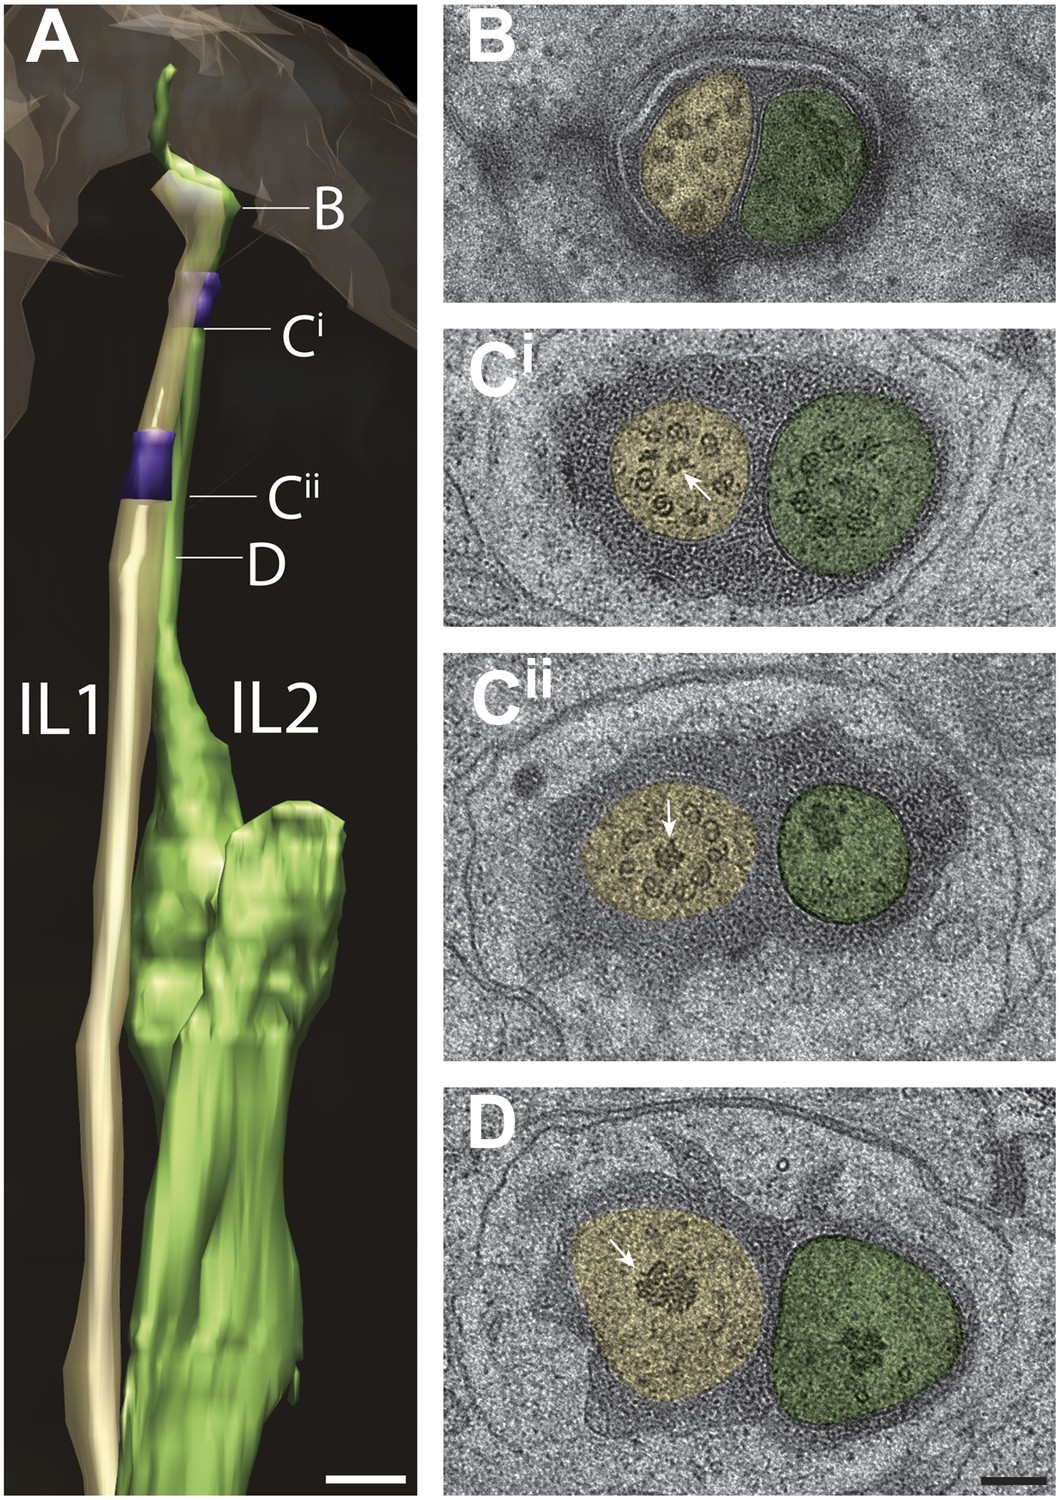
Ultrastructure of IL1 and IL2 neurons.
(A) 3D reconstruction model of lateral IL1 (yellow-tan) and IL2 (green) cilia indicating TZs (purple) and the long striated IL1 rootlet (white). Labels indicate approximate positions of cross-sections shown in B–D. (B–D) Cross-section TEM images of IL1 and IL2 at the distal segment which has few, disorganized sMTs (B), IL1 (Cii) and IL2 (Ci) TZs which include portions of the IL1 rootlet-like material (arrows). Scalebar: 100 nm. See Figure 13—figure supplement 1 for additional ultrastructural features present in IL1 and IL2 cilia.
Figure 13—figure supplement 1
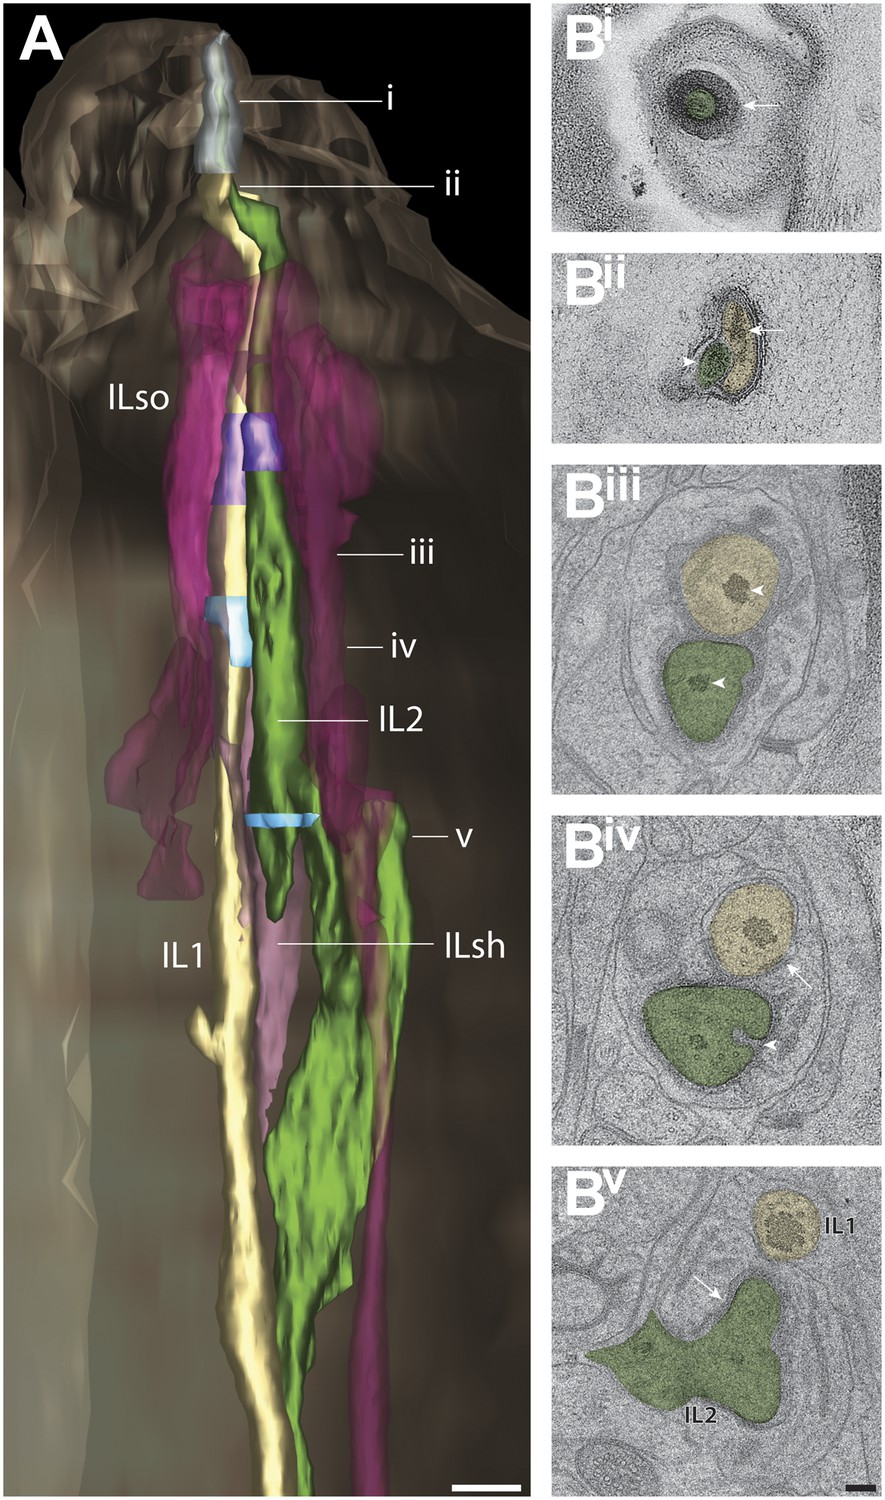
Structural features associated with lateral IL1 and IL2 cilia.
(A) 3D reconstructed models of lateral IL1 and IL2 cilia and processes of associated support cells. TZs and CeAJs are indicated in purple and light blue, respectively. Approximate locations of cross-sections shown in B are indicated. (Bi–v) Shown are the IL2 plug (Bi; arrow), electron-dense disk at the tip of IL1 and material at the tip of IL2 (Bii, arrow and arrowhead, respectively), rootlet and rootlet-like structures (Biii; arrowheads); IL1 CeAJ and invaginations into the IL2 PCMC (Biv; arrow and arrowhead, respectively), and an IL2 CeAJ (Bv; arrow). Note that both cilia extend beyond their glial surrounds to enter a narrow pore in the lip cuticle (Bi, Bii). Scale bars: 500 nm (A), 100 nm (B).
Figure 14 with 1 supplement
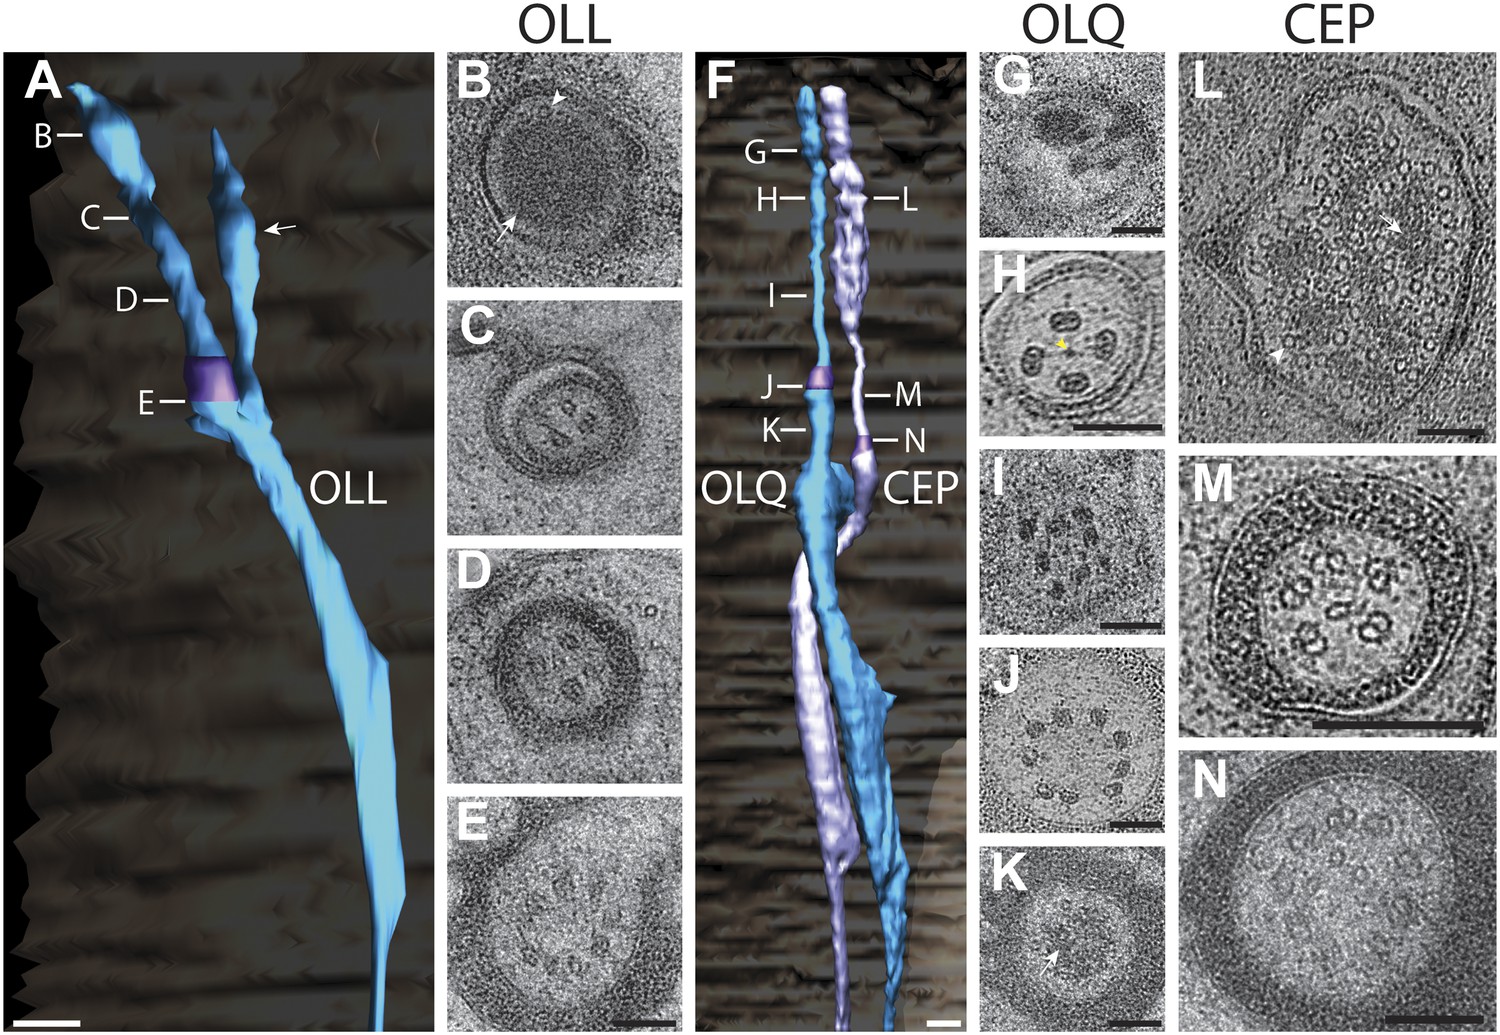
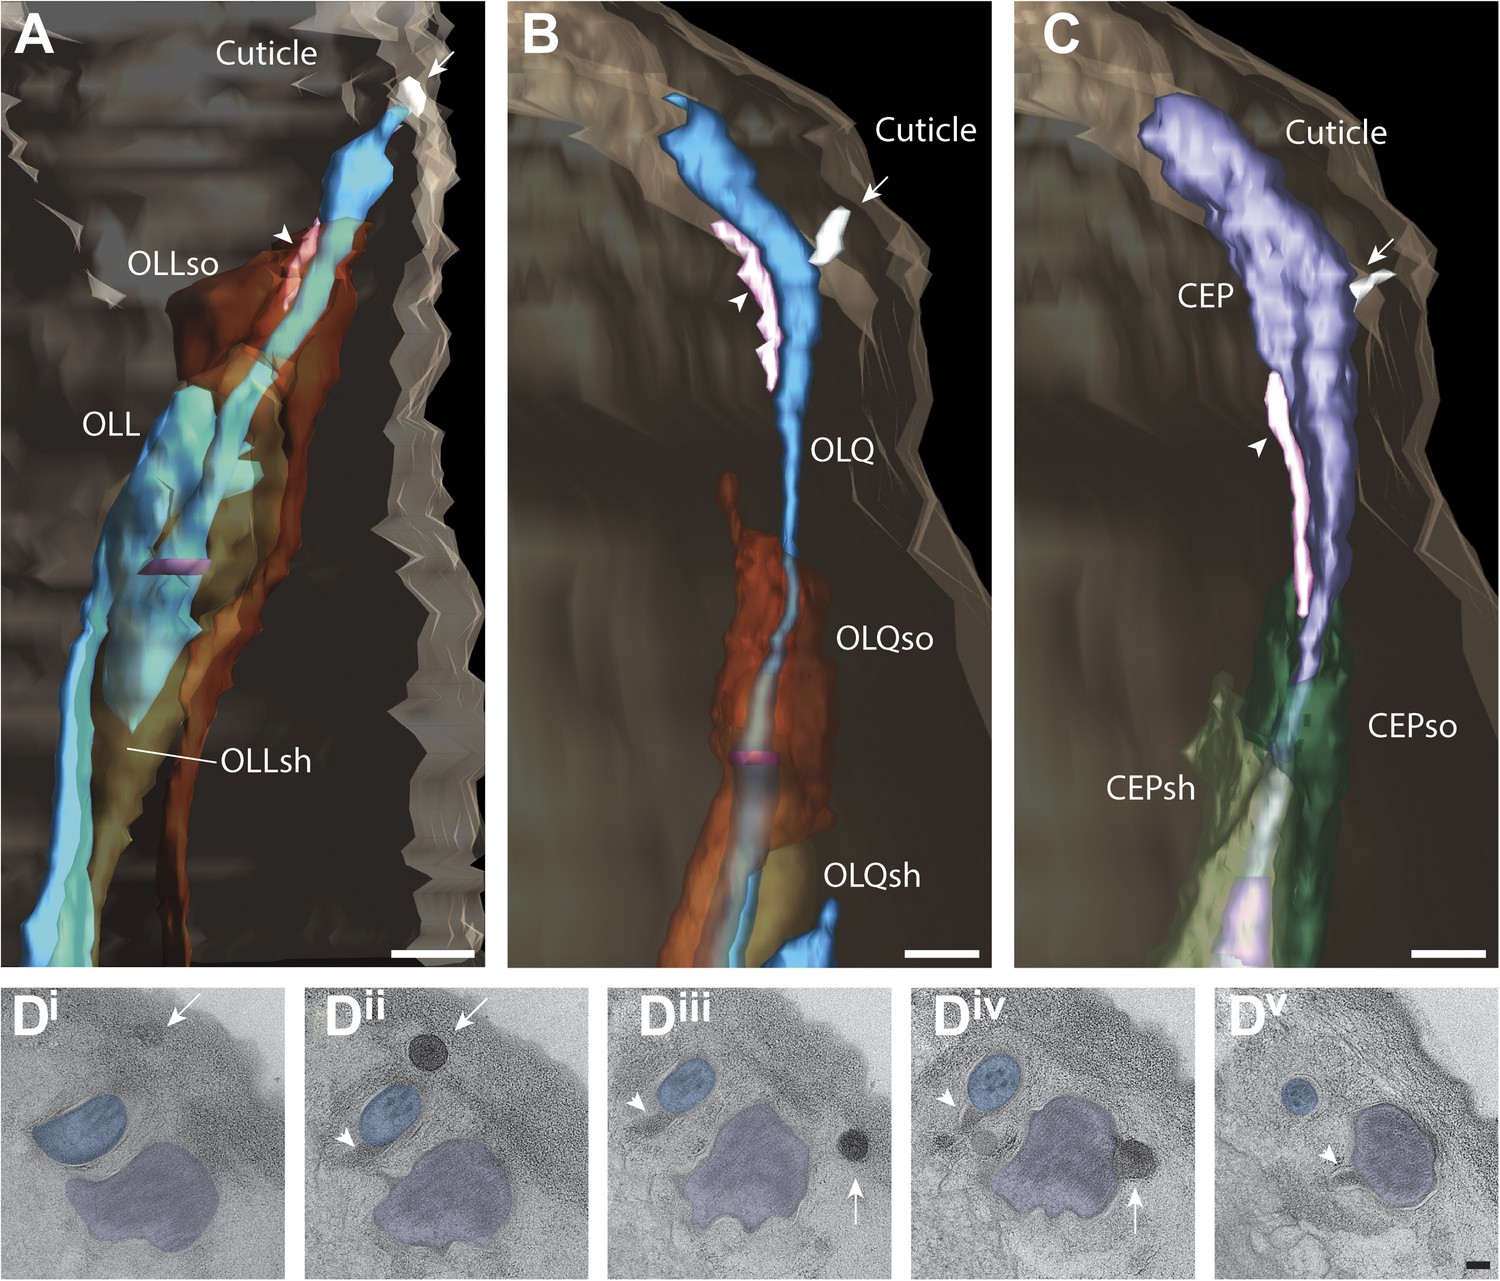
Ultrastructure of the OLL/OLQ and CEP neuron cilia.
(A) 3D reconstruction model of OLL cilium indicating TZ (purple) and a non-ciliary type III dendritic branch (arrow). Approximate locations of cross sections in B–E are shown. Scale bar: 500 nm. (B) Far distal segment of OLL containing electron-dense material (arrow) and MTs (arrowhead). (C–E) Distal (C) and middle segments (D) of OLL have few disorganized MTs whereas the OLL TZ (E) has nine dMTs. Scale bars: 100 nm. (F) 3D recconstruction model of CEP (lavender) and OLQ (blue) cilia indicating TZs (purple). Approximate locations of cross sections in G–N are shown. Scale bar: 500 nm. (G) Cross section of OLQ far distal segment containing electron-dense material. (H) Cross-sectional ET slice shows distal segment of OLQ containing four dMTs linked by thin fibers to each other and to a central filament (arrowhead); note the electron-dense MIPs in both the A- and B-tubules of all dMTs (seen as black dots in the tubule-lumen). (I–J) Cross-sectional TEM (I) and ET (J) images of the disorganized middle segment (I) and at the OLQ TZ (J). (K) OLQ has electron-dense material (arrow) corresponding to a striated rootlet that is directed from the OLQ TZ into the dendrite. (L) Cross-sectional ET slices at the distal end of the CEP sensory ending shows a large tubular body containing many MTs (arrowhead) together with amorphous, electron-dense material (arrow). (M) dMTs and sMTs present within the middle segment of a CEP cilium. (N) Cross-section TEM image shows nine dMTs with isMTs in the CEP cilia TZ. Scale bar: 200 nm. See Figure 14—figure supplement 1 for views of the spurs and cuticular strings associated with OLL/OLQ and CEP cilia.
Figure 14—figure supplement 1
Structural features associated with OLQ and CEP cilia.
(A–C) 3D reconstructed models of an OLL (A), OLQ (B), and CEP (C) cilium with processes of associated glial cells. Spurs and cuticular strings are indicated by arrowheads and arrows, respectively. Scale bars: 500 nm. (D) Distal (Di) to proximal (Dv) serial TEM sections showing cuticular strings (arrows) associated with OLQ (Di, Dii), CEP (Diii, Div), and spurs (arrowheads) associated with OLQ (Dii–Div), and CEP (Dv). Scale bar: 100 nm.
Figure 15
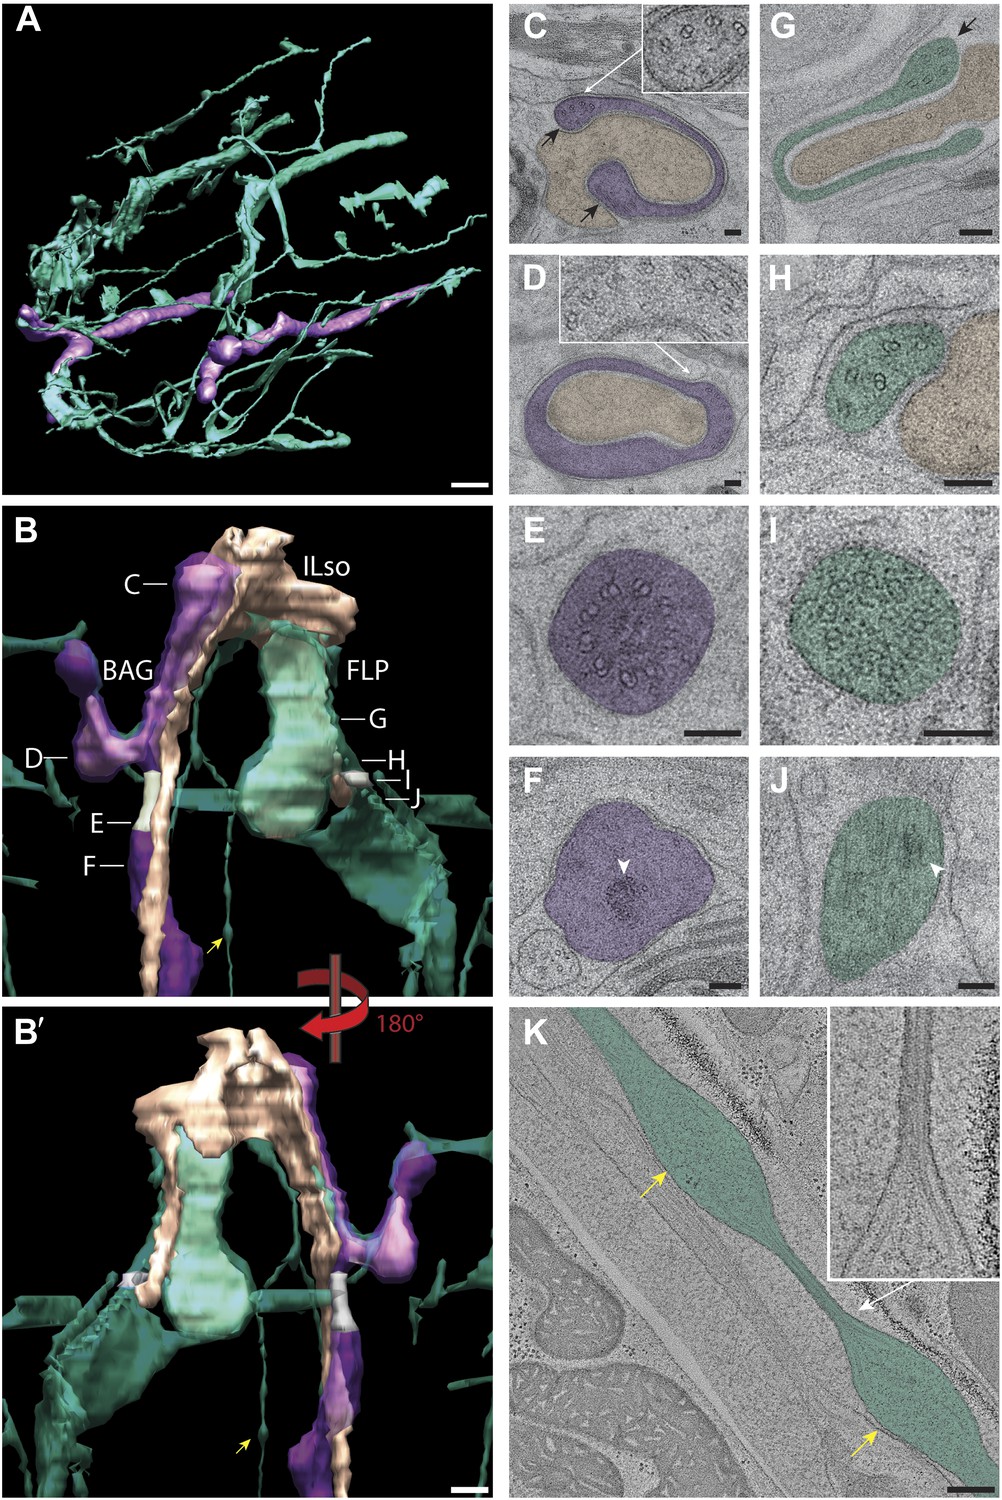
Ultrastructure of BAG and FLP cilia.
(A) 3D reconstruction model of BAG (purple) and FLP (green) sensory endings. BAG and FLP sensory endings are positioned laterally. FLP has an extensive dendritic branching network. Scale bar: 1 µm. (B and B′) 3D reconstruction models of BAG and FLP endings indicating TZs (gray). BAG and FLP (transparent) closely ensheath the ending of the ILso glial cell (yellow-tan). Approximate locations of sections shown in C–J are indicated. Arrowheads indicate bulbous structures in FLP dendritic branch. (C) Cross-section TEM image showing the far distal end of BAG cilium with several dMTs (inset) at the edges of the BAG ciliary branches (black arrows) and associating with the ILso process. (D) The distal segment of the BAG cilium wraps around a projection of the ILso and contains dMTs (inset) segregating preferentially to one side. (E and F) Ultrastructures of the BAG TZ (E) and rootlet (arrowhead in F). (G) The distal segment of FLP cilia has flap-like projections with several dMTs (arrow). (H) The middle segment of FLP cilia contains several disorganized dMTs. (I) The FLP TZ contains nine dMTs. (J) Arrowhead indicates rootlet-like structures in the FLP PCMC. (K) Longitudinal ET view of a FLP dendritic branch shows an iteratively bulbous dendrite (arrows) that includes 2–3 MTs, which are tightly packed in the ∼60 nm constrictions between bulbs (inset). Scale bars: 100 nm.
Figure 16
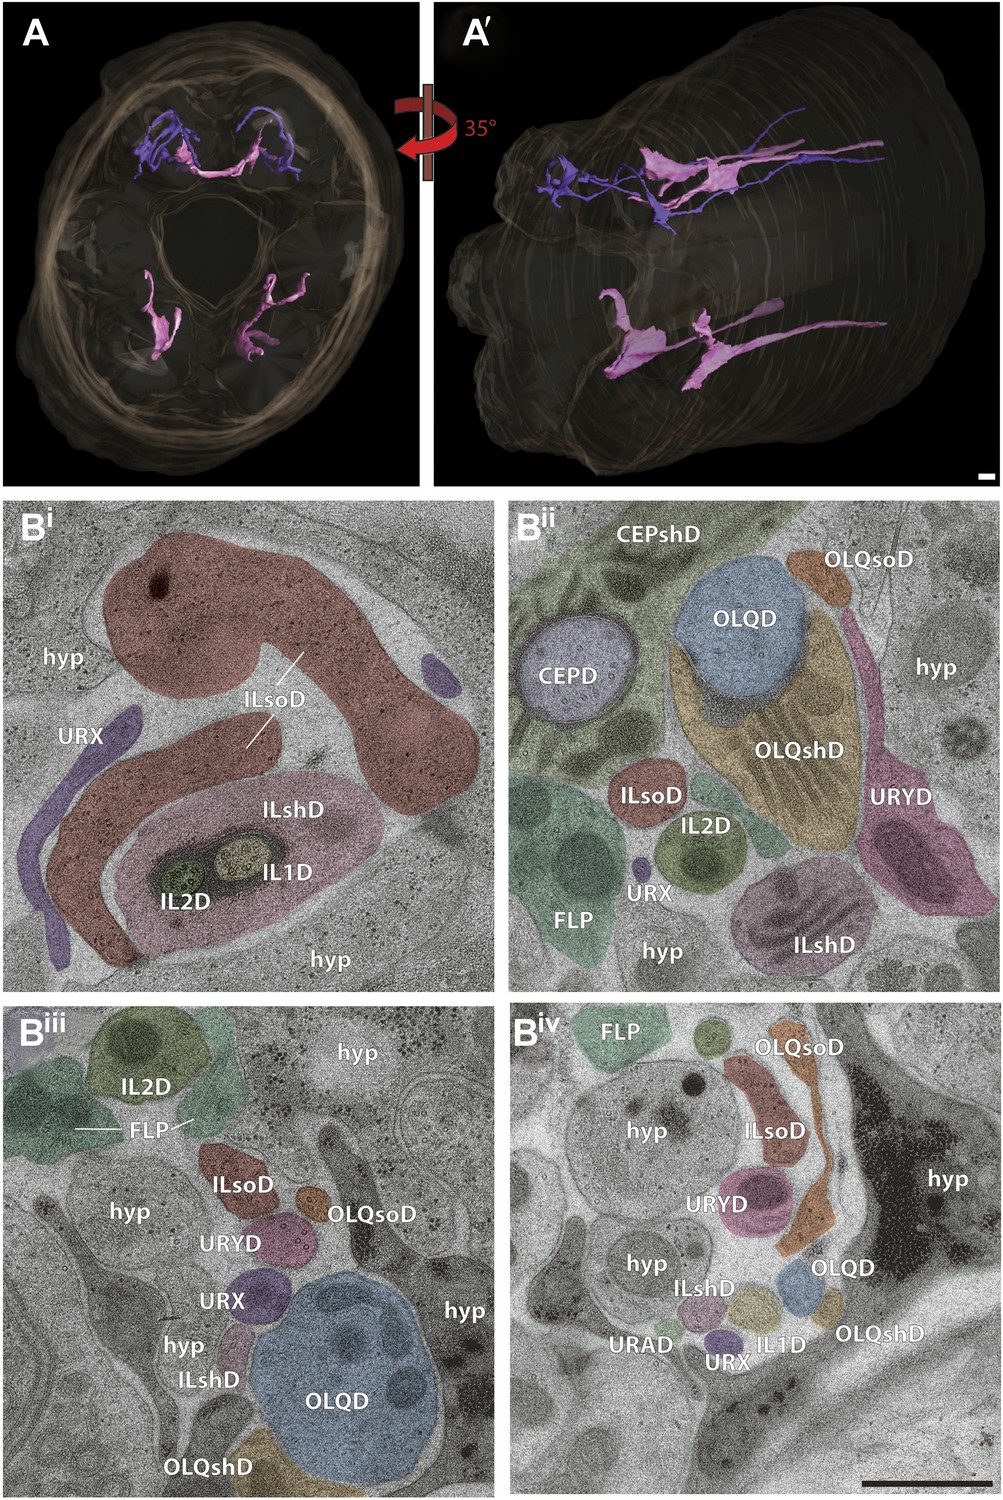
Non-ciliated endings of URX and URY.
(A and A′) 3D reconstruction of two dorsal URX (purple) and four dorsal and ventral URY (pink) dendritic endings. (Bi–iv) Selected cross-sections from distal (Bi) to proximal (Biv). (Bi) The tip of URX (purple) terminates around the ILD sensillum with branches around the process of ILsoD. (Bii) URY is found apposed to processes of OLQshD and ILshD. (Biii) URX and URY endings are found near the OLQ dendrite and also surrounded by processes of OLQsoD, ILsoD, and ILshD. Note singlet MTs in URY. (Biv) URX and URY are found sub-dorsally with IL1D, OLQshD, ILshD, OLQsoD, and ILsoD processes as well as hypodermal cells as neighbors. Scale bars: 500 nm.
Videos
Video 1
ssTEM 3D reconstruction model of all ciliated and non-ciliated anterior sensory endings in the C. elegans adult hermaphrodite. Color codes are as indicated in Figure 2.
https://doi.org/10.7554/eLife.01948.010
Video 2
ssTEM 3D reconstruction model of all amphid neuron cilia and associated socket and sheath cell processes. Color codes as indicated in Figure 2.
https://doi.org/10.7554/eLife.01948.016
Video 3
3D reconstruction model of axonemal MTs twisting as the ASI cilium projects distally. Dark purple—A-tubules; light purple—B-tubules.
https://doi.org/10.7554/eLife.01948.018
Video 4
3D reconstruction model of MT distribution at the TZs of the two cilia in ADL amphid neurons. Color codes for MTs as indicated in Figure 8 legend.
https://doi.org/10.7554/eLife.01948.021
Video 5
3D reconstruction model of MT distribution in the branches of the AWA cilium. Color codes for MTs as indicated in Figure 10 legend.
https://doi.org/10.7554/eLife.01948.024
Video 6
3D reconstruction model of the sensory endings and associated glial cells processes of the IL, OLL/OLQ and CEP neurons.
https://doi.org/10.7554/eLife.01948.031
Video 7
3D reconstruction model of BAG and FLP cilia associated with the ILso process.
https://doi.org/10.7554/eLife.01948.035Additional files
-
Supplementary file 1
(A) isMTs in amphid neuron cilia. (B) Location of vesicles in sensory cilia.
- https://doi.org/10.7554/eLife.01948.037
Download links
A two-part list of links to download the article, or parts of the article, in various formats.
Downloads (link to download the article as PDF)
Open citations (links to open the citations from this article in various online reference manager services)
Cite this article (links to download the citations from this article in formats compatible with various reference manager tools)
A high-resolution morphological and ultrastructural map of anterior sensory cilia and glia in Caenorhabditis elegans
eLife 3:e01948.
https://doi.org/10.7554/eLife.01948


