Loss of tumor suppressor TMEM127 drives RET-mediated transformation through disrupted membrane dynamics
- Division of Cancer Biology and Genetics, Cancer Research Institute, and Department of Pathology and Molecular Medicine, Queen’s University, Canada
- Department of Chemistry and Biology, Toronto Metropolitan University, Canada
- Division of Hematology and Medical Oncology, University of Texas Health Science Center, United States
- Department of Molecular and Cellular Biology, Harvard Center for Biological Imaging, Scientific Image Analysis Group, Harvard University, United States
Figures
Figure 1
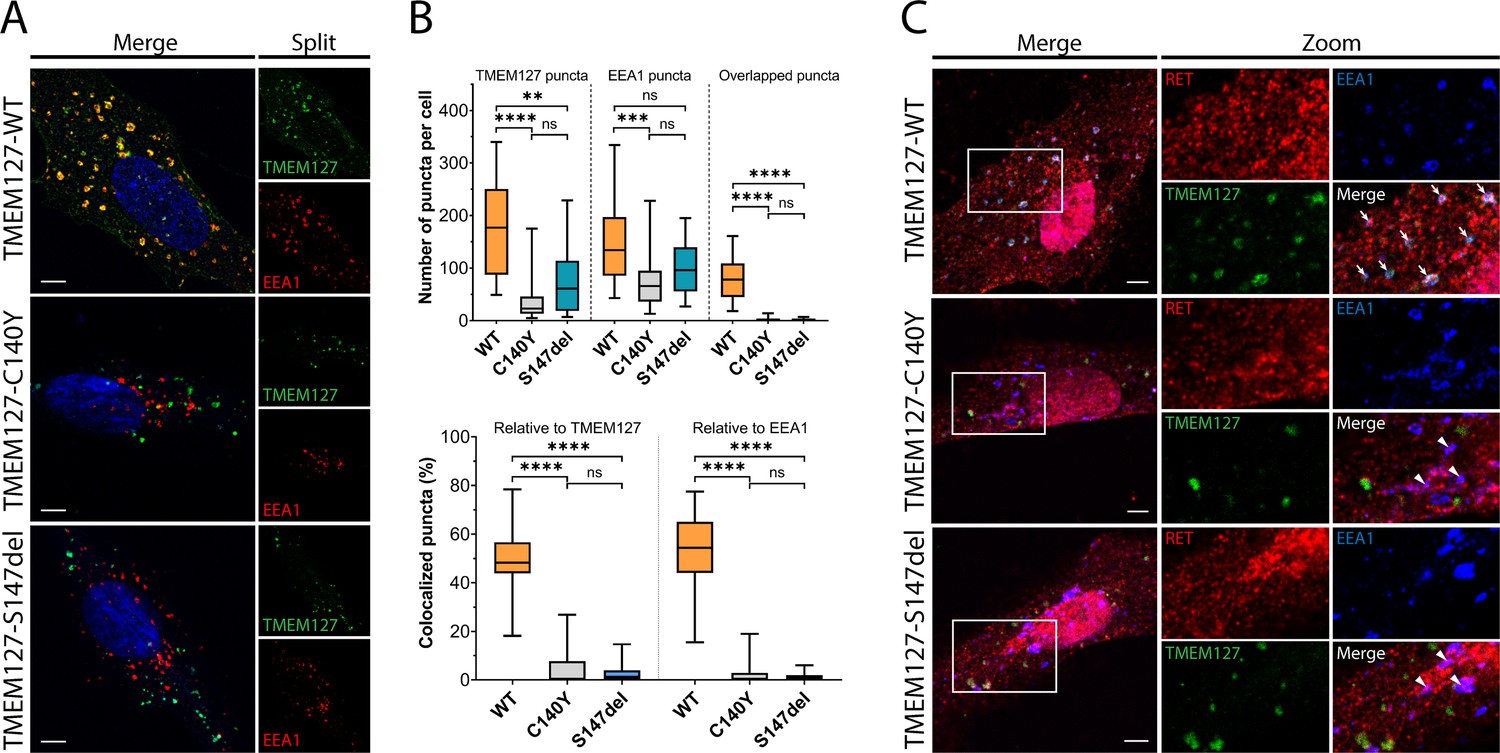
Wildtype (WT) and mutant TMEM127 are differentially localized in endosomes.
(A) Immunofluorescence confocal images of ARPE-19 cells transiently expressing EGFP-TMEM127-WT, -C140Y, or -S147del, and stained for early endosome marker EEA1 (red) and Hoechst nuclear stain (blue). Yellow puncta in the merged images indicate EEA1 colocalization with WT but not mutant TMEM127. (B) Quantification of puncta in cells expressing the indicated TMEM127 proteins under conditions in (A). Quantification of TMEM127 positive or EEA1 positive and overlapping puncta (upper panel) and percent colocalized puncta relative to TMEM127 or EEA1 (bottom panel). Data from two independent experiments representing 17–31 cells per condition are shown (Kruskal-Wallis test and Dunn’s multiple comparisons test; **p<0.01, ***p<0.001, ****p<0.0001). Scale bars = 5 μm. (C) Immunofluorescence confocal images of ARPE-19 cells transiently expressing rearranged during transfection (RET), GDNF family receptor α1 (GFRα1), and EGFP-TMEM127-WT, -C140Y, or -S147del, treated with glial cell line-derived neurotrophic factor (GDNF) (100 ng/ml) for 10 min and stained for RET (red) and EEA1 (blue). White puncta (white arrows) indicate RET, TMEM127-WT, and EEA1 colocalization. Colocalization of RET and EEA1 but not TMEM127 in cells expressing TMEM127-C140Y or TMEM127-S147del mutants is indicated with white triangles. Representative images from 14 to 25 cells per condition. Scale bars = 5 μm. Zoom box = 15 μm × 22 μm.
-
Figure 1—source data 1
Excel file of TMEM127 and EEA1 colocalization quantification analyses shown in Figure 1B.
- https://cdn.elifesciences.org/articles/89100/elife-89100-fig1-data1-v1.zip
Figure 2 with 2 supplements
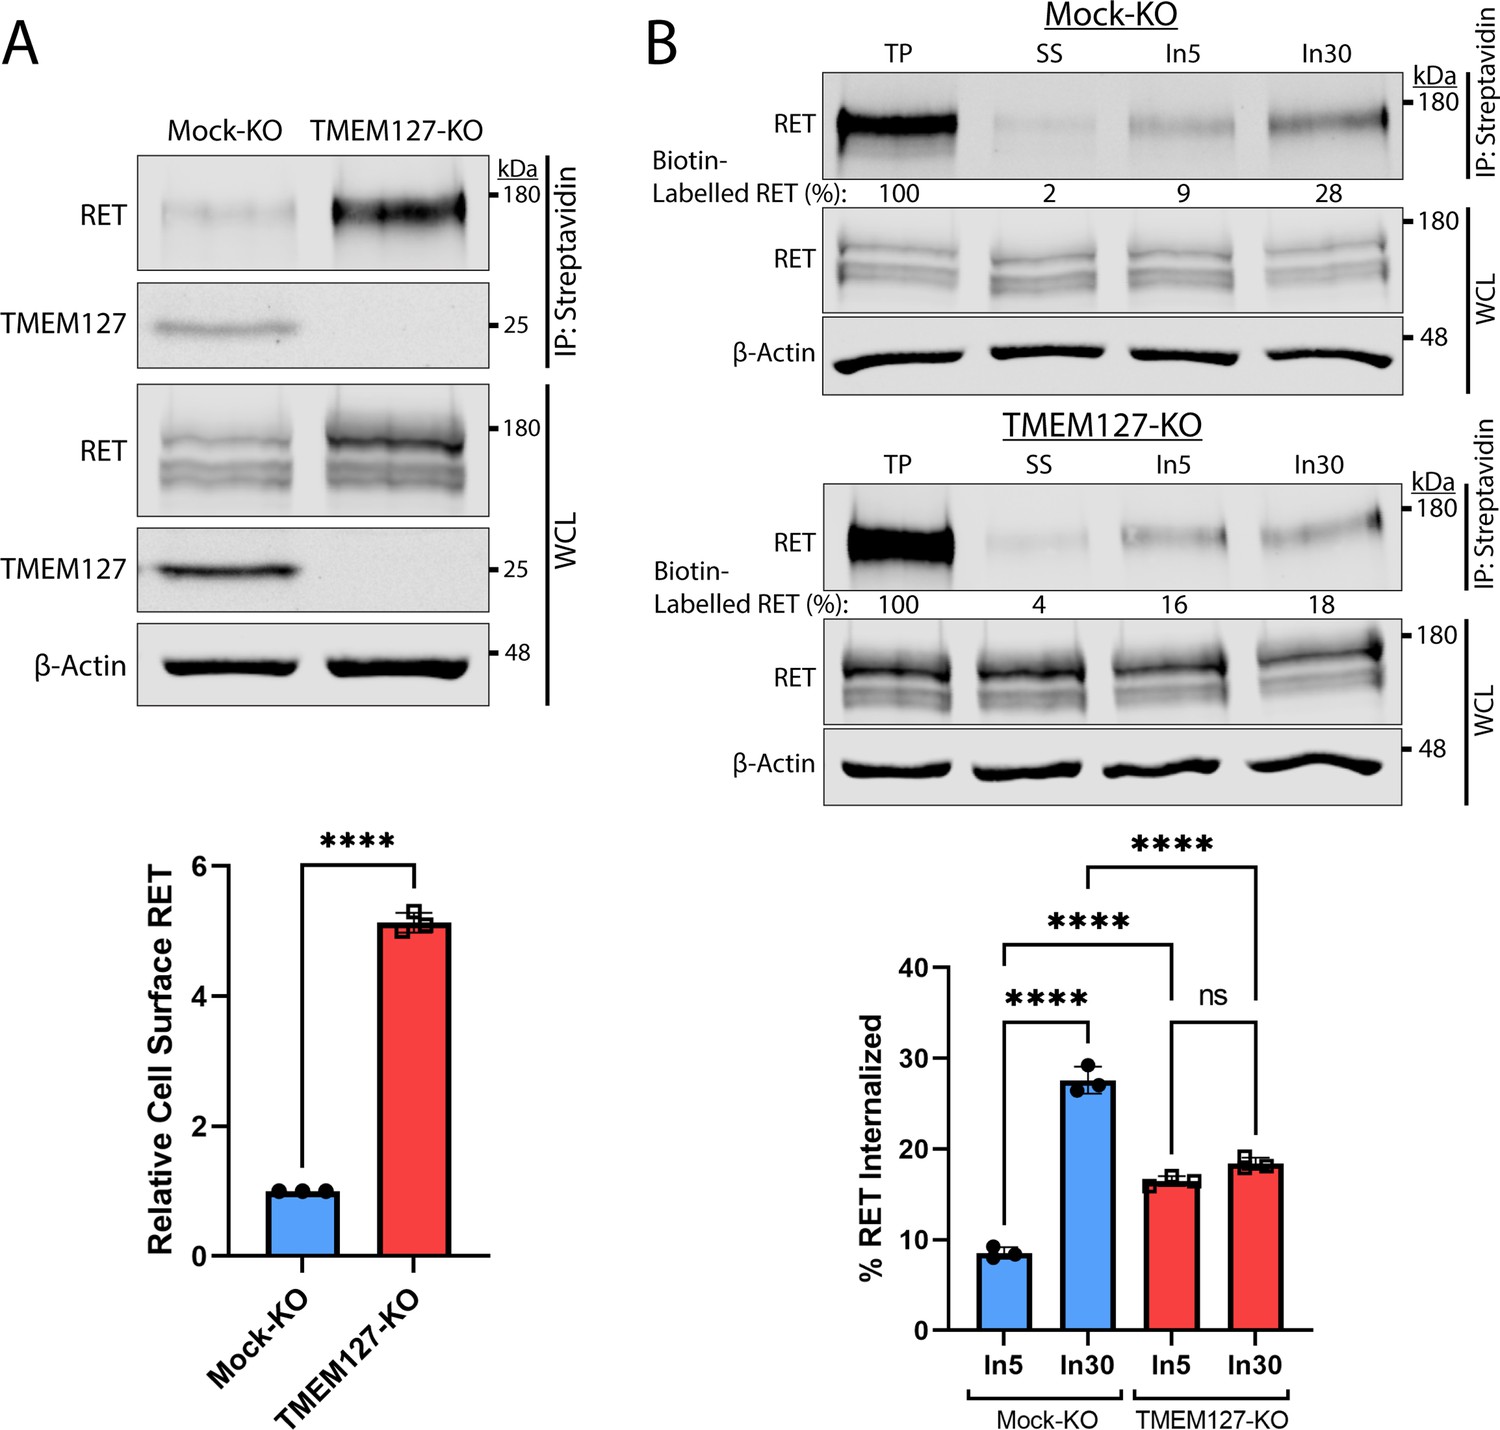
Rearranged during transfection (RET) accumulates on the cell surface due to reduced internalization in the absence of TMEM127.
(A) Immunoblot showing total and cell surface biotinylated RET and TMEM127 proteins in Mock-KO and TMEM127-KO SH-SY5Y cells. Surface proteins were biotinylated and collected by streptavidin immunoprecipitation (IP: streptavidin). Whole cell lysate (WCL) and IP samples were separated by SDS-PAGE and immunoblotted for RET and TMEM127 (upper panel). β-Actin was used as a loading control. Biotinylated cell surface RET levels (IP) were normalized to total RET (WCL) and expressed relative to Mock-KO (bottom panel). Fold increase in relative surface RET is indicated for TMEM-KO cells. Three independent experiments (n=3) are shown as mean ± SD (two-tailed unpaired t-test; ****p<0.0001). (B) Immunoblots showing internalization of biotinylated cell surface RET protein in Mock-KO and TMEM127-KO SH-SY5Y cells (top). Surface proteins were biotin labeled (TP, total protein) and either cell surface biotin stripped (SS, surface strip control) or incubated at 37°C with glial cell line-derived neurotrophic factor (GDNF) (100 ng/ml) for 5 (In5) or 30 (In30) min to allow internalization, and remaining cell surface biotin was stripped. Biotinylated proteins were collected, separated, and immunoblotted as in (A). β-Actin was used as a loading control. Mean ± SD of internalized biotinylated RET, relative to TP of three independent experiments (n=3) are shown in the bottom panel (one-way ANOVA and Tukey’s multiple comparisons test; ****p<0.0001).
-
Figure 2—source data 1
Excel file of immunoblot quantification analyses shown in Figure 2.
- https://cdn.elifesciences.org/articles/89100/elife-89100-fig2-data1-v1.zip
-
Figure 2—source data 2
Original files for immunoblot analysis shown in Figure 2.
Image Studio Lite files contain a histogram of signal and individual image brightness was adjusted for each protein of interest and shown separately.
- https://cdn.elifesciences.org/articles/89100/elife-89100-fig2-data2-v1.zip
-
Figure 2—source data 3
Labeled file for immunoblot analysis shown in Figure 2.
- https://cdn.elifesciences.org/articles/89100/elife-89100-fig2-data3-v1.zip
Figure 2—figure supplement 1
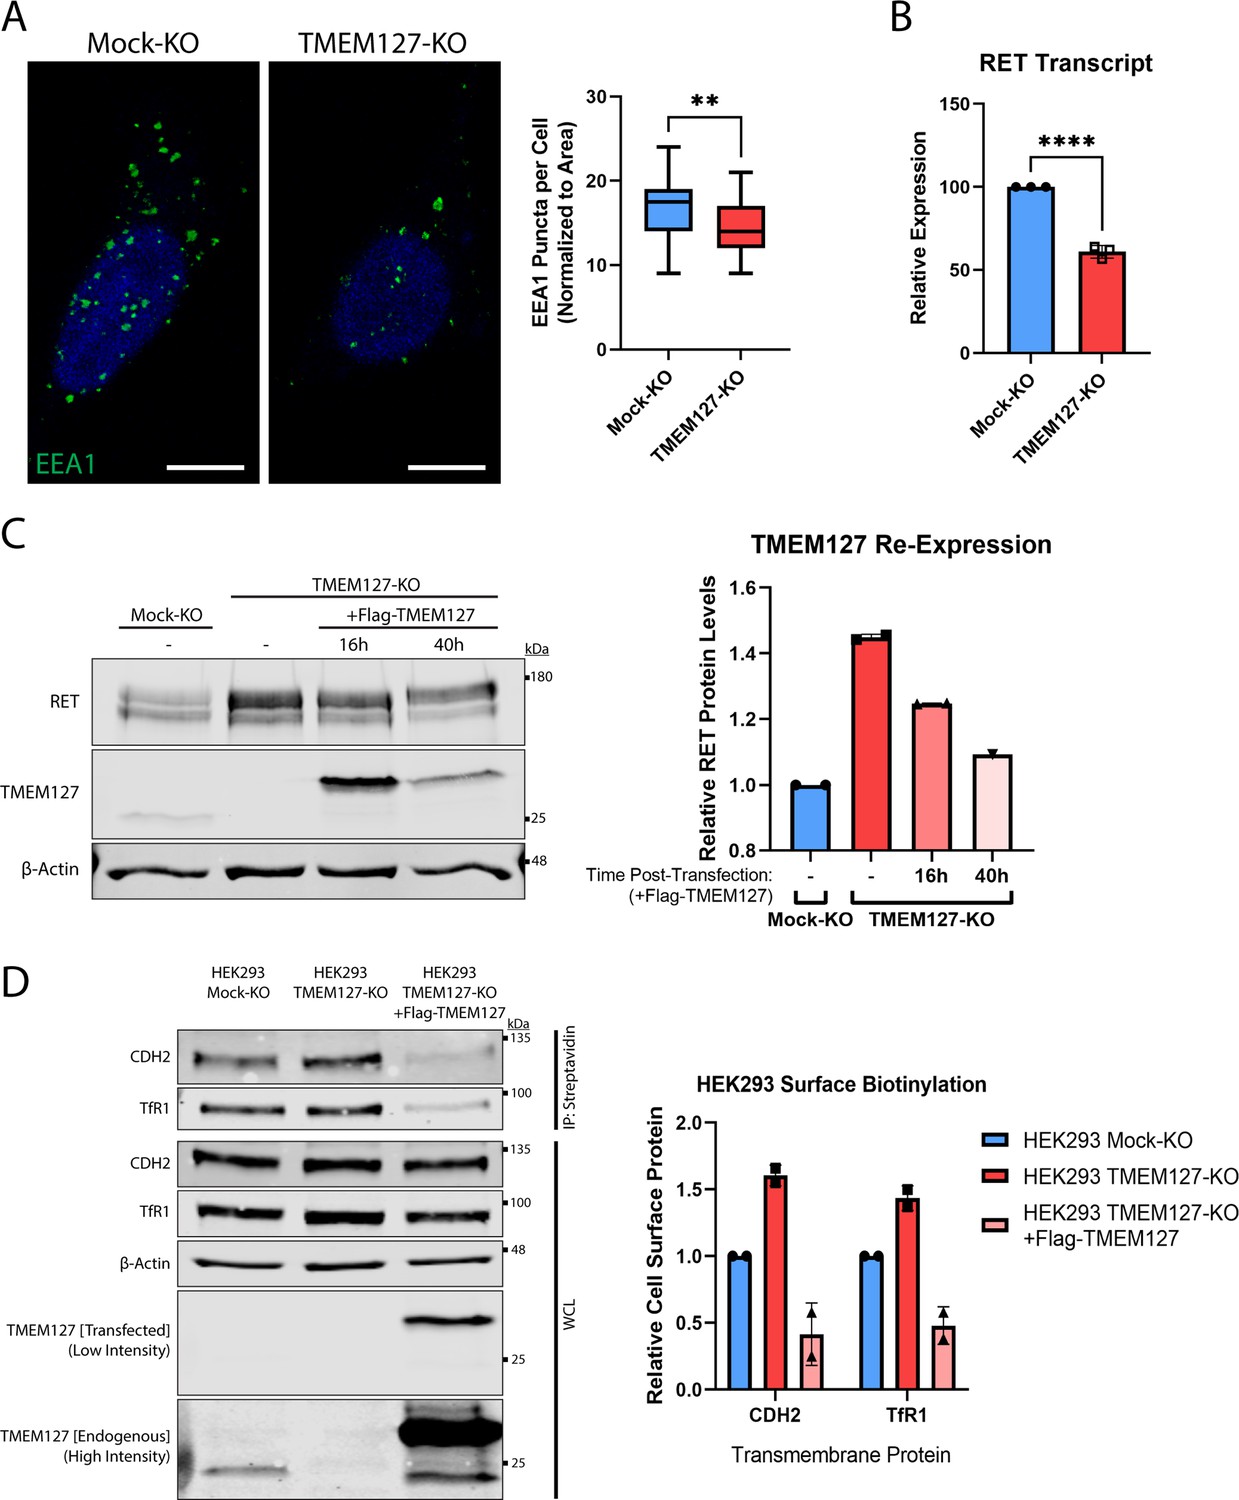
Characterization of TMEM127-KO cells.
(A) Immunofluorescence confocal images (left panel) of Mock-KO and TMEM127-KO SH-SY5Y cells stained for early endosome marker EEA1 (green) and Hoechst nuclear stain (blue). Quantification of EEA1 puncta per cell (right panel), normalized to cell area, of n=32–43 cells per condition are shown (two-tailed unpaired t-test; **p<0.01). Scale bars = 5 μm. (B) Quantification of rearranged during transfection (RET) transcripts by qRT-PCR of RNA isolated from Mock-KO and TMEM127-KO SH-SY5Y cells as previously described (Richardson et al., 2009). RET transcript levels are expressed relative to Mock-KO cells. Three independent experiments (n=3) are shown as mean ± SD (two-tailed unpaired t-test; ****p<0.0001). (C) Immunoblots showing RET protein expression in Mock-KO and TMEM127-KO SH-SY5Y cells (left panel) upon transient re-expression of Flag-tagged wildtype TMEM127 (+Flag-TMEM127). Period following initial transfection indicated in hours (h). Quantification of RET protein levels normalized to β-Actin loading control and expressed relative to Mock-KO (right panel). RET protein levels in TMEM127-KO decrease and approach Mock-KO cell levels with longer transient TMEM127 expression. Rescue limited by relatively low transfection efficiency in SH-SY5Y cells. (D) Immunoblots showing the indicated total and cell surface biotinylated transmembrane proteins in Mock-KO and in TMEM127-KO HEK293 cells with and without add back of wildtype TMEM127 (+Flag-TMEM127) (left panel). High- and low-intensity images of a single blot show differential levels of endogenous and transfected Flag-TMEM127. β-Actin was used as a loading control. Biotinylated proteins N-cadherin (CDH2) and transferrin receptor-1 (TfR1) were collected, separated, and immunoblotted as in Figure 2A. Quantification of biotinylated cell surface protein levels (immunoprecipitation [IP]) normalized to corresponding total protein (whole cell lysate [WCL]) and expressed relative to Mock-KO for each protein is shown (right panel).
-
Figure 2—figure supplement 1—source data 1
Excel file of EEA1 puncta, rearranged during transfection (RET) transcript, and immunoblot quantification analyses shown in Figure 2—figure supplement 1.
- https://cdn.elifesciences.org/articles/89100/elife-89100-fig2-figsupp1-data1-v1.zip
-
Figure 2—figure supplement 1—source data 2
Original files for immunoblot analyses in Figure 2—figure supplement 1C and D.
Image Studio Lite files contain a histogram of signal and individual image brightness was adjusted for each protein of interest and shown separately.
- https://cdn.elifesciences.org/articles/89100/elife-89100-fig2-figsupp1-data2-v1.zip
-
Figure 2—figure supplement 1—source data 3
Labeled file for immunoblot analyses shown in Figure 2—figure supplement 1C and D.
- https://cdn.elifesciences.org/articles/89100/elife-89100-fig2-figsupp1-data3-v1.zip
Figure 2—figure supplement 2
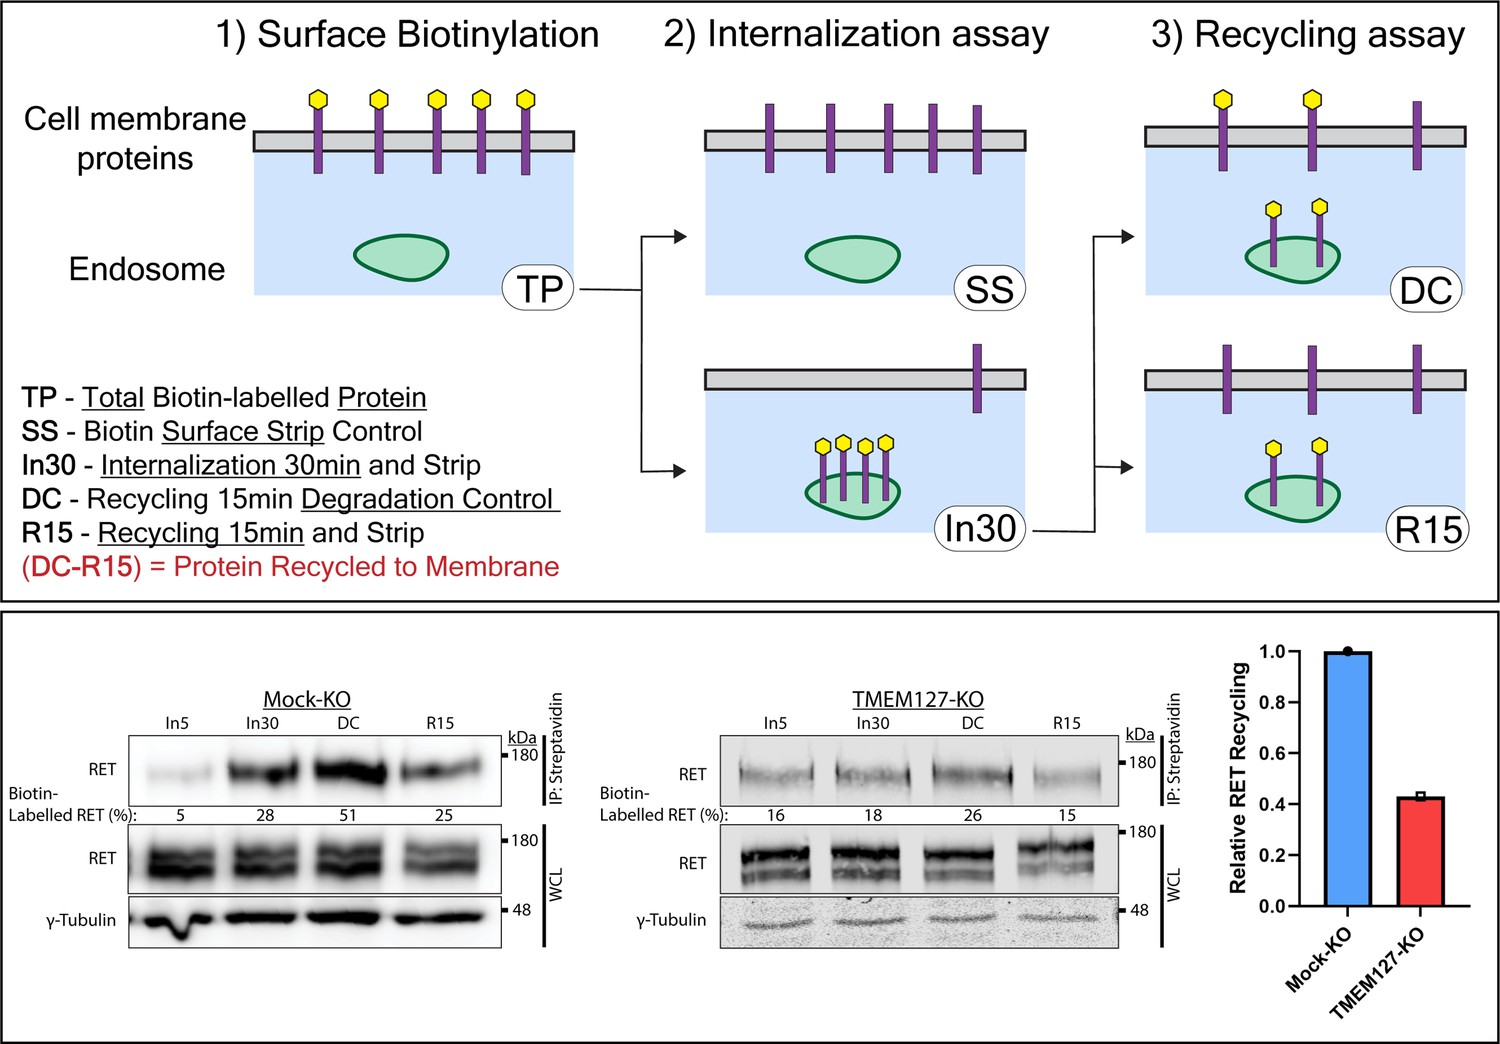
Rearranged during transfection (RET) recycling is reduced in the absence of TMEM127.
The recycling assay is an extension of the internalization assay shown in Figure 2B, where an additional incubation allows for receptor recycling back to the cell membrane. (Upper panel) Diagram of biotin assay workflow. Surface proteins are biotin labeled (TP, total protein) and either stripped of cell surface biotin immediately (SS, surface strip control) or incubated at 37°C with ligand for 30 min (In30) to allow internalization, and remaining cell surface biotin is stripped. To evaluate recycling, In30 cells undergo an additional 15 min incubation to allow protein recycling to the membrane (DC, degradation control) followed by another biotin stripping step (R15, recycling 15 min). The portion of RET receptors recycled is represented by the difference in intensity between DC and R15. (Lower panel) Immunoblots showing recycling of biotinylated cell surface RET protein in Mock-KO (left) and TMEM127-KO (middle) SH-SY5Y cells. Biotinylated proteins were collected, separated, and immunoblotted as in Figure 2A. γ-Tubulin was used as a loading control. Quantification of RET recycling (right) shown relative to Mock-KO cells.
-
Figure 2—figure supplement 2—source data 1
Excel file of immunoblot quantification analyses shown in Figure 2—figure supplement 2.
- https://cdn.elifesciences.org/articles/89100/elife-89100-fig2-figsupp2-data1-v1.zip
-
Figure 2—figure supplement 2—source data 2
Original files for immunoblot analysis in Figure 2—figure supplement 2.
Image Studio Lite files contain a histogram of signal and individual image brightness was adjusted for each protein of interest and shown separately.
- https://cdn.elifesciences.org/articles/89100/elife-89100-fig2-figsupp2-data2-v1.zip
-
Figure 2—figure supplement 2—source data 3
Labeled file for immunoblot analysis shown in Figure 2—figure supplement 2.
- https://cdn.elifesciences.org/articles/89100/elife-89100-fig2-figsupp2-data3-v1.zip
Figure 3
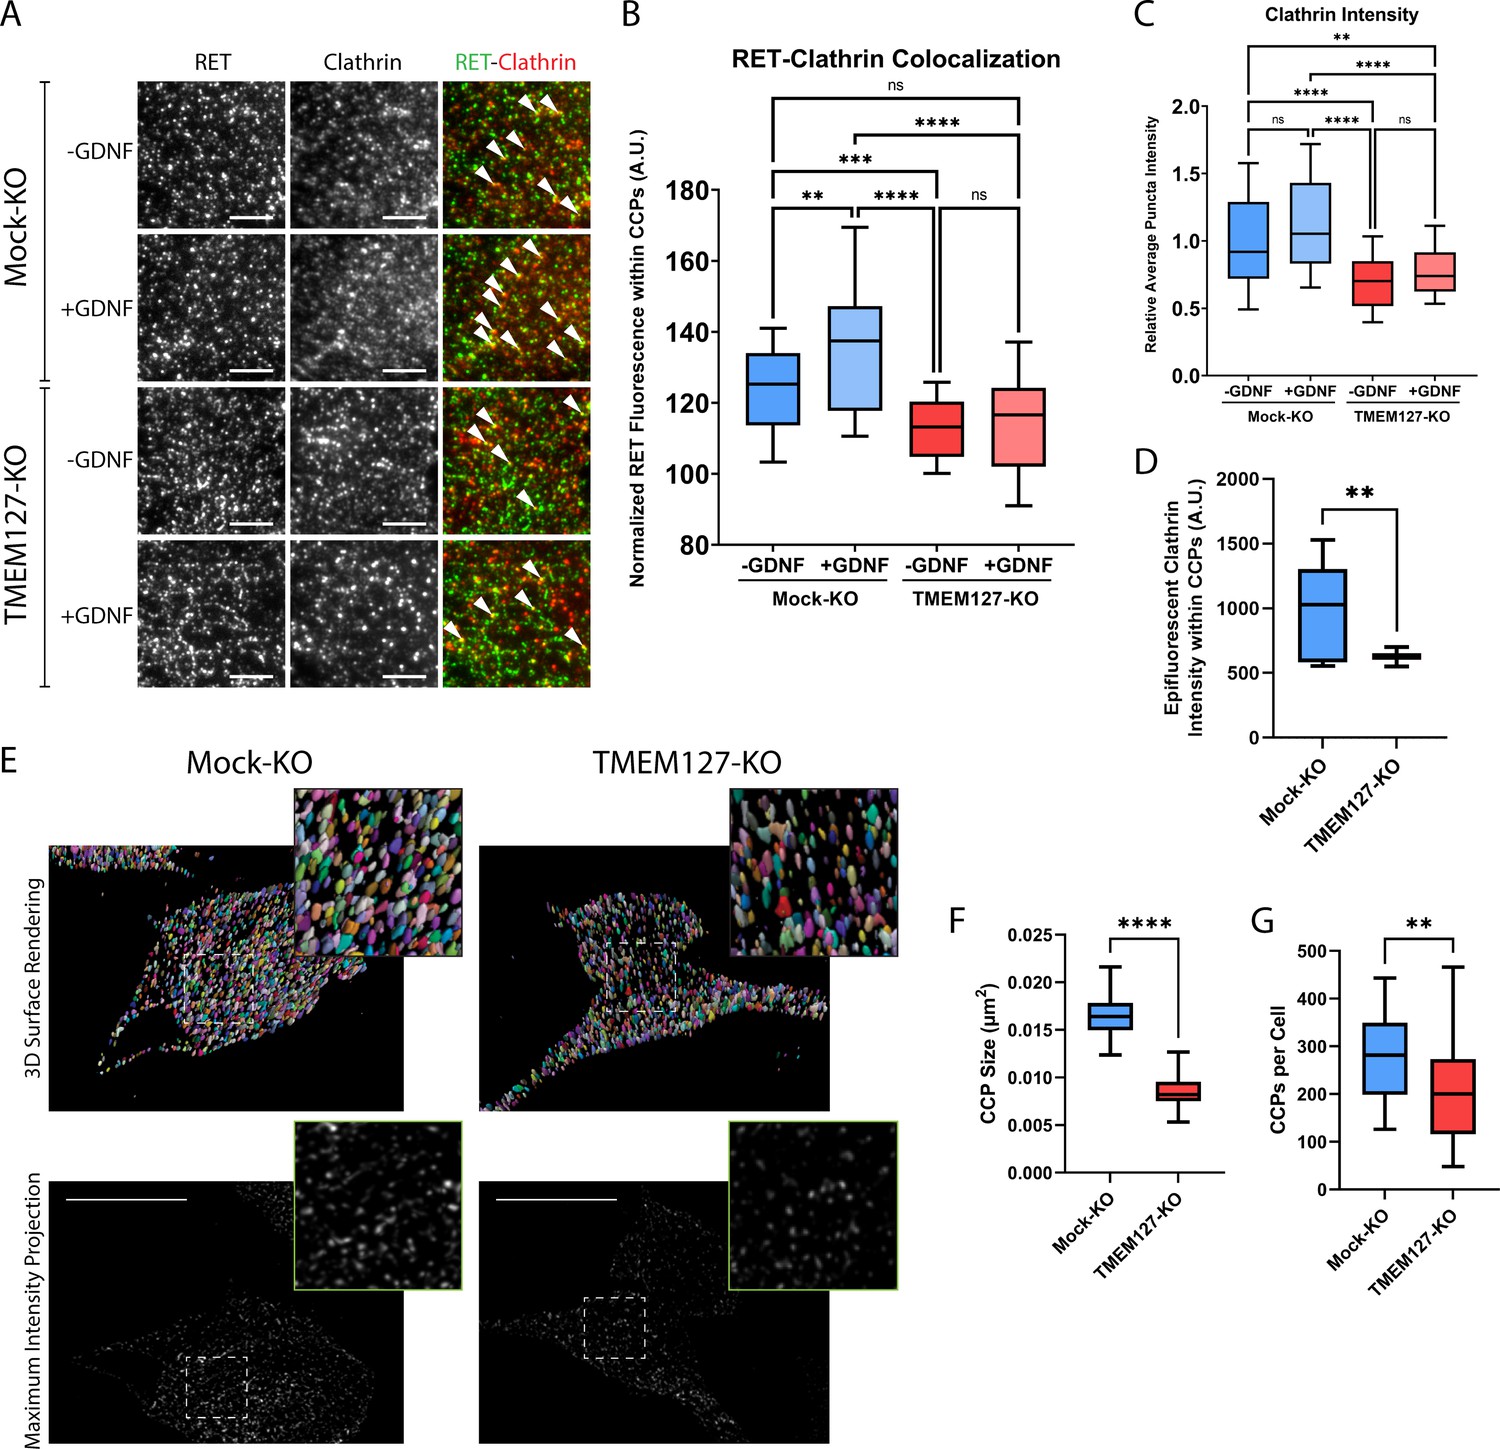
Rearranged during transfection (RET) colocalization with cell surface clathrin is reduced and clathrin-coated pits (CCPs) are smaller in TMEM127-depleted cells.
(A) Representative images of RET and clathrin localization in Mock-KO and TMEM127-KO SH-SY5Y cells treated with (+) or without (-) glial cell line-derived neurotrophic factor (GDNF) (100 ng/ml) for 5 min, fixed and labeled with indicated antibodies, and imaged by total internal reflection fluorescence microscopy (TIRFM). Colocalization of RET and clathrin was detected as yellow puncta (white triangles). Scale bars = 3 μm. (B–D) Images represented in (A) were subjected to automated detection of CCPs followed by quantification of the mean fluorescence intensity of RET, clathrin, or epifluorescent clathrin therein. (B) Mean RET fluorescence within CCPs, normalized to average RET puncta intensity, representing RET and clathrin colocalization. Data from n=30 cells representing a minimum of 5100 CCPs per condition are shown from four independent experiments (Brown-Forsythe and Welch ANOVA tests and Dunnett’s T3 multiple comparisons test; **p<0.01, ***p<0.001, ****p<0.0001). (C) Average clathrin puncta intensity is shown relative to the Mock-KO (-GDNF) condition. Data from n=50 cells representing a minimum of 8700 CCPs per condition are shown from four independent experiments (Kruskal-Wallis test and Dunn’s multiple comparisons test; **p<0.01, ****p<0.0001). (D) Mean epifluorescent clathrin intensity within CCPs detected by TIRF, representing intensity extending into the cell, indicating CCP depth. Data from n=34–52 cells per condition are shown from four independent experiments, representing a minimum of 8400 CCPs per condition (two-tailed Mann-Whitney test, **p<0.01). (E–G) Structured illumination microscopy (SIM) imaging of EGFP-tagged clathrin light chain (EGFP-CLC) stably expressed in fixed Mock-KO and TMEM127-KO SH-SY5Y cells. (E) Representative images of 3D renders (upper panel) of entire cells of maximum intensity projections (lower panel) of CCPs in and near the membrane closest to the coverslip. Scale bars = 10 μm. (F) CCP area was measured and plotted (μm2) and (G) number of CCPs per cell was also calculated for n=26–55 cells representing a minimum of 6800 CCPs per condition from three independent experiments (two-tailed Mann-Whitney test; **p<0.01, ****p<0.0001).
-
Figure 3—source data 1
Excel file of total internal reflection fluorescence (TIRF) data and clathrin-coated pit (CCP) quantification analyses shown in Figure 3.
- https://cdn.elifesciences.org/articles/89100/elife-89100-fig3-data1-v1.zip
Figure 4

TMEM127 depletion leads to cell surface accumulation of transmembrane proteins.
(A) Total internal reflection fluorescence microscopy (TIRFM) images represented in Figure 3A were subjected to automated detection of rearranged during transfection (RET) puncta. Average RET puncta intensity is shown relative to the Mock-KO (-GDNF [glial cell line-derived neurotrophic factor]) condition. Data from n=50 cells representing a minimum of 12,000 RET puncta per condition are shown from four independent experiments (Kruskal-Wallis test and Dunn’s multiple comparisons test; **p<0.01, ***p<0.001, ****p<0.0001). (B) TIRFM images of Mock-KO and TMEM127-KO SH-SY5Y cells were subjected to automated detection of EGFR puncta. Average EGFR puncta intensity is shown relative to the Mock-KO (-GDNF) condition. Data from n=30 cells representing a minimum of 4600 EGFR puncta per condition are shown from two independent experiments (Brown-Forsythe and Welch ANOVA tests and Dunnett’s T3 multiple comparisons test; **p<0.01, ****p<0.0001). (C) Immunoblot showing the indicated total and cell surface biotinylated transmembrane proteins in Mock-KO and TMEM127-KO SH-SY5Y cells. Biotinylated proteins include RET, EGFR, N-cadherin (CDH2), integrin beta-3 (ITGB3), and transferrin receptor-1 (TfR1). Biotinylated proteins were collected, separated, and immunoblotted as in Figure 2A. (D) Quantification of relative cell surface protein levels detected in C. Biotinylated cell surface protein levels (immunoprecipitation [IP]) were normalized to corresponding total protein (whole cell lysate [WCL]) and expressed relative to Mock-KO for each protein. Three independent experiments (n=3) are shown as mean ± SD (two-tailed unpaired t-tests with Welch’s correction; *p<0.05, **p<0.01).
-
Figure 4—source data 1
Excel file of rearranged during transfection (RET) and EGFR total internal reflection fluorescence (TIRF) intensity and immunoblot quantification analyses shown in Figure 4.
- https://cdn.elifesciences.org/articles/89100/elife-89100-fig4-data1-v1.zip
-
Figure 4—source data 2
Original files for immunoblot analysis in Figure 4C.
Image Studio Lite files contain a histogram of signal and individual image brightness was adjusted for each protein of interest and shown separately.
- https://cdn.elifesciences.org/articles/89100/elife-89100-fig4-data2-v1.zip
-
Figure 4—source data 3
Labeled file for immunoblot analysis shown in Figure 4C.
- https://cdn.elifesciences.org/articles/89100/elife-89100-fig4-data3-v1.zip
Figure 5
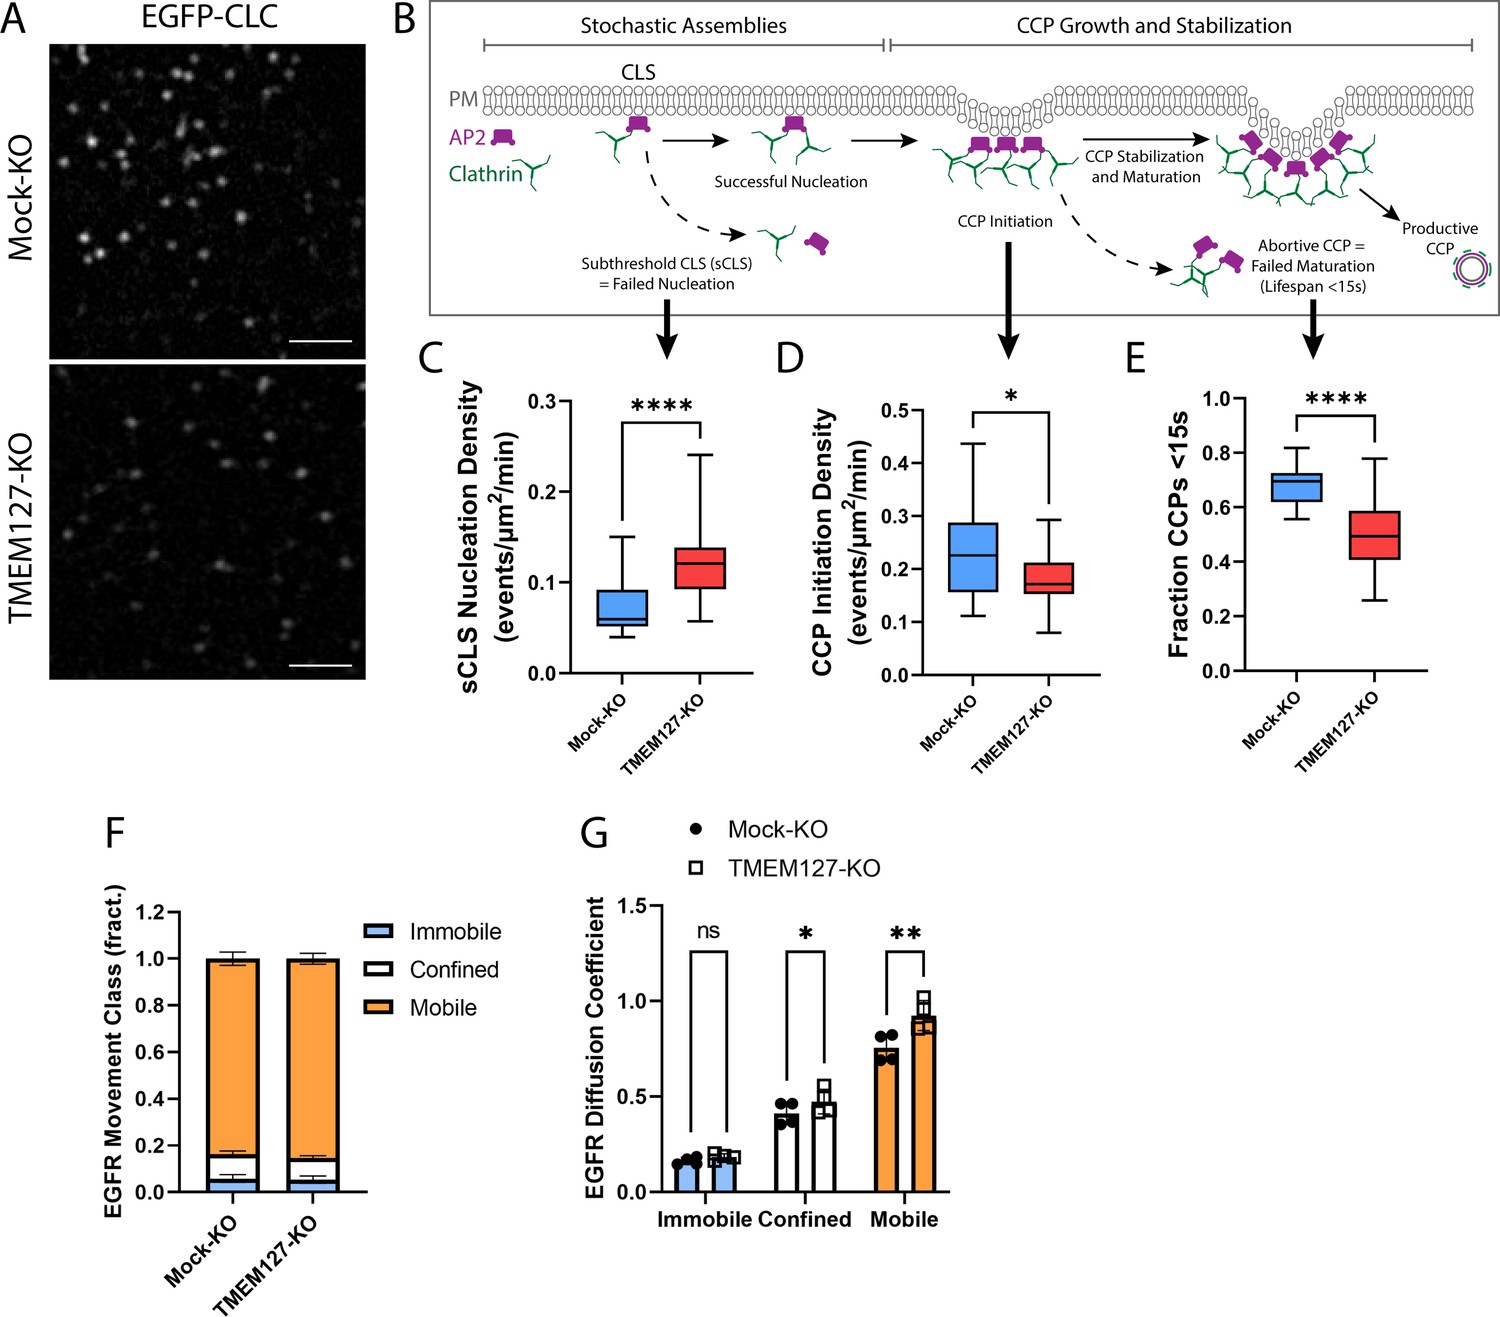
TMEM127 loss alters dynamics of clathrin-coated pit (CCP) assembly and EGFR diffusion.
Live-cell total internal reflection fluorescence microscopy (TIRFM) imaging of cell surface EGFP-tagged clathrin light chain (EGFP-CLC) stably expressed in Mock-KO and TMEM127-KO SH-SY5Y cells. (A) Representative TIRFM images of cell surface clathrin distribution. Scale bars = 2 μm. (B) Diagram of the stepwise process of CCP assembly. Plasma membrane (PM) (gray), AP2 (purple), and clathrin (green) are indicated. Stochastic assemblies of clathrin adaptor AP2 and clathrin form clathrin-labeled structures (CLS). Small structures with insufficient clathrin are unstable and may be unable to nucleate clathrin polymerization (subthreshold CLS [sCLS]) and dissipate or may successfully stimulate clathrin polymerization, leading to CCP initiation. As polymerization continues, the CCP undergoes maturation and stabilization processes required to develop a productive CCP, which functions to internalize protein cargo into the cell. Unsuccessful CCP maturation leads to abortive CCPs with lifespans <15 s. Steps relevant to graphs C–E are indicated with black arrows. (C–E) Time-lapse videos of cells (5 min @ 1 frame-per-second) were subjected to automated detection of cell membrane clathrin structures, which included sCLS and bona fide CCPs. (C) sCLS nucleation density, (D) CCP initiation density, and (E) fraction CCPs <15 s are shown. (C–E) The means of multiple time-lapse videos are shown. In three independent experiments, the number of total sCLS trajectories, CCP trajectories, and time-lapse videos (respectively) for each condition are Mock-KO, 11040, 7988, 20, and TMEM127-KO, 15598, 8393, 28 (C–D: two-tailed Mann-Whitney test, E: two-tailed unpaired t-test with Welch’s correction; *p<0.05, ****p<0.0001). (F) EGFR movement class shown as the mean ± SD fraction (fract.) of all EGFR tracks, as labeled by Fab-Cy3B, that exhibit mobile (orange), confined (white), or immobile (blue) behavior. (G) EGFR diffusion coefficient shown is mean ± SD of immobile, confined, and mobile EGFR tracks. (F–G) Data from four independent experiments representing detection and tracking of minimum 500 EGFR objects (two-tailed paired t-tests; *p<0.05, **p<0.01).
-
Figure 5—source data 1
Excel file of total internal reflection fluorescence (TIRF) data and EGFR movement quantification analyses shown in Figure 5.
- https://cdn.elifesciences.org/articles/89100/elife-89100-fig5-data1-v1.zip
Figure 6
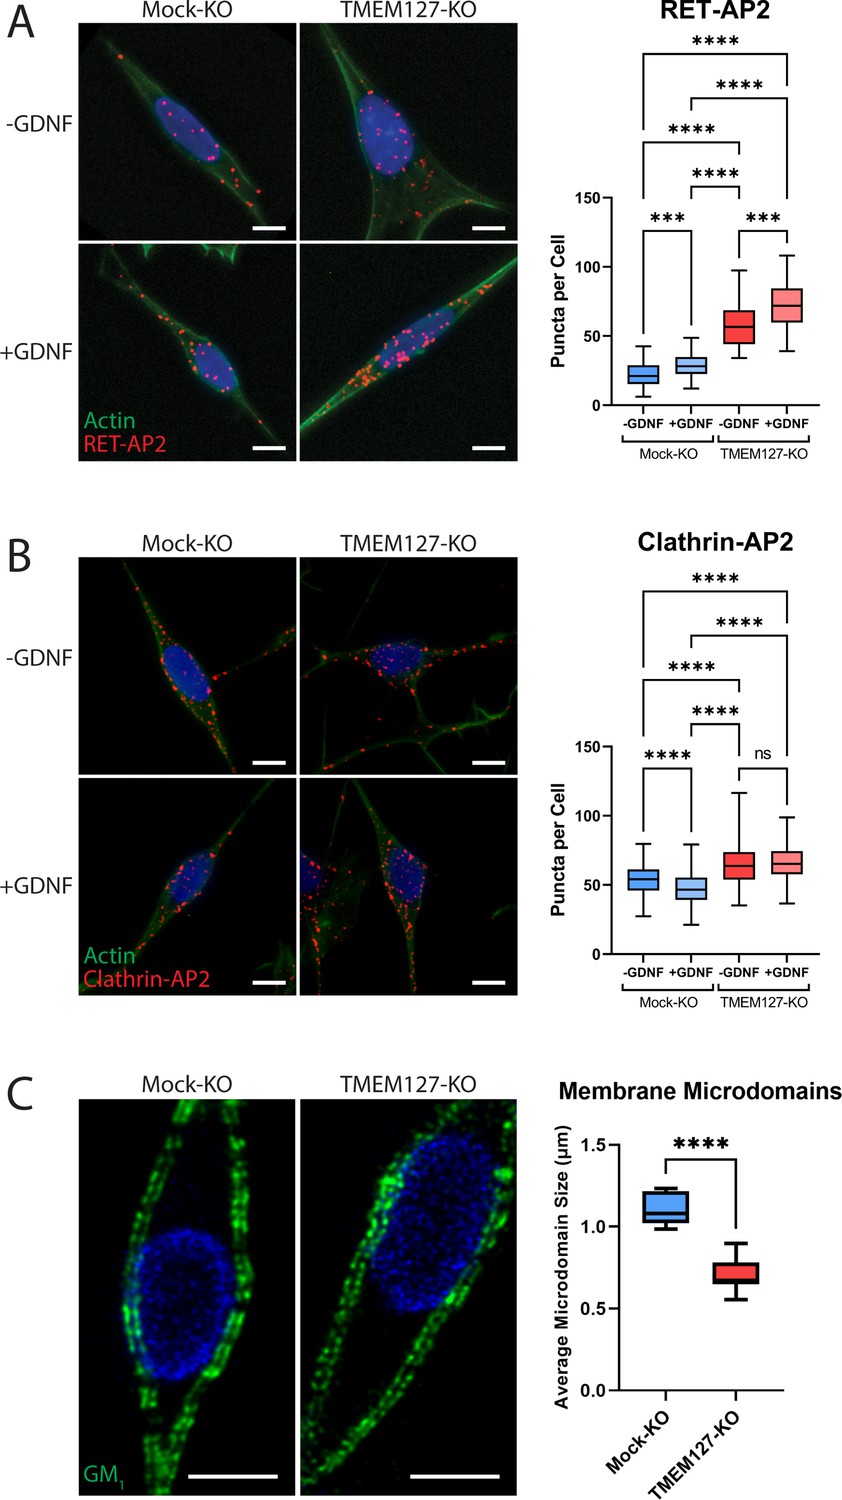
Enhanced recruitment of endocytic adaptors and disrupted membrane microdomains in TMEM127-depleted cells.
(A and B) Proximity ligation assay (PLA) of Mock-KO and TMEM127-KO SH-SY5Y cells treated with (+) or without (-) glial cell line-derived neurotrophic factor (GDNF) (100 ng/ml) for 5 min. Representative immunofluorescence images (left) of RET-AP2 (A) and clathrin-AP2 (B) interactions (red puncta). Cells were stained with phalloidin actin filament stain (green) and Hoechst nuclear stain (blue). Quantification of red puncta per cell (right), indicating individual protein interactions in each condition, are shown. Data from a minimum of 100 cells (-GDNF conditions) (A), 300 cells (+GDNF conditions) (A), or 500 cells (all conditions) (B) are shown (Kruskal-Wallis test and Dunn’s multiple comparisons test; ***p<0.001, ****p<0.0001). Scale bars = 5 μm. (C) Immunofluorescence confocal images of Mock-KO and TMEM127-KO SH-SY5Y cells (left) stained with cholera toxin subunit B, which binds ganglioside GM1-positive lipid microdomains (membrane rafts) (green), and Hoechst nuclear stain (blue). Quantification of average lipid raft size (right) of n=11–12 cells per condition are shown, representing a minimum of 500 lipid rafts per condition (two-tailed unpaired t-test; ****p<0.0001). Scale bars = 5 μm.
-
Figure 6—source data 1
Excel file of proximity ligation assay (PLA) data and membrane microdomain quantification analyses shown in Figure 6.
- https://cdn.elifesciences.org/articles/89100/elife-89100-fig6-data1-v1.zip
Figure 7
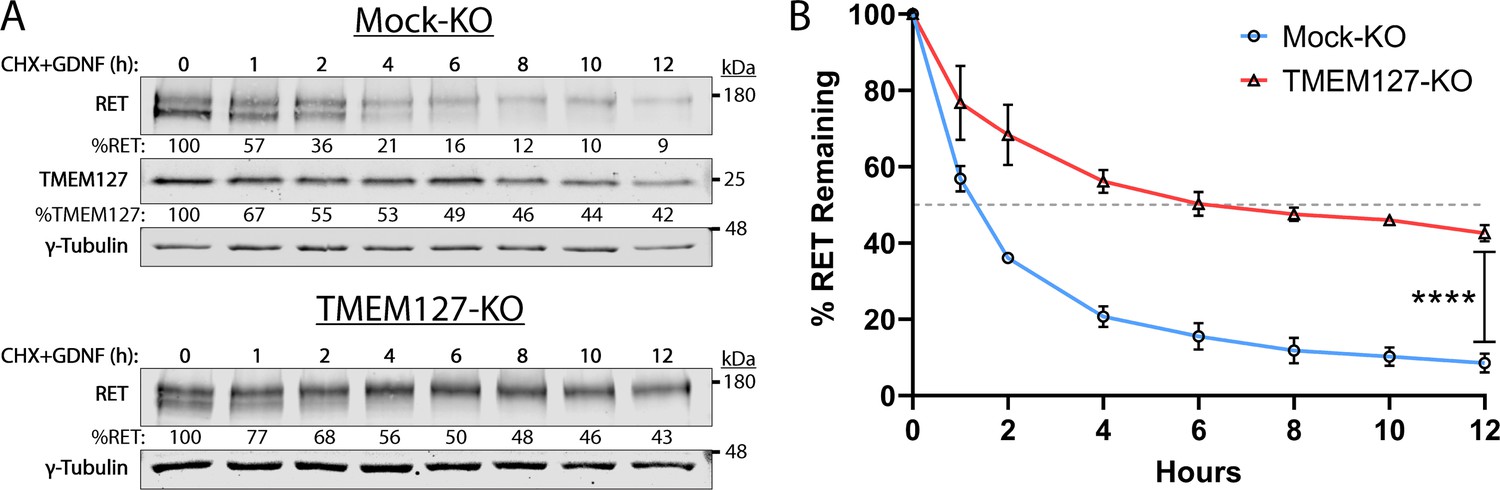
Rearranged during transfection (RET) half-life is increased when TMEM127 is depleted.
(A) Mock-KO (upper panels) and TMEM127-KO (lower panels) SH-SY5Y cells were treated with cycloheximide (CHX) and glial cell line-derived neurotrophic factor (GDNF) (100 ng/ml) for indicated times to evaluate RET and TMEM127 protein levels remaining over time. Whole cell lysates were separated by SDS-PAGE and immunoblotted for the indicated proteins. γ-Tubulin was used as a loading control. RET and TMEM127 protein remaining at each timepoint, relative to untreated levels (0 h), is indicated below each lane. (B) Quantification of RET protein remaining over time as shown in (A). The dashed line indicates 50% RET remaining. The means ± SD at each timepoint of three independent experiments (n=3) are shown (two-way ANOVA with Šídák’s multiple comparisons test; ****p<0.0001).
-
Figure 7—source data 1
Excel file of immunoblot quantification data shown in Figure 7B.
- https://cdn.elifesciences.org/articles/89100/elife-89100-fig7-data1-v1.zip
-
Figure 7—source data 2
Original files for immunoblot analysis in Figure 7A.
Image Studio Lite files contain a histogram of signal and individual image brightness was adjusted for each protein of interest and shown separately.
- https://cdn.elifesciences.org/articles/89100/elife-89100-fig7-data2-v1.zip
-
Figure 7—source data 3
Labeled file for immunoblot analysis shown in Figure 7A.
- https://cdn.elifesciences.org/articles/89100/elife-89100-fig7-data3-v1.zip
Figure 8 with 3 supplements
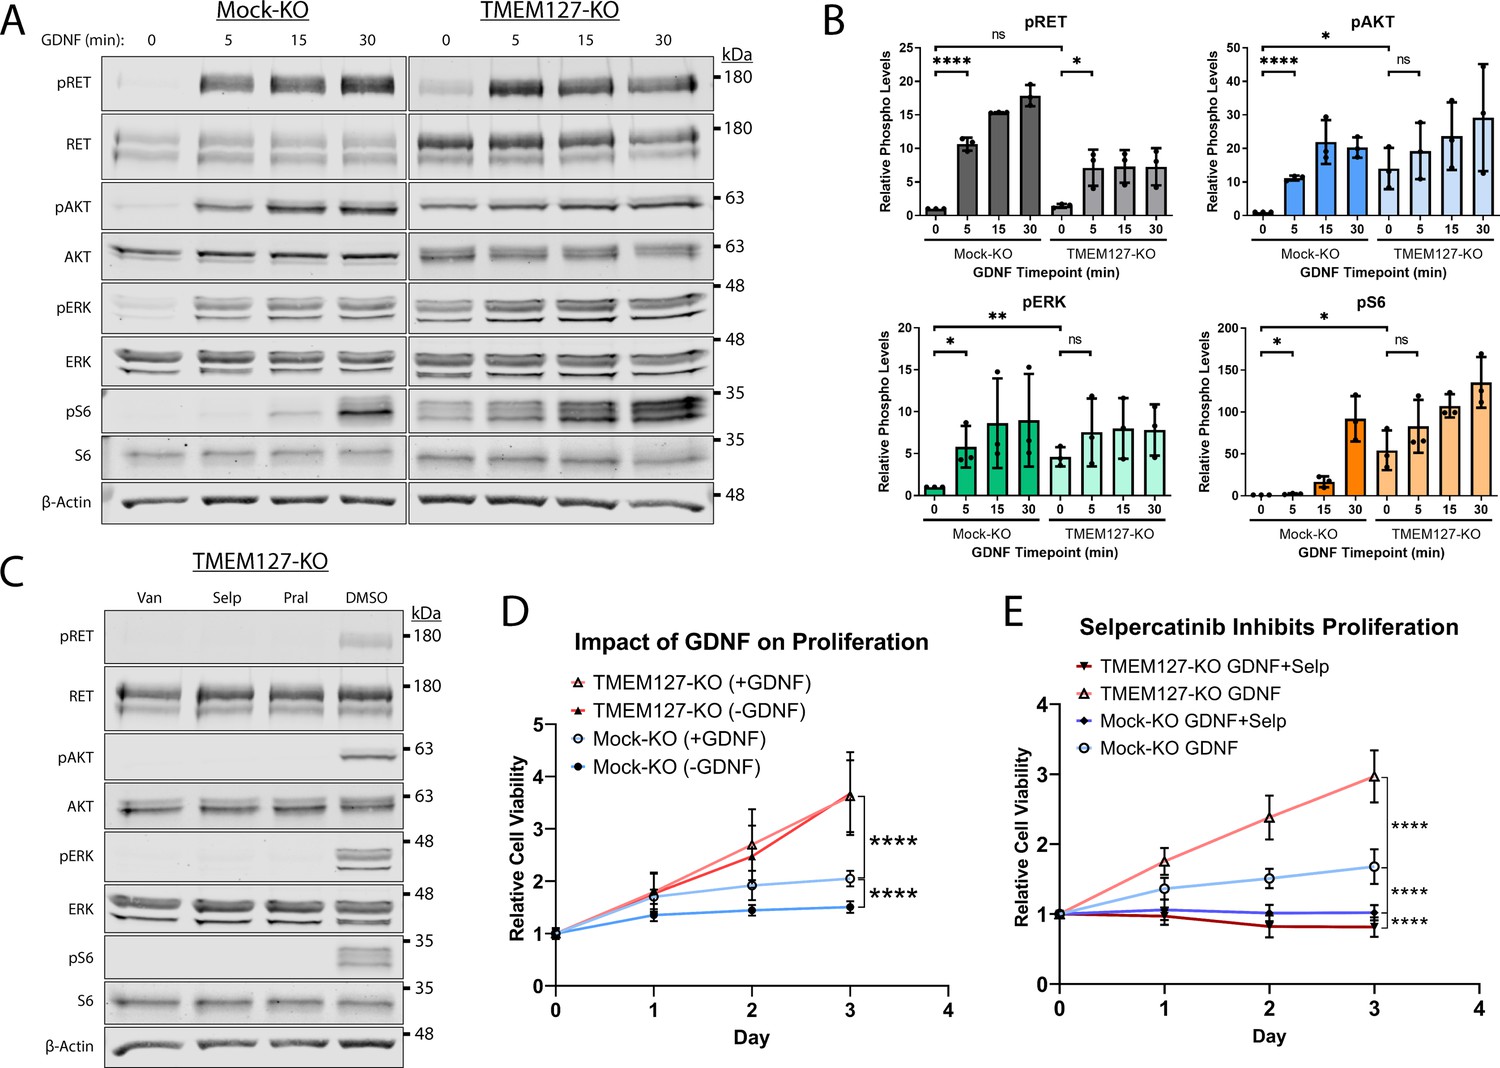
Constitutive rearranged during transfection (RET)-mediated signaling drives proliferation and confers sensitivity to selpercatinib.
(A) Mock-KO and TMEM127-KO SH-SY5Y cells were serum starved and treated with glial cell line-derived neurotrophic factor (GDNF) for the indicated times. Whole cell lysates were separated by SDS-PAGE and immunoblotted for the indicated phospho and total proteins. β-Actin was used as a loading control. (B) Quantification of phosphorylated protein levels as shown in A relative to Mock-KO 0 min condition for each protein. The means ± SD of three independent experiments (n=3) are shown (two-tailed unpaired t-tests; *p<0.05, **p<0.01, ****p<0.0001). (C) Expression of the indicated phospho and total proteins in TMEM127-KO SH-SY5Y cells treated with DMSO, 5 μM vandetanib (Van), selpercatinib (Selp), or pralsetinib (Pral) (1 hr), and immunoblotted as in (A). Constitutive phosphorylation of indicated proteins was abrogated by all three inhibitors. (D) Cell viability of Mock-KO and TMEM127-KO SH-SY5Y cells over time in the presence or absence of GDNF, relative to day 0 was measured by MTT assay as an indicator of cell proliferation. (E) Cell viability of Mock-KO and TMEM127-KO SH-SY5Y cells in the presence of GDNF (100 ng/ml) alone or GDNF+selpercatinib (0.1 μM), relative to day 0, as above. (D and E) Three independent experiments, for each graph, with 18 replicates per condition and timepoint (n=54) are shown as mean ± SD (two-way ANOVA with Tukey’s multiple comparisons test; ****p<0.0001).
-
Figure 8—source data 1
Excel file of viability assay and immunoblot quantification analyses shown in Figure 8B, D, and E.
- https://cdn.elifesciences.org/articles/89100/elife-89100-fig8-data1-v1.zip
Figure 8—figure supplement 1
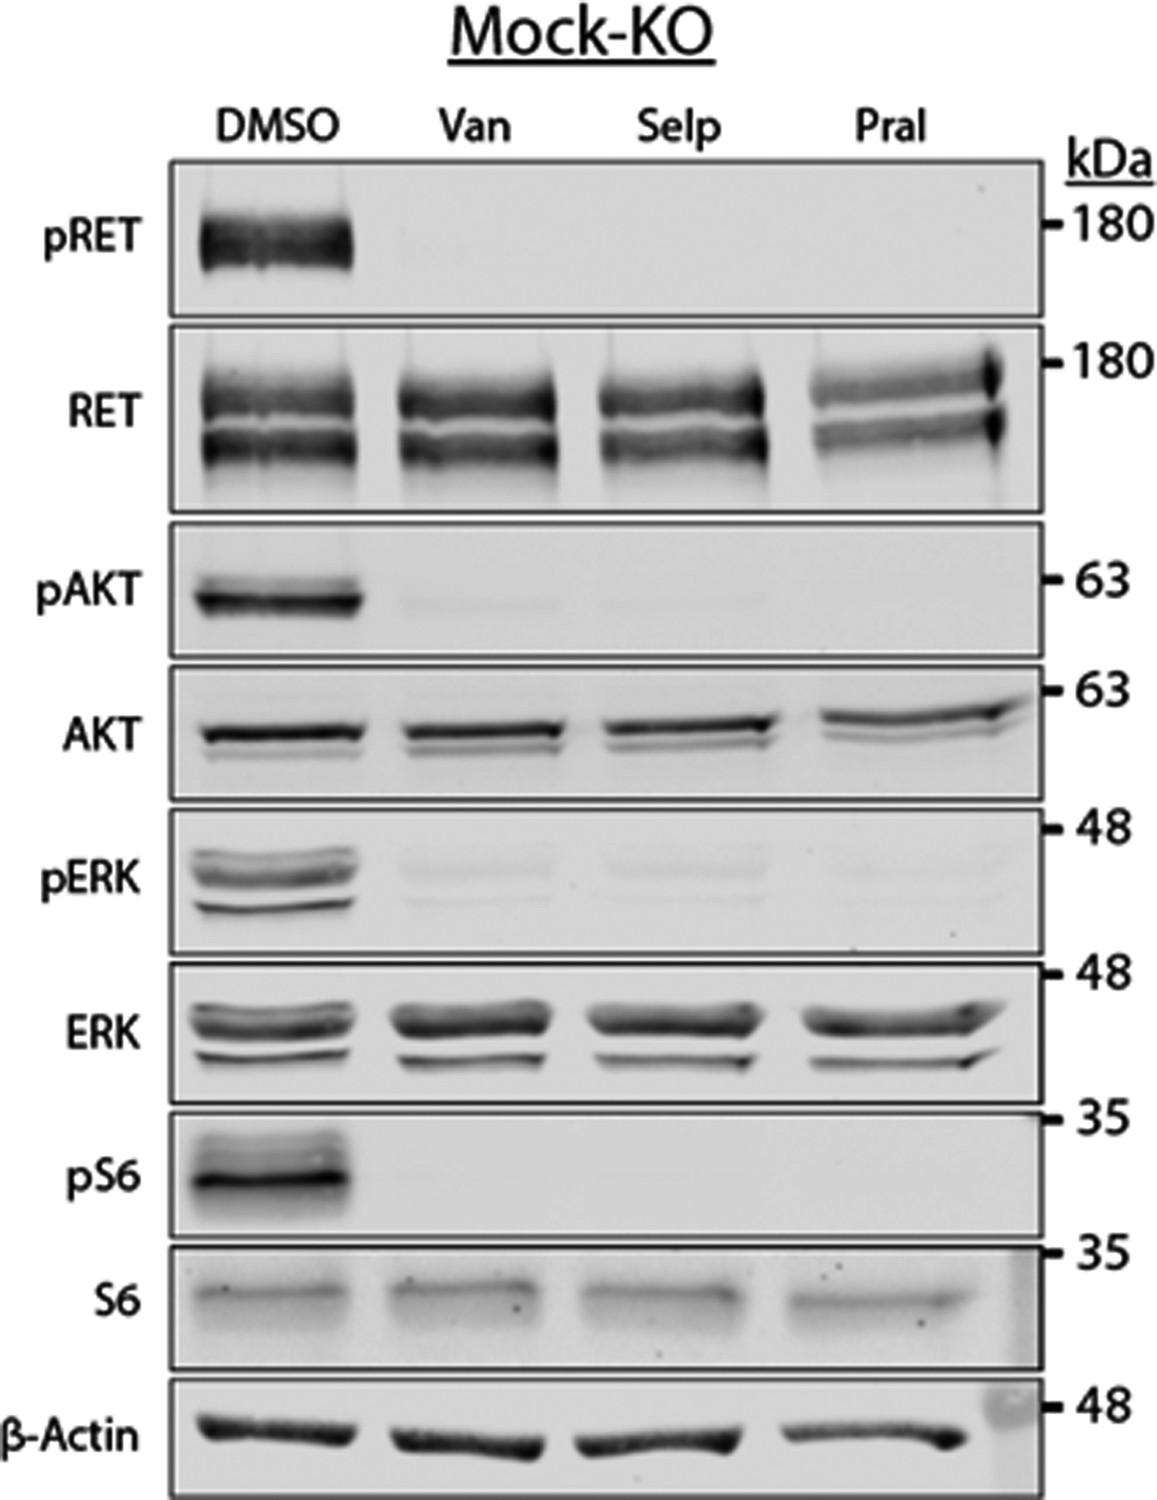
Rearranged during transfection (RET) activation promoted AKT, ERK, and S6 phosphorylation in SH-SY5Y cells.
Mock-KO SH-SY5Y cells treated with DMSO, or 5 μM vandetanib (Van), selpercatinib (Selp), or pralsetinib (Pral) (1 hr) and then glial cell line-derived neurotrophic factor (GDNF) (30 min). RET, AKT, ERK, and S6 phosphorylation was abrogated by all three inhibitors.
-
Figure 8—figure supplement 1—source data 1
Original files for immunoblot analyses shown in Figure 8A and C and Figure 8—figure supplement 1.
Image Studio Lite files contain a histogram of signal and individual image brightness was adjusted for each protein of interest and shown separately.
- https://cdn.elifesciences.org/articles/89100/elife-89100-fig8-figsupp1-data1-v1.zip
-
Figure 8—figure supplement 1—source data 2
Labeled file for immunoblot analyses shown in Figure 8A and C and Figure 8—figure supplement 1.
- https://cdn.elifesciences.org/articles/89100/elife-89100-fig8-figsupp1-data2-v1.zip
Figure 8—figure supplement 2
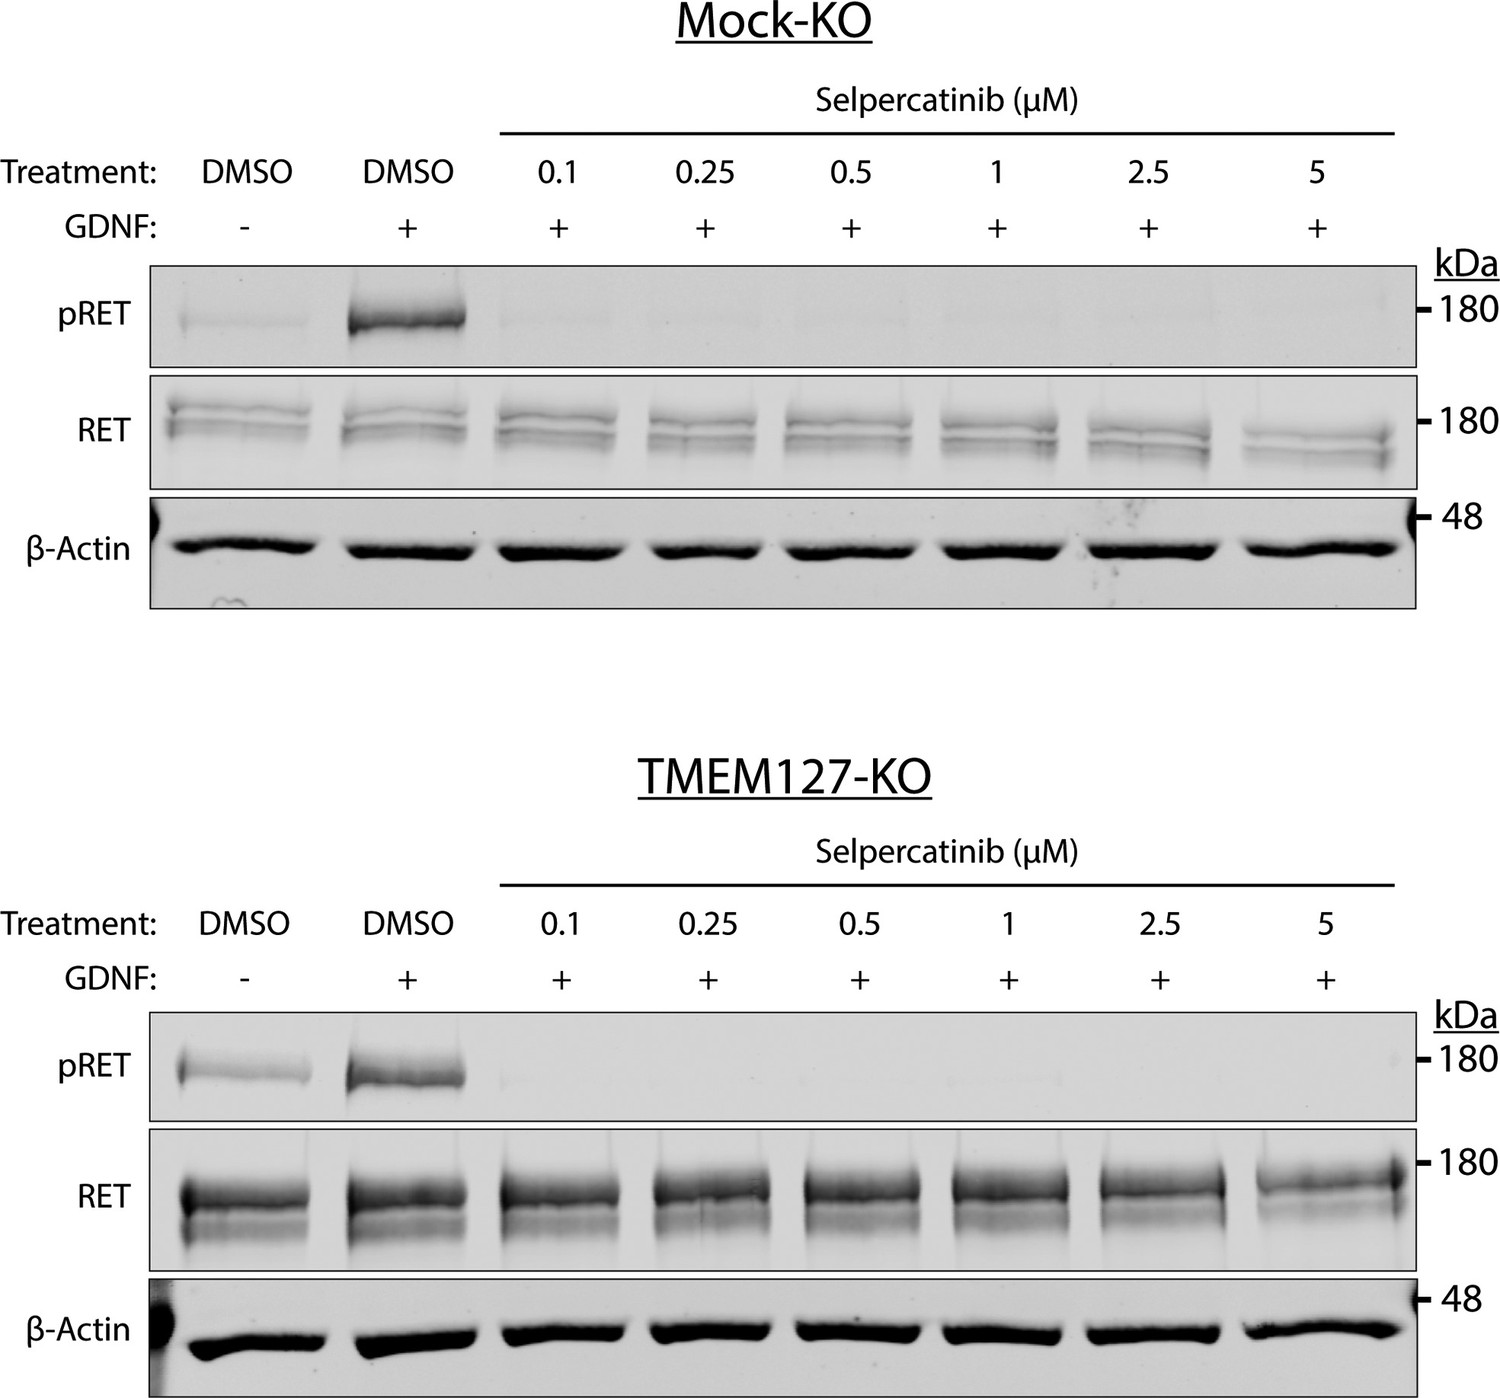
Optimization of selpercatinib concentration.
Mock-KO and TMEM127-KO SH-SY5Y cells treated with glial cell line-derived neurotrophic factor (GDNF), and DMSO or indicated concentrations of selpercatinib for 1 hr. Rearranged during transfection (RET) phosphorylation was abrogated at all concentrations tested. The lowest concentration was chosen for MTT assays (Figure 8E) to inhibit RET, while avoiding cell death due to high drug concentrations.
-
Figure 8—figure supplement 2—source data 1
Original files for immunoblot analyses in Figure 8—figure supplement 2.
Image Studio Lite files contain a histogram of signal and individual image brightness was adjusted for each protein of interest and shown separately.
- https://cdn.elifesciences.org/articles/89100/elife-89100-fig8-figsupp2-data1-v1.zip
-
Figure 8—figure supplement 2—source data 2
Labeled file for immunoblot analyses shown in Figure 8—figure supplement 2.
- https://cdn.elifesciences.org/articles/89100/elife-89100-fig8-figsupp2-data2-v1.zip
Figure 8—figure supplement 3
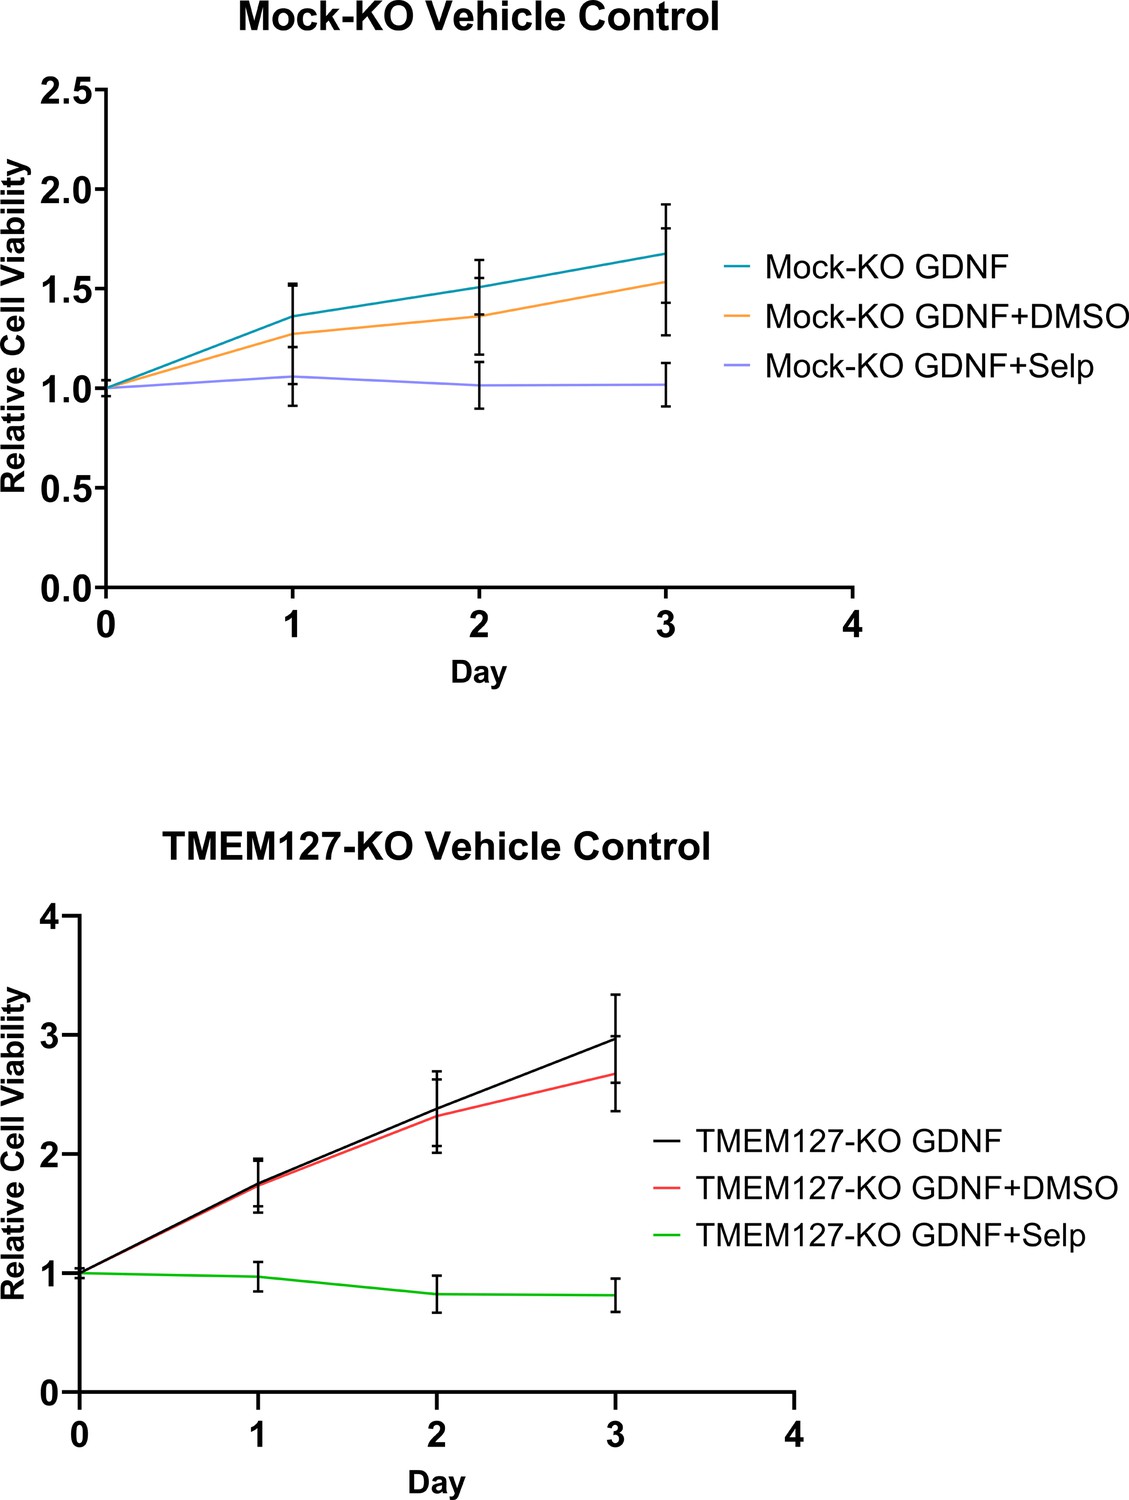
Vehicle treatment does not significantly affect SH-SY5Y cell proliferation.
MTT assay of Mock-KO and TMEM127-KO SH-SY5Y cell proliferation in the presence of glial cell line-derived neurotrophic factor (GDNF), and DMSO or selpercatinib (Selp). The mean ± SD of three independent experiments, for each graph, with 18 replicates per condition (n=54) are shown.
-
Figure 8—figure supplement 3—source data 1
Excel file of viability assay vehicle controls shown in Figure 8—figure supplement 3.
- https://cdn.elifesciences.org/articles/89100/elife-89100-fig8-figsupp3-data1-v1.zip
Figure 9
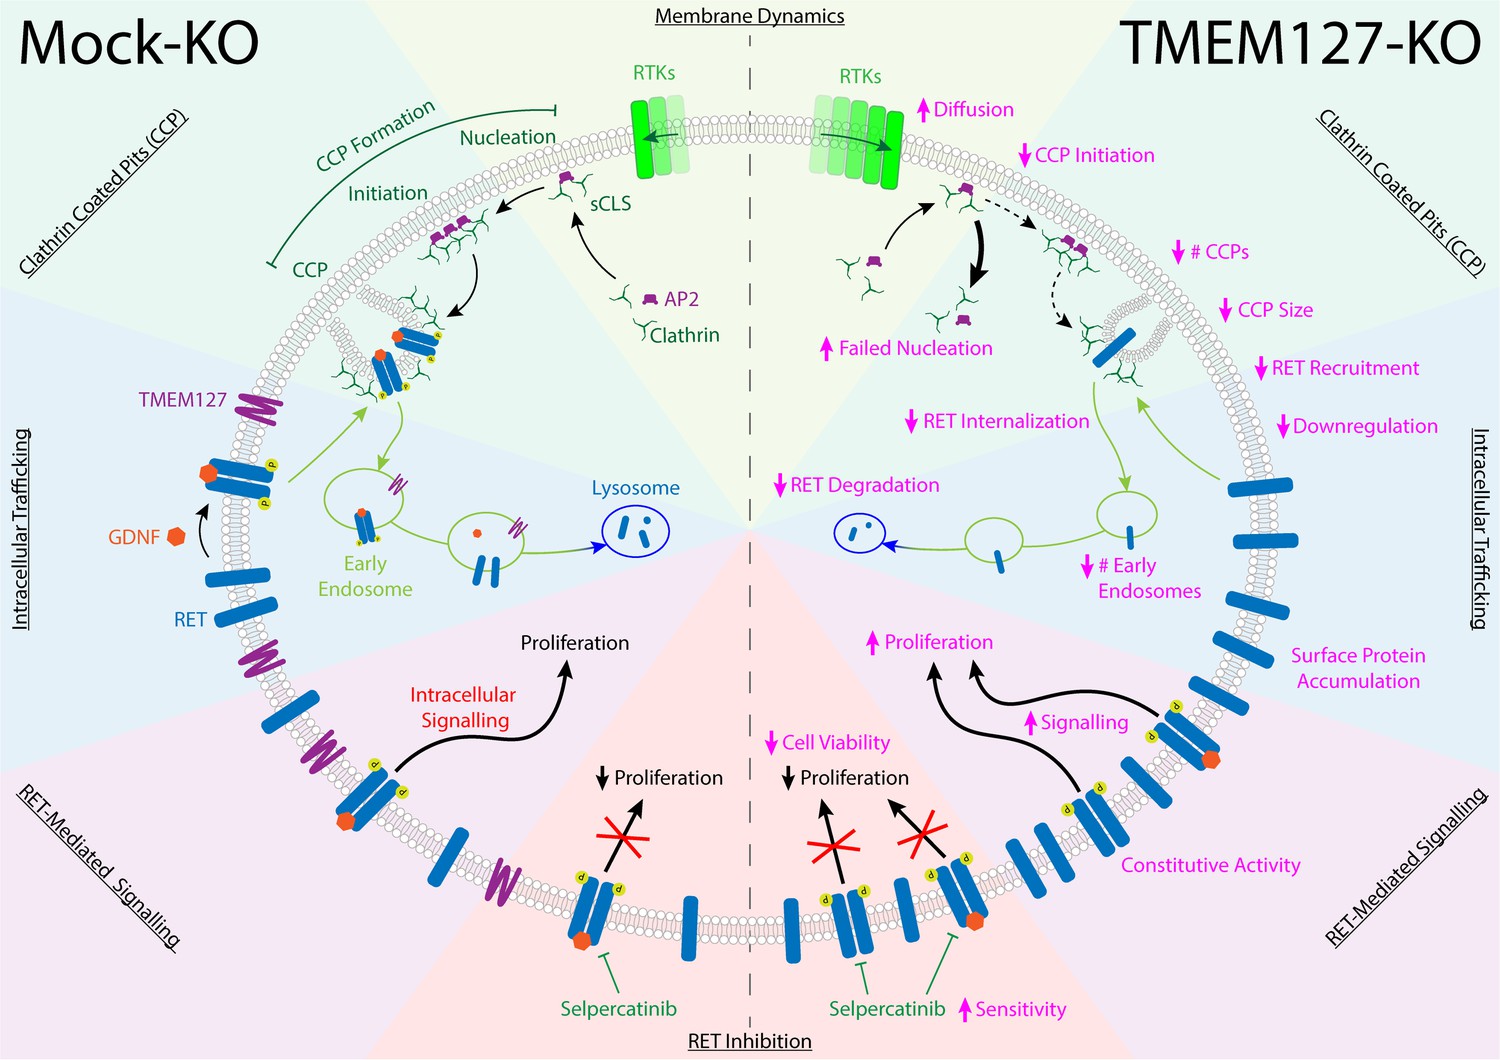
TMEM127 loss drives transformation through altered rearranged during transfection (RET) location and activity in pheochromocytoma (PCC).
TMEM127 depletion alters membrane diffusion and impairs formation of productive clathrin-coated pits (CCPs) for internalization of membrane receptors. CCPs are fewer, smaller, and less able to recruit cargo, resulting in accumulation of transmembrane proteins, including RET on the cell surface. As a result, RET downstream signaling is enhanced and degradation is reduced leading to increased cell proliferation. The selective RET inhibitor selpercatinib abrogates RET-mediated signals and blocks cell proliferation.
Videos
Animation 1
Assembly of clathrin-labelled structures is reduced in the absence of TMEM127 – Live cell TIRFM imaging movies of cell surface clathrin in Mock-KO and TMEM127-KO SH-SY5Y cells expressing EGFP-tagged clathrin light chain.
Time-lapse videos of cells (5 min @ 1 frame-per-second) are shown. (Left) In Mock-KO cells clathrin-labeled structures (CLS) assemble rapidly and abundantly. These may abort (very short-lived puncta) or progress to mature clathrin-coated pit (CCP) before internalizing (~40 s) and disappearing from the TIRF field (Crupi et al., 2015) (Right) TMEM127-KO cells show fewer CLS, which assemble more slowly and remain on the membrane much longer before moving out of the TIRF field, suggesting reduced recruitment of clathrin to CLS in these cells, contributing to reduced ability of CCPs to mature and capture protein cargo.
Additional files
Download links
A two-part list of links to download the article, or parts of the article, in various formats.
Downloads (link to download the article as PDF)
Open citations (links to open the citations from this article in various online reference manager services)
Cite this article (links to download the citations from this article in formats compatible with various reference manager tools)
Loss of tumor suppressor TMEM127 drives RET-mediated transformation through disrupted membrane dynamics
eLife 12:RP89100.
https://doi.org/10.7554/eLife.89100.3


