miR-142 regulates the tumorigenicity of human breast cancer stem cells through the canonical WNT signaling pathway
- Stanford University, United States
- Howard Hughes Medical Institute, Stanford University School of Medicine, United States
- Stanford University School of Medicine, United States
- City of Hope Cancer Center, United States
- Applied Biosystems, United States
Figures
Figure 1 with 1 supplement

Recruitment of the APC mRNA to Ago by miR-142 or miR-150.
(A) Unsupervised hierarchal cluster of AgoIP/microarray from HEK293T cells transfected with mock, miR-142- or miR-150-precursor. The lysates of HEK293T cells transfected with mock, or 30 nM miR-142- or miR-150- precursor were immunopurified by an anti-Ago antibody. RNA was isolated from the immunopurified lysate and amplified for the HEEBO microarray analyses. Rows correspond to the putative miR-142 and miR-150 targets (local false discovery rate (FDR) 1%), and columns represent individual experimental samples. (B) Cumulative distribution of the change for the Ago IP mRNAs classified by the types of the seed matches in the 3′ UTR (Bartel, 2009). Overall efficiency of Ago IP enrichment is 8mer > 7mer-m8 > 7mer-1A > 6mer-n2-7 (nucleotides 2–7) > 6mer-n3-8 (nucleotides 3–8) in the HEK293T cells transfected with miR-142 precursor. (C) Ago IP enrichment of mRNAs. The mRNA enrichment in the Ago IP samples of the miR-142-expressing HEK293T cells over those of the mock transfected cells. The results are derived from two independent transfections. The results for APC, AXIN1, and GSK3B enrichment are presented. The data are mean ± standard deviation (SD).
-
Figure 1—source data 1
The result of the Ago-IP microarray experiment using the miR-142-expressing cells.
- https://doi.org/10.7554/eLife.01977.004
-
Figure 1—source data 2
The result of the second Ago-IP microarray experiment using the miR-142 expressing cells.
- https://doi.org/10.7554/eLife.01977.005
-
Figure 1—source data 3
The result of the Ago-IP microarray experiment using the miR-150 expressing cells.
- https://doi.org/10.7554/eLife.01977.006
-
Figure 1—source data 4
The result of the second Ago-IP microarray experiment using the miR-150 expressing cells.
- https://doi.org/10.7554/eLife.01977.007
Figure 1—figure supplement 1
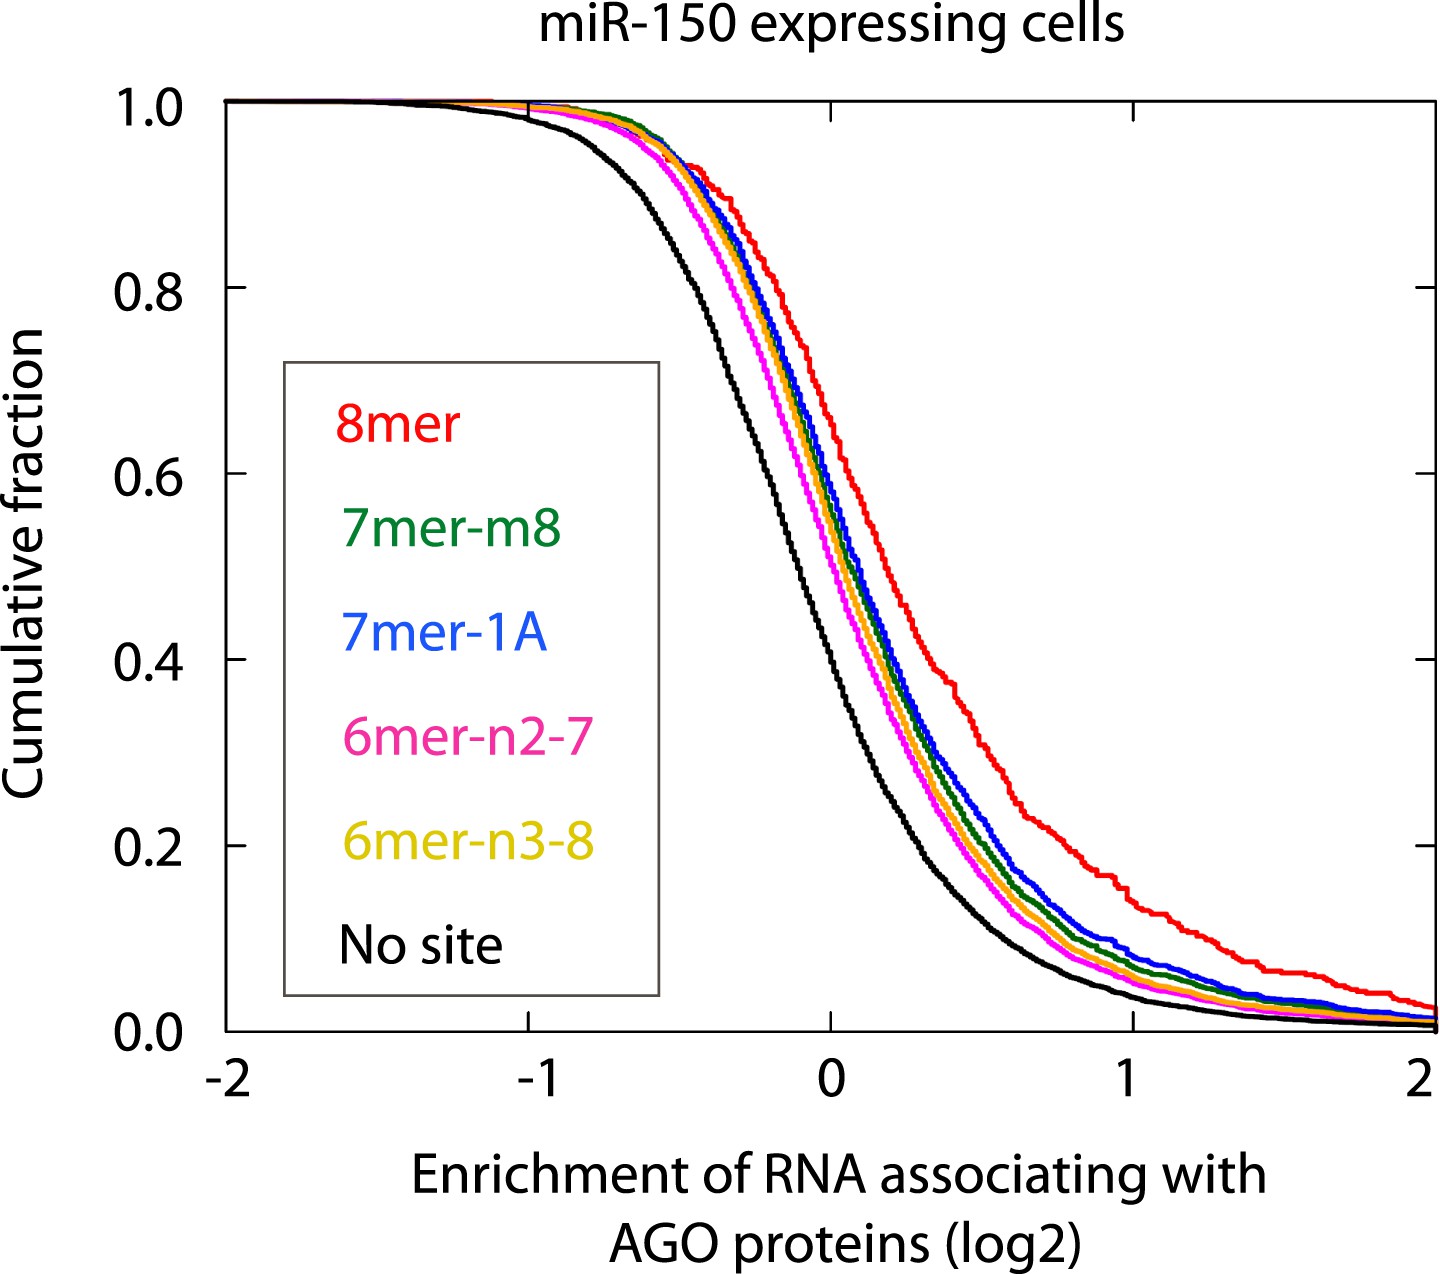
Cumulative distribution of the change for the Ago IP mRNAs classified by the types of the seed matches in the 3′ UTR (Bartel, 2009). Overall efficiency of Ago IP enrichment is 8mer > 7mer-m8 > 7mer-1A > 6mer-n2-7 (nucleotides 2–7) > 6mer-n3-8 (nucleotides 3–8) in the HEK293T cells transfected with miR-150 precursor.
Figure 2
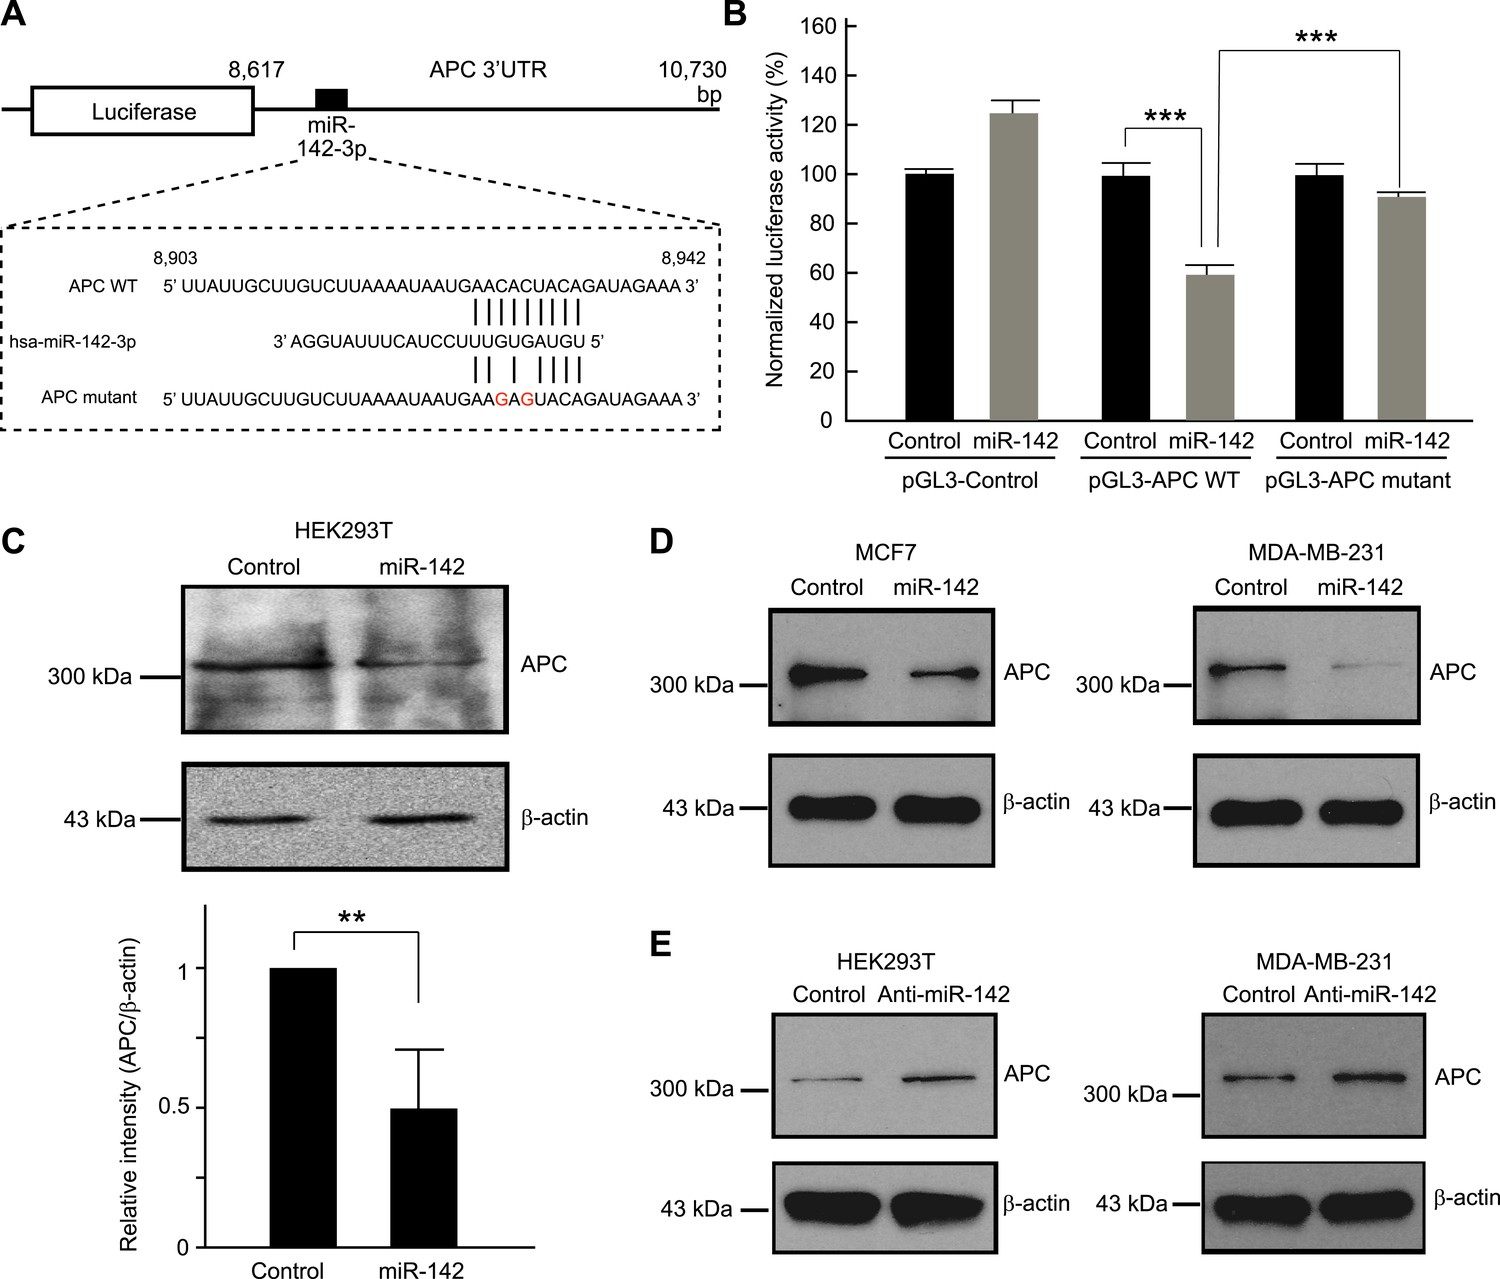
Targeting of APC by miR-142.
(A) Schematic representation of the predicted miR-142 target site within the 3′ UTR of APC. The predicted target site for miR-142-3p is located at the proximal portion of the APC 3′ UTR. Two nucleotides complementary to the seed sequence (the nucleotides 2–7 of miRNA) of miR-142-3p were mutated in the APC mutant plasmid. The number indicates the position of the nucleotides in the reference wild-type sequence of APC (NM_000038.5). (B) Activity of luciferase gene linked to the 3′ UTR of APC. The pGL3 luciferase reporter plasmids with the wild-type or mutated 3′ UTR of APC were transiently transfected into HEK293T cells along with 25 nM miR-142 precursor or negative control precursor. Co-transfected Renilla luciferase reporter was used for normalization. Luciferase activities were measured after 48 hr. The mean of the results from the cells transfected by pGL3-Control vector with control precursor was set at 100%. The data are mean ± SD (n = 3, ***p < 0.005). (C) miR-142 suppressed endogenous APC expression. miR-142-expressing HEK293T cells were cultured for 6 days, and APC protein level was analyzed by Western blotting. The intensities of the bands for APC and β-actin were measured by ImageJ software. Difference in the APC protein level between the lysate of the control precursor transfected cells and that of miR-142 transfected cells was statistically significant (n = 4, **p < 0.01). (D) Suppression of endogenous APC by miR-142 in the breast cancer cells. miR-142-expressing breast cancer MCF7 and MDA-MB-231 cells were cultured for 2 days, and the APC protein level was analyzed by Western blotting. (E) Elevation of the endogenous APC protein level by miR-142 knockdown. HEK293T cells and MDA-MB-231 cells were infected with the anti-miR-142-3p-expressing lentivirus, and GFP-positive cells were sorted by a cell-sorter. APC protein level was analyzed by Western blotting.
Figure 3
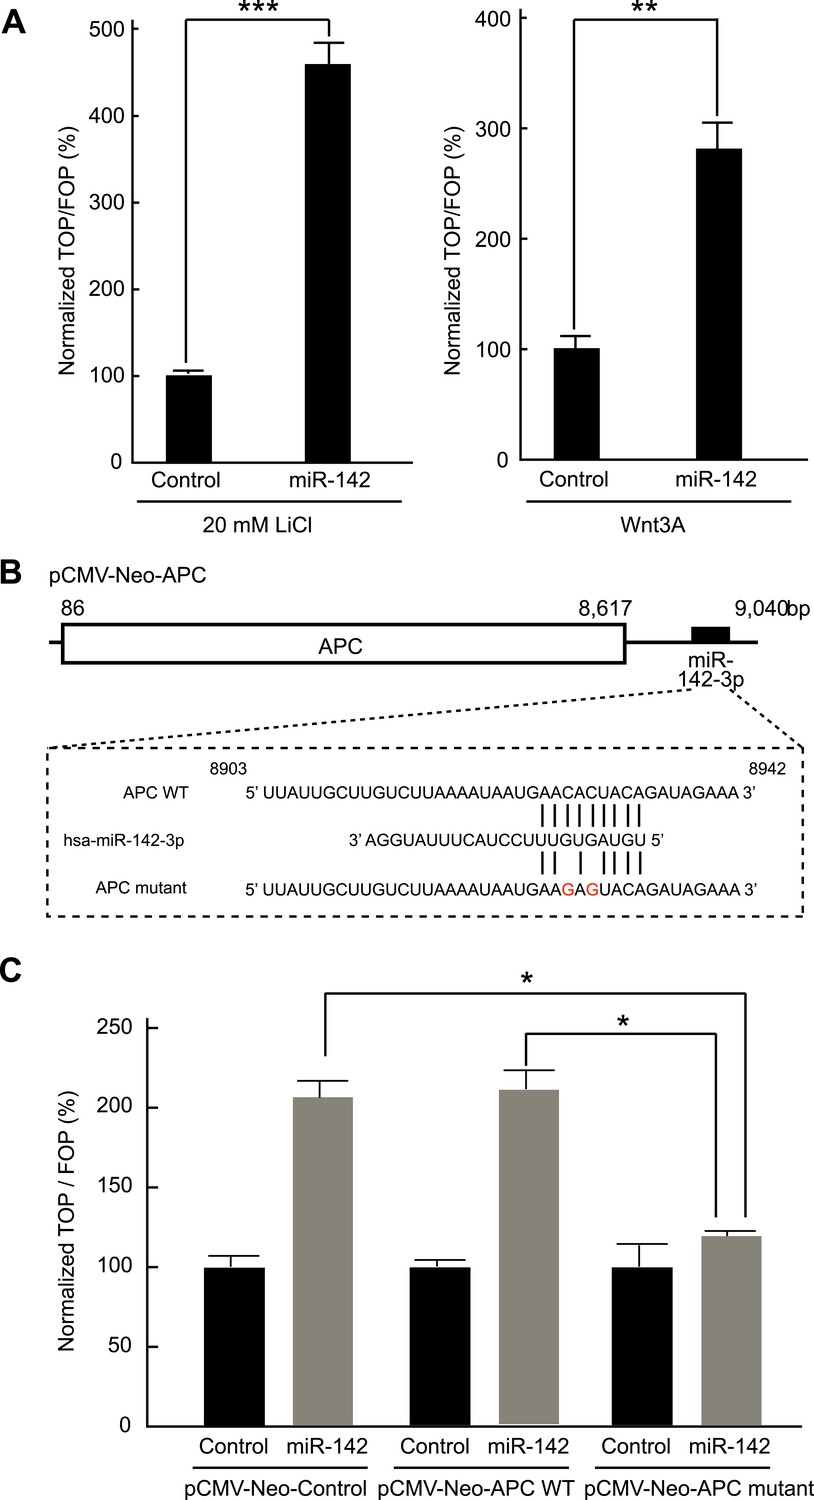
Activation of the canonical WNT signaling pathway by miR-142.
(A) Activation of the canonical WNT signaling pathway by miR-142. HEK293T cells were transfected with 25 nM miR-142 precursor along with TOPFlash or FOPFlash vector (with or without TCF binding sites). Cells were stimulated with 20 mM LiCl (left) or with Wnt3A conditioned medium (right) for 6 hr. The canonical WNT signaling pathway activities were measured by dividing a normalized TOPFlash value by a normalized FOPFlash value. The mean of the results from the cells transfected with control precursor was set at 100%. The data are mean ± SD (n = 3, **p < 0.01, ***p < 0.005). (B) Schematic representation of the pCMV-Neo-APC expression vector that codes the full-length APC sequence together with wild-type or mutated miR-142 targeted site located at the 3′ UTR. Two nucleotides complementary to the seed sequence of miR-142-3p were mutated in the pCMV-Neo-APC mutant plasmid. The number indicates the position of the nucleotides in the reference wild-type sequence of APC (NM_000038.5). (C) miR-142 targets APC to activate the canonical WNT signaling pathway. HEK293T cells were transfected with 25 nM miR-142 precursor along with the TOPFlash or FOPFlash vector and the pCMV-Neo-APC expression vector or its mutant vector. Cells were stimulated with 20 mM LiCl for 6 hr. The activities of the canonical WNT signaling pathway were measured as described in (A). The mean of the results from the cells transfected with control precursor was set at 100%. The data are mean ± SD (n = 3, *p < 0.05).
Figure 4 with 1 supplement
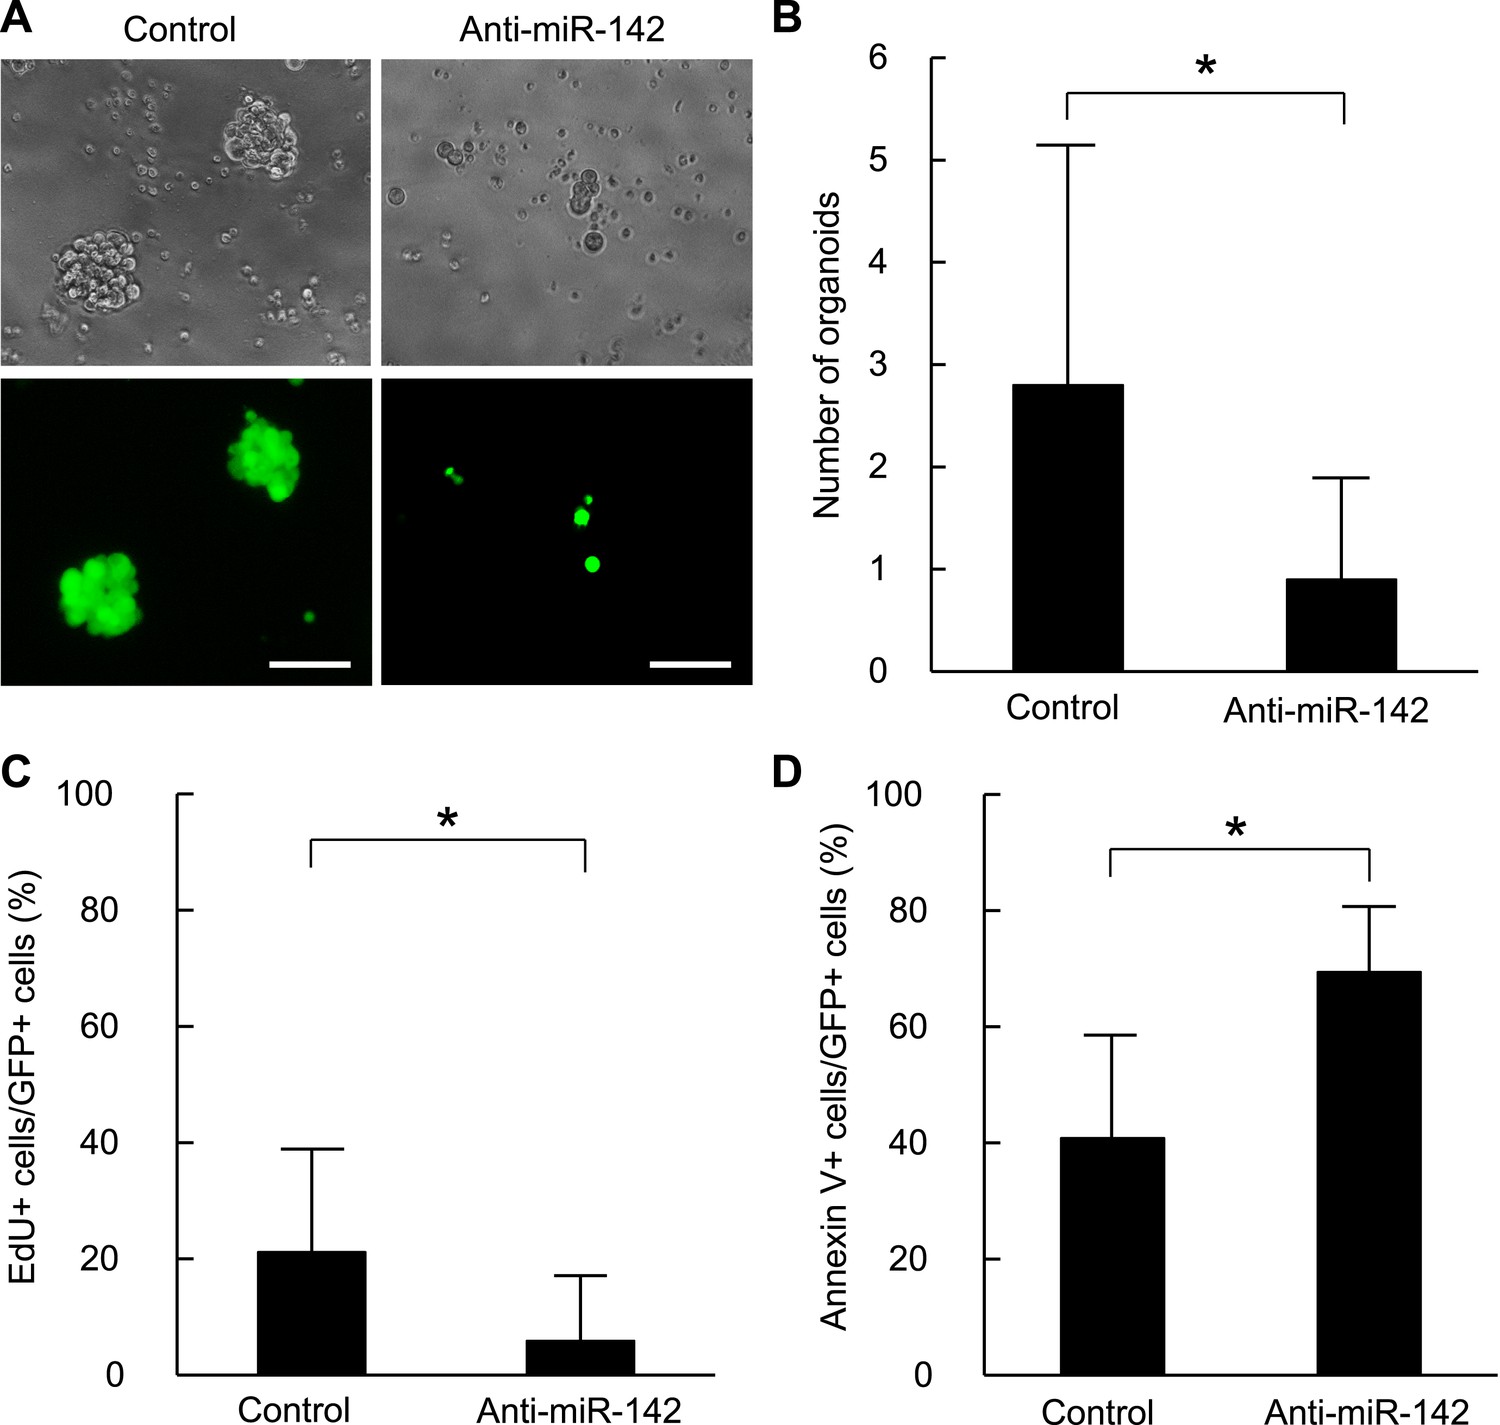
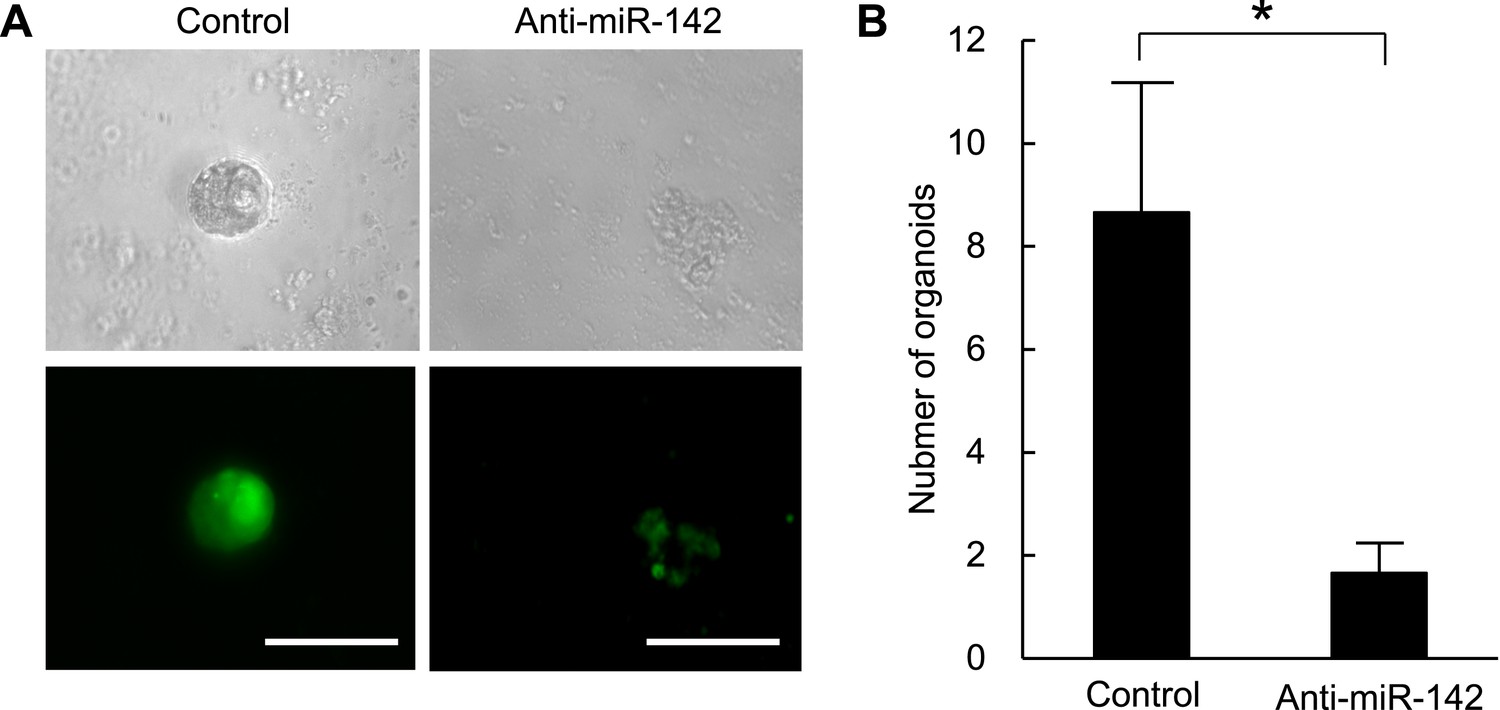
Suppression of the organid formation by the inhibition of miR-142 in BCSCs.
(A) Representative images of the organoids from the human BCSCs infected with control or anti-miR-142-3p-expressing lentiviruses and cultured for 10 days. The upper panels are the phase-contrast images of the organoids, and the lower panels are the fluorescent microscopic images for the detection of GFP. Bars, 100 μm. (B) The number of organoids formed by the human BCSCs infected with control or anti-miR-142-3p-expressing lentiviruses. The data are mean ± SD (n = 10, *p < 0.05). (C) Percentage of the EdU-positive cells among the GFP-positive breast cancer cells in the organoids formed by the human BCSCs infected with control or anti-miR-142-3p-expressing lentiviruses. The data are mean ± SD (n = 4, *p < 0.05). (D) Percentage of the annexin V-positive cells among the GFP-positive breast cancer cells in the organoids formed by the human BCSCs infected with control or anti-miR-142-3p-expressing lentiviruses. The data are mean ± SD (n = 4, *p < 0.05).
Figure 4—figure supplement 1
(A) Representative images of the organoids from the mouse MMTV-Wnt1 breast cancer cells infected with control or anti-miR-142-3p-expressing lentiviruses and cultured for 7 days. The upper panels are the phase-contrast images of the organoids, and the lower panels are the fluorescent microscopic images for the detection of GFP. Bars, 100 μm. (B) The number of organoids formed by the mouse MMTV-Wnt1 breast cancer cells infected with control or anti-miR-142-3p-expressing lentiviruses. The data are mean ± SD (n = 3, *p < 0.05).
Figure 5
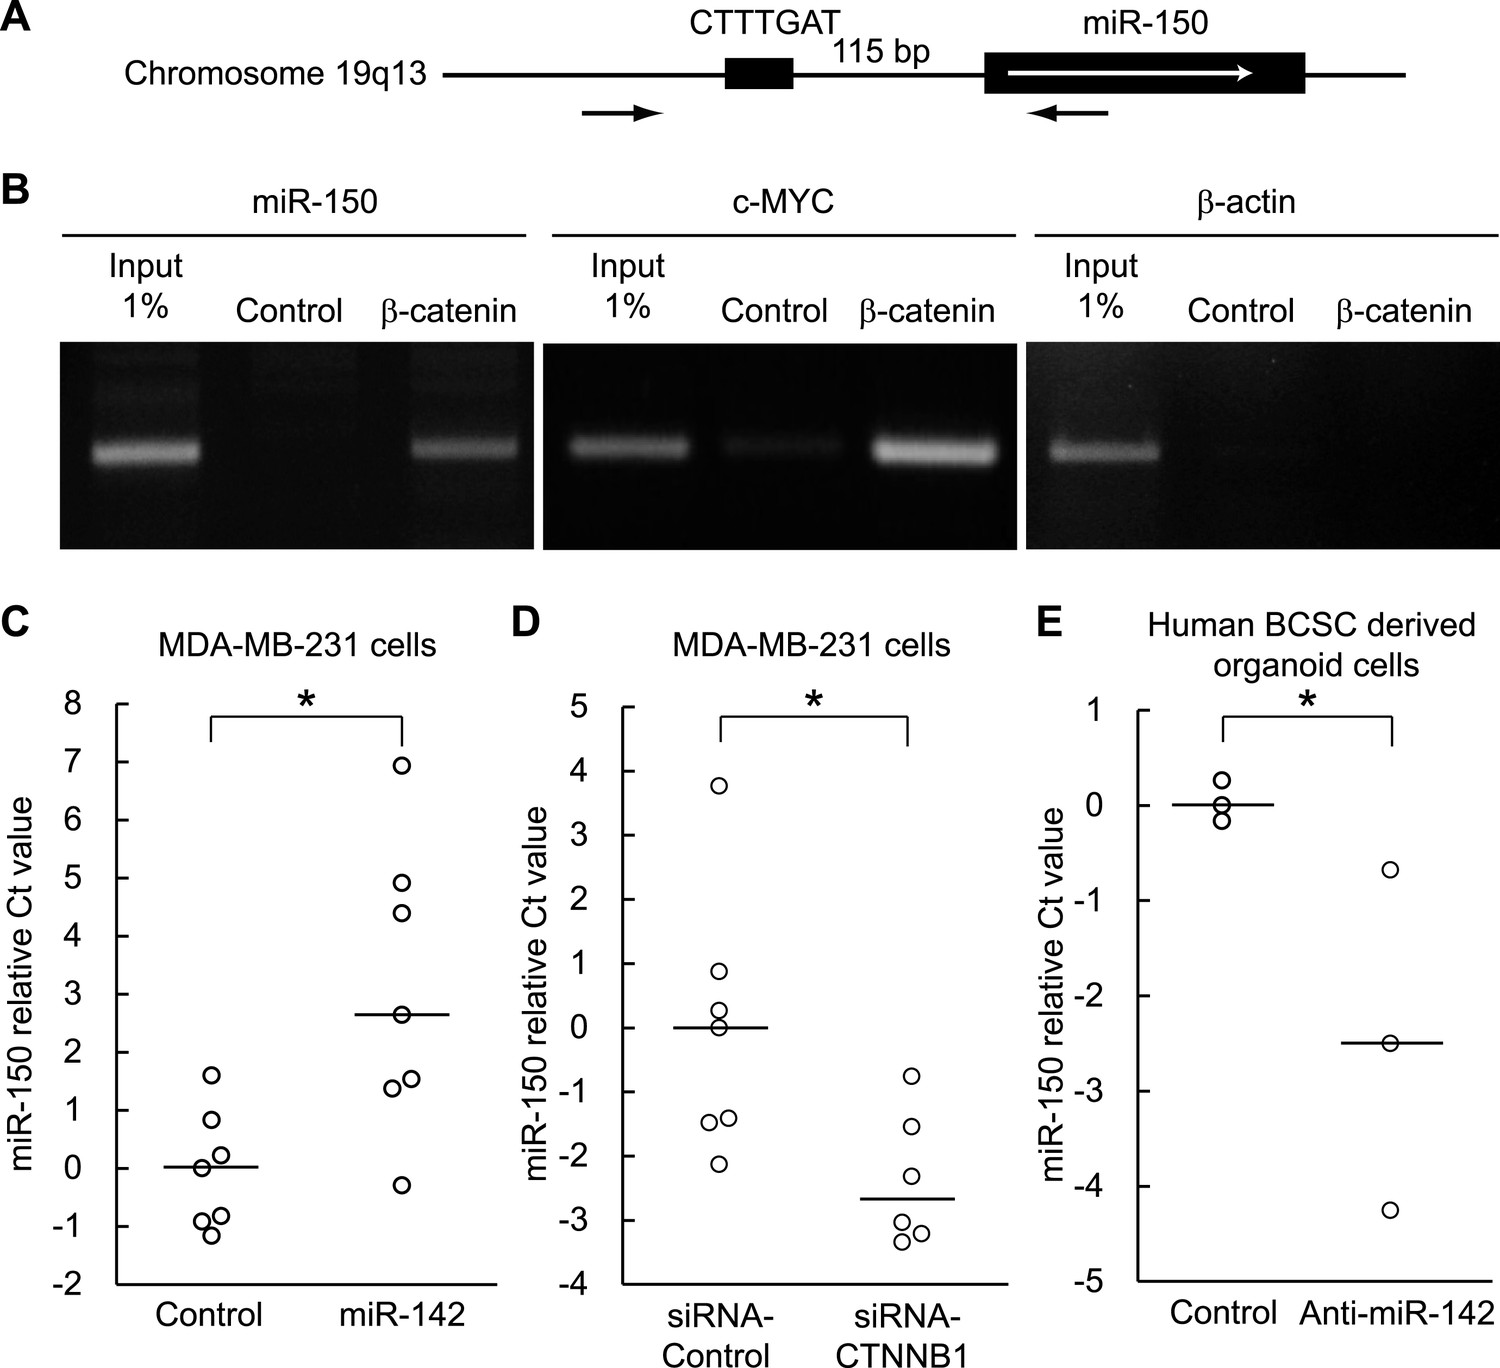
Enhancement of miR-150 transcription by the canonical WNT signaling pathway.
(A) Schematic representation of the potential β-catenin/TCF binding site within the flanking genomic sequence of the miR-150 precursor. Box: potential β-catenin/TCF binding site (WWCAAWG/CWTTGWW) and its sequence. Box with an arrow: position of the miR-150 precursor and direction of transcription. Black arrows: relative positions of the PCR primers for the chromatin IP analyses. (B) Chromatin IP for a potential β-catenin/TCF binding site. Lysate of cross-linked HEK293T cells was immunoprecipitated by an anti-β-catenin antibody or mouse IgG. A putative β-catenin/TCF binding site was amplified by PCR. The template for input was purified from the 1% of total cell lysate. The β-catenin/TCF binding site for c-MYC was amplified as a positive control, and the genomic sequence for β-actin was amplified as a negative control. (C) miR-142 induced the transcription of miR-150. The amount of miR-150 in the MDA-MB-231 cells transfected with a miR-142-expressing plasmid was analyzed by quantitative real-time PCR. Each circle represents one experiment. Bars indicate median. Differences of the amount of miR-150 between the miR-142-expressing and the control MDA-MB-231 cells were statistically significant (*p < 0.05). (D) Decrease of the miR-150 transcription by β-catenin knockdown. β-catenin was knocked down by the siRNA against CTNNB1 in MDA-MB-231 cells expressing miR-142. Each circle represents one experiment. Bars indicate median. The amount of miR-150 was analyzed by quantitative real-time PCR. Difference in the amount of miR-150 between the cells transfected with a siRNA against CTNNB1 and those transfected with a control siRNA was statistically significant (*p < 0.05). (E) Decrease of miR-150 expression by the miR-142 inhibition in human BCSCs. The human BCSCs derived from the human breast cancer xenograft were infected with the anti-miR-142-expressing or control letiviruses and incubated in an organoid culture medium for 48 hr. The amount of miR-150 was analyzed by quantitative real-time PCR. Each circle represents one experiment. Bars indicate median (*p < 0.05).
Figure 6 with 1 supplement
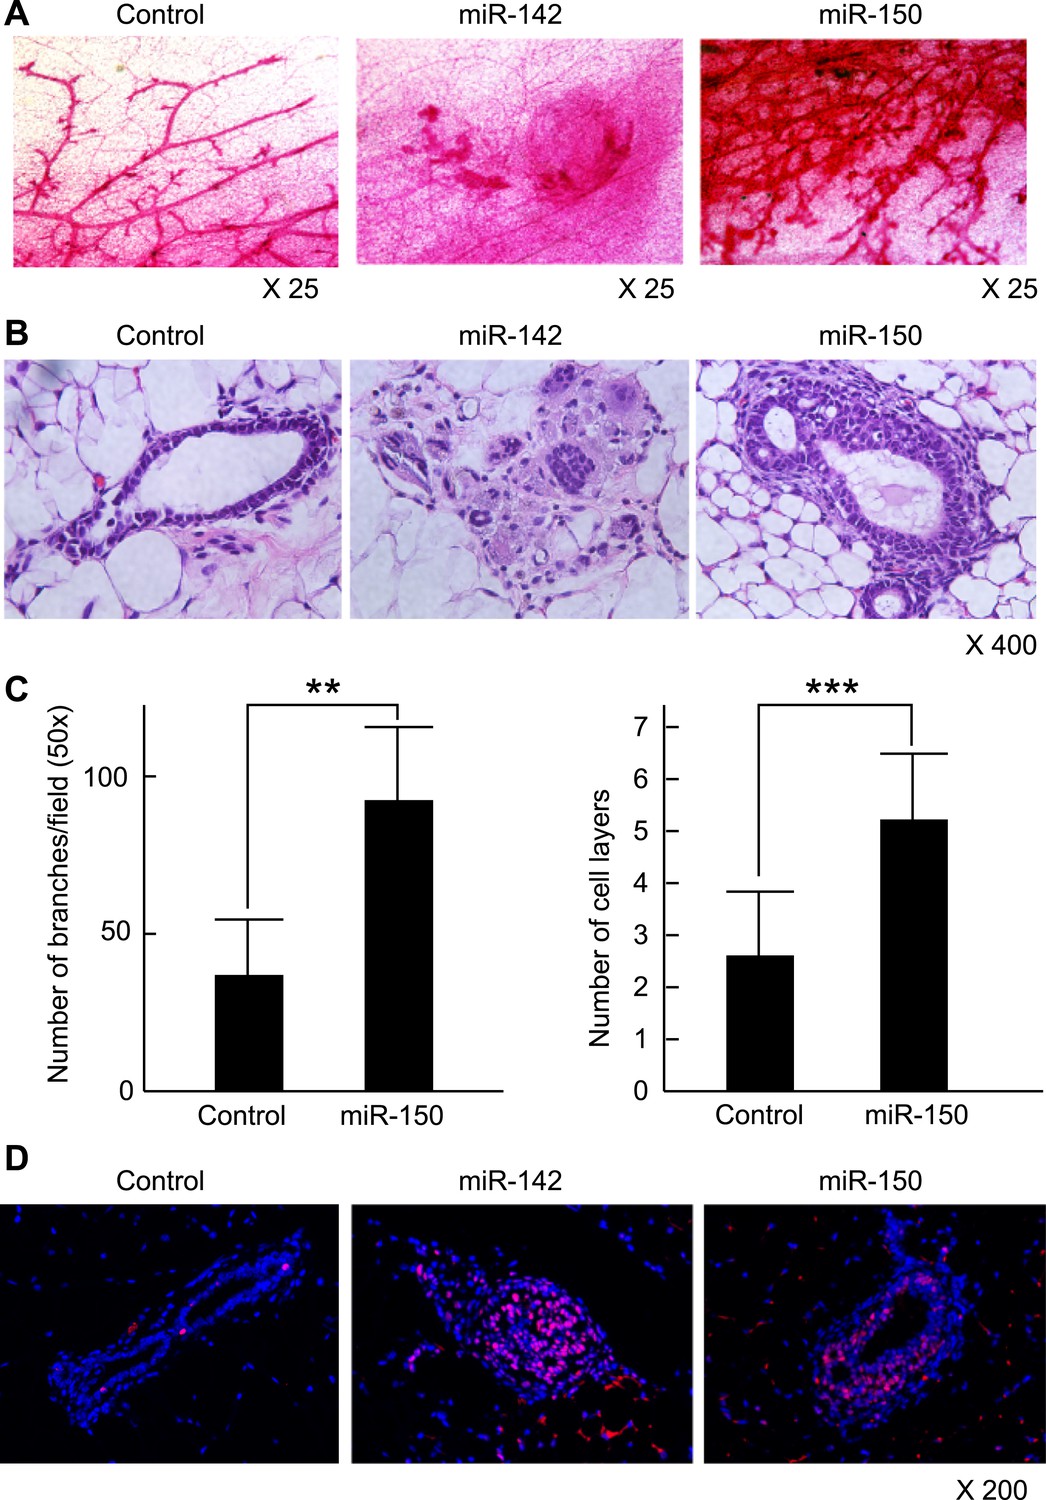
Mammary dysplasia or hyperplasia formed by the mammary cells expressing miR-142 or miR-150 in vivo.
(A) The whole-mount mammary fat pad staining. Murine mammary cells isolated from FVB/NJ mice were infected with the control lentivirus, or miR-142 or miR-150-expressing lentiviruses. The 5 × 10⁴ infected mammary cells were transplanted into cleared mammary fat pads of the same strain weaning age female mice. Mammary duct outgrowth was analyzed 8 weeks later. The whole-mount mammary tissue was stained by a carmine alum staining solution. (B) Hematoxylin and Eosin staining of the mammary tissue formed by mammary cells infected with miR-142 or miR-150-expressing lentiviruses. Mammary duct outgrowth was analyzed 8 weeks after transplantation. (C) Degree of branching and number of mammary epithelial cell layers in the mammary tissue formed by mammary cells infected with miR-150. Degree of branching was analyzed by counting the number of branches observed within a 50× field of the whole-mount mammary fat pad specimens. Number of mammary epithelial cell layers of the ducts was counted in the hematoxylin and eosin stained specimens (**p < 0.01, ***p < 0.005). (D) Increase of the cell proliferation in the mammary tissues regenerated by the miR-142- or miR-150-expressing mammary cells. The tissues were stained with an anti-PCNA antibody followed by an Alexa Fluor 594-conjugated secondary antibody. Blue, DAPI; red, PCNA.
Figure 6—figure supplement 1
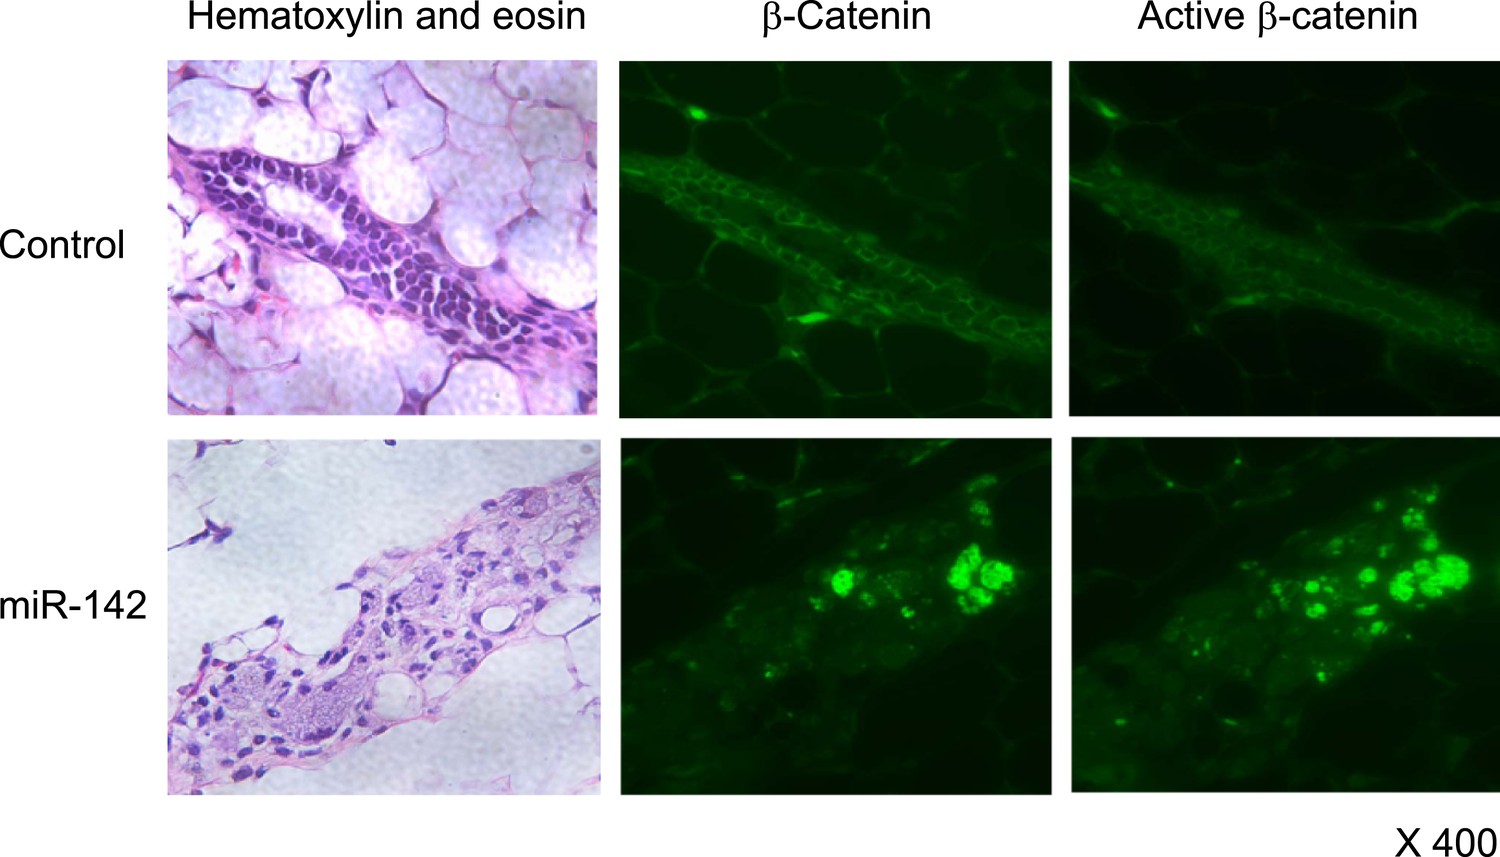
Activation of β-catenin in the mammary tissue expressing miR-142.
Immunohistochemical staining of the mammary tissue formed by mammary cells expressing miR-142. Tissue was stained with an anti-β-catenin or anti-active-β-catenin antibody followed by an Alexa Fluor 488-conjugated secondary antibody.
Figure 7

Suppression of the Tumor Growth Initiated by Human BCSCs Expressing the Anti-miR-142-3p in vivo.
(A) CD44+ CD24-/low lineage− human BCSCs were isolated from an early passage human breast xenograft tumor and infected by the anti-miR-142-3p-expressing lentivirus or control lentivirus. Ten thousand infected cells were injected into the mammary fat pad region of immunodeficient NSG mice. Tumor growth was monitored for 2 months after injection. The data are mean ± SD (n = 10, * *p < 0.01, ***p < 0.005). (B) APC expression in the xenograft tumors was derived from the control or anti-miR-142-3p-expressing lentivirus infected BCSCs. Tumors were dissociated and APC expression was analyzed by western blotting.
Additional files
-
Supplementary file 1
Changes in mRNA abundance in the miR-142-expressing cells.
- https://doi.org/10.7554/eLife.01977.017
Download links
A two-part list of links to download the article, or parts of the article, in various formats.
Downloads (link to download the article as PDF)
Open citations (links to open the citations from this article in various online reference manager services)
Cite this article (links to download the citations from this article in formats compatible with various reference manager tools)
miR-142 regulates the tumorigenicity of human breast cancer stem cells through the canonical WNT signaling pathway
eLife 3:e01977.
https://doi.org/10.7554/eLife.01977


