Tyrosine phosphorylation of RNA polymerase II CTD is associated with antisense promoter transcription and active enhancers in mammalian cells
- Université Aix-Marseille, France
- Centre National de la Recherche Scientifique (CNRS) UMR6102, France
- Inserm U631, France
- Institut de Génétique Moléculaire de Montpellier (IGMM), CNRS-UMR5535, France
- Helmholtz Center Munich, Center of Integrated Protein Science Munich, Germany
- Centre Nacional D'Anàlisi Genòmica, Spain
Figures
Figure 1 with 2 supplements
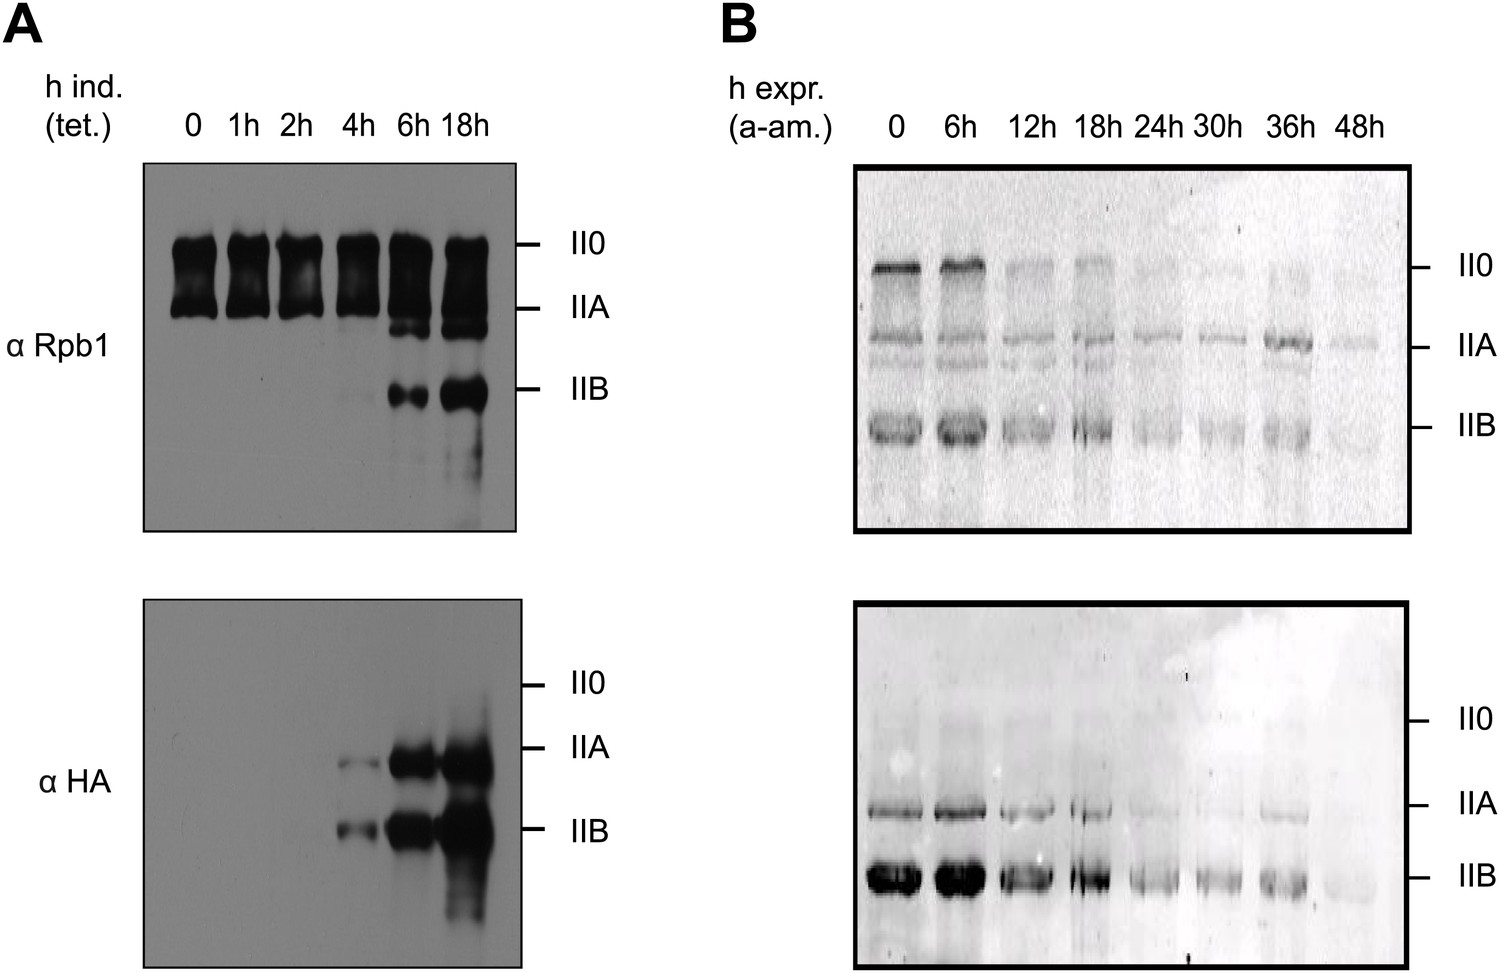
Y1F mutations of the CTD heptads yield a truncated Pol IIB Rpb1.
(A) Rpb1-Y1F mutant was expressed after removal of tetracycline and in the presence of endogenous Rpb1. Probing with Rpb1 Ab reveals both endogenous and recombinant Rpb1 whereas HA reveals only recombinant Y1F mutant. (B) Protein expression of the Y1F mutant after shut-down of endogenous Rpb1 following treatment with α-amanitin.
Figure 1—figure supplement 1
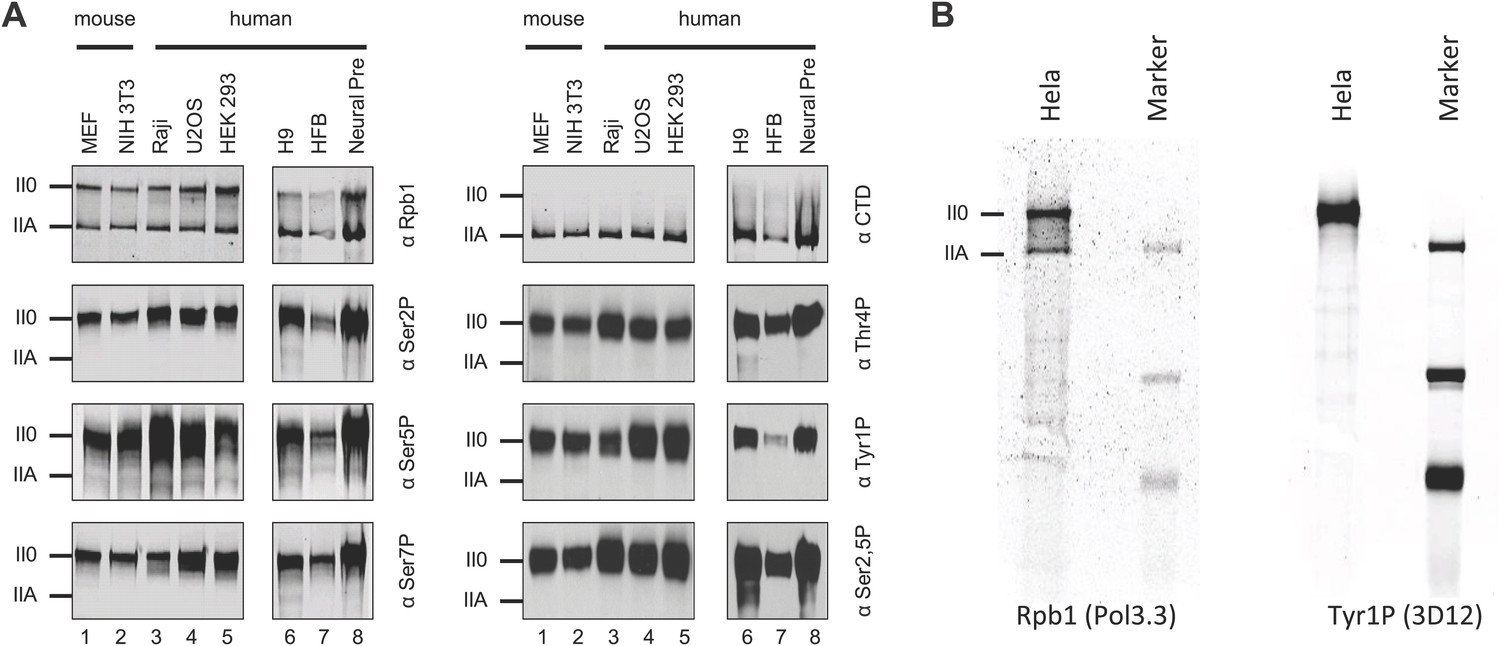
Tyr1P is expressed in various human and mouse cell lines.
(A) Western blot analyses of antibody recognition in mouse and human cell lines of Rpb1, CTD (8WG16), and CTD isoforms including Tyr1P (3D12). MEF, mouse embryo fibroblasts; Raji, Burkitt-Lymphoma; U2OS, osteosarcoma cell line; HEK293; human embryonic kidney cells; H9, human embryonic stem cells; HFB, human skin fibroblasts; Neural Pre, human neural precursor cells. (B) Western blot, as in (A) showing the specificity of 3D12 in Hela whole cell extracts over a wider range of proteins.
Figure 1—figure supplement 2
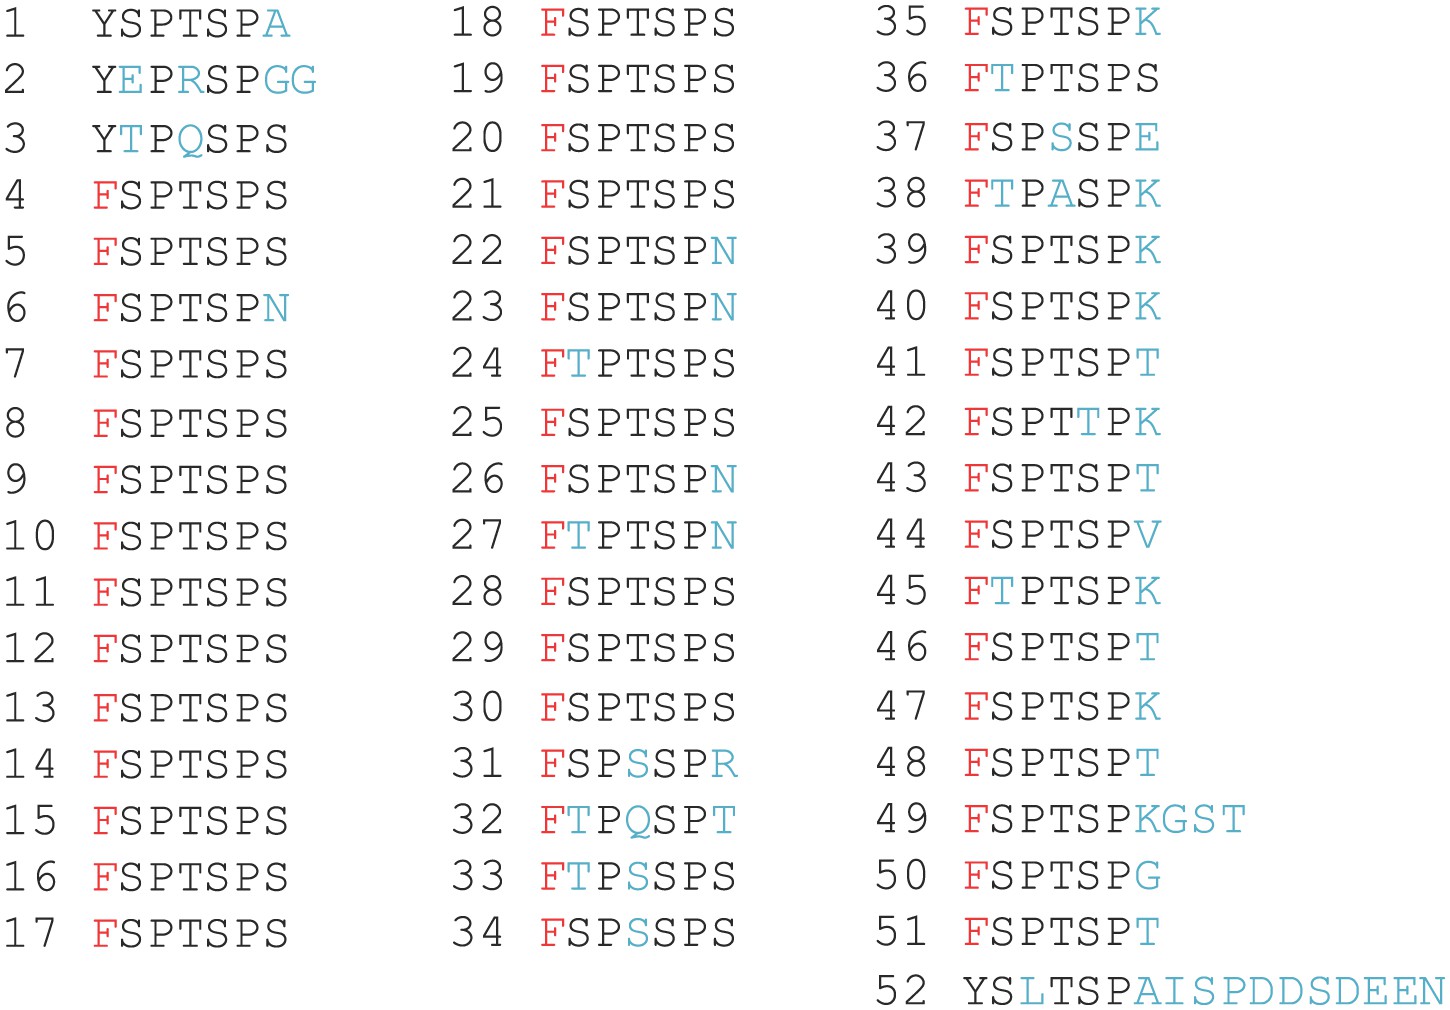
Sequence of the CTD heptads for the Tyr1 to Phe mutant (Y1F).
Amino-acid composition of the C-terminal domain of the Y1F mutant (as described in the ‘Materials and methods–Construction of the CTD Y1F mutant’) used for phenotypic and western blot analyses (Figure 1).
Figure 2 with 7 supplements
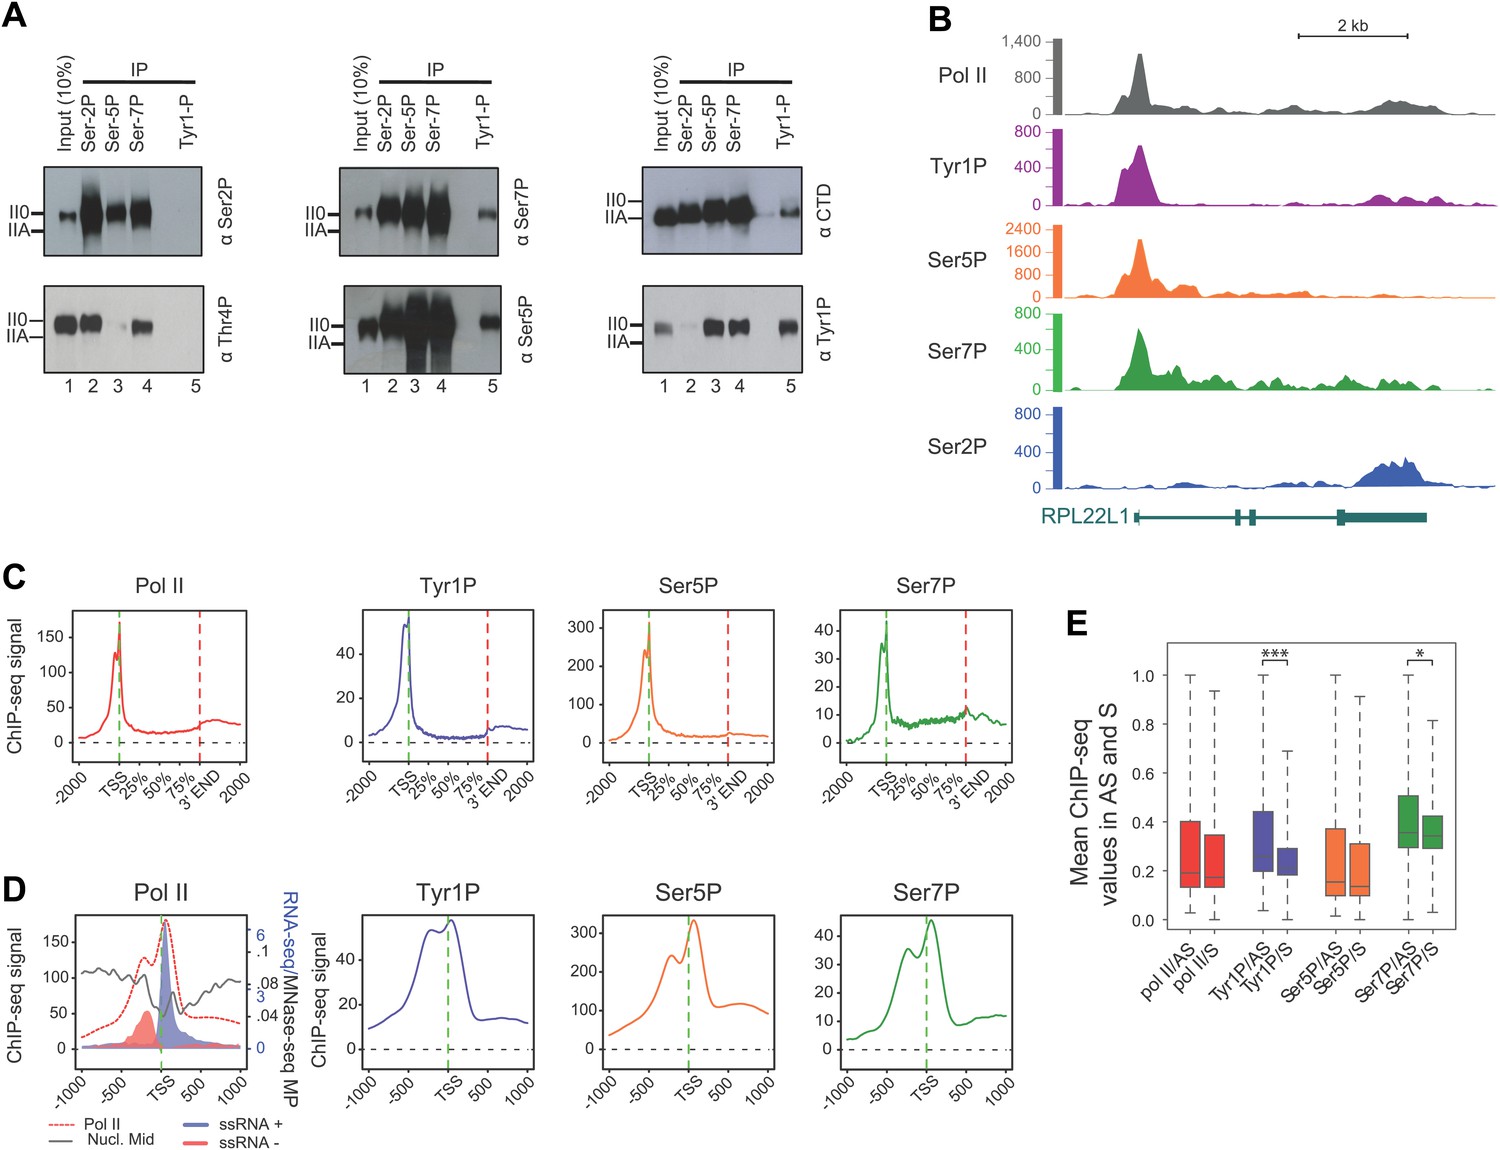
CTD Tyrosine 1 is phosphorylated mainly at TSS and is dominant in antisense transcription.
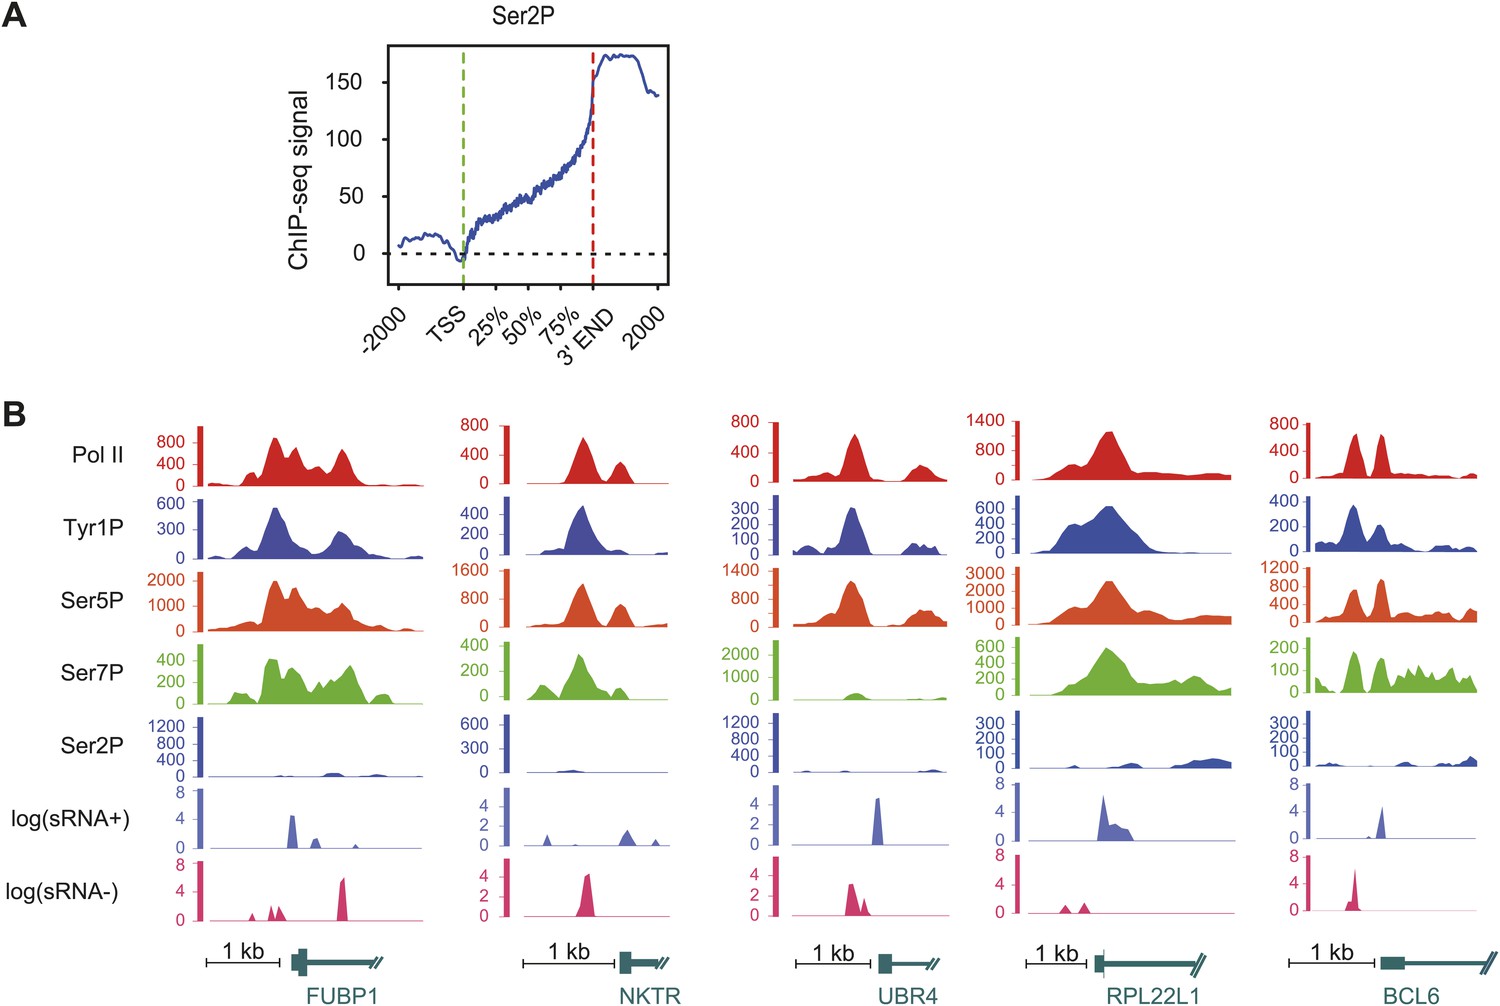
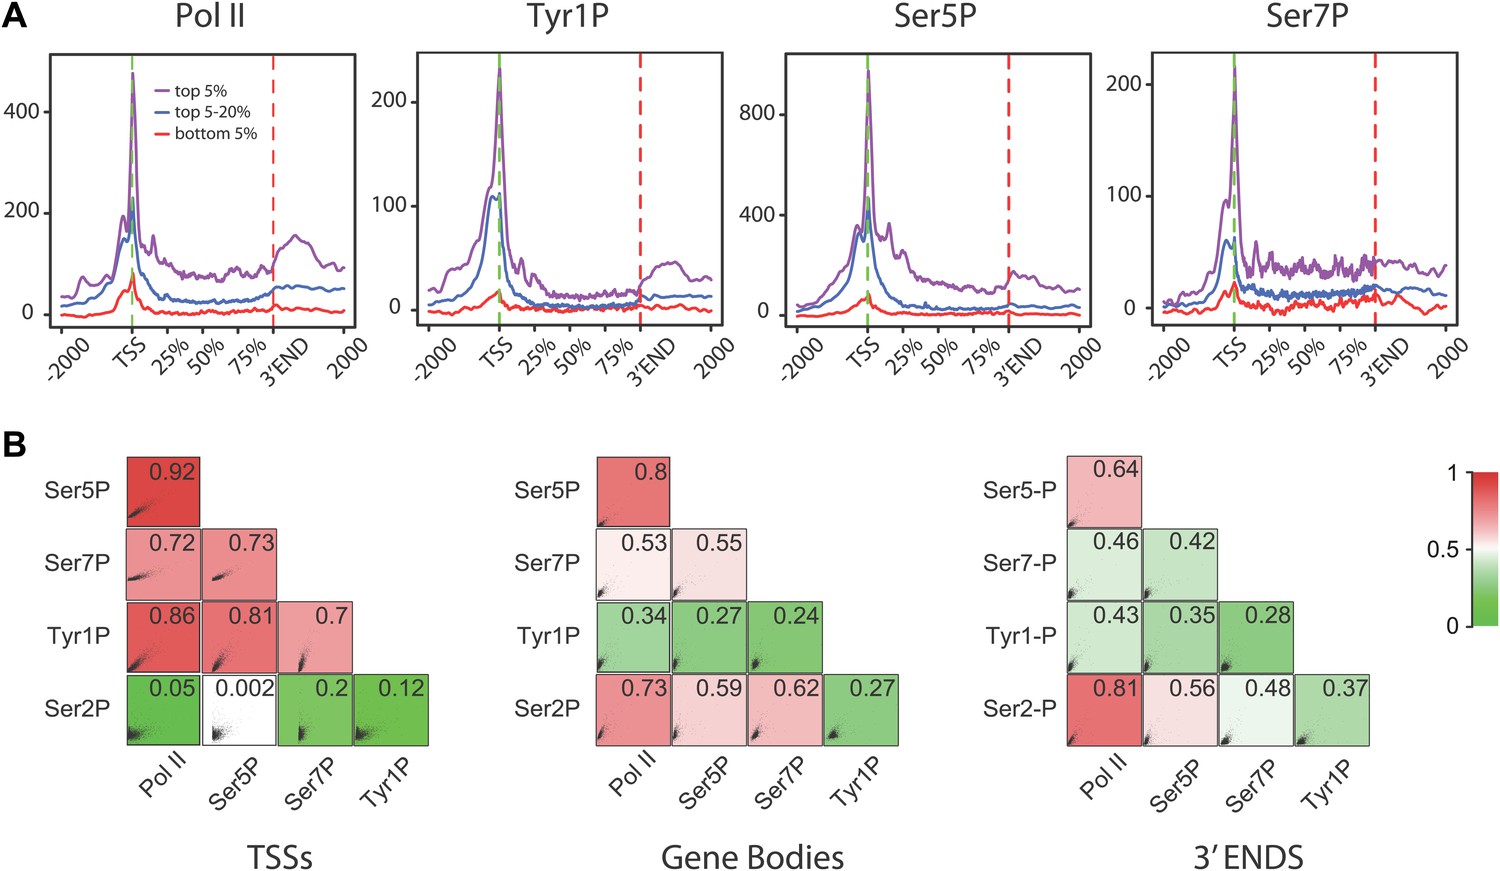
(A) Co-immunoprecipitation with specific CTD isoforms in Raji B-cells reveals Tyr1P (3D12) association with Ser5P and Ser7P but not with Ser2P and Thr4P. (B) ChIP-seq example illustrating Tyr1P (3D12) association around the promoter of RPL22L1 gene. (C) Composite average profiling of ChIP-seq data at coding genes locations for Pol II (1433 genes), Tyr1P (3D12, 2462 genes), Ser5P (1464 genes), and Ser7P (2186 genes) in Raji B-cells and based on selections described in Figure 2—figure supplement 1B. Less stringent selections with more genes gave equivalent profiling (Figure 2—figure supplement 4A). (D) Profiling of Pol II, Tyr1P (3D12), Ser5P, Ser7P, nucleosomes midpoint and short strand specific RNAs (ssRNAs) around TSS locations with same selections described in (C). (E) Boxplots on 3201 genes without outliers showing mean levels of Pol II (2986 genes), Tyr1P (2964 genes), Ser5P (2909 genes), and Ser7P (2948 genes) ChIP-seq signal on regions representing each transcription orientation. The p-values (parametric two sided paired t test) of the difference of AS vs S signal are Pol II = 0.5, Tyr1p=3.4 × 10⁻¹⁵, Ser5p=0.6, Ser7p=3.5 × 10⁻².
Figure 2—figure supplement 1
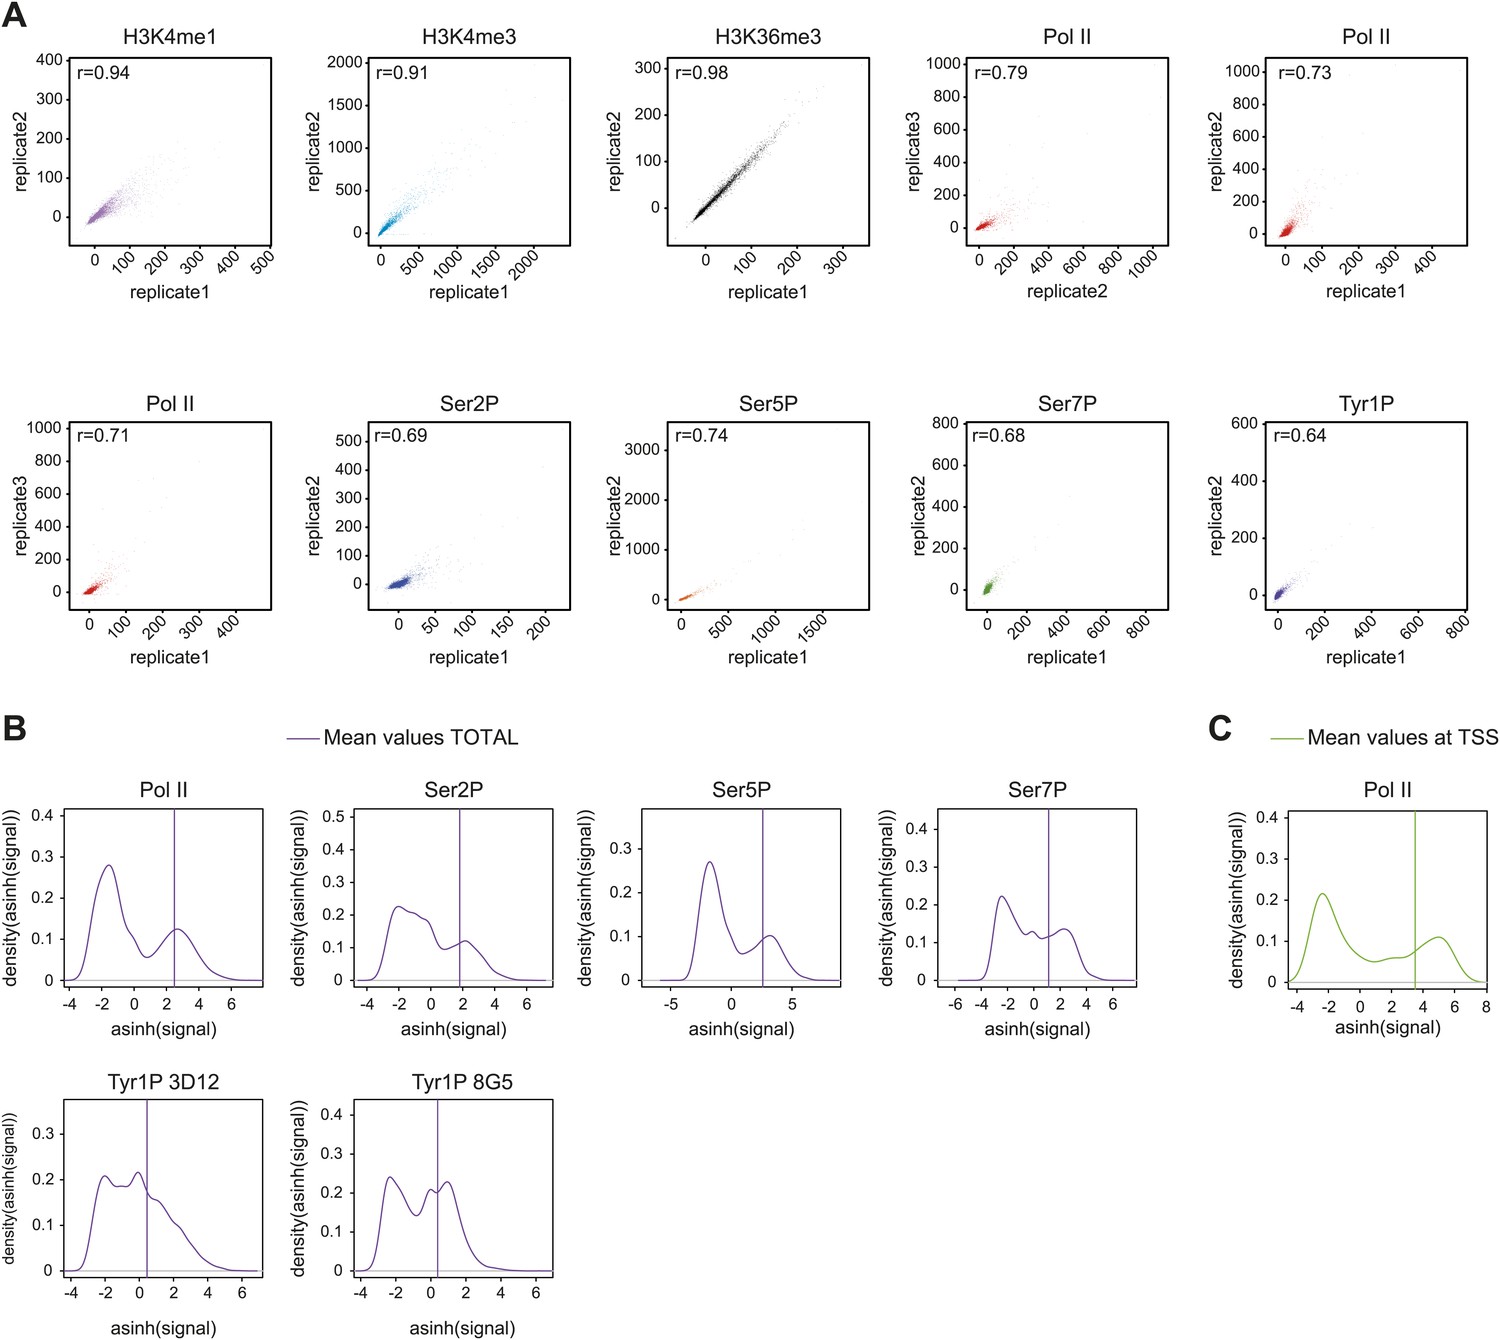
Reproducibility of ChIP-seq experiments and selection of relevant signals used for analyses.
(A) Correlation plots of biological replicates (for all but H3K36me3 i.e., a technical replicate) of ChIP-seq experiments used in this study at gene locations (‘Materials and methods–Correlation of biological replicates and cross-correlation’). Spearman correlation coefficient is indicated on the top left of the plots. (B) Distribution and threshold of background-subtracted signal used for profiling of significantly bound gene (Total, i.e., whole genic regions) in Figure 2, Figure 2—figure supplement 5A, and Figure 2—figure supplement 7C. The mean values used for distribution were computed on [TSS-1000 bp:TES+2000 bp] (TSS: transcription start site; TES: transcription end site). Note that the thresholds were set to the mean of the second Gaussian of the distribution (‘Materials and methods–Gene selection and average binding profiles’). Numbers of genes selected for Pol II, Ser2P, Ser5P, Ser7P, Tyr1P 3D12, and Tyr1P 8G5 are 1521, 1536, 1543, 2382, 2652, and 2608, respectively. (C) Distribution and threshold of Pol II significantly bound promoters (TSS) as in (B). The selection is used in Figure 3, Figure 3—figure supplement 1, and Figure 3—figure supplement 2. 2044 genes were selected based on their mean values on TSS −/+ 500 bp.
Figure 2—figure supplement 2
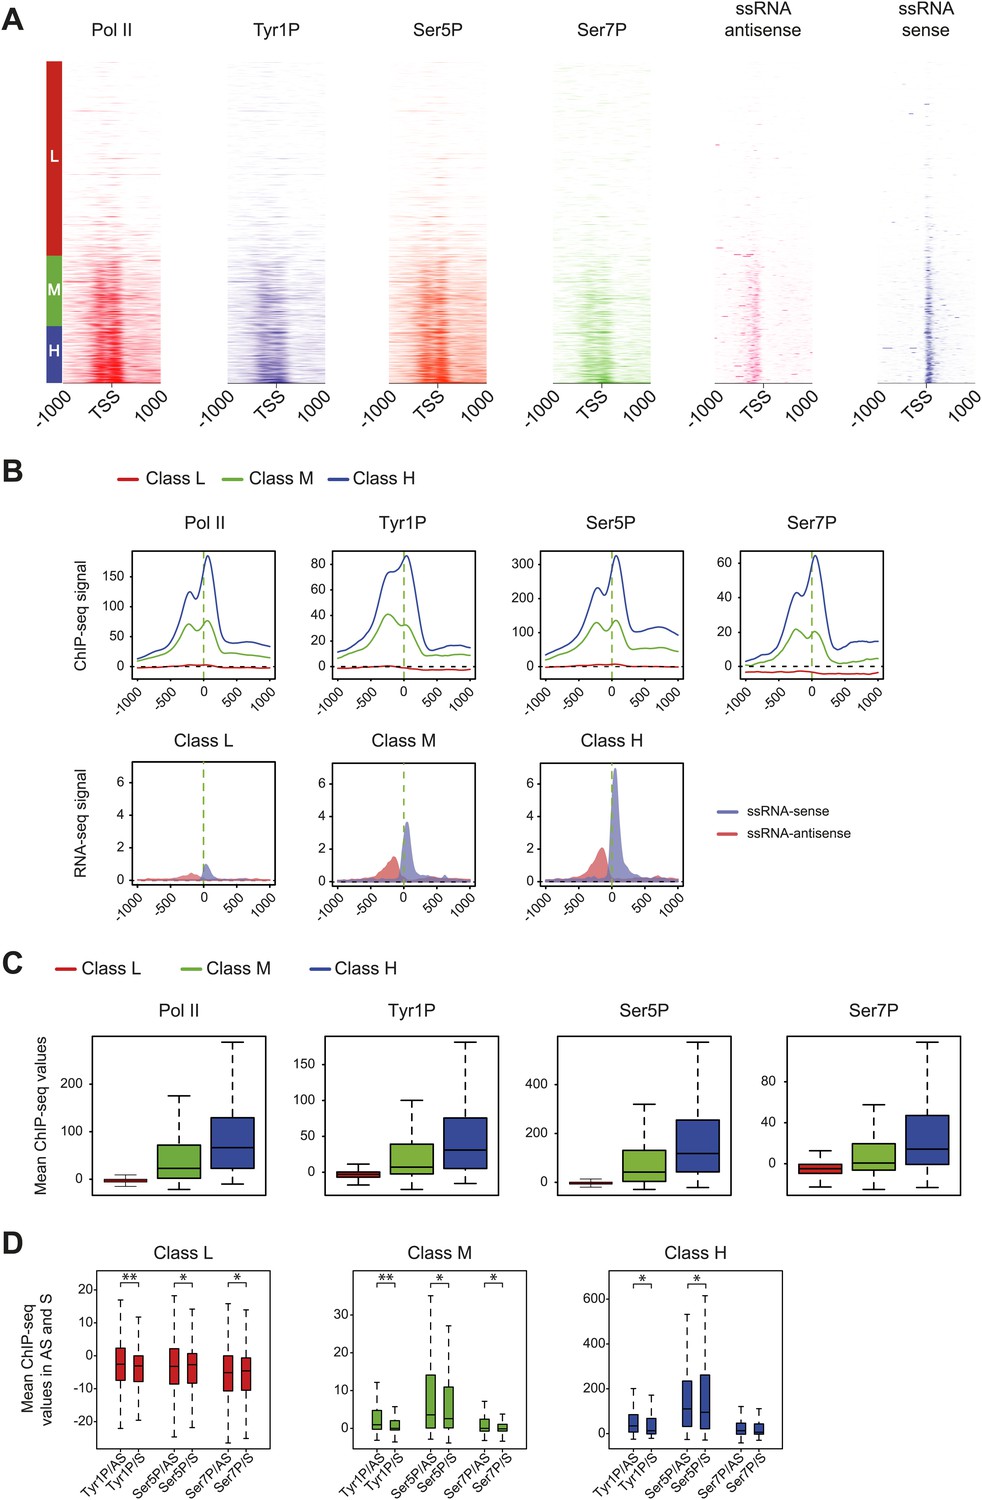
Pol II and CTD PTMs correlate positively with expression.
Based on microarray expression data, three groups of genes with low (L, 3414 genes), medium (M, 1238 genes), and high (H, 1007 genes) expression were used to profile Pol II isoforms and short ssRNA at promoters. (A) Heatmaps of signal densities for the three defined groups. (B) Average profiles of Pol II phospho-isoforms and ssRNA at the three defined groups. (C) Boxplots of the mean values retrieved at TSS −/+ 500 bp in the three classes for Pol II (3095, 1169, 957 genes), Tyr1P (3159, 1150, 958 genes), Ser5P (3072, 1157, 956 genes), and Ser7P (3184, 1130, 942 genes). (D) Boxplot of regions representing each transcription orientation as in Figure 2E for each class divided by Pol II binding values. p-value (parametric two sided paired t test) are respectively: 2.3 × 10⁻¹³; 5 × 10⁻⁴; 6 × 10⁻³ (low), 2.4 × 10⁻¹³; 6 × 10⁻³; 2 × 10⁻⁴ (medium), 7 × 10⁻⁶; 0.02; 0.8 (high). Represented number of genes are 3175, 3126, 3074, 3051, 3123, 3134 (low); 1154, 1079, 1154, 1125, 1139, 1084 (medium); 955, 930, 941, 941, 935, 913 (high).
Figure 2—figure supplement 3
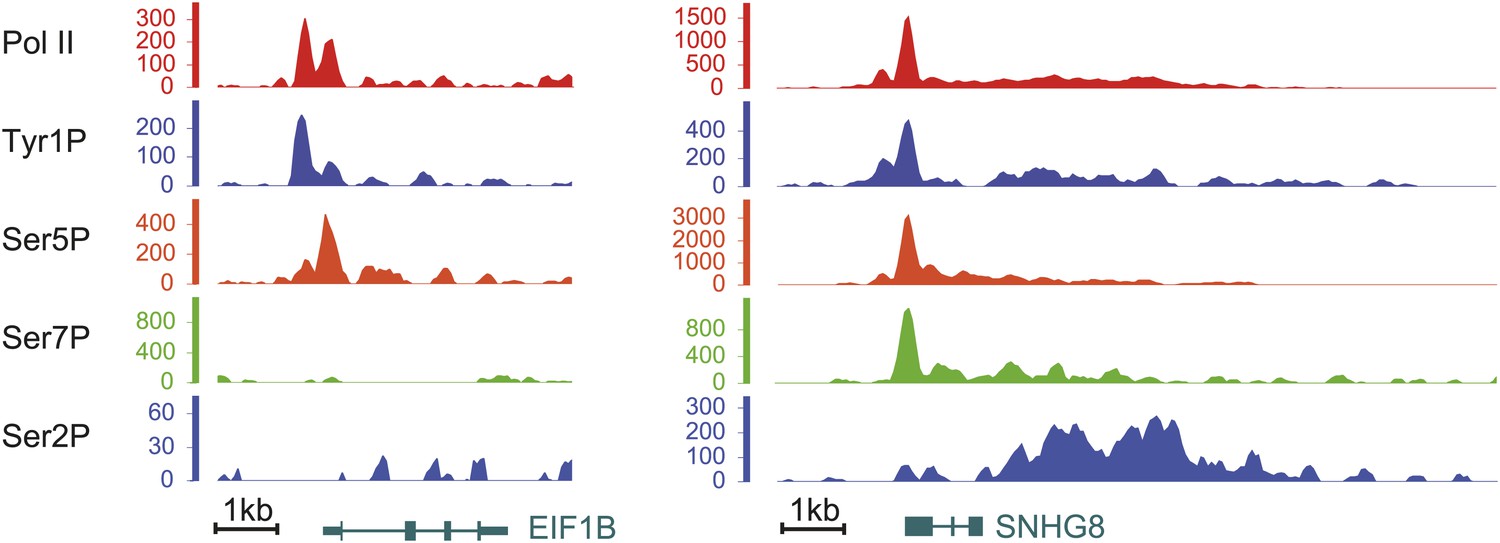
Examples of Tyr1P binding patterns at genic locations.
EIF1B and SNHG8 are mainly bound by Tyr1P (3D12) at TSS as for RPL22L1 gene of Figure 2B.
Figure 2—figure supplement 4
Average profiling of Pol II and phospho-isoforms at genic and promoter locations using wide relaxed threshold selections.
(A) Composite and TSS focused average profiling of ChIP-seq data as in Figure 2C,D, for a selection threshold of 0 as described in Figure 2—figure supplement 1B, at coding genes locations for Pol II (2714 genes), Tyr1P (3D12, 2987 genes), Ser5P (2697 genes), and Ser7P (3002 genes) in Raji B-cells. (B) Boxplots on 4749 genes as in Figure 2E for the less stringent selection showing mean levels of Pol II, Tyr1P, Ser5P, and Ser7P ChIP-seq signal on regions representing each transcription orientation. The p-values (parametric two sided paired t test) of the difference of AS vs S signal are Pol II = 0.2, Tyr1p=3.5 × 10⁻¹⁶, Ser5p=0.2, Ser7p=0.03. Boxplots do not show outliers for Pol II (3933 genes), Tyr1P (3897 genes), Ser5P (3920 genes), and Ser7P (3878 genes).
Figure 2—figure supplement 5
Ser2P average profile at genic locations and examples of Tyr1P signal at promoter locations.
(A) Ser2P average profile on 1415 genes selected on mean values distribution shown in Figure 2—figure supplement 1B and represented as for Figure 2C. (B) Examples of Tyr1P (and other isoforms, short ssRNAs) at promoters of 5 coding genes. These genes show a dominance of Tyr1P (3D12) signal upstream (AS direction) relatively to downstream TSSs and as compared to Pol II and isoforms.
Figure 2—figure supplement 6
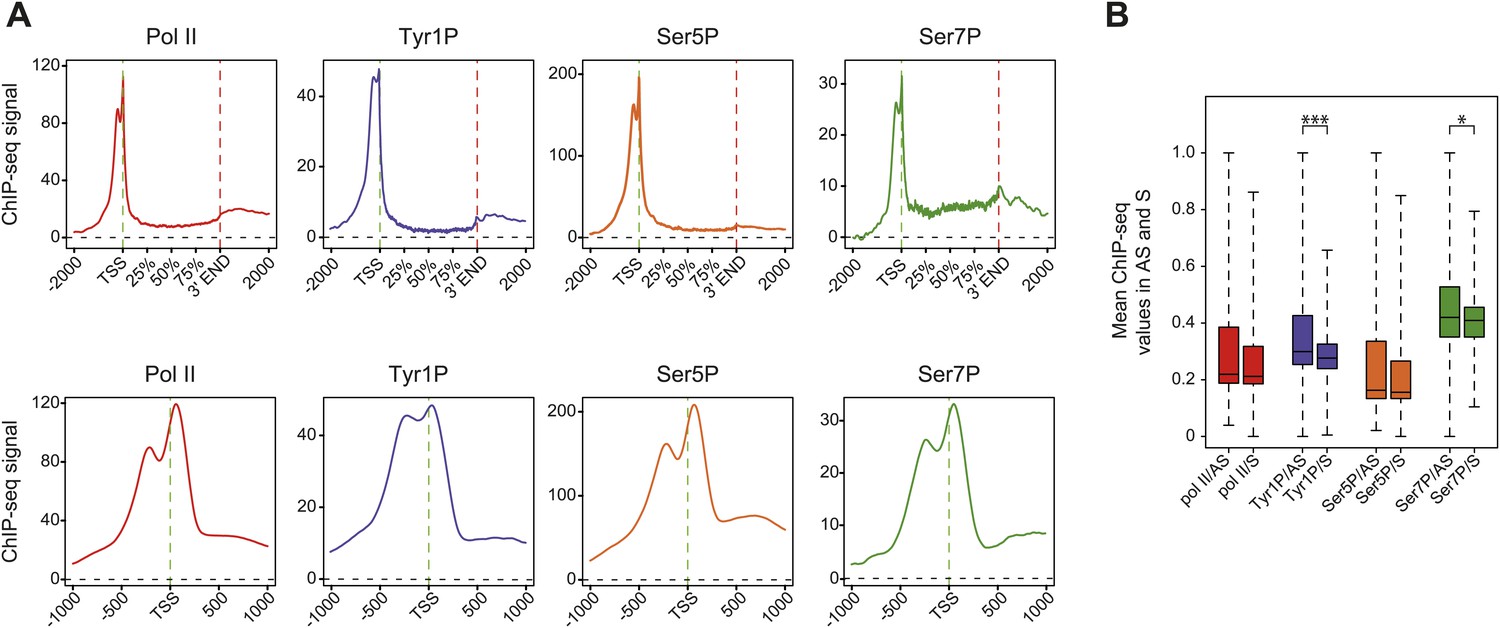
Tyr1P presents a specific pattern of phosphorylation along genes compared to Pol II.
(A) Genome-wide profiling of Pol II (N20) and CTD isoforms (as in Figure 2) for different classes of binding levels indicate a distribution of Tyr1P more prominent at promoters vs gene bodies as compared to Pol II and Ser7P, but comparable to that of Ser5P. The indicated signal rank of the values is over an area encompassing TSS, GB, and 3′ ends of genes as indicated in the ‘Materials and methods–Gene selection and average binding profiles’. Note that more Tyr1P signal is found at 3′ ends as compared to Ser5P. (B) Spearman correlation plots of significantly enriched areas for Pol II and phospho-isoforms (genes size >2 kb) indicate that Tyr1P relates more to Pol II and early transcription marks at promoters than it does at gene bodies or 3′ends. Mean values for Spearman correlation were computed at [TSS-500 bp;TSS+500 bp], [TSS+1000 bp; 3′end-500 bp], and [3′end-500 bp; 3′end+1000 bp] (‘Materials and methods–Correlation of biological replicates and cross-correlation’).
Figure 2—figure supplement 7
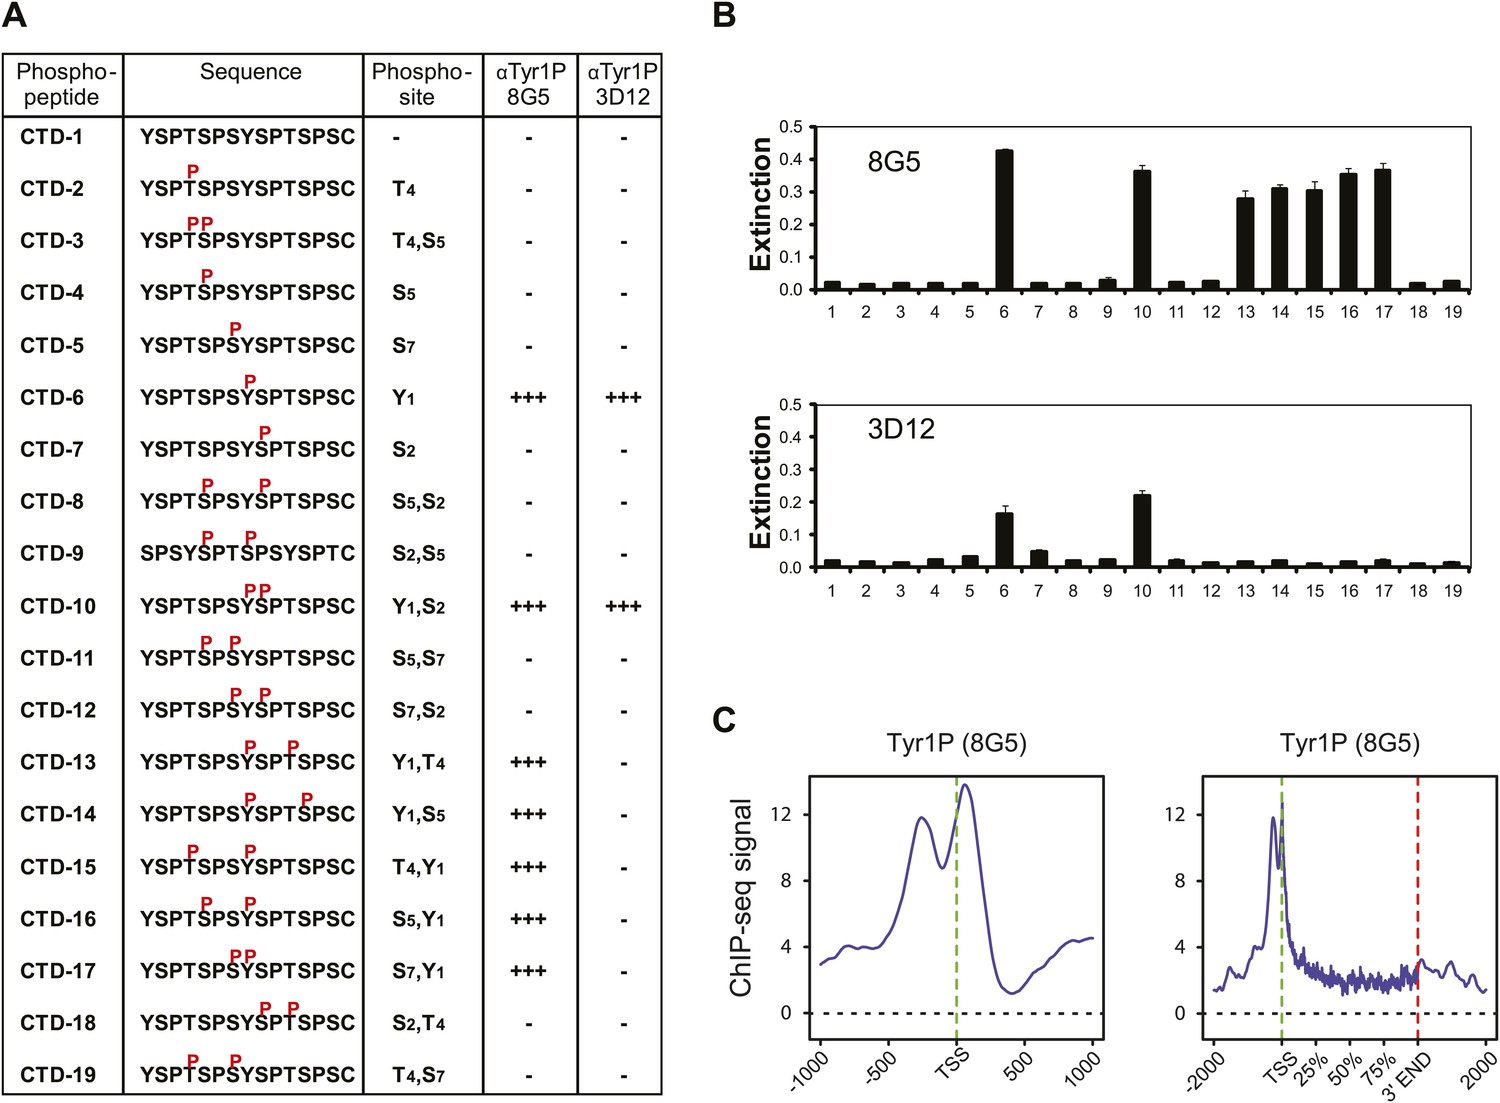
Tyr1P specific antibodies with distinct peptide recognition patterns show similar genome-wide profiling at TSS.
(A) CTD peptide recognition patterns of 3D12 and 8G5 Tyr1P Abs used in this study. Note that 8G5 shows a wider range of peptide recognition compared to 3D12. (B) Specificity and reactivity of mAbs were tested in ELISA experiments towards the peptides CTD-1 to -19. (C) Genome-wide profiling of ChIP-seq experiments performed with 8G5 at TSSs (left panel) or at gene body locations on 2365 genes. As for 3D12 Ab, the AS peak is over-represented when compared to Pol II.
Figure 3 with 2 supplements
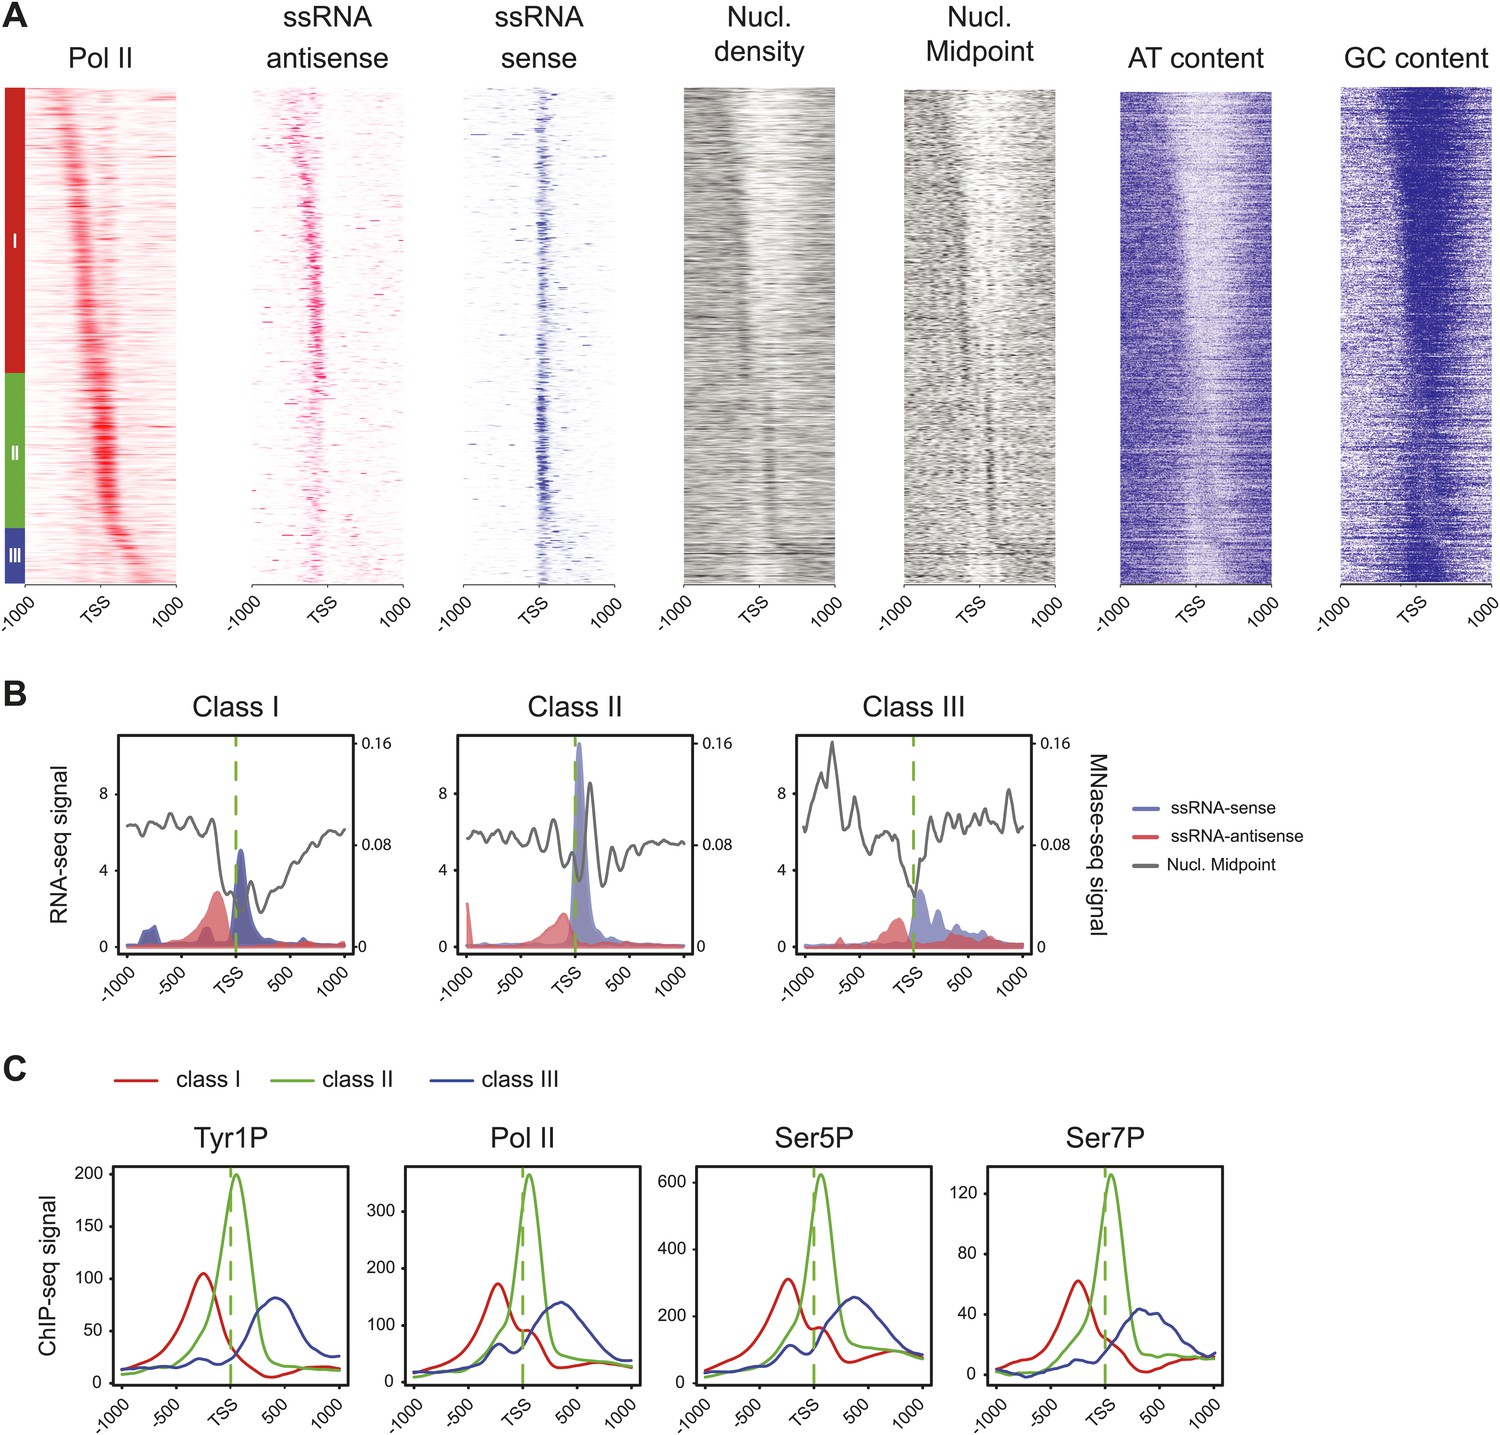
Tyr1 is preferentially phosphorylated in antisense orientation on a particular subset of genes.
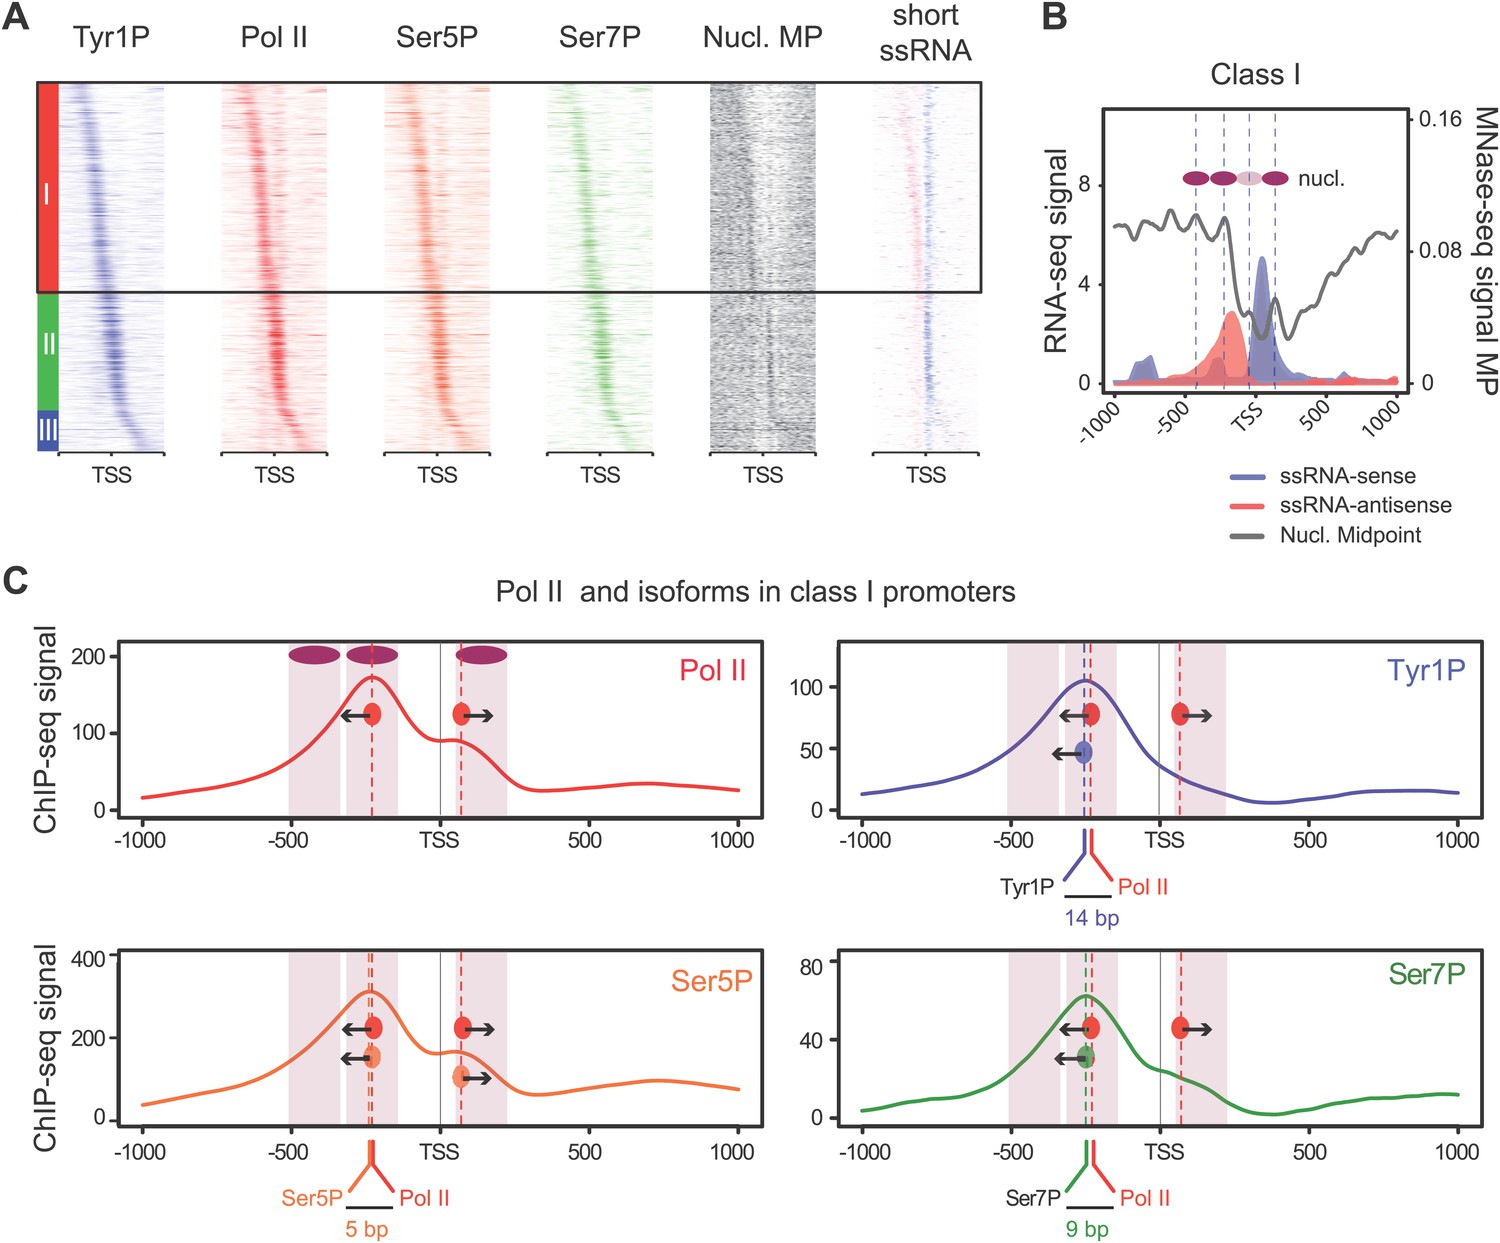
(A) Heatmaps of Tyr1P (3D12), Pol II, Ser5P, Ser7P, nucleosome midpoints (positioning) and short strand specific RNAs (red for AS and blue for S signal) at promoters with a significant level of Pol II. The genes were ordered by position of the main Tyr1P accumulation area from the most 5′ to the most 3′ within −1000 bp and +1000 bp around TSS. Three main classes are defined by Tyr1P occupancy: class I most 5′ (red bar, 1066 genes), class II TSS-proximal (green bar, 579 genes), and class III most 3′ (blue bar, 209 genes). (B) Average profiling of short ssRNAs and nucleosomes positions in class I. Positions of the nucleosome midpoints are indicated by a dashed line (nucleosome −3, −2, −1, and +1 from left to right). (C) Profiles of Pol II and CTD isoforms in class I. Red, blue, orange, and green dashed lines indicate the average position of the maximum values of Pol II, Tyr1P (3D12), Ser5P, and Ser7P signals, respectively. The distance between Pol II leading edge and isoforms is indicated below each graph. The borders of nucleosomes −3, −2, and +1 (from left to right) are shown as pink rectangles whereas the red, blue, orange, and green circles represent Pol II, Tyr1P, Ser5P, and Ser7P, respectively with indication of directionality based on the short ssRNA signals.
Figure 3—figure supplement 1
Three classes of Pol II-bound promoters ordered by Tyr1P location in human Raji cells.
(A) Heatmaps of a selection of Pol II-bound promoters for ssRNAs, nucleosome and AT, GC contents ordered by Tyr1P (3D12) maximum signal from the most upstream to the most downstream of the annotated TSSs (as previously described in mouse lymphocytes, Fenouil et al., 2012). Note that Pol II main accumulation areas occur at proximity of the main nucleosome position for each promoter class. As described before (Fenouil et al., 2012), GC content and CpG islands correlate with nucleosome depletion. (B) Profiles of ssRNAs (sense and antisense) and nucleosome in the three groups. (C) Profiles of Pol II and CTD isoforms in the three classes of promoters as indicated.
Figure 3—figure supplement 2
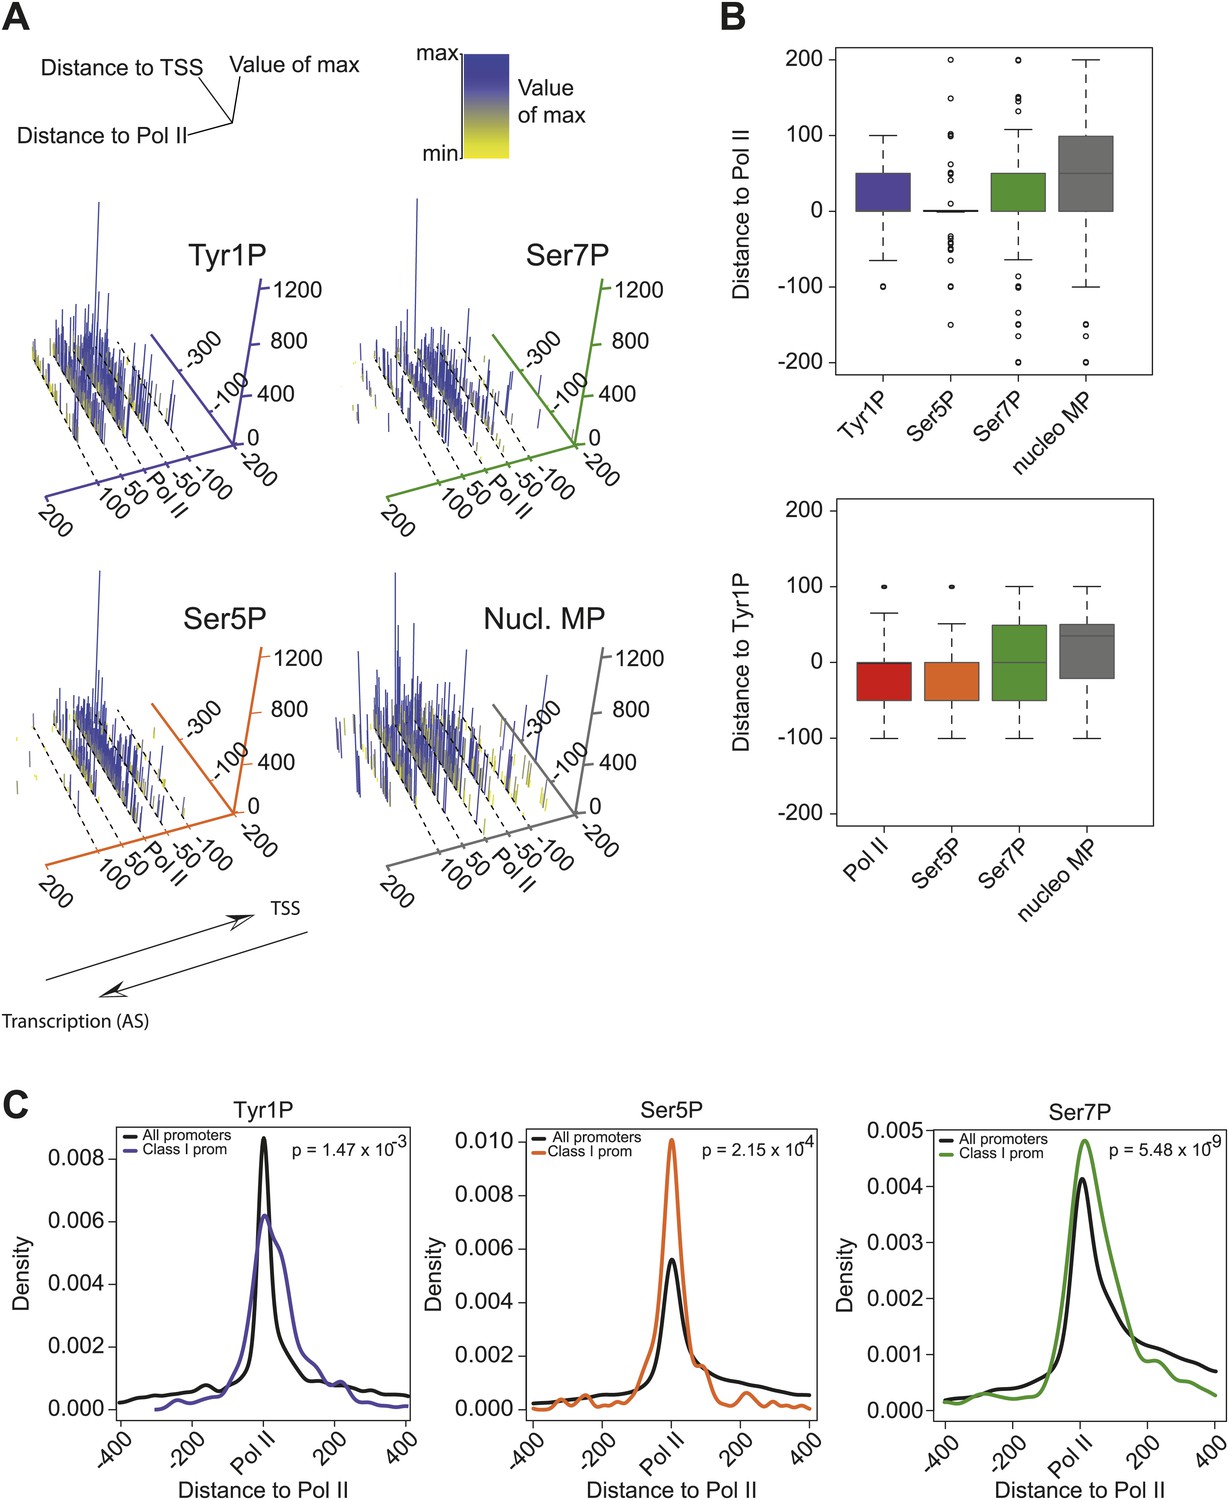
CTD isoforms and nucleosome distribution around Pol II upstream of TSSs in class I promoters.
(A) 3D plots of Tyr1P, Ser5P, Ser7P and nucleosomes midpoints (MP) maximum signal locations as compared to Pol II ChIP-seq maxima for genes of group 1 of Figure 3A. Only genes with a significant signal of antisense ssRNA and higher than sense ssRNA were taken into account (see ‘Materials and methods–CTD isoforms and nucleosomes midpoint maximal peaks spatial organization analysis’ for details). The positive values of the distance to Pol II axis (in bp) indicate that maximum signals are located after Pol II in opposite direction of TSSs whereas negative values are in the inverse orientation. The number of maximal peaks before, after or colocalized with Pol II for Tyr1P, Ser5P, and Ser7P are 90/265/174, 99/152/278, 125/234/170, respectively. Note that most of the Tyr1P max values are located after Pol II whereas Ser5P is mainly found around Pol II main signal. (B) 2D Boxplots of the maximum values shown in (A) (upper panel) and for an independent analysis using Tyr1P max signal as reference (lower panel). In both cases Tyr1P locates at or after the leading edge of Pol II. (C) Distance to Pol II distribution of Tyr1P, Ser5P, and Ser7P for class I promoters selected as described in (A). Data is represented in bins of 10 (‘Materials and methods–Processing of sequenced tags’). The difference of distribution with the whole set of genes (black line) was assessed by a nonparametric Kolmogorov-Smirnov test. p-values are indicated at the top-right of each panel.
Figure 4 with 3 supplements
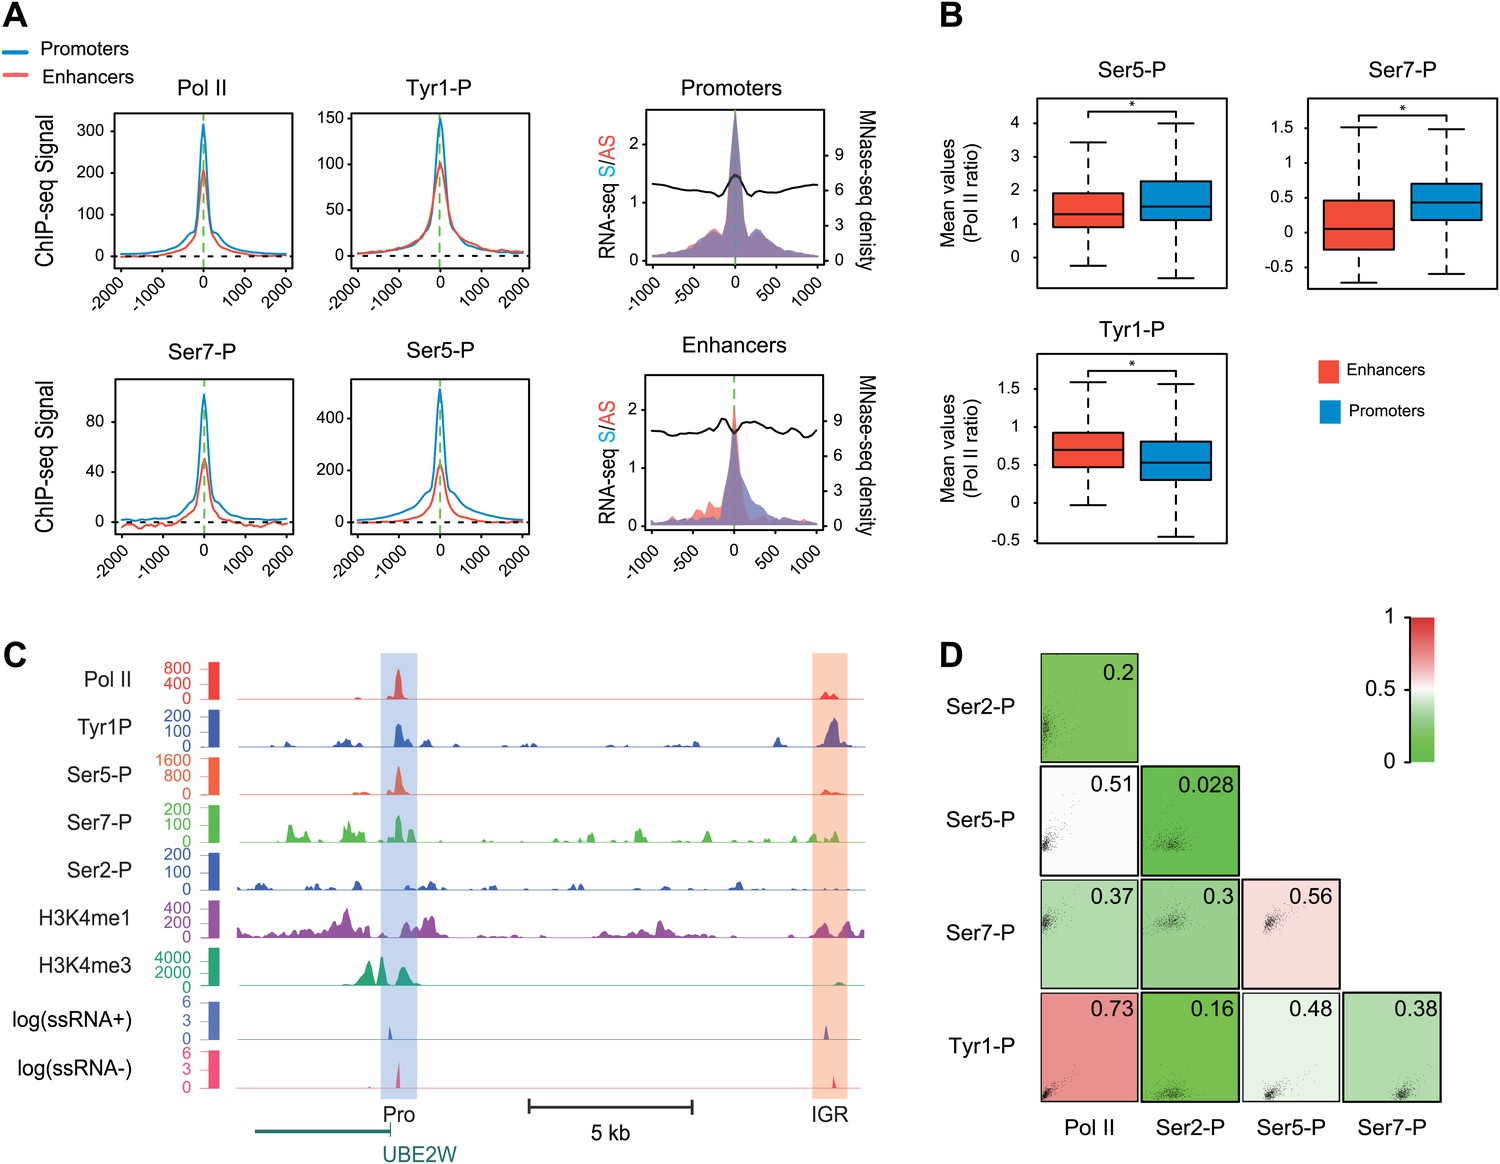
Tyr1P is a hallmark of enhancers relative to Pol II and promoters signal.
(A) Average profiling of Pol II, Tyr1P (3D12), Ser5P, Ser7P, nucleosomes occupancy, and short ssRNAs. 390 active putative enhancers (red) and 4618 control promoters (blue) were detected in human Raji B-cells (‘Materials and methods–Selection of enhancers and promoters using Pol II’). Profiles are centered on Pol II ChIP-seq maximal signal and are not oriented. (B) Boxplots of mean ChIP-seq signal on selected enhancer and control promoter regions for Ser5P (371/4378 values), Ser7P (368/4257 values), and Tyr1P (372/4266 values). Signals were normalized by the mean ChIP-seq signal of Pol II on the same regions. All marks show a significant difference (nonparametric Mann-Whitney-Wilcoxon test, p-values <10−10). (C) Example of Tyr1P at promoter and putative enhancer. (D) Spearman cross-correlation between Pol II, Ser5P, Ser7P, Ser2P, and Tyr1P (3D12) at intergenic putative enhancers. Tyr1P and Pol II best correlate with each other.
Figure 4—figure supplement 1
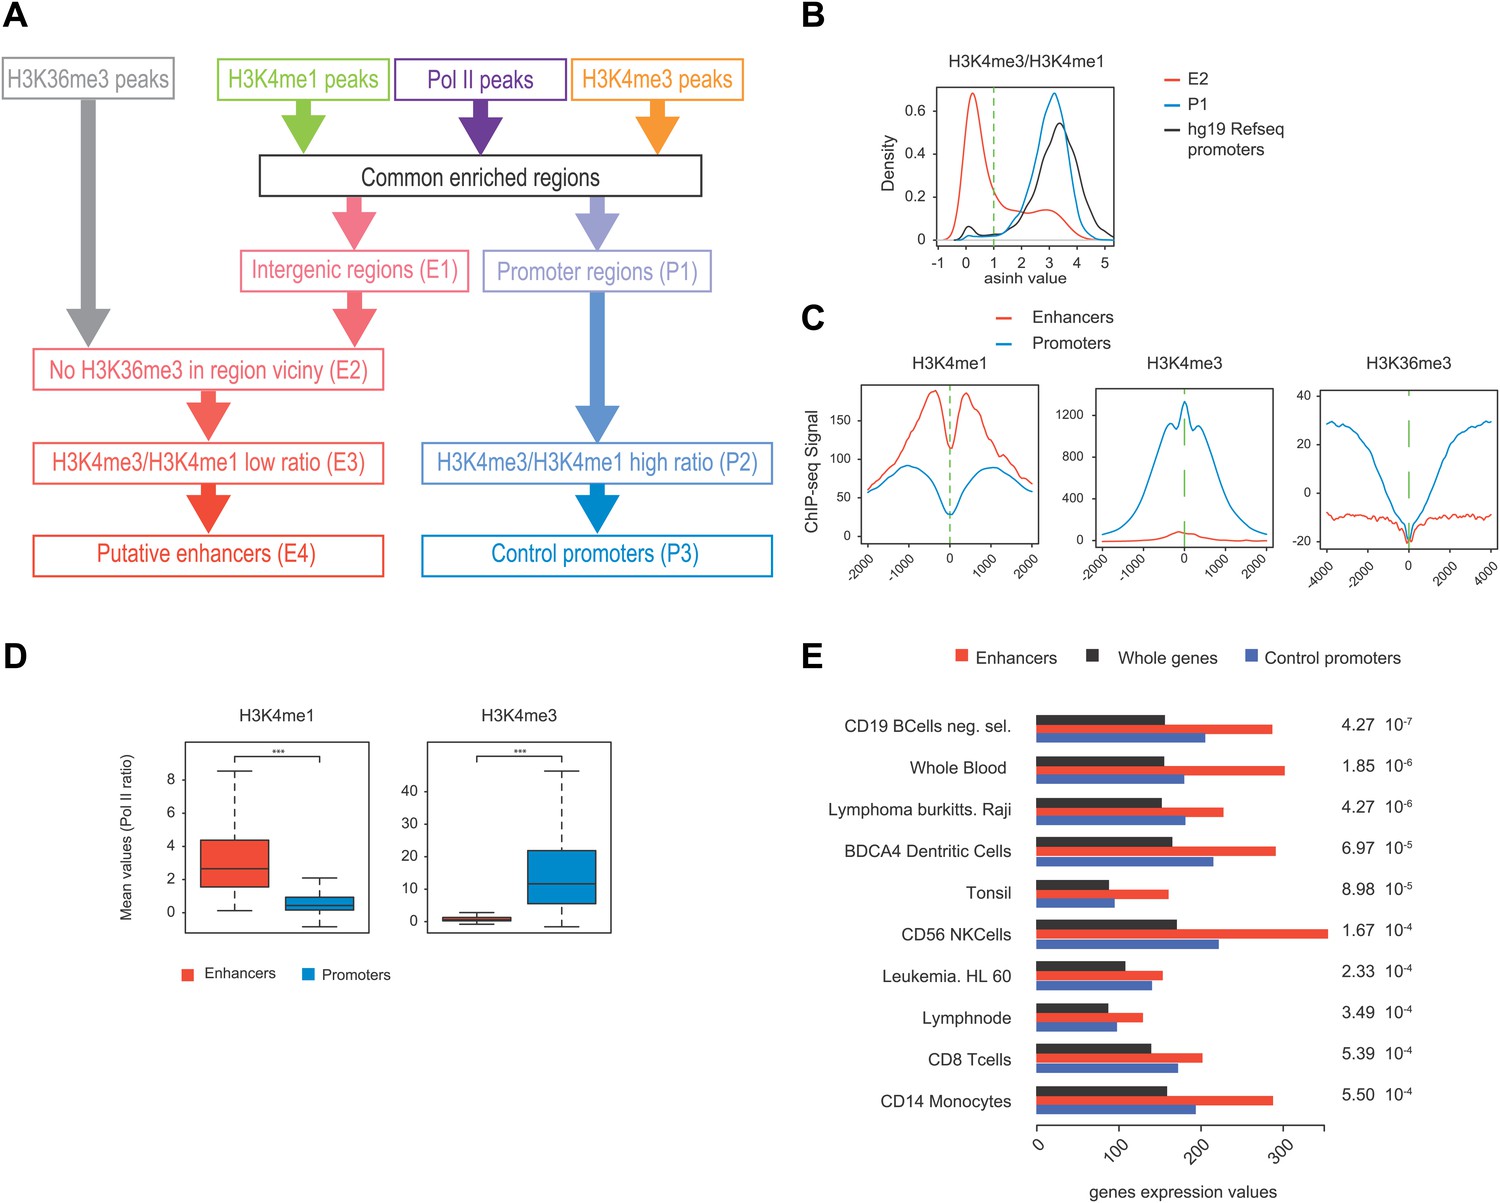
Pol II-bound enhancer selection procedure and features.
(A) Workflow of the enhancers (390) and control promoters (4618) selection based on ChIP-seq of H3K36me3, H3K4me3, H3K4me1, and Pol II. Details of procedure and number of regions isolated at each step (E1-4 and P1-3) are indicated in ‘Materials and methods–Selection of enhancers and promoters using Pol II’. (B) Plot of H3K4me3/me1 mean values ratios of selected intergenic regions at step E2 (in red), promoter regions at step P1 (in blue), and Hg19 RefSeq annotated promoters (in black). To stringently select isolated promoters and intergenic regions shown in (A) and attribute their putative enhancer and control promoter status, a threshold was defined (in dashed green line). (C) Nonoriented profiling of epigenetic marks associated with putative enhancers (in red) and control promoters (in blue) selected at steps P3 and E4 of procedure described in (A) and centered on the main Pol II peak as in Figure 4A. (D) Boxplots of H3K4me3 (363/4325 genes plotted) and H3K4me1 (375/4259 genes plotted) signals at putative enhancers (in red) and control promoters (in blue). Nonparametric Mann-Whitney-Wilcoxon test gave p-values <10−152. (E) Tissue specificity analysis of the genes associated with putative enhancers (closest genes on each side of the isolated genomic loci) compared to genes of HGU133 array (whole genes, see ‘Materials and methods–Tissue specificity analysis’). The isolated tissues are ranked by p-values (indicated on the left) from top to bottom. This analysis indicates that both WT (CD19) and Raji human B-cells are among the most significant tissues thus validating the putative enhancer regions identified in our analysis and as described in mouse lymphocytes (Li et al., 2012).
Figure 4—figure supplement 2
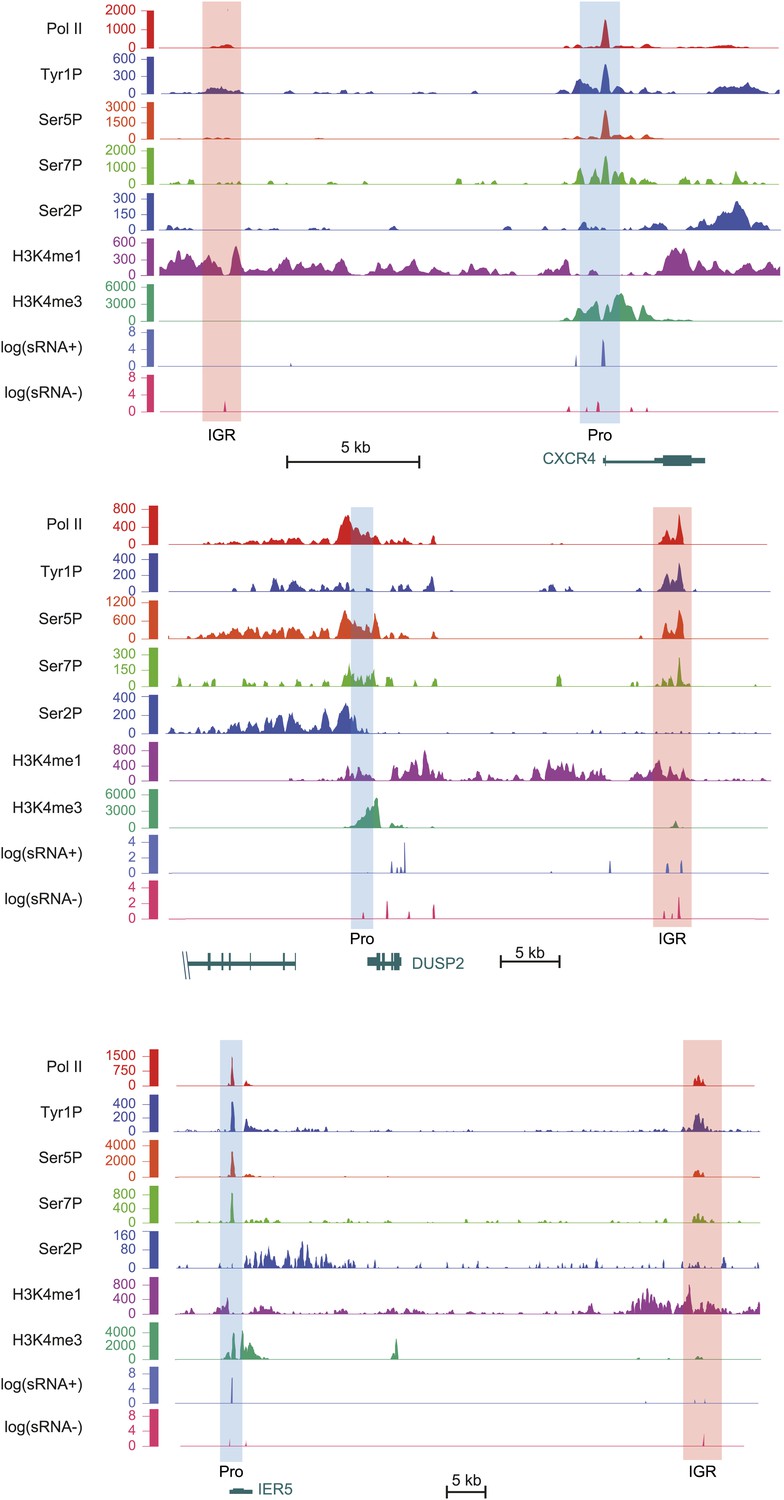
Examples of Tyr1P enhancer association upstream or downstream of CXCR4, DUSP2, and IER5 genes.
As in Figure 4, light orange and blue rectangles highlight enhancer and promoter locations with higher H3K4me3 at promoters and higher H3K4me1 at enhancers. Relative amount of Tyr1P is higher at enhancers as compared to Pol II and to promoters. H3K4me3 level at CXCR4 IGR was observed but is not visible due to the scale used and because of high level of signal at promoter.
Figure 4—figure supplement 3
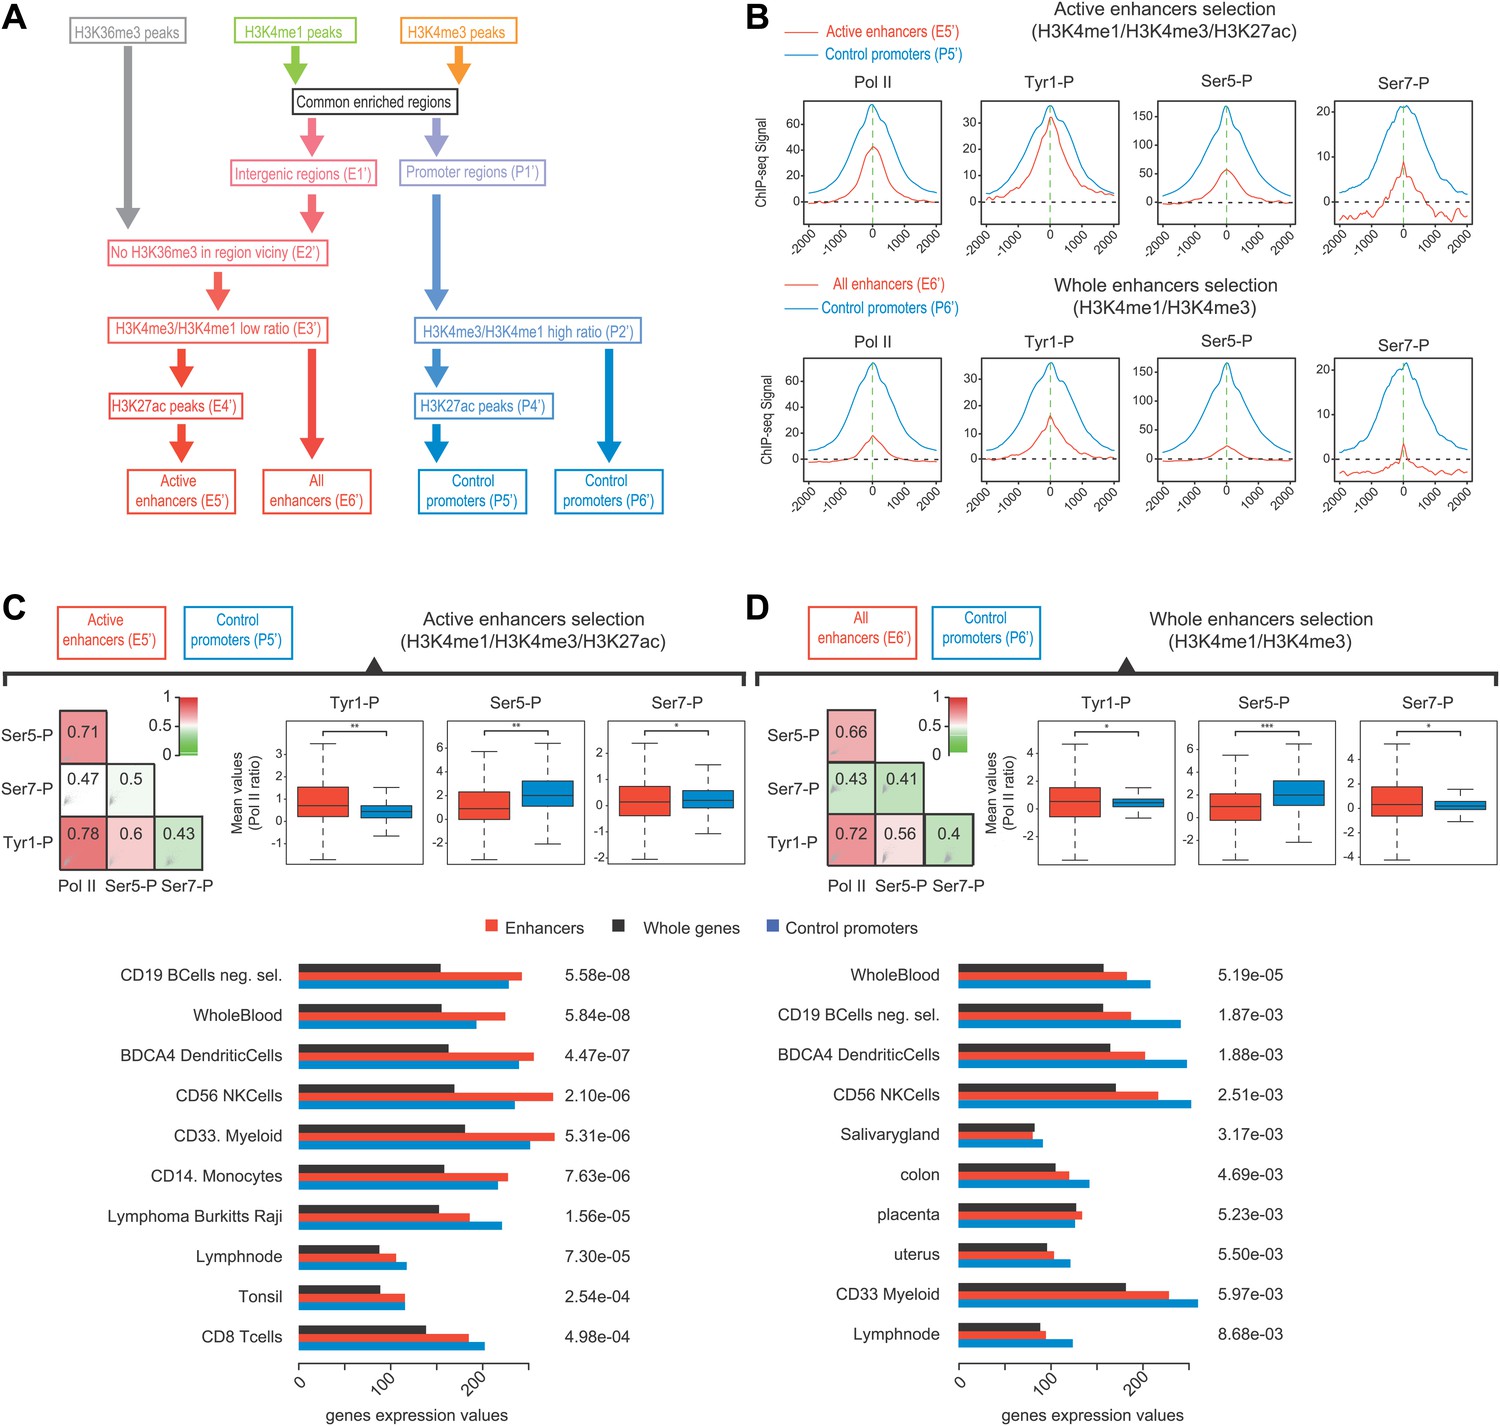
Selection of enhancers using H3K27ac also shows a dominance of Tyr1P on active and tissue specific enhancers.
(A) Workflow of a complementary selection of enhancers (927/2598 active), and control promoters (5946/6057 active) based on ChIP-seq of H3K36me3, H3K4me3, and H3K4me1. H3K27ac was used to extract specifically active enhancers from the whole set. Details of procedure and number of regions isolated at each step (E1'-6' and P1'-6') are indicated in ‘Materials and method–Selection of active enhancers and promoters using H3K27ac’. (B) Average profiles of Pol II and isoforms for active enhancers/promoters and the whole set of enhancers/promoters. (C) Active (H3K27ac selection) enhancers show increased enrichment over Pol II and tissue-specific gene expression. As in Figure 4, Spearman correlation, boxplots of comparison of levels of Pol II isoforms, and tissue specificity analyses indicate Tyr1P to be over-enriched at active enhancers as compared to Pol II and promoters. Nonparametric two-sided Mann-Whitney-Wilcoxon test for boxplots of Ser5P (780/5068 values), Ser7P (752/4953 values), and Tyr1P (739/5233 values) yields p-values of 5.1 × 10−56, 7.05 × 10⁻⁴, and 2.1 × 10⁻³⁰, respectively. (D) Whole enhancer set (H3K4me1/3) analysis as in (C). Nonparametric two sided Mann-Whitney-Wilcoxon test for boxplots of Ser5P (2220/5141 values), Ser7P (2186/5005 values), and Tyr1P (2112/5306 values) yields p-values of 2.6 × 10−139, 6.8 × 10⁻⁴, and 8.09 × 10⁻⁴, respectively.
Tables
Table 1
Summary of ChIP conditions and bioinformatics treatment for each experiment (NR = not relevant, NA = not available)
| ChIP antibodies and conditions used (* For ChIP-QPCR) | Peak detection | ||||||||||||
|---|---|---|---|---|---|---|---|---|---|---|---|---|---|
| Experiment | Antibody (clone) | Origin | Reference Antibody | Number of cells | Antibody/Beads | Washes (RIPA/TE) | Replicates Number | Tags Not Aligned/Multiple Alignment (× 106) | Tags Used (× 106) | Lanes Number | Extension Size (bp) | Threshold | Max Gap |
| Pol II | Total (N-20) | Rabbit polyclonal | Santa Cruz (sc-899x) | 1 × 10⁸ | 20 µg/200 µl | 8x/1x | 1 | 8.93 | 19.83 | 1 | 176 | 80 | 350 |
| 2 | 17.94 | 33.02 | 2 | 166 | |||||||||
| 3 | 16.54 | 28.48 | 1 | 156 | |||||||||
| H3K4me1 | H3K4me1 | Rabbit polyclonal | Abcam (ab8895) | 5 × 10⁶ | 2 µg/20 µl | 8x/1x | 1 | 9.35 | 7.83 | 1 | 176 | 60 | 700 |
| 2 | 7.59 | 20.93 | 1 | 226 | |||||||||
| H3K4me3 | H3K4me3 | Rabbit polyclonal | Abcam (ab8580) | 5 × 10⁶ | 2 µg/20 µl | 8x/1x | 1 | 7.12 | 2.61 | 1 | 186 | 50 | 400 |
| 2 | NA | 14.14 | 1 | 123 | |||||||||
| H3K36me3 | H3K36me3 | Rabbit polyclonal | Abcam (ab9050) | 2 × 10⁷ | 8 µg/80 µl | 8x/1x | 1 | NA | 21.21 | 1 | 196 | 40 | 1000 |
| 2 | NA | 5.57 | 1 | 316 | |||||||||
| H3K27ac | H3K27ac | Rabbit polyclonal | Ab4729 | 5 × 10⁶ | 2 µg/20 µl | 5x/1x | 1 | 5.33 | 52.50 | 1 | 197 | 100 | 750 |
| Tyr1P | Tyr1P (3D12) | Rat monoclonal | Mayer et al. (2012) | 1 × 10⁸ | 10 µg/100 µl | 5x/1x | 1 | 12.30 | 15.56 | 1 | 206 | NR | NR |
| 2 | 9.98 | 15.55 | 1 | 276 | |||||||||
| Tyr1P (8G5) | Rat monoclonal | This article | 1 × 10⁸ | 10 µg/100 µl | 5x/1x | 1 | 30.26 | 28.78 | 1 | 187 | NR | NR | |
| Ser2P | Ser2P (3E10) | Rat monoclonal | Chapman et al. (2007) | 2 × 10⁸ | 80 µg/400 µl | 5x/1x | 1 | 9.31 | 11.28 | 1 | 192 | NR | NR |
| 2 | 9.85 | 15.94 | 1 | 286 | |||||||||
| Ser5P | Ser5P (3E8) | Rat monoclonal | Chapman et al. (2007) | 1.2 × 10⁸ (2.5 × 10⁷*) | 24 µg/240 µl (5 µg/50 µl*) | 8x/1x | 1 | NA | 13.98 | 1 | 146 | NR | NR |
| 2 | NA | 3.57 | 1 | 216 | |||||||||
| Ser7P | Ser7P (4E12) | Rat monoclonal | Chapman et al. (2007) | 1 × 10⁸ | 10 µg/100 µl | 5x/1x | 1 | NA | 16.46 | 1 | 156 | NR | NR |
| 2 | NA | 1.92 | 1 | 226 | |||||||||
| Short-RNA-seq | NR | NR | NR | 1 × 10⁷ | NR | NR | 1 | NA | 9.87 | 1 | NR | NR | NR |
| MNase-seq | NR | NR | NR | 2 × 10⁷ | NR | NR | 1 | 90.00 | 289.60 | 1 | 152/NR midpoints** | NR | NR |
| Input | NR | NR | NR | NR | NR | NR | 1 | 20.10 | 18.18 | 1 | 126 | NR | NR |
| 2 | NA | 29.74 | 1 | 146 | |||||||||
| 3 | 15.41 | 24.93 | 1 | 118 | |||||||||
| 4 | 11.20 | 28.32 | 1 | 196 | |||||||||
-
**
For MNase-seq, the experiment was performed and processed in pair-end. For nucleosome density, tags were not elongated but connected and the indicated sequence average length is withdrawn by our analysis pipeline using the pair-end information. For midpoints analyses, elongation does not apply and data treatment is indicated earlier in ‘Materials and methods–Processing of sequenced tags’.
Additional files
-
Source code 1
Folder containing the different scripts used in this study.
- https://doi.org/10.7554/eLife.02105.022
Download links
A two-part list of links to download the article, or parts of the article, in various formats.
Downloads (link to download the article as PDF)
Open citations (links to open the citations from this article in various online reference manager services)
Cite this article (links to download the citations from this article in formats compatible with various reference manager tools)
Tyrosine phosphorylation of RNA polymerase II CTD is associated with antisense promoter transcription and active enhancers in mammalian cells
eLife 3:e02105.
https://doi.org/10.7554/eLife.02105


