Reinstatement of long-term memory following erasure of its behavioral and synaptic expression in Aplysia
- University of California, Los Angeles, United States
- David Geffen School of Medicine at UCLA, United States
- Brain Research Institute, University of California, Los Angeles, United States
Figures
Figure 1 with 1 supplement

Blockade of memory reconsolidation reverses 5HT-induced synaptic growth.
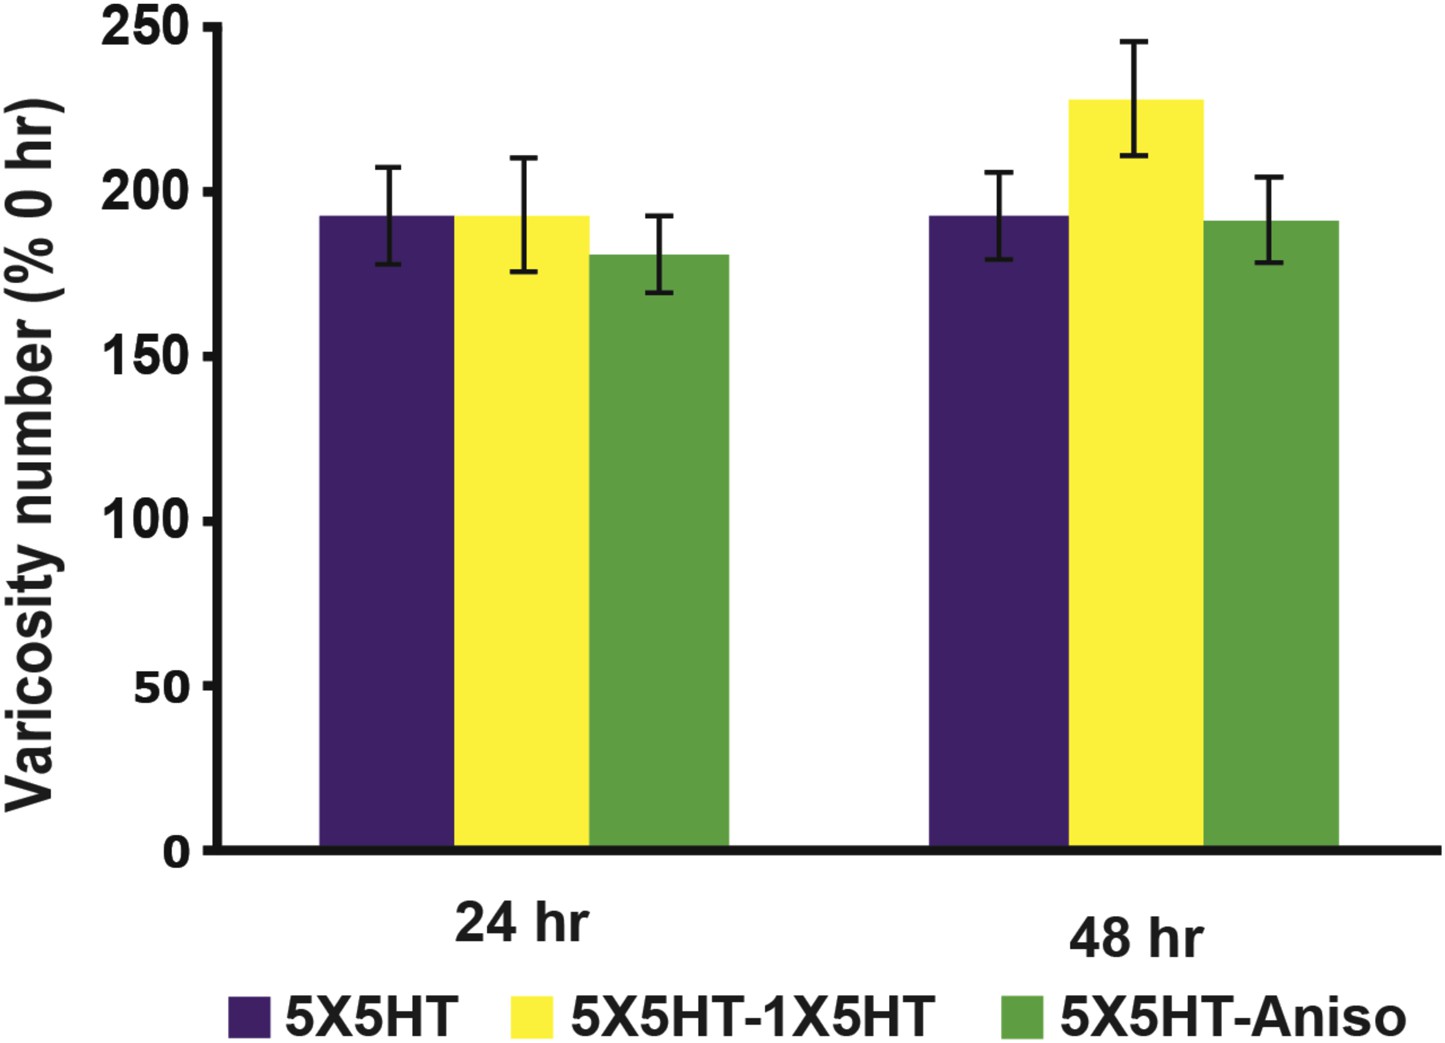
(A) Experimental protocol. The vertical blue bars represent pulses of 5HT, and the horizontal red bar represents anisomycin/vehicle treatment. A reminder pulse of 5HT (single blue bar) was delivered to the 5X5HT-1X5HT-Aniso cocultures prior to the anisomycin. (B) Sample confocal micrographs of a Control coculture. Blue arrowheads, presynaptic varicosities present at 0 hr; red arrowheads, new varicosities that appeared during 0–24 hr; and yellow arrowheads, varicosities formed during the 24–48 hr period. Scale bar, 20 μm. (C) Mean normalized varicosity number at 24 hr and 48 hr in the Control (n = 21), 5X5HT (n = 21), 5X5HT-Aniso (n = 19), and 5X5HT-1X5HT-Aniso (n = 26) groups. The number of varicosities measured at 24 hr and 48 hr was normalized to the number present at 0 hr (Note that differences in the data for the 5X5HT and 5X5HT-1X5HT groups were not significant, and two groups have been grouped together in the graph. The separate data for the 5X5HT-1X5HT group can be found in Figure 1—figure supplement 1). A repeated-measures ANOVA indicated that there was a significant group × time interaction (F[3,83] = 9.5, p < 0.0001). Planned comparisons using one-way ANOVAs indicated that the group differences at 24 and 48 hr were highly significant (F[3,83] = 8.6 for 24 hr and 12.5 for 48 hr; p < 0.0001 for the results of each ANOVA). SNK posthoc tests on the 24 hr data showed that the mean normalized varicosity number in the 5X5HT group (192.8 ± 12.7%), 5X5HT-Aniso group (180.9 ± 11.6%), and 5X5HT-1X5HT-Aniso group (179.5 ± 14.6%) was each significantly greater than that in the Control group (110.3 ± 8.5%; p < 0.001 for all comparisons). The increase in varicosity number persisted to 48 hr in the 5X5HT group (197.9 ± 12.2%, p < 0.001) and 5X5HT-Aniso group (191.6 ± 13.2%, p < 0.001), but not in the 5X5HT-1X5HT-Aniso group (124.4 ± 10.9%), when compared to the Control group (108.9 ± 15.2%). The difference between the 5X5HT-Aniso and 5X5HT-1X5HT-Aniso groups was highly significant (p < 0.001). Asterisks indicate a significant difference for comparisons with the Control group; plus signs indicate a significant difference for comparisons with the 5X5HT-1X5HT-Aniso group. Here and in subsequent figures one symbol indicates p < 0.05; two symbols, p < 0.01; three symbols, p < 0.001. Error bars represent ±SEM.
Figure 1—figure supplement 1
Graphs presenting the normalized mean varicosity numbers for the three 5HT-trained groups not subjected to reconsolidation blockade.
The mean normalized varicosity number at 24 hr was 192.7 ± 15.0% in the 5X5HT group (n = 18), 193.3 ± 17.6% in the 5X5HT-1X5HT group (n = 3), and 180.9 ± 11.6% in the 5X5HT-Aniso group (n = 19). At 48 hr the mean normalized varicosity number was 192.9 ± 13.7% in the 5X5HT group, 228.3 ± 17.4% in the 5X5HT-1X5HT group, and 191.6 ± 13.2% in the 5X5HT-Aniso group. A repeated-measures ANOVA indicated that neither the interaction (F[2,37] = 0.8, p = 0.45), nor the overall effects of group (F[2,37] = 0.3, p = 0.73), was significant.
Figure 2 with 1 supplement
Effect of reconsolidation blockade on the fates of individual varicosities.
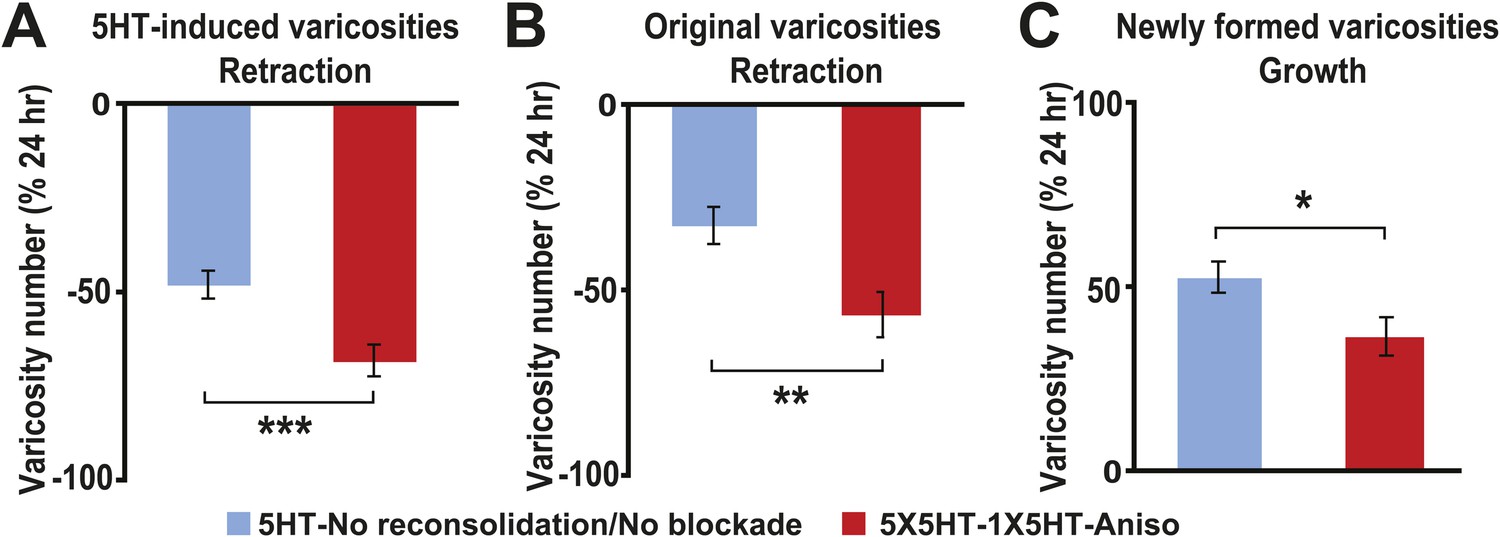
For varicosities in the 5HT-induced and original categories, the varicosity count in a given category for each coculture at 48 hr was normalized to the number of varicosities in the same category in that coculture at 24 hr. For the varicosities formed >24 hr, the varicosity count for each coculture at 48 hr was normalized to the total number of varicosities in that coculture at 24 hr. (A) The mean normalized decrease in the number of 5HT-induced varicosities (varicosities that appeared within 24 hr after 5X5HT training) at 48 hr was 67.9 ± 4.2% in the 5X5HT-1X5HT-Aniso group, which was greater than that in the 5HT-No reconsolidation/No blockade group (47.7 ± 3.7%, p < 0.001, two-tailed t test). (B) Retraction of original varicosities in the 5X5HT-1X5HT-Aniso group (56.4 ± 6.1%) was significantly greater than in the 5HT-No reconsolidation/No blockade group (32.3 ± 5.1%, p < 0.01, two-tailed t test). (C) Reversal of the morphological changes induced by 5X5HT training also involved inhibition of synaptic growth from 24–48 hr. There was significantly less growth of new varicosities during this period in the 5X5HT-1X5HT-Aniso group (36.8 ± 5.2%) than in the 5HT-No reconsolidation/No blockade group (52.9 ± 4.2%, p < 0.05, two-tailed t test). Blue bars, 5HT-No reconsolidation/No blockade; red bars, 5X5HT-1X5HT-Aniso group. Asterisks indicate significant differences between the 5HT-No reconsolidation/No blockade and 5X5HT-1X5HT-Aniso groups. Error bars represent ±SEM.
Figure 2—figure supplement 1
Comparison of retraction of original and 5HT-induced varicosities between 24–48 hr in the reconsolidation blockade experiments.
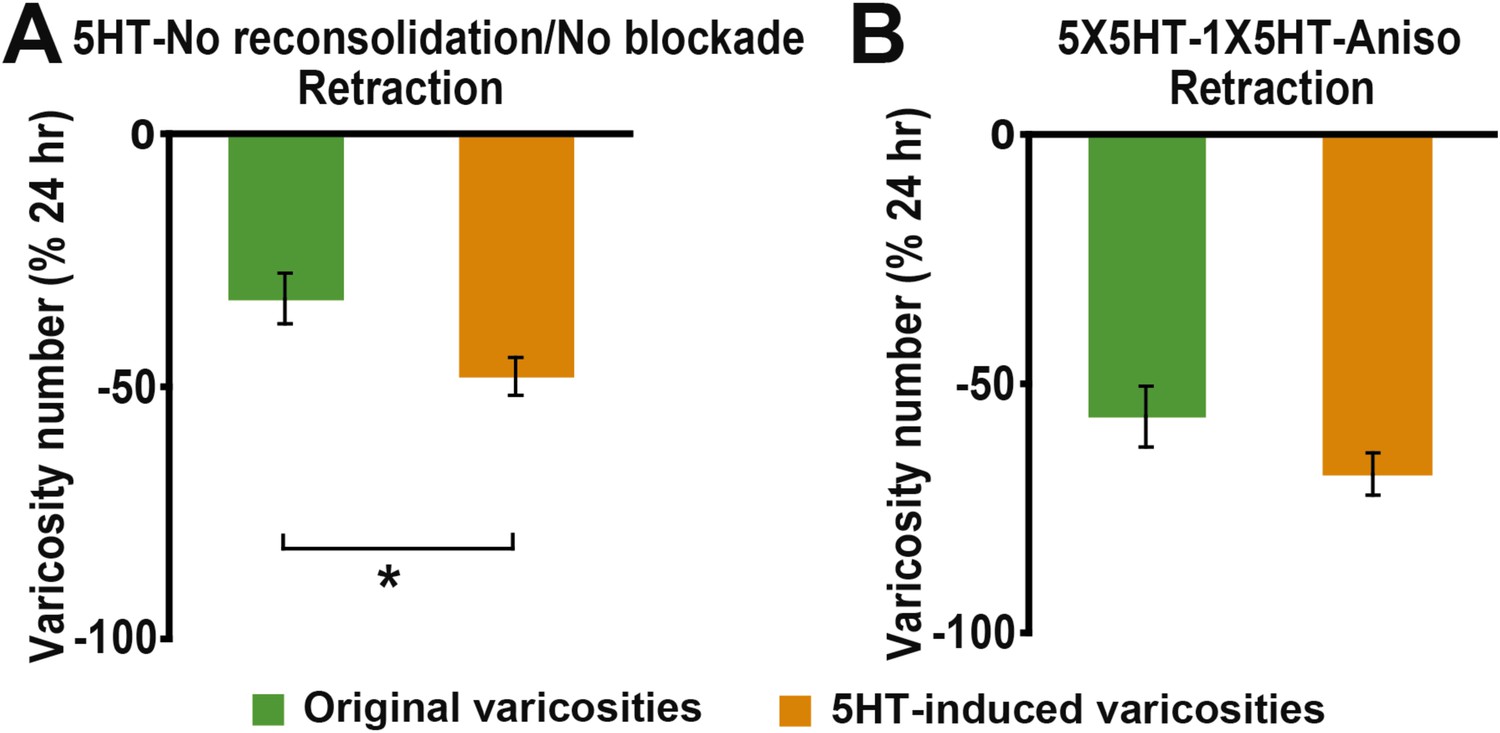
(A) The percent retraction of 5HT-induced varicosities (47.7 ± 3.7%) was significantly greater than that of the original varicosities (32.3 ± 5.1%, p < 0.02, two-tailed t test) in the 5HT-No reconsolidation/No blockade group. (B) The percent retraction of the 5HT-induced varicosities (67.9 ± 4.2%) did not differ significantly from that of original varicosities (56.4 ± 6.1%) in the 5X5HT-1X5HT-Aniso group.
Figure 3
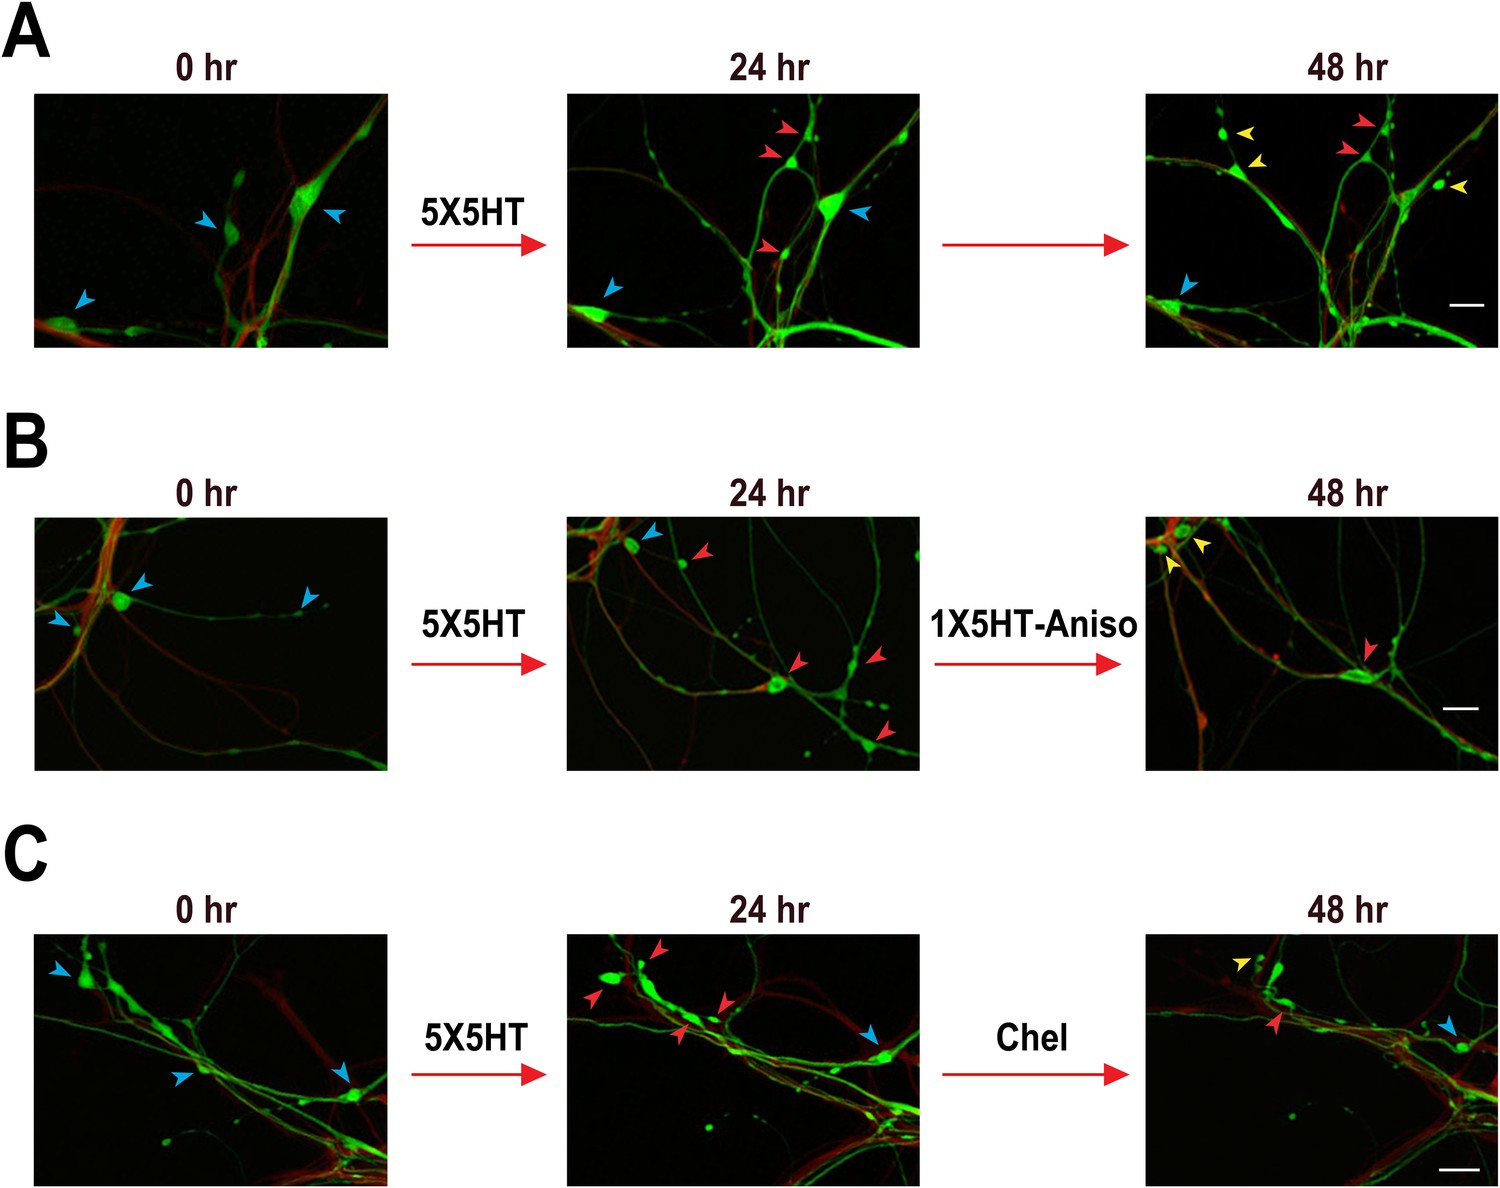
Confocal fluorescence micrographs illustrating the structural effects of 5X5HT training, reconsolidation blockade, and chelerythrine treatment.
(A) Coculture that received 5X5HT training alone. (B) Coculture that received the 5X5HT training plus 1X5HT and anisomycin treatment immediately after the 24 hr imaging session. (C) Coculture that received the 5X5HT training plus chelerythrine treatment immediately after the 24 hr imaging session. Blue arrowheads, varicosities present at 0 hr; red arrowheads, varicosities formed during 0–24 hr; and yellow arrowheads, varicosities formed during 24–48 hr. Scale bars, 20 μm.
Figure 4
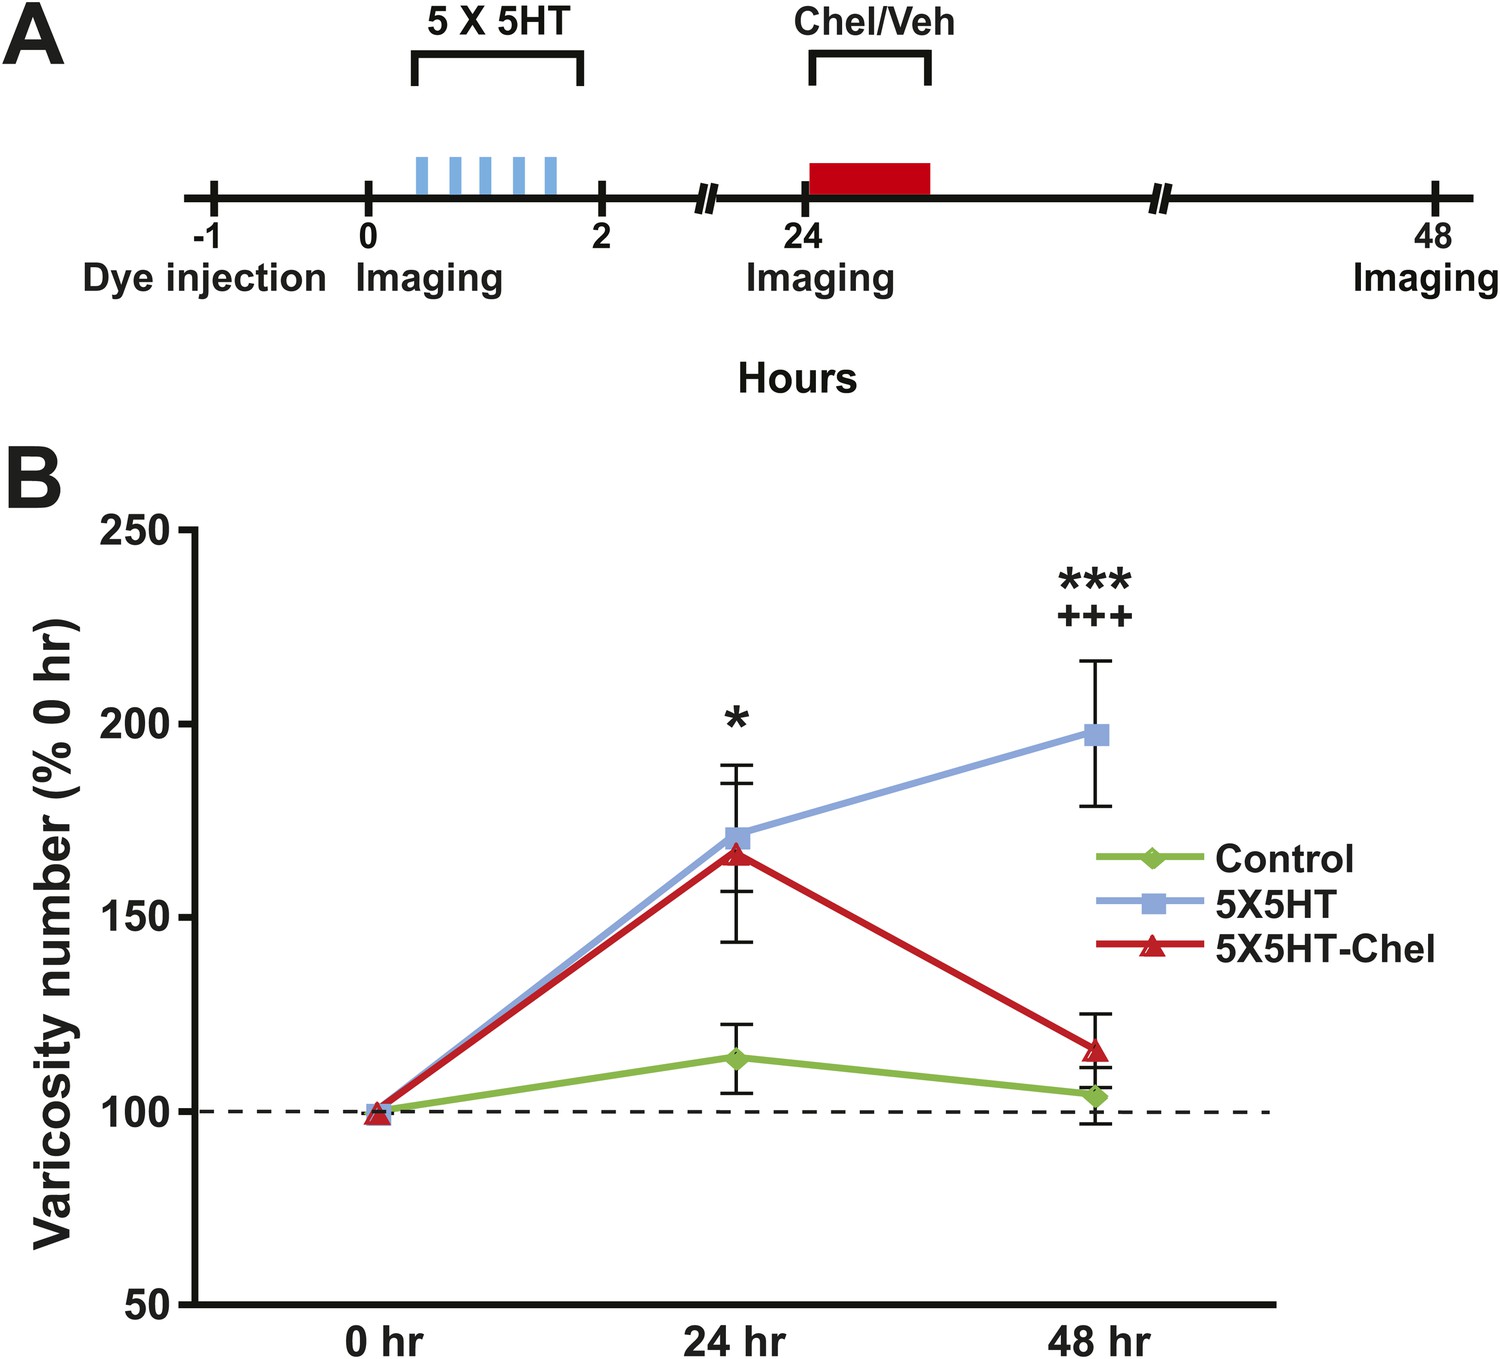
Inhibition of PKM also reverses 5HT-induced synaptic growth.
(A) Experimental protocol. The vertical blue bars represent pulses of 5HT; the horizontal red bar represents the period of chelerythrine/vehicle treatment. The 5X5HT and Control groups received vehicle treatment during this time. (B) Mean SN varicosity number measured at 24 hr and 48 hr for the Control (n = 14), 5X5HT (n = 21) and 5X5HT-Chel (n = 14). The number of varicosities measured at 24 hr and 48 hr was normalized to the number of varicosities at 0 hr. A repeated-measures ANOVA indicated that there was a significant group × time interaction (F[2,46] = 7.5, p < 0.001). Planned comparisons showed that the group differences were significant for both the 24 and 48 hr measurements (24 hr, F[2,46] = 3.7, p < 0.04; 48 hr, F[2,46] = 12.8, p < 0.0001). The mean normalized varicosity number at 24 hr was 171.2 ± 14.0% in the 5X5HT group, 166.9 ± 22.8% in the 5X5HT-Chel group, and 114.0 ± 8.9% in the Control group. Posthoc comparisons indicated that the 5X5HT training produced a significant increase in varicosity number in the 5X5HT and 5X5HT-Chel groups at 24 hr (p < 0.05 for both comparisons with the Control group). The mean normalized varicosity number at 48 hr in the 5X5HT group (197.9 ± 18.7%) was greater than that in the Control group (104.4 ± 7.2%, p < 0.001), but the 5X5HT-Chel group mean (116.1 ± 9.5%) was not significantly different from the Control mean. The difference between the mean varicosity numbers for the 5X5HT and 5X5HT-Chel groups was highly significant (p < 0.001). Asterisks, comparison between 5X5HT and Control groups; plus signs, comparison between 5X5HT and 5X5HT-Chel groups. Error bars represent ±SEM.
Figure 5 with 1 supplement
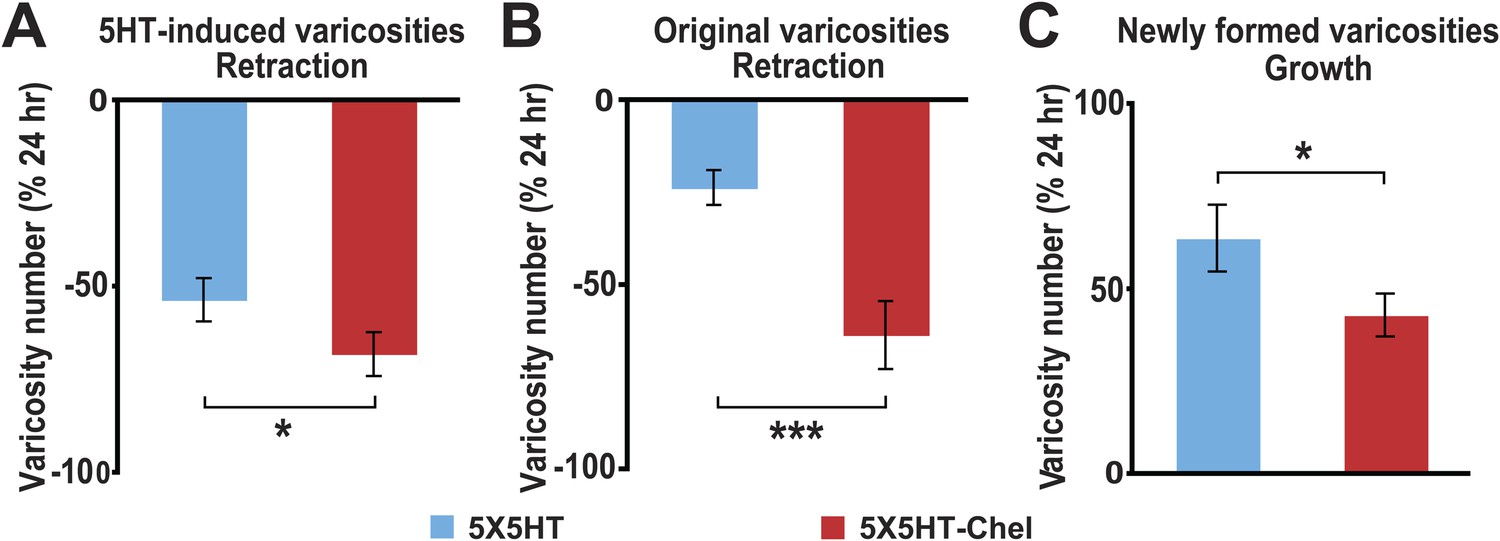
Effect of inhibition of PKM on varicosity fate.
For the 5HT-induced and original varicosities, the number of varicosities in each category for each coculture at 48 hr was normalized to the number in the same category in that coculture at 24 hr. For the varicosities formed >24 hr, the number of varicosities for each coculture at 48 hr was normalized to the total number of varicosities in the coculture at 24 hr. (A) The mean normalized decrease in the number of 5HT-induced varicosities at 48 hr was 53.4 ± 5.8% in the 5X5HT group and 68.0 ± 5.8% in the 5X5HT-Chel group (p < 0.05, one tailed t test). (B) The mean normalized decrease in the number of original varicosities at 48 hr was 23.5 ± 4.7% in the 5X5HT group and 63.4 ± 9.3% in the 5X5HT-Chel group (p < 0.001, two-tailed t test). (C) More presynaptic varicosities were formed during 24–48 hr in the 5X5HT group (63.9 ± 9.0%) than in the 5X5HT-Chel group (43.2 ± 5.8%, p < 0.05, one-tailed t test). Blue bars, 5X5HT group; red bars, 5X5HT-Chel group. Asterisks, comparison between 5X5HT and 5X5HT-Chel groups. Error bars represent ±SEM.
Figure 5—figure supplement 1
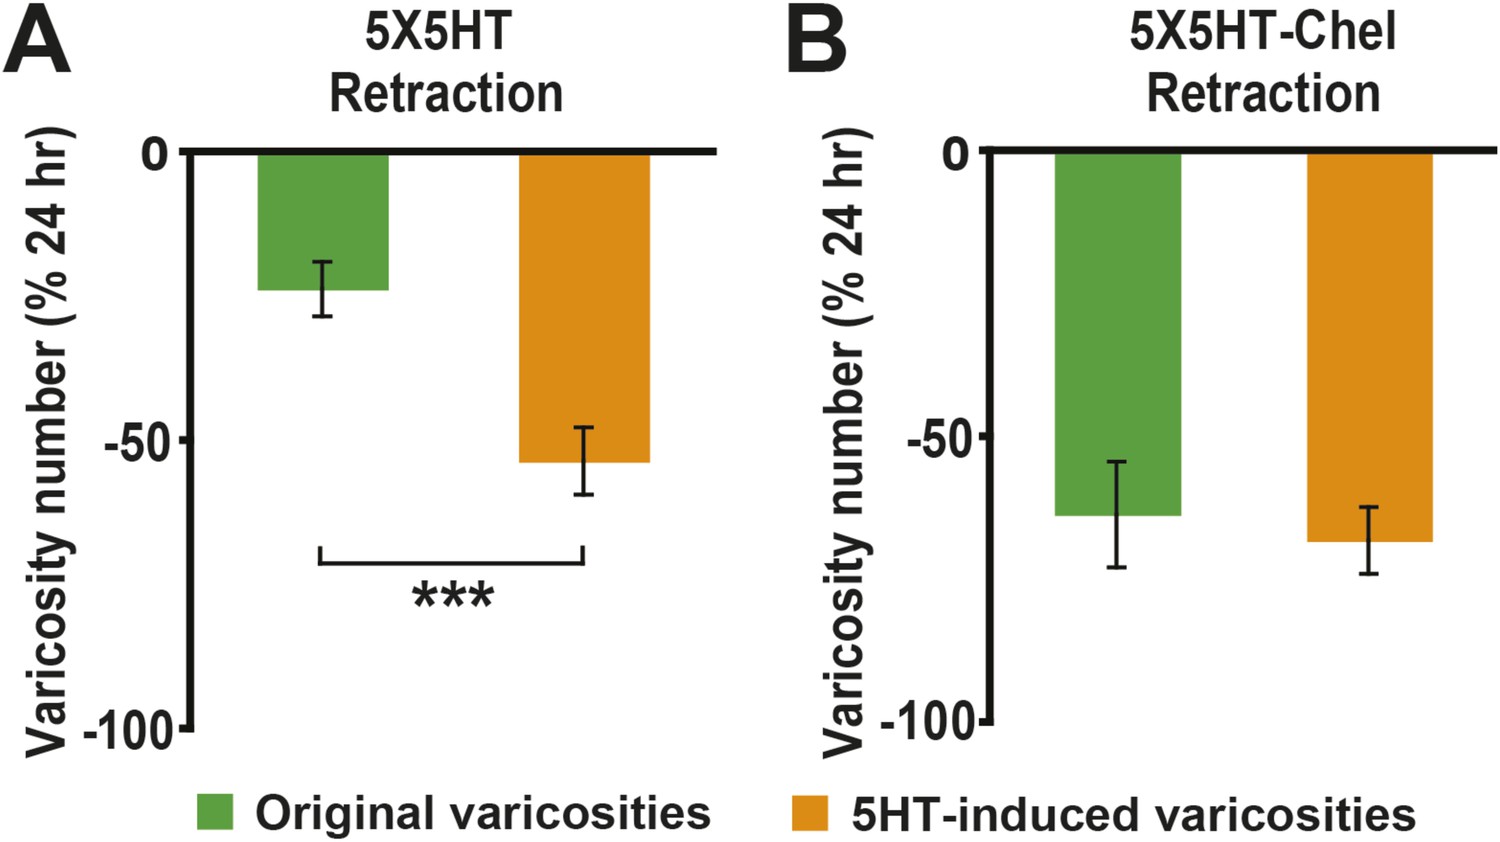
Comparison of retraction of original and 5HT-induced varicosities between 24–48 hr in the chelerythrine treatment experiments.
(A) The difference in the percent retraction between 5X5HT-induced (53.4 ± 5.8%) and original (23.5 ± 4.7%) varicosities was highly significant in the 5X5HT group (p < 0.001, two-tailed t test). (B) There was no significant difference in the percent retraction between 5HT-induced (68.0 ± 5.8%) and original (63.4 ± 9.3%) varicosities in the 5X5HT-Chel group.
Figure 6
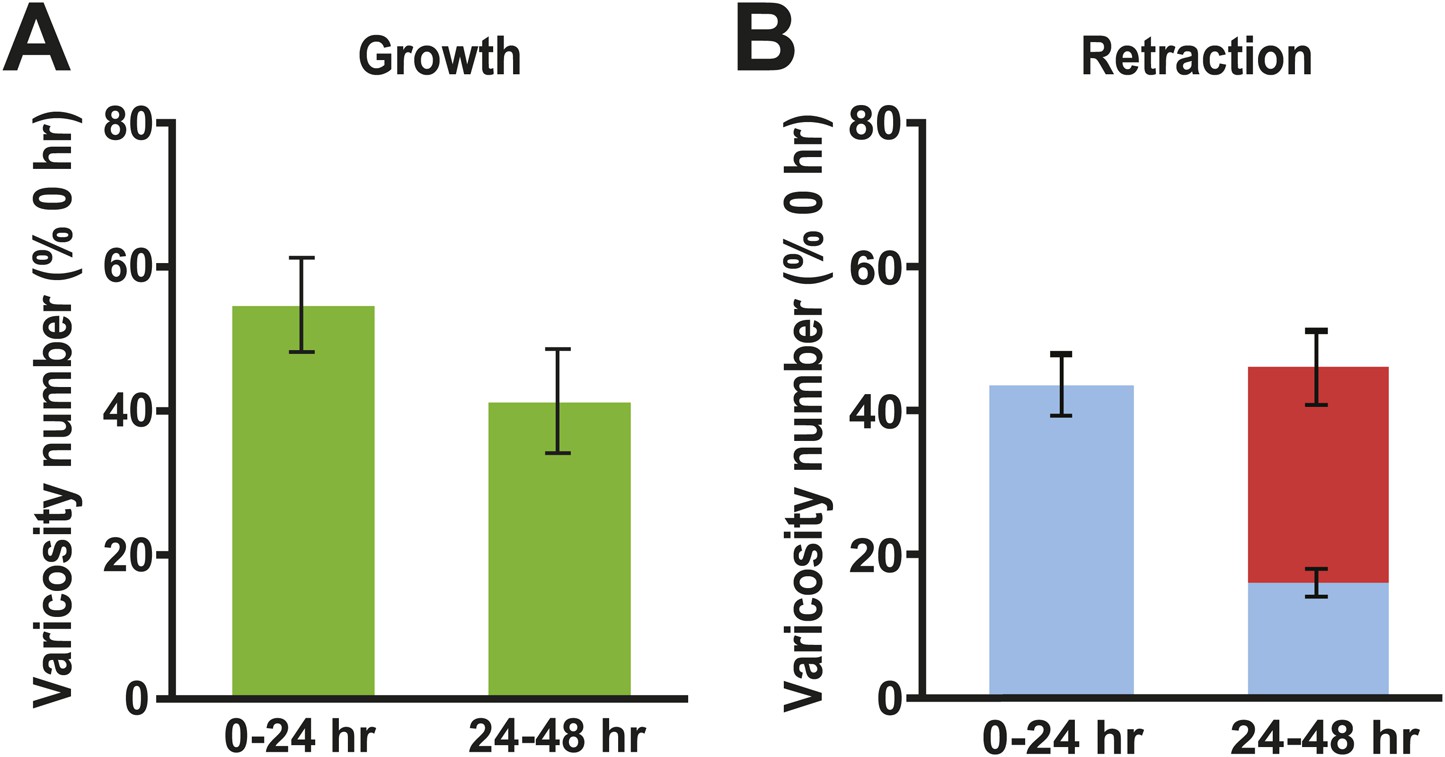
Changes in presynaptic varicosities in Control cocultures.
(A) The normalized increase in the number of varicosities was 54.9 ± 6.5% during the 0–24 hr period and 41.5 ± 7.2% during the 24–48 hr period (green bars). (B) The mean normalized number of original varicosities (blue bar) that retracted during the 0–24 hr period was 43.2 ± 4.4%. During the 24–48 hr period 15.5 ± 2.0% of the original varicosities (those present at 0 hr, blue segment), and 30.2 ± 5.1% of the varicosities that formed during 0–24 hr period (red segment), retracted; thus, the mean total normalized retraction of varicosities from 24–48 hr was 45.7%. Note that the numbers of newly formed varicosities during the 0–24 and 24–48 hr periods in each coculture were normalized to the total number of varicosities in that coculture measured at 0 hr. The percentage of retracted varicosities was obtained by normalizing the number of varicosities that disappeared during the 0–24 and 24–48 hr periods for a given coculture to the total number of varicosities in that coculture at 0 hr.
Figure 7
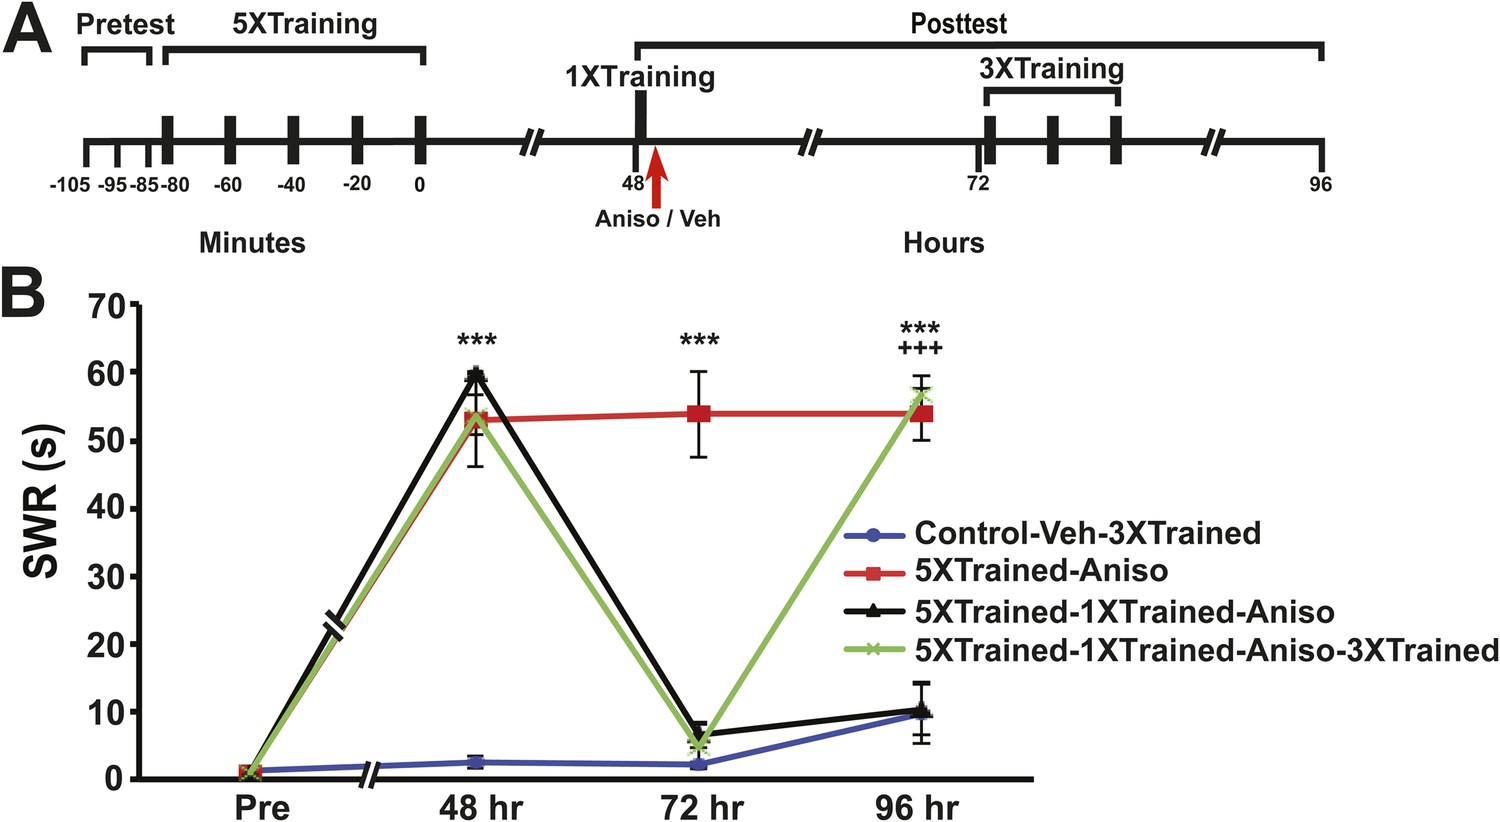
Reinstatement of LTS after its elimination by reconsolidation blockade in Aplysia.
(A) Experimental protocol. The timing of the pretests, training, posttests, and drug/vehicle injections is shown relative to the end of the last training session. The time of the intrahemocoel injection of either anisomycin or vehicle is indicated by the red arrow. Animals in the 5XTrained-1XTrained-Aniso and 5XTrained-1XTrained-Aniso-3XTrained groups received a reminder episode of sensitization training (one bout of tail shocks) immediately after the 48 hr posttest (black bar) and prior to the injection of anisomycin, whereas the animals in the 5XTrained-Aniso group did not. After the 72 hr posttest animals in the Control-Veh-3XTrained and 5XTrained-1X5HT-Aniso-3XTrained groups received truncated sensitization training (three bouts of tail shocks). (B) The mean duration of the SWR measured at 48 hr, 72 hr and 96 hr for the Control-Veh-3XTrained (n = 12), 5XTrained-Aniso (n = 4), 5XTrained-1XTrained-Aniso (n = 7), and 5XTrained-1XTrained-Aniso-3XTrained (n = 11) groups. A repeated-measures ANOVA indicated that there was a significant group × time interaction (F[9,90] = 51.0, p < 0.0001). Subsequent planned comparisons indicated that the overall differences among the four groups were highly significant on all of the posttests (48 hr, F[3,30] = 137.2, p < 0.0001; 72 hr, F[3,30] = 50.5, p < 0.0001; and 96 hr, F[3,30] = 43.8, p < 0.0001). SNK posthoc tests on the 48 hr data indicated that the initial sensitization training produced significant LTS in the 5XTrained-Aniso (53.0 ± 7.0 s), 5XTrained-1XTrained-Aniso (59.9 ± 0.2 s), and 5XTrained-1XTrained-Aniso-3XTrained (53.7 ± 2.9 s) groups compared to the Control-Veh-3XTrained group (2.5 ± 0.9 s, p < 0.001 for each test). The responses of the trained groups did not differ significantly at 48 hr after sensitization training. However, the mean duration of the SWR in the 5XTrained-Aniso group (53.8 ± 6.3 s) remained prolonged at 72 hr, and was significantly longer than that in the 5XTrained-1XTrained-Aniso group (6.4 ± 1.9 s) as well as in the 5XTrained-1XTrained-Aniso-3XTrained group (4.8 ± 3.2 s, p < 0.001 for both comparisons). LTS was restored by the three additional tail shocks applied after the 72 hr posttest. The mean duration of the SWR in the 5XTrained-1XTrained-Aniso-3XTrained group at 96 hr was 56.7 ± 2.7 s, which was significantly longer than that for the 5XTrained-1XTrained-Aniso group (10.4 ± 3.9 s) at 96 hr (p < 0.001). The SWR of the 5XTrained-Aniso group at 96 hr (53.8 ± 3.8 s) was also significantly longer than that in the 5XTrained-1XTrained-Aniso group (p < 0.001). Asterisks, comparisons of the Control-Veh-3XTrained group with the 5XTrained-Aniso group, the 5XTrained-1XTrained-Aniso group, and 5XTrained-1XTrained-Aniso-3XTrained group at 48 hr; comparison of the Control-Veh-3XTrained group with the 5XTrained-Aniso group at 72 hr; and comparisons of the Control-Veh-3XTrained group with the 5XTrained-Aniso group and the 5XTrained-1XTrained-Aniso-3XTrained group at 96 hr. Plus signs, comparisons of the 5XTrained-1XTrained-Aniso group with the 5XTrained-Aniso group and the 5XTrained-1XTrained-Aniso-3XTrained group at 96 hr. Error bars represent ±SEM.
Figure 8
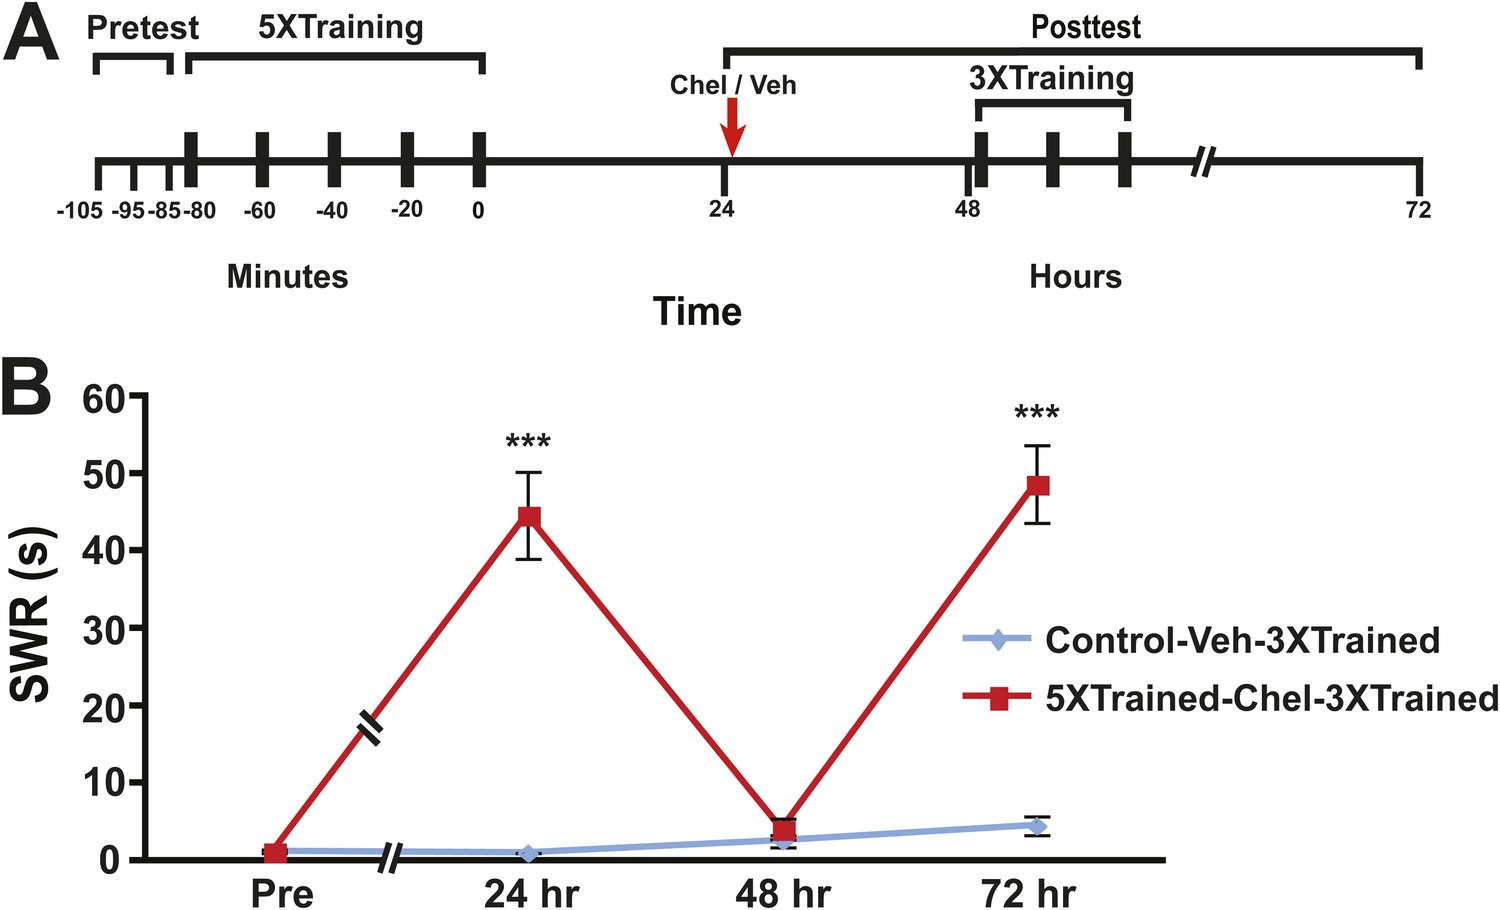
Reinstatement of LTS following its erasure by PKM inhibition.
(A) Experimental protocol. The timing of the pretests, training, posttests, and drug/vehicle injections is shown relative to the end of the last training session. The time of the intrahemocoel injection of either chelerythrine or vehicle is indicated by the red arrow. After the 48 hr posttest animals in both groups received three additional bouts of tail shocks. (B) Mean duration of the SWR measured at 24 hr, 48 hr and 72 hr for the Control-Veh-3XTrained (n = 9) and 5XTrained-Chel-3XTrained (n = 9) groups. A repeated-measures ANOVA indicated that there was a significant interaction effect between group and time (F[3,14] = 25.4. p < 0.0001). A planned comparison indicated that the mean duration of the SWR at 24 hr in the 5XTrained-Chel-3XTrained group (44.7 ± 5.6 s) was significantly longer than that in the Control-Veh-3XTrained group (1.1 ± 0.1 s, F[1,16] = 60.2, p < 0.001). The mean duration of the SWR at 48 hr (4.1 ± 1.4 s) in the 5XTrained-Chel-3XTrained group was not significantly longer than that in the Control-Veh-3XTrained group (2.6 ± 0.8 s), as indicated by a planned comparison (F[1,16] = 0.95, p = 0.34). The SWR in the 5XTrained-Chel-3XTrained group at 72 hr was 48.7 ± 5.0 s, which was significantly longer than that in the Control-Veh-3XTrained group (4.6 ± 1.2 s; planned comparison, F[1,16] = 73.1, p < 0.001). Asterisks, comparison between 5XTrained-Chel-3XTrained and Control-Veh-3XTrained groups. Error bars represent ±SEM.
Figure 9
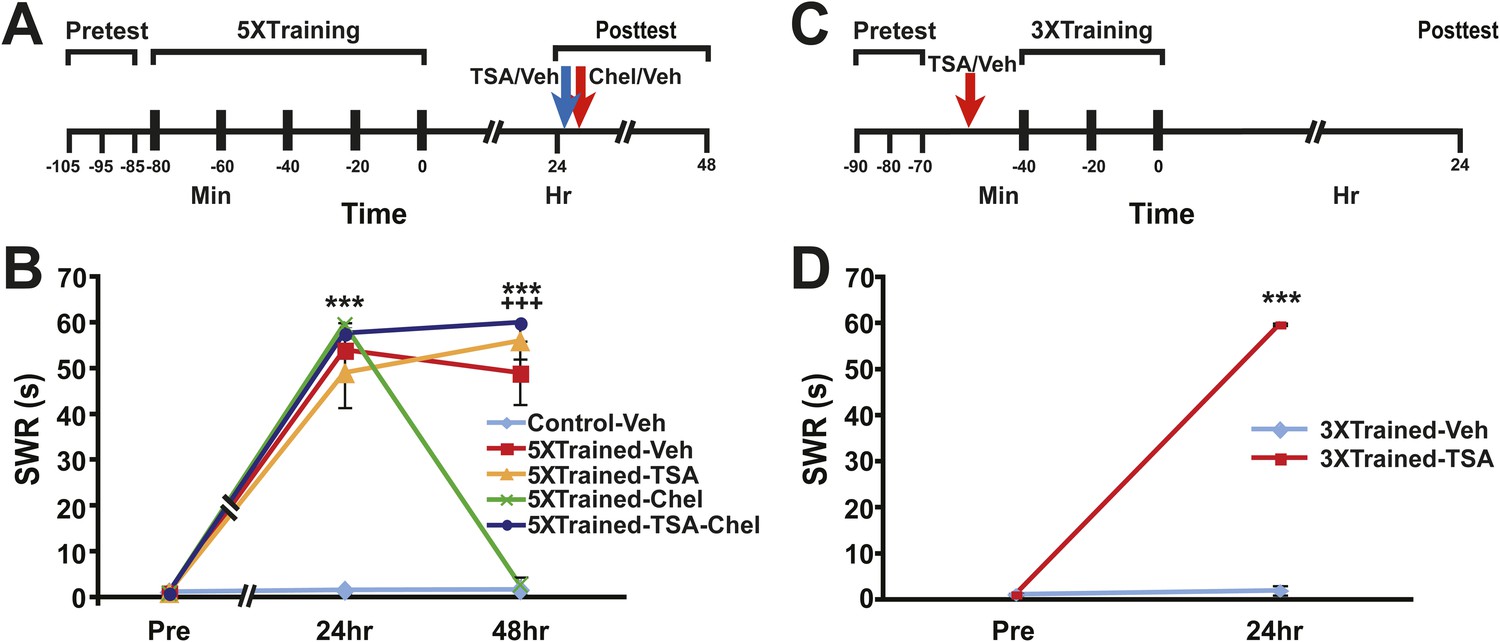
Epigenetic regulation of LTM in Aplysia.
(A) Experimental protocol. The times of the pretests, training, posttests, and drug/vehicle injections are shown relative to the end of the last training session. The times of the trichostatin A (TSA)/vehicle and chelerythrine/vehicle injections are indicated by blue arrow and red arrow respectively. (B) TSA treatment blocks erasure of LTS by chelerythrine. The graph presents the mean duration of the SWR measured at 24 hr and 48 hr in the Control-Veh (n = 9), 5XTrained-Veh (n = 5), 5XTrained-TSA (n = 6), 5XTrained-Chel (n = 5), and 5XTrained-TSA-Chel (n = 6) groups. A repeated-measures ANOVA showed a significant group × time interaction (F(8,52) = 53.2, p < 0.0001). Subsequent planned comparisons indicated that the group differences for the 24 and 48 hr posttests were highly significant (24 hr, F[4,26] = 45.5, p < 0.0001; 48 hr, F[4,26] = 94.4, p < 0.0001). For the 24 hr posttest, SNK posthoc tests indicated that the training produced significant sensitization in all four trained groups (5XTrained-Veh, 54.0 ± 6.0 s; 5XTrained-TSA, 49.0 ± 7.6 s; 5XTrained-Chel, 59.6 ± 0.4 s; and 5XTrained-TSA-Chel, 57.7 ± 2.3 s) compared to the Control-Veh group (1.6 ± 0.6 s, p < 0.001 for all tests). Comparisons of the four trained groups showed that their responses did not differ significantly on the 24 hr posttest. However, the responses of 5XTrained-Veh (49.0 ± 6.9 s), 5XTrained-TSA (56.0 ± 4.0 s), and 5XTrained-TSA-Chel (59.8 ± 1.7 s) on the 48 hr posttest were significantly more enhanced than those for both the 5XTrained-Chel (2.8 ± 1.8 s) and Control-Veh (1.7 ± 0.5 s) groups (p < 0.001 for all tests). Thus, chelerythrine treatment reversed LTS, and TSA treatment blocked chelerythrine's reversal of LTS. There were no significant differences among 5XTrained-Veh, 5XTrained-TSA and 5XTrained-TSA-Chel groups, nor between 5XTrained-Chel and Control-Veh groups, at 48 hr. Asterisks, comparisons of the Control-Veh group with the 5XTrained-Veh group, the 5XTrained-TSA group, the 5XTrained-Chel group, and the 5XTrained-TSA-Chel group at 24 hr; and of the Control-Veh group with the 5XTrained-Veh group, the 5XTrained-TSA group, and the 5XTrained-TSA-Chel group at 48 hr. Plus signs, comparisons of the 5XTrained-Chel group with the 5XTrained-Veh group, the 5XTrained-TSA group, and the 5XTrained-TSA-Chel group at 48 hr. (C) Experimental protocols. The times of the pretests, training, posttests, and drug/vehicle injections are shown relative to the end of the last training session. The intrahemocoel injection of either TSA or vehicle is indicated by the red arrow. Note that TSA was injected into animals prior to the sensitization training. (D) Inhibiting histone deacetylation facilitated the induction of LTS in Aplysia. The mean duration of the SWR in the 3XTrained-TSA group (n = 4) at 24 hr was 59.8 ± 0.3 s, whereas it was only 2.0 ± 1.0 s in the 3XTrained-Veh group (n = 4; p < 0.001, unpaired t test). Asterisks, comparison between 3XTrained-TSA and 3XTrained-Veh groups; Error bars represent ±SEM.
Download links
A two-part list of links to download the article, or parts of the article, in various formats.
Downloads (link to download the article as PDF)
Open citations (links to open the citations from this article in various online reference manager services)
Cite this article (links to download the citations from this article in formats compatible with various reference manager tools)
Reinstatement of long-term memory following erasure of its behavioral and synaptic expression in Aplysia
eLife 3:e03896.
https://doi.org/10.7554/eLife.03896


