Local chromatin environment of a Polycomb target gene instructs its own epigenetic inheritance
- John Innes Centre, United Kingdom
Figures
Figure 1 with 1 supplement
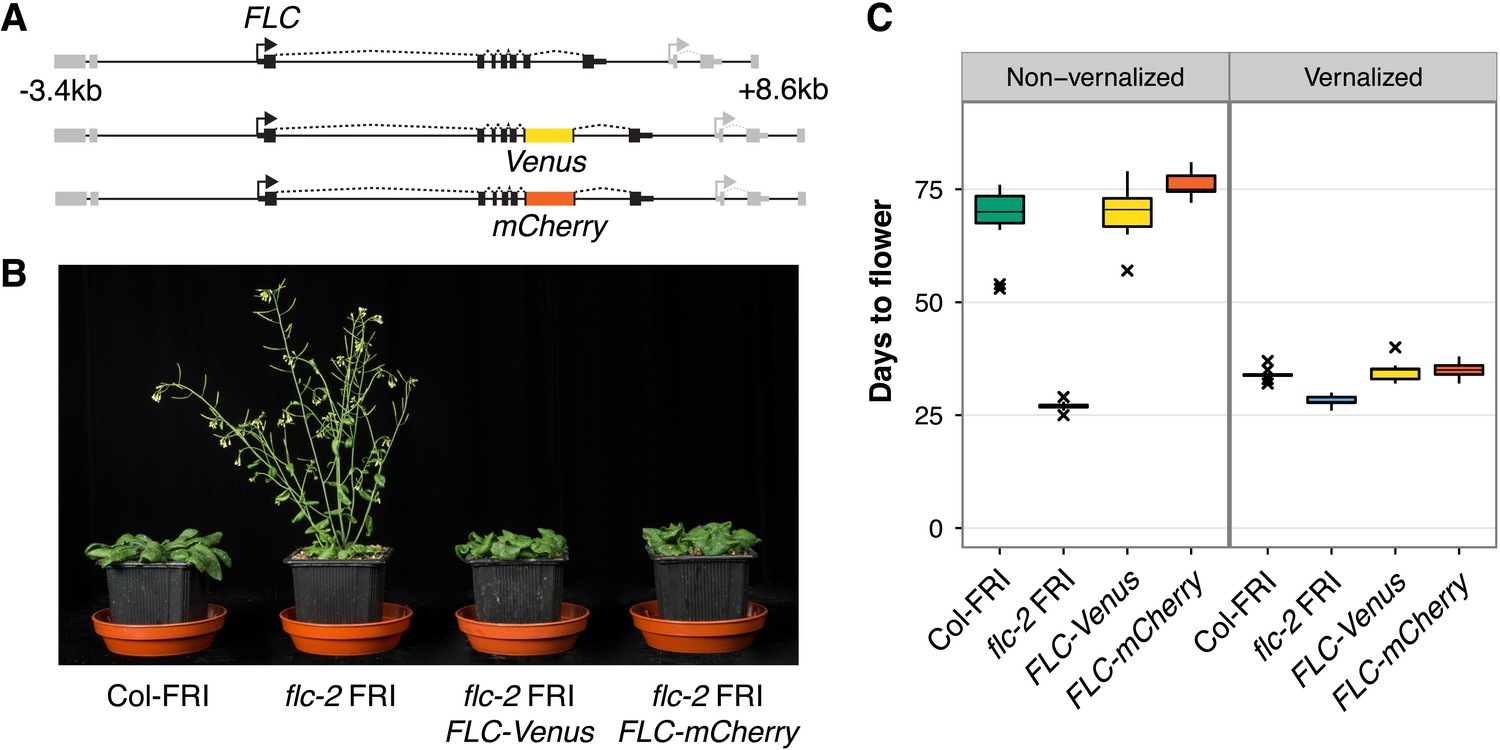
FLC-Venus and FLC-mCherry plants are late flowering and vernalization responsive.
(A) Schematic of FLC genomic DNA used to generate FLC-Venus and FLC-mCherry translational fusions. Exons are represented by black boxes. Transgenes extend from 3.4 kb upstream to 8.6 kb downstream of the FLC transcription start site. Neighbouring genes are depicted in grey. (B) Photograph showing the early-flowering phenotype of non-vernalized parental flc-2 FRI plants and the complementation of flc-2 in transgenic FLC-Venus and FLC-mCherry plants. (C) Flowering time for homozygous single-copy FLC-Venus and FLC-mCherry plants (single transgenic line each) compared to wild-type (Columbia line FRI-sf2 [Col-FRI]) and parental flc-2 FRI plants (n = 12); Vernalized plants were pre-grown for 1 week at 22°C and spent 4 weeks at 5°C before being returned to 22°C. Flowering time is counted in days from sowing until bolting but does not include time spent in cold.
Figure 1—figure supplement 1
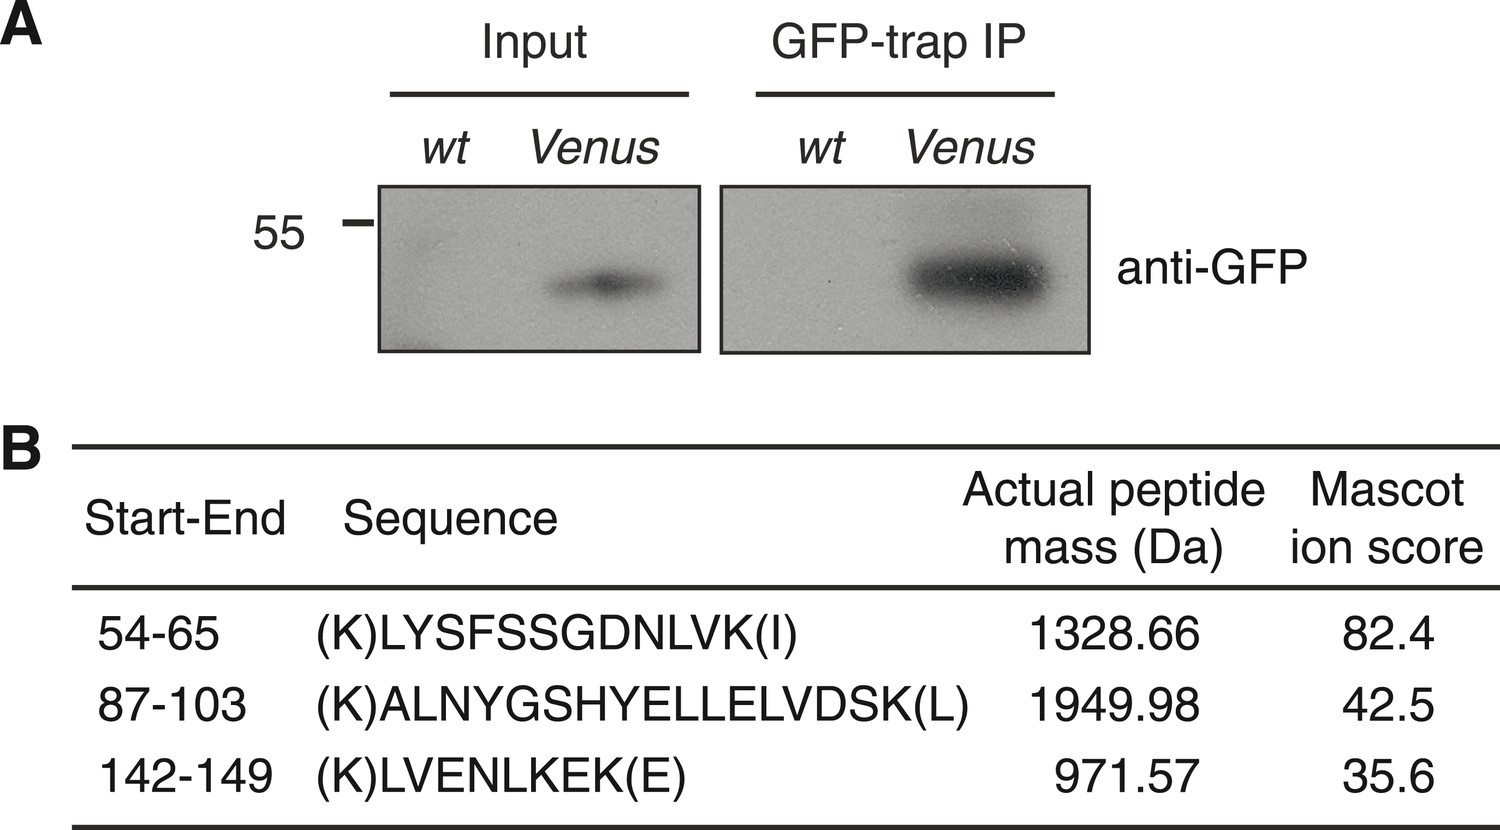
Detection of FLC-Venus protein.
(A) Immunoblot of FLC-Venus GFP-trap immunoprecipitation (IP). wt indicates untransformed wild-type control sample (Col-FRI), whereas Venus indicates FLC-Venus transgenic sample. Input blot is from the same membrane as the IP sample except using a longer exposure time. Mass of protein size marker shown in kDa. The predicted mass of FLC-Venus is 48.8 kDa. (B) Table of peptides corresponding to FLC that were identified by mass spectrometry in FLC-Venus IP but not control IP sample. Start-End refers to the location of the peptide in the FLC protein sequence.
Figure 2 with 6 supplements
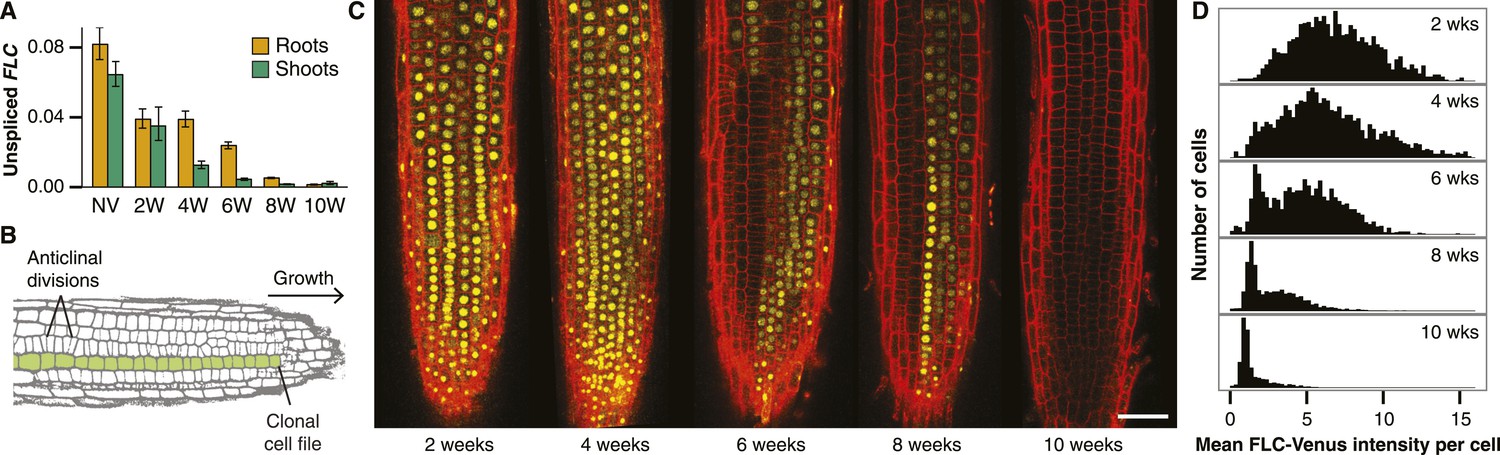
Active and repressed FLC-Venus transcriptional states are mitotically inherited.
(A) Unspliced FLC-Venus RNA in roots and shoots measured by qRT-PCR for non-vernalized (NV) plants or after 2, 4, 6, 8, or 10 weeks of cold followed by 7 days of warm. Data shown are mean ± s.e.m. for at least 2 biological replicates for each of 2 independent transgenic lines (n ≥ 4). (B) Schematic of an Arabidopsis root meristem showing how repeated anticlinal cell divisions give rise to clonal cell files along the axis of growth. (C) Confocal microscopy images of FLC-Venus (yellow) in primary root meristems of plants exposed to 2, 4, 6, 8, or 10 weeks cold. Plants were imaged 7 days after return to warm. FLC-Venus is localized to nuclei. Cell walls were stained with propidium iodide (red). Scale bar, 50 μm. (D) Histograms of mean FLC-Venus intensity in individual cells (see ‘Materials and methods’) for two independent FLC-Venus transgenic lines. Each panel summarizes data from confocal z-stacks of 8–12 roots (1372–2067 cells).
Figure 2—figure supplement 1
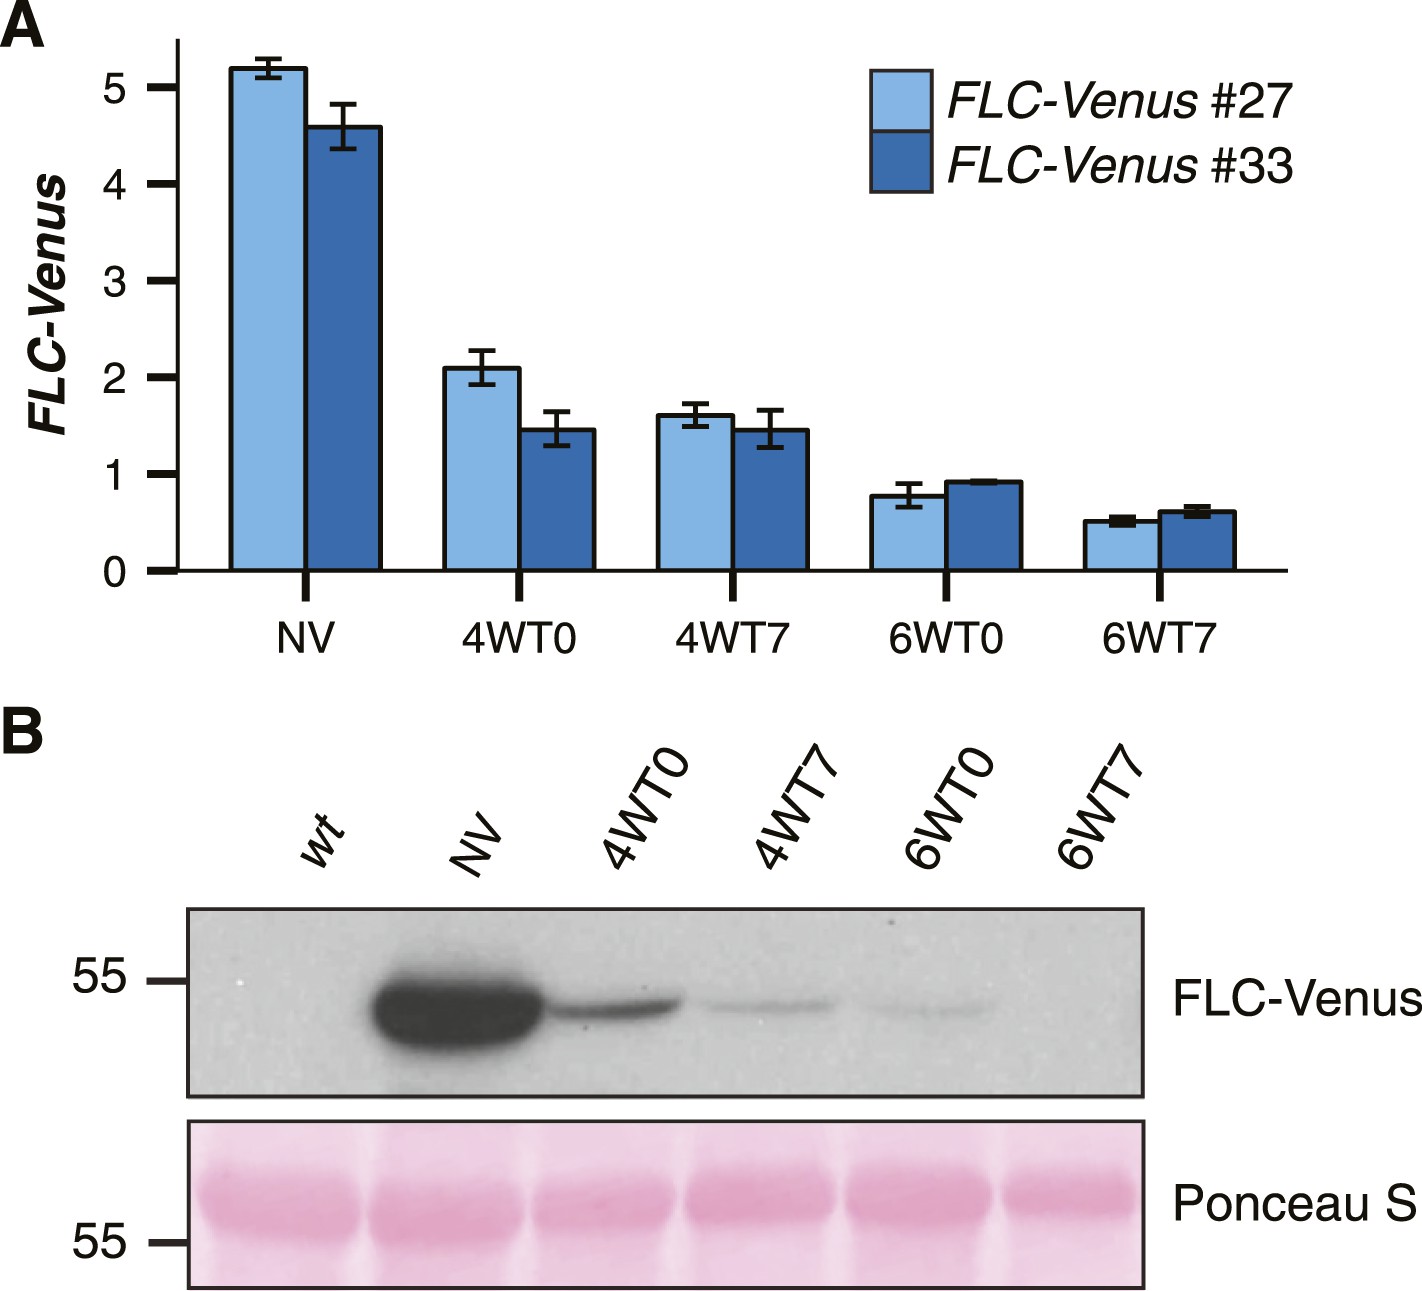
FLC-Venus is quantitatively epigenetically repressed by cold exposure.
(A) FLC-Venus mRNA levels measured by RT-qPCR using primers specific for FLC-Venus. Data are normalized to UBC. 4WT0 indicates that plants were harvested immediately after exposure to 4 weeks of cold, while 4WT7 indicates that plants were grown for a further 7 days in warm conditions. Data are represented as mean ± s.e.m. (n = 3). (B) Immunoblot of FLC-Venus during and after 4 or 6 weeks cold exposure. Mass of protein size marker shown in kDa. Membrane stained with Ponceau S is shown as a loading control.
Figure 2—figure supplement 2
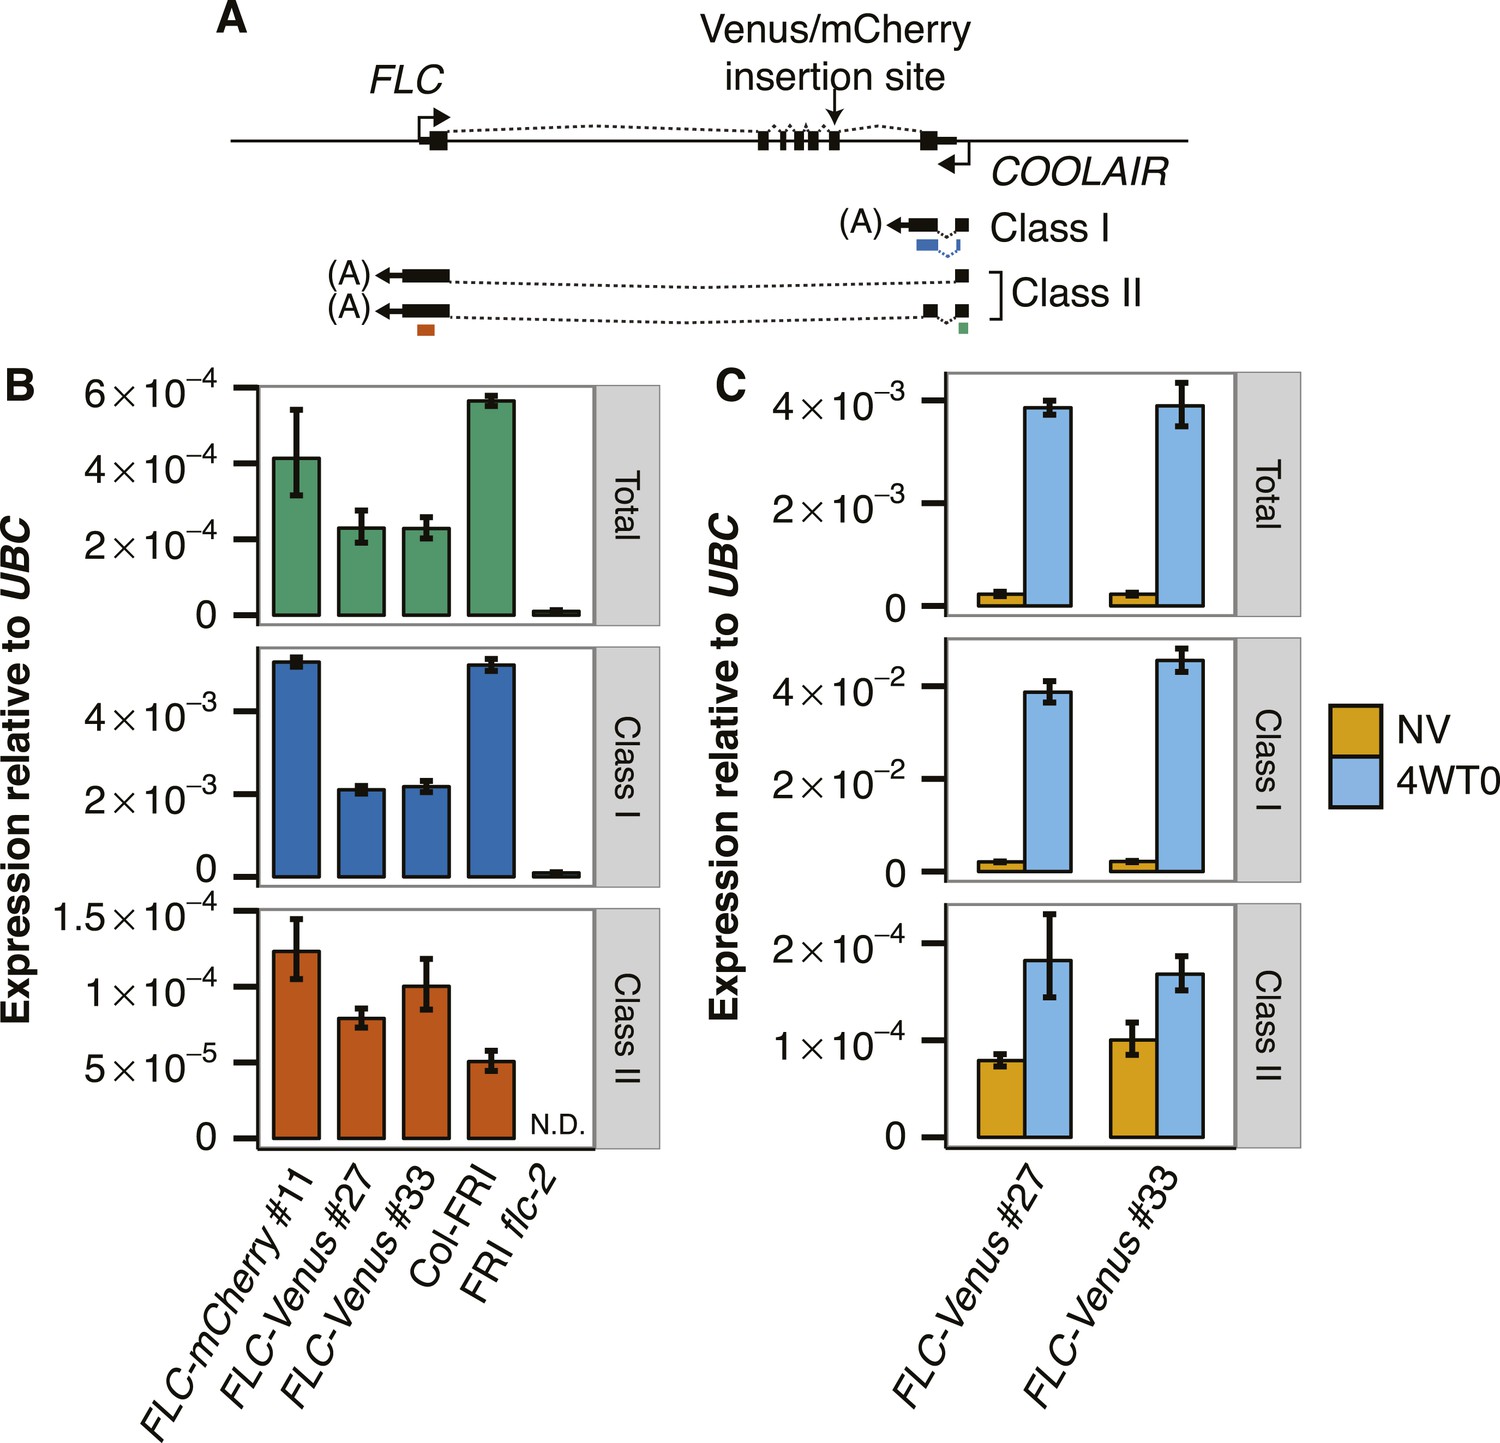
COOLAIR expression in transgenic FLC lines.
(A) Schematic of FLC genomic DNA with FLC mRNA and COOLAIR exons represented by black boxes. Dashed lines indicate splicing pattern. Coloured bars beneath COOLAIR transcripts represent the position of the qPCR amplicons used for quantification of transcripts (green = Total, blue = Class I, red = Class II). (B) NV COOLAIR expression measured by RT-qPCR. Data are normalized to UBC and are represented as mean ± s.e.m. (n = 3). (C) Cold induction of COOLAIR expression in FLC-Venus transgenic lines. NV indicates that plants were NV, while 4WT0 indicates that plants were harvested immediately after exposure to 4 weeks of cold.
Figure 2—figure supplement 3
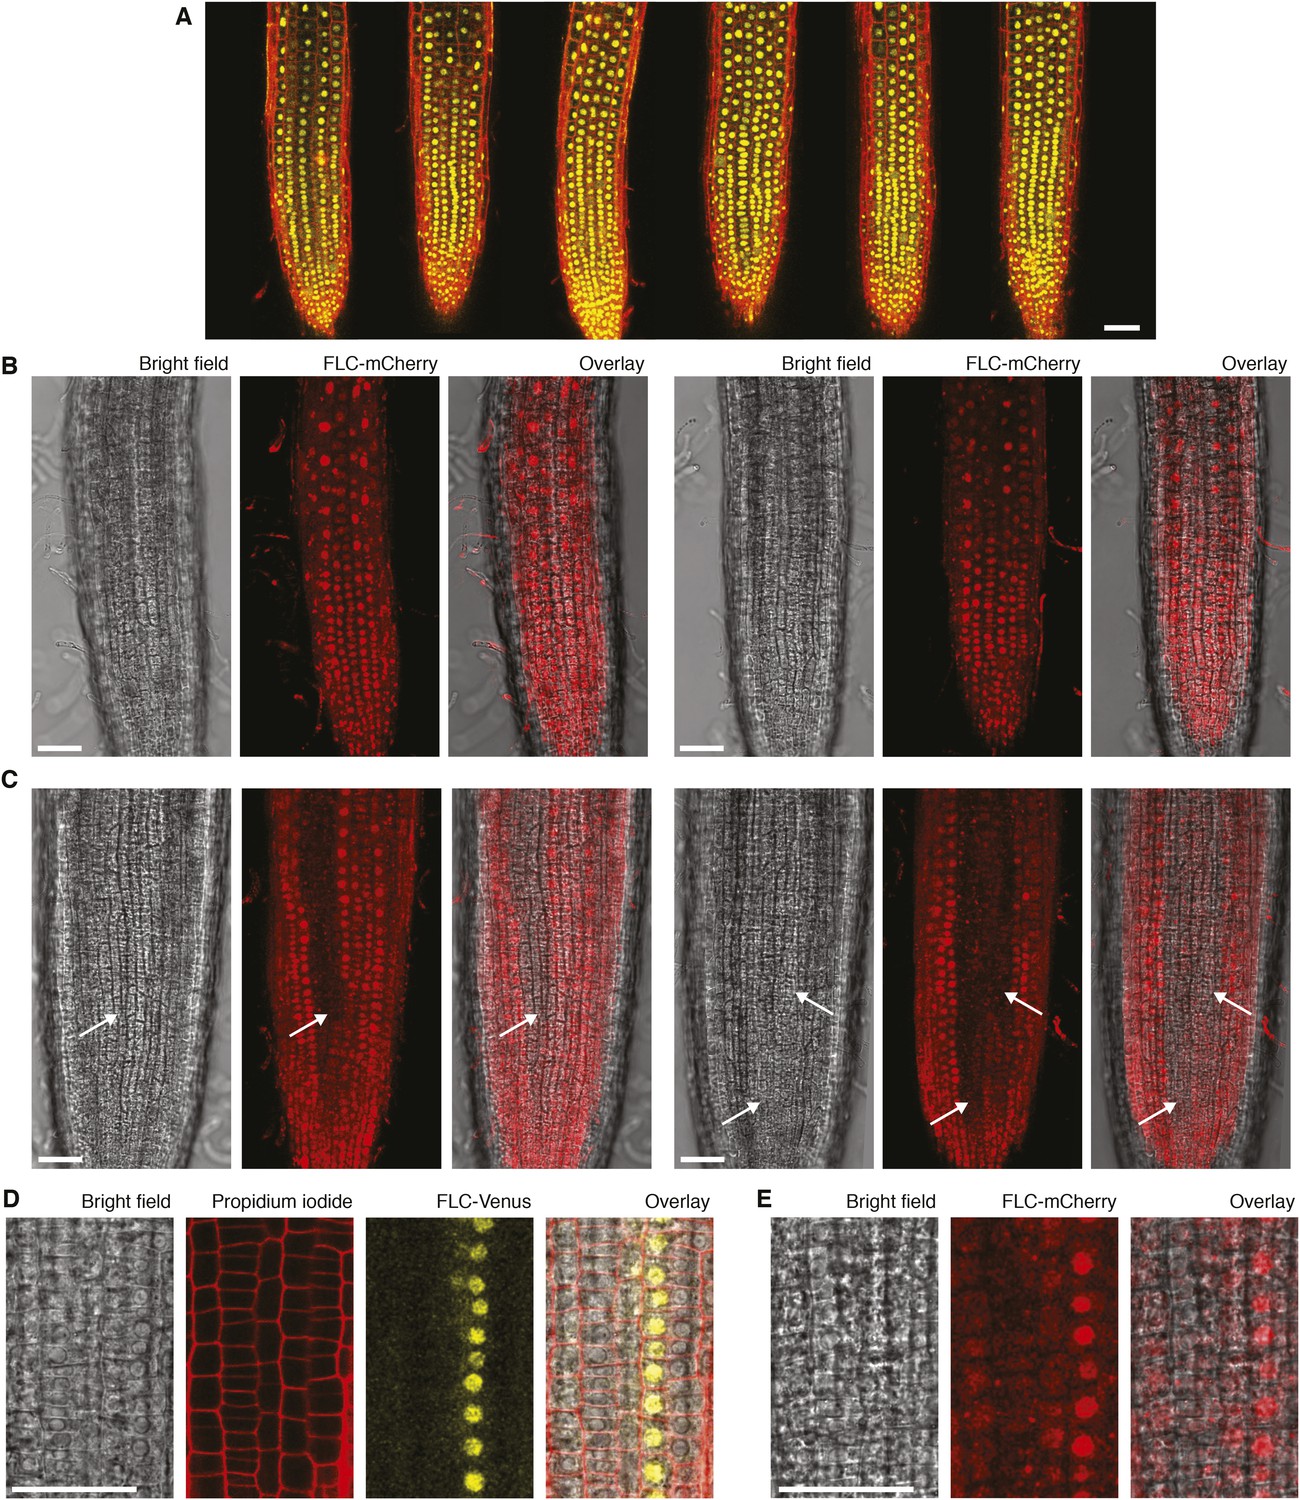
Confocal microscopy of FLC-Venus and FLC-mCherry.
(A) Confocal microscopy images of non-vernalized FLC-Venus. FLC-Venus channel is a maximum intensity projection over 2–3 z-planes. Propidium iodide (red) was used to stain the cell wall; a single z-plane corresponding to the centre of the projection was overlaid on the FLC-Venus image. 3 roots are shown for each of two independent FLC-Venus lines. (B) Confocal microscopy images of FLC-mCherry before vernalization and (C) after 6 weeks cold followed by 7 days growth in warm conditions. Images are maximum intensity projections over 2–3 z-planes; a single z-plane corresponding to the centre of the projection was used for bright-field images. Files of cells not expressing FLC-mCherry are indicated with white arrows. (D), (E) Higher magnification images showing adjacent files of ON and OFF cells for FLC-Venus and FLC-mCherry, 7 days after 6 weeks or 5 weeks cold exposure, respectively. Scale bars, 50 μm.
Figure 2—figure supplement 4
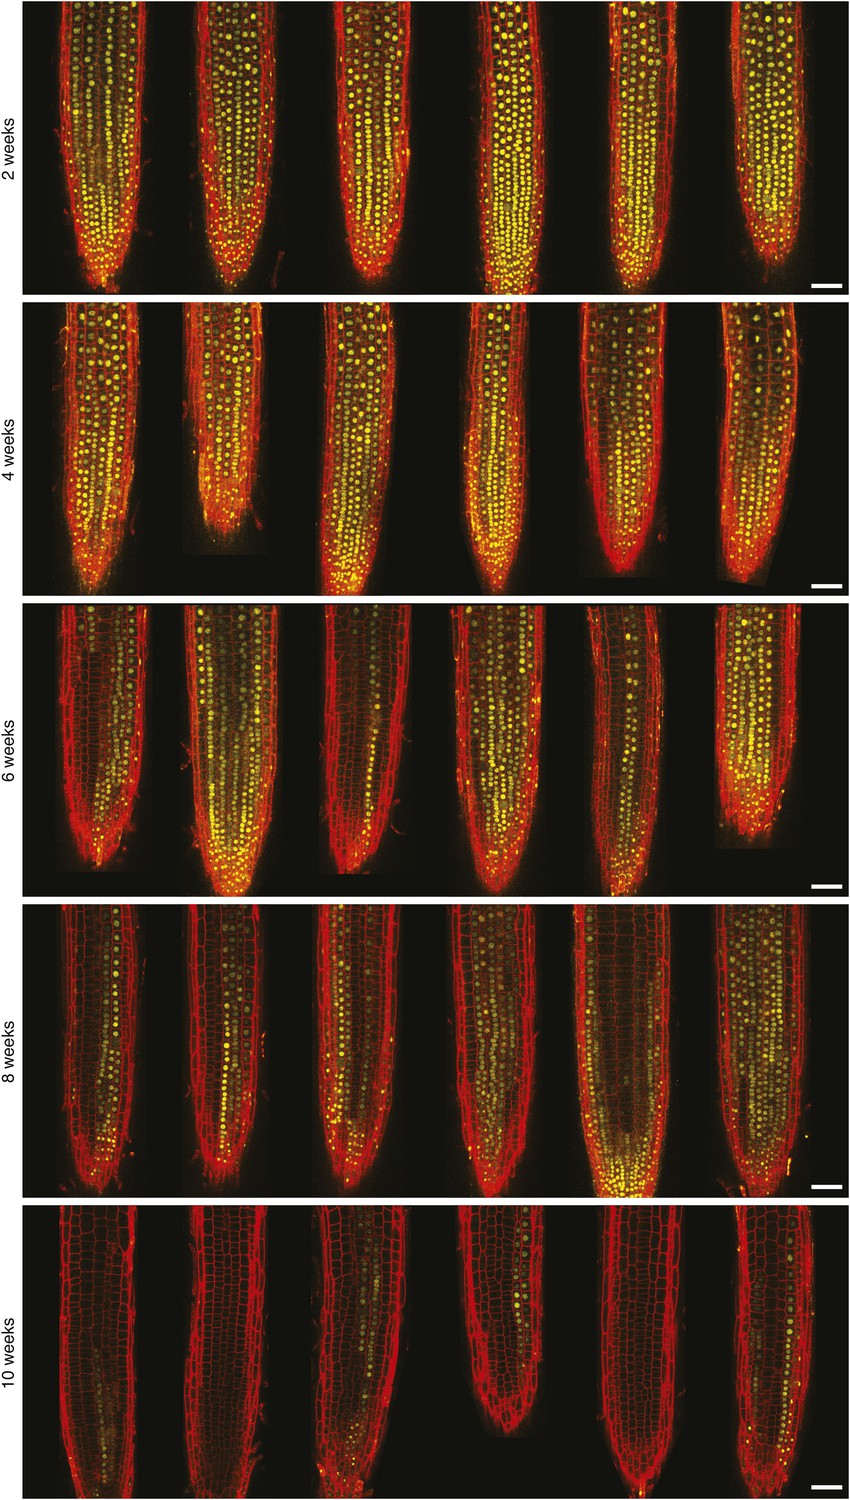
Confocal microscopy of FLC-Venus after vernalization.
FLC-Venus (yellow) in root meristems of plants exposed to 2, 4, 6, 8, or 10 weeks cold. Plants were imaged 7 days after return to warm. FLC-Venus channel is a maximum intensity projection over 2–3 z-planes. Propidium iodide (red) was used to stain the cell wall; a single z-plane corresponding to the centre of the projection was overlaid on the FLC-Venus image. For each treatment, 3 roots are shown for each of two independent FLC-Venus lines. Scale bars, 50 μm.
Figure 2—figure supplement 5
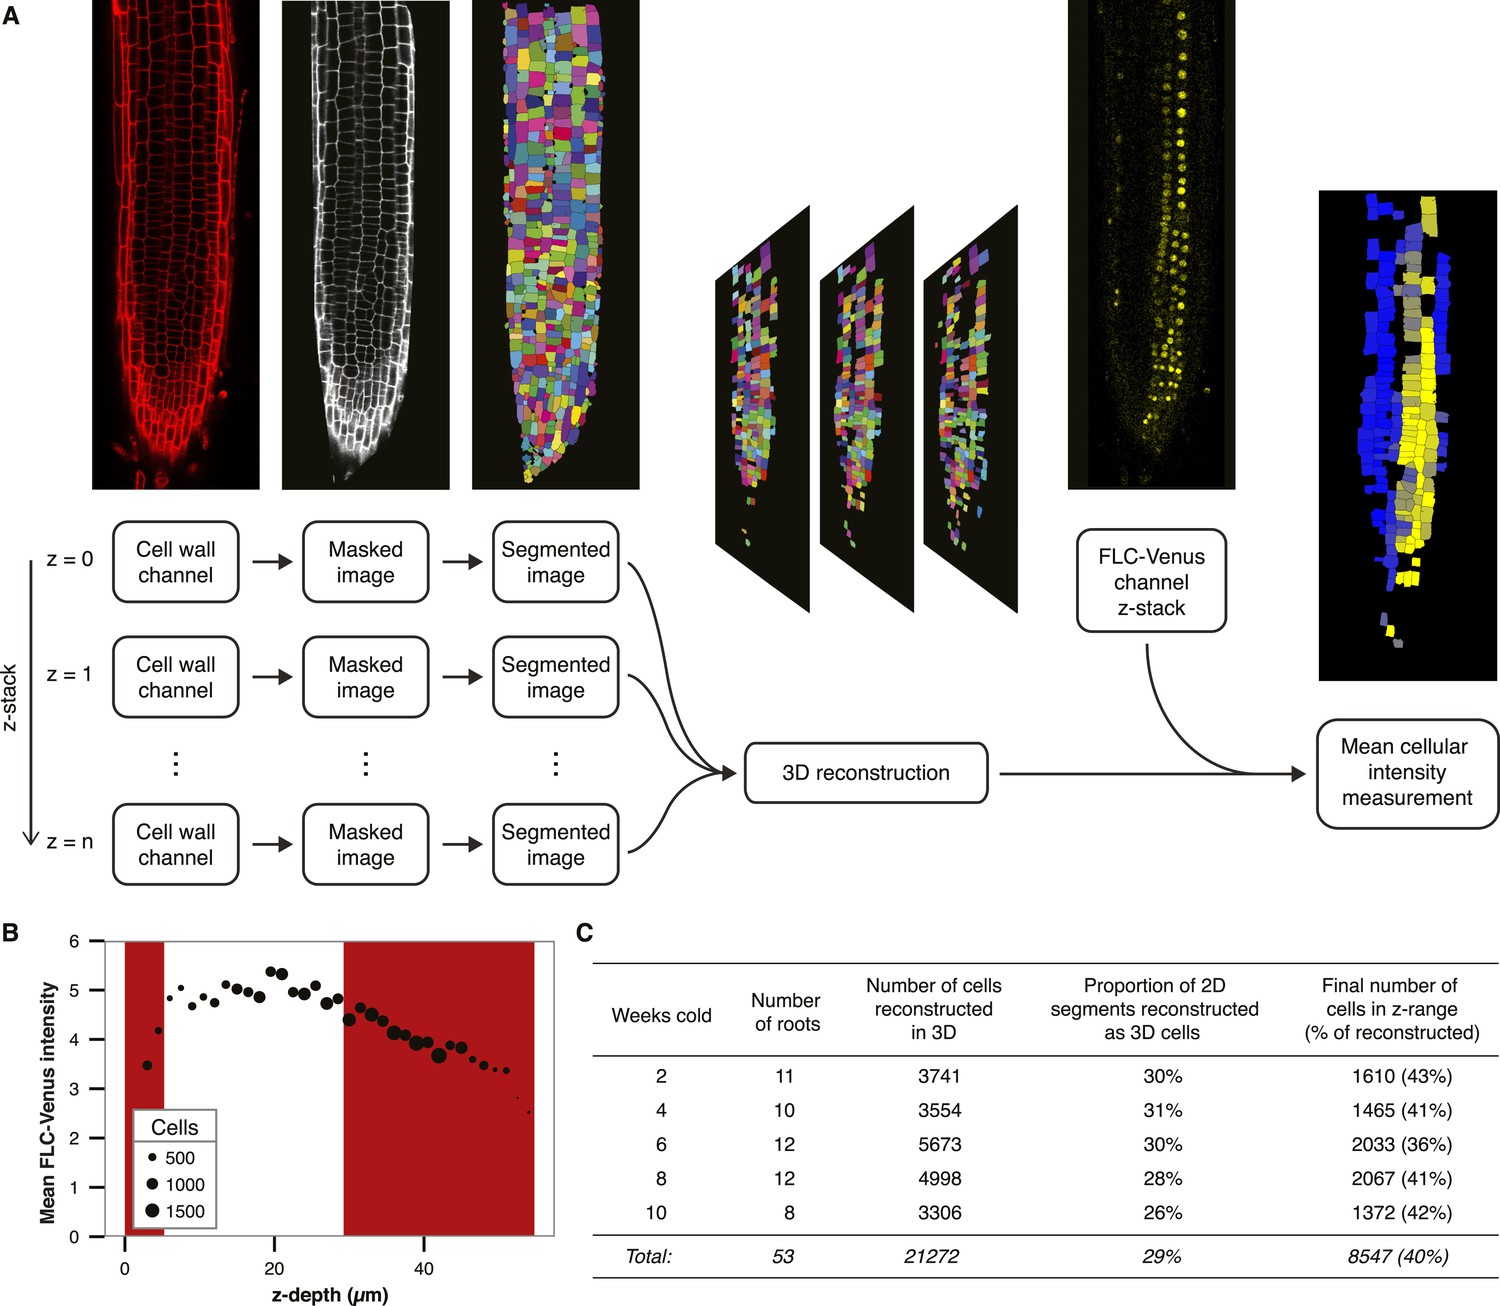
Quantitative image analysis.
(A) Flowchart showing the processing steps used to calculate mean FLC-Venus intensity per cell. Cell wall (propidium iodide) images from each layer of the z-stack were masked and segmented. Each of these 2D segmentations was compared to those in neighbouring layers of the z-stack to assign bona fide cells and obtain a 3D reconstruction. Mean FLC-Venus intensity within each reconstructed cell was then computed from the corresponding region in the FLC-Venus channel. Quantification can be visualized as a heat map showing mean FLC-Venus intensity within each successfully reconstructed cell. Cells in black were not successfully reconstructed. (B) Mean FLC-Venus intensity extracted from all cells at the same depth plotted against depth in the confocal z-stack. Depth is defined as the mean distance of a cell from the top focal plane. Point area represents the number of cells at each depth. z-stacks were taken from top to bottom and mean fluorescence intensity per cell was found to generally decrease during image acquisition. The red shaded areas represent data that were excluded from the analysis. (C) Statistics from the automated image analysis procedure corresponding to data presented in Figure 2D. These data contain approximately equal numbers of roots for each treatment from two independent transgenic lines.
Figure 2—figure supplement 6
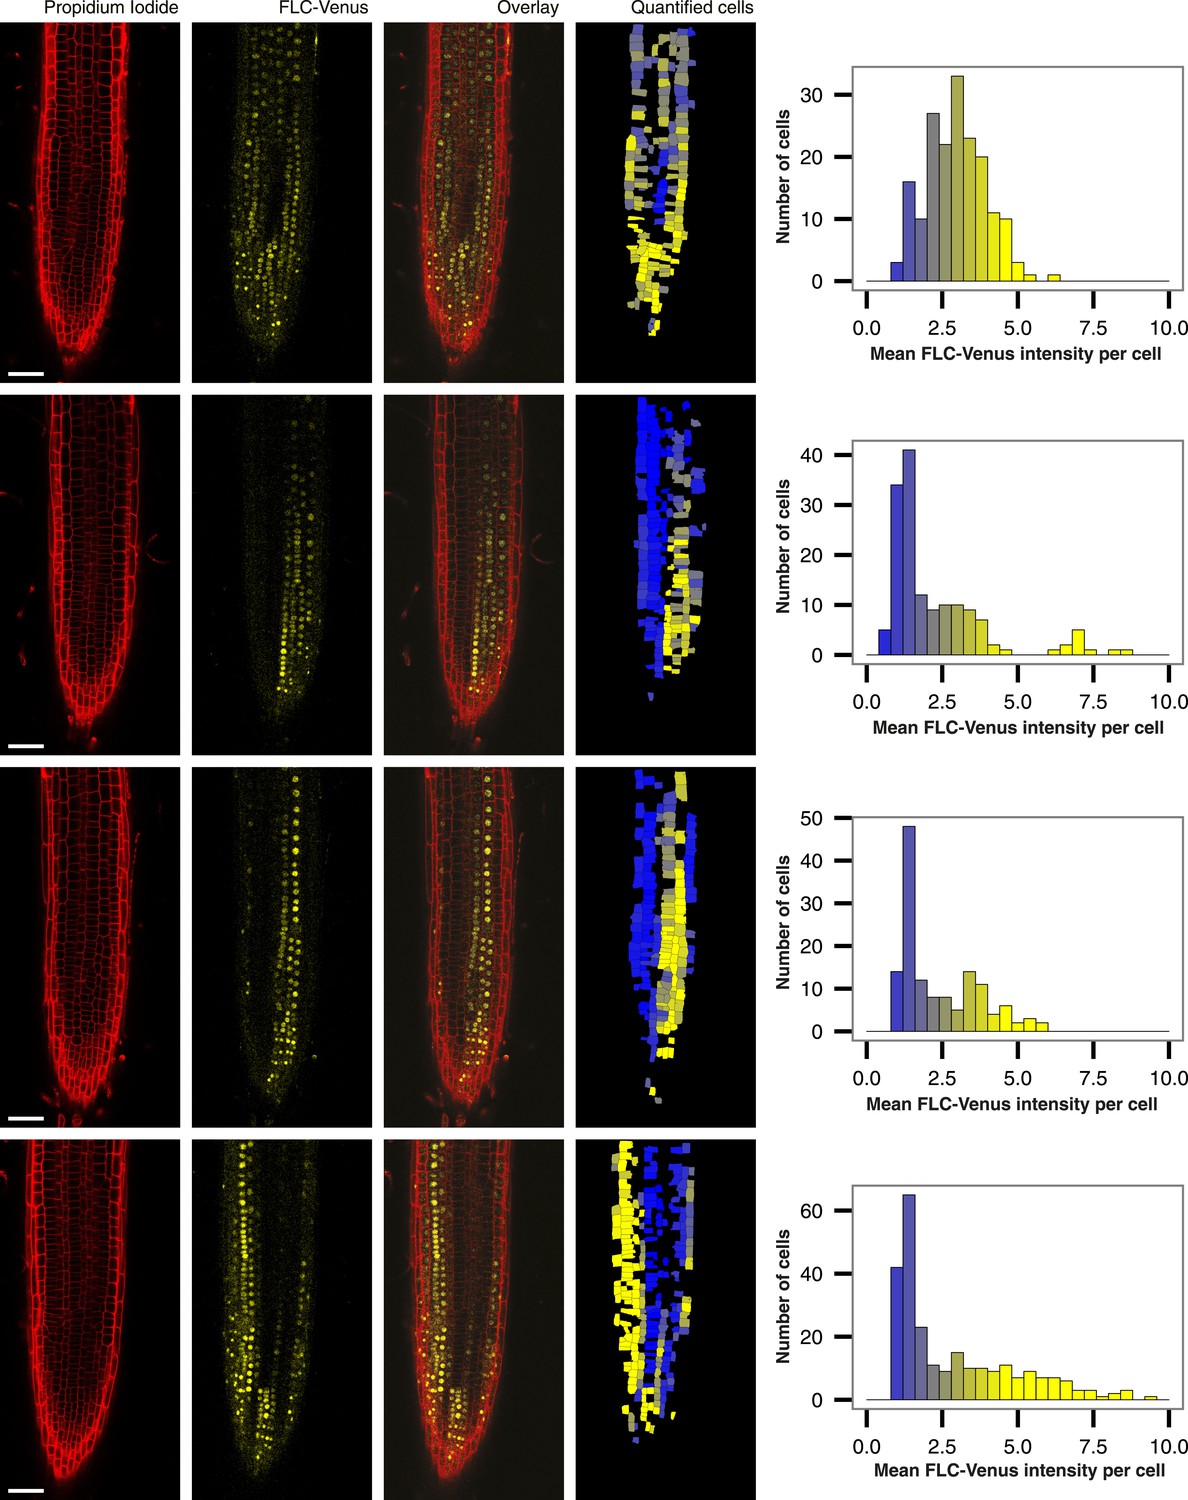
Root-to-root variability in quantified images.
Four roots of a single FLC-Venus line exposed to 8 weeks of cold followed by 7 days of growth in warm. Propidium iodide, FLC-Venus, and Overlay are single z-plane images. ‘Quantified cells’ is the corresponding z-plane from the 3D reconstruction, showing the computed mean FLC-Venus intensity in each cell as a heat map. Missing cells are those that were not successfully reconstructed in 3D. Alongside each quantified image are histograms of mean FLC-Venus intensity per cell, quantified for all cells in the corresponding root. Scale bars, 50 μm.
Figure 3 with 2 supplements
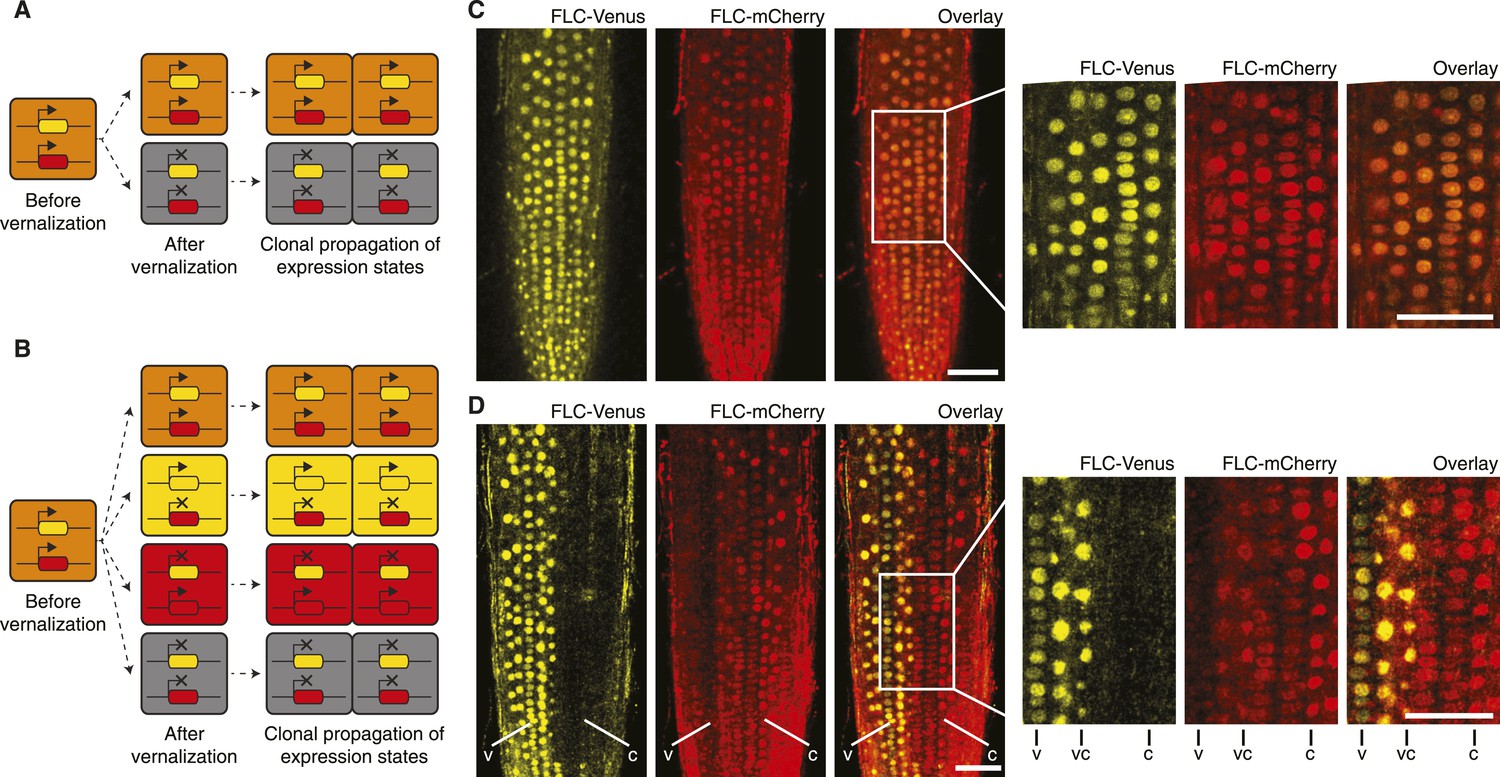
‘Mixed’ transcriptional states are mitotically inherited.
(A) In a trans memory system, the two copies of FLC are coordinately regulated and only two mitotically heritable states are possible (FLC-Venus/FLC-mCherry ON/ON, OFF/OFF). (B) In a cis memory system, the two copies of FLC can be maintained in alternative expression states, so four mitotically heritable states are possible (FLC-Venus/FLC-mCherry ON/ON, ON/OFF, OFF/ON, OFF/OFF). (C) Non-vernalized roots of FLC-mCherry × FLC-Venus F1 plants show uniform expression of FLC-Venus and FLC-mCherry in all nuclei. (D) After vernalization such plants can epigenetically repress a single-gene copy, while the other remains activated. The following notation is used to indicate files of cells in the various expression states: Both expressed, vc; FLC-Venus only, v; FLC-mCherry only, C. Scale bars, 50 μm.
Figure 3—figure supplement 1
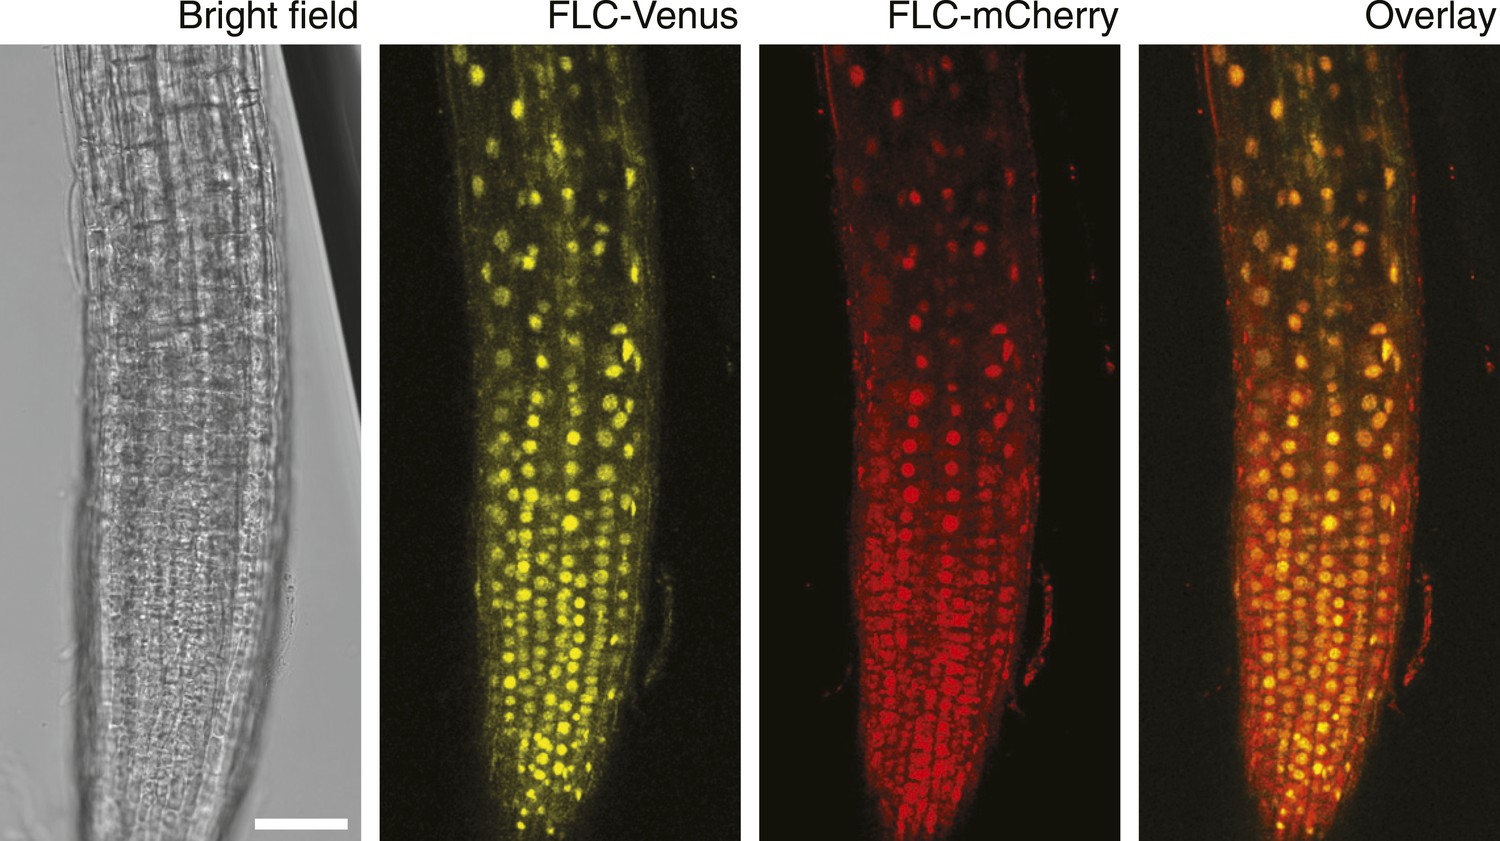
Confocal images of NV FLC-Venus × FLC-mCherry F1 plants.
Confocal microscope images acquired simultaneously using dual excitation of FLC-Venus and FLC-mCherry. Images are maximum intensity projections over 2–4 z-planes. A single bright-field image corresponding to the centre of the projection is also shown. Overlay contains the FLC-Venus (yellow) and FLC-mCherry (red) channels only. Scale bar, 50 μm.
Figure 3—figure supplement 2
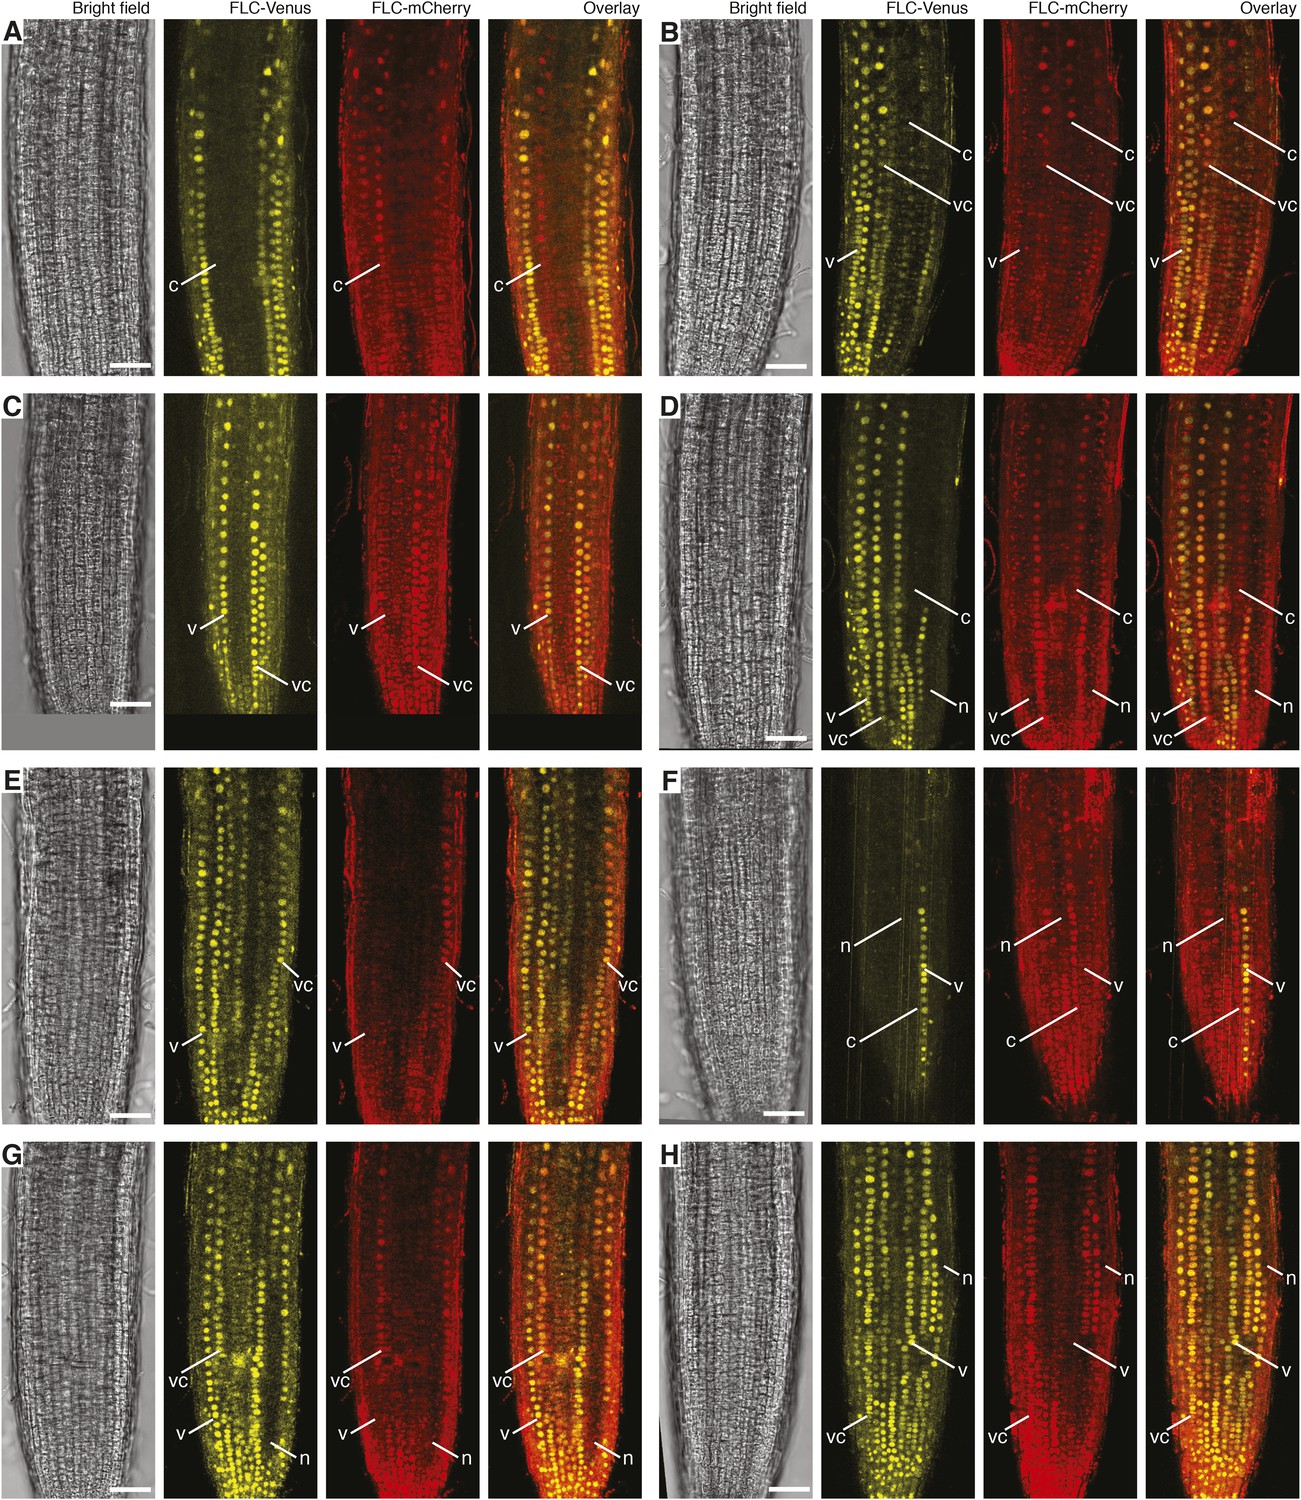
Confocal images of vernalized FLC-Venus × FLC-mCherry F1 plants.
Confocal microscope images acquired simultaneously using dual excitation of FLC-Venus and FLC-mCherry. Images are maximum intensity projections over 2–4 z-planes. A single bright-field image corresponding to the centre of the projection is also shown. Overlay contains the FLC-Venus (yellow) and FLC-mCherry (red) channels only. Using the notation 4WT10 to indicate that plants were treated with 4 weeks of cold followed by 10 days of growth in warm, vernalization treatments are: (A) 4WT10, (B) 5WT10, (C) 5WT11, (D–H) 6WT7. Files of cells showing mitotically heritable expression of the different combinations of FLC-Venus/FLC-mCherry are identified by white lines. The following notation is used to indicate files of cells in the various expression states: Both expressed, vc; FLC-Venus only, v; FLC-mCherry only, c; both repressed, n. Scale bars, 50 μm.
Download links
A two-part list of links to download the article, or parts of the article, in various formats.
Downloads (link to download the article as PDF)
Open citations (links to open the citations from this article in various online reference manager services)
Cite this article (links to download the citations from this article in formats compatible with various reference manager tools)
Local chromatin environment of a Polycomb target gene instructs its own epigenetic inheritance
eLife 4:e07205.
https://doi.org/10.7554/eLife.07205


