Contacts-based prediction of binding affinity in protein–protein complexes
- Utrecht University, Netherlands
Figures
Figure 1
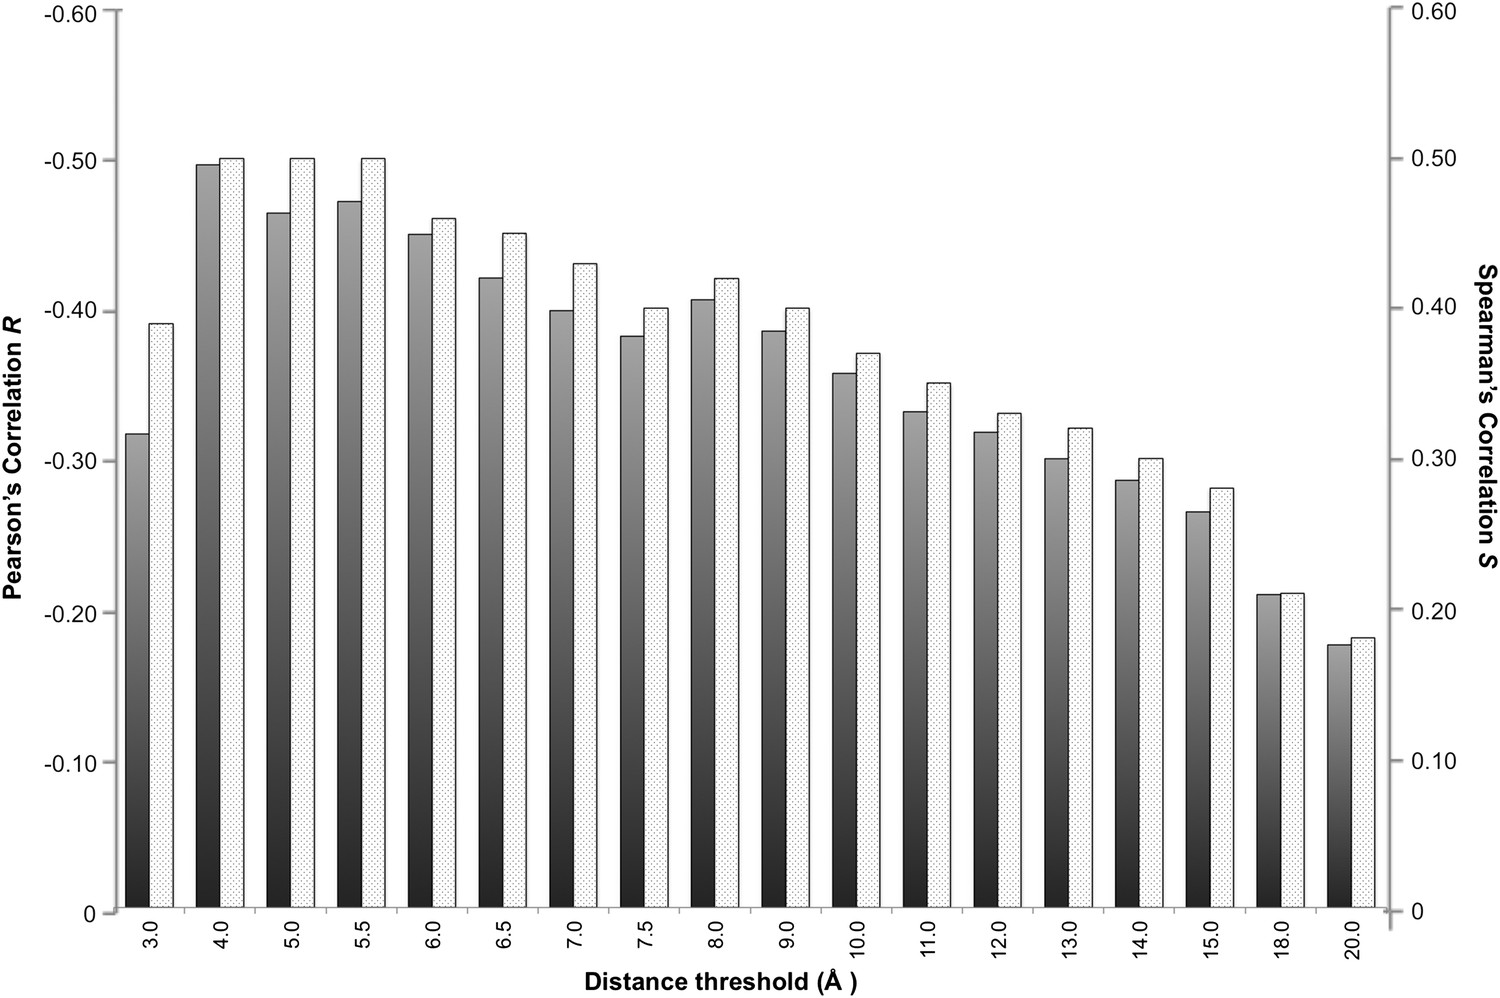
Correlation between number of inter-residue contacts and binding affinity (ΔGs) as a function of the distance cut-off used to calculate the contacts.
Both the Pearson's R (dark grey bars) and the Spearman's S (light grey-patterned bars) correlation coefficient are reported.
Figure 2
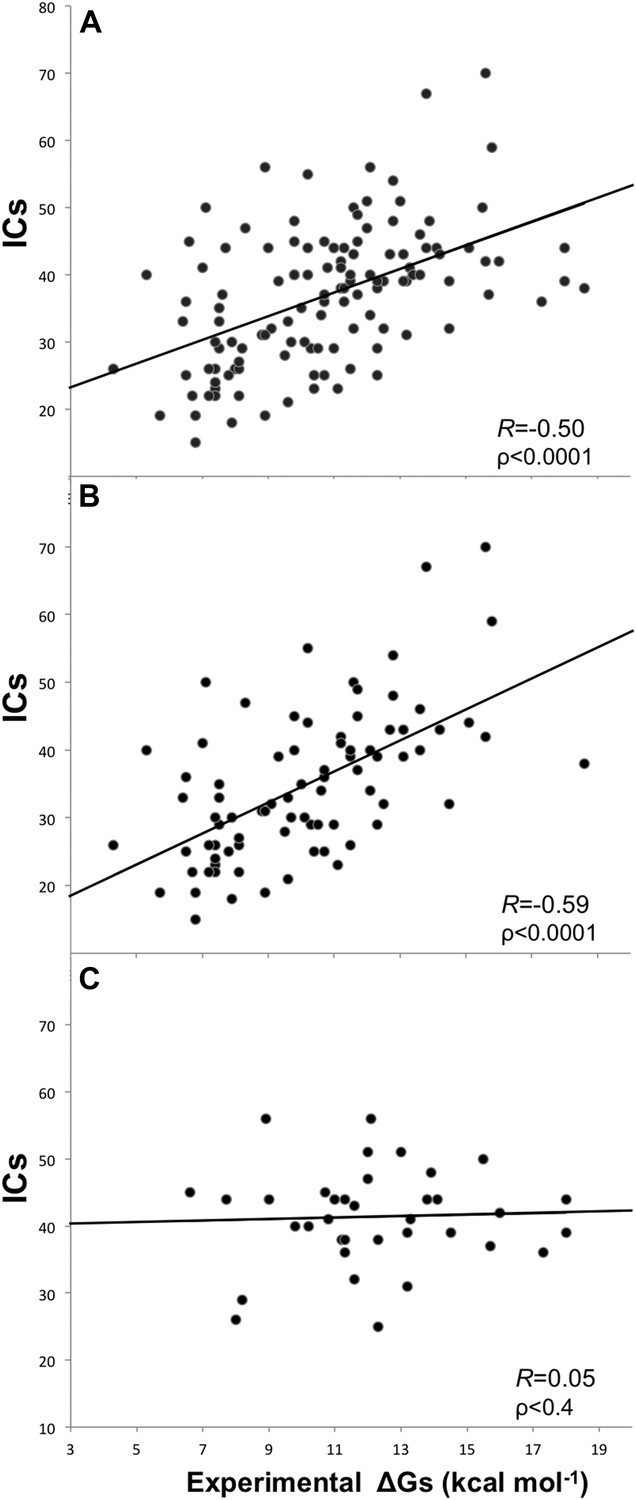
Plots of inter-residue contacts (ICs) vs experimentally determined binding affinities (ΔGs) of protein–protein complexes.
(A) Full dataset (122 complexes), (B) reliable experimental methods only (stopped-flow, surface plasmon resonance, spectroscopy, isothermal titration calorimetry) (81 complexes), and (C) non-reliable experimental methods (inhibition assay and fluorescence) (36 complexes). The trend line and corresponding Pearson correlation coefficients and p-values (ρ) are reported in each plot; binding affinities are reported as absolute values.
Figure 3
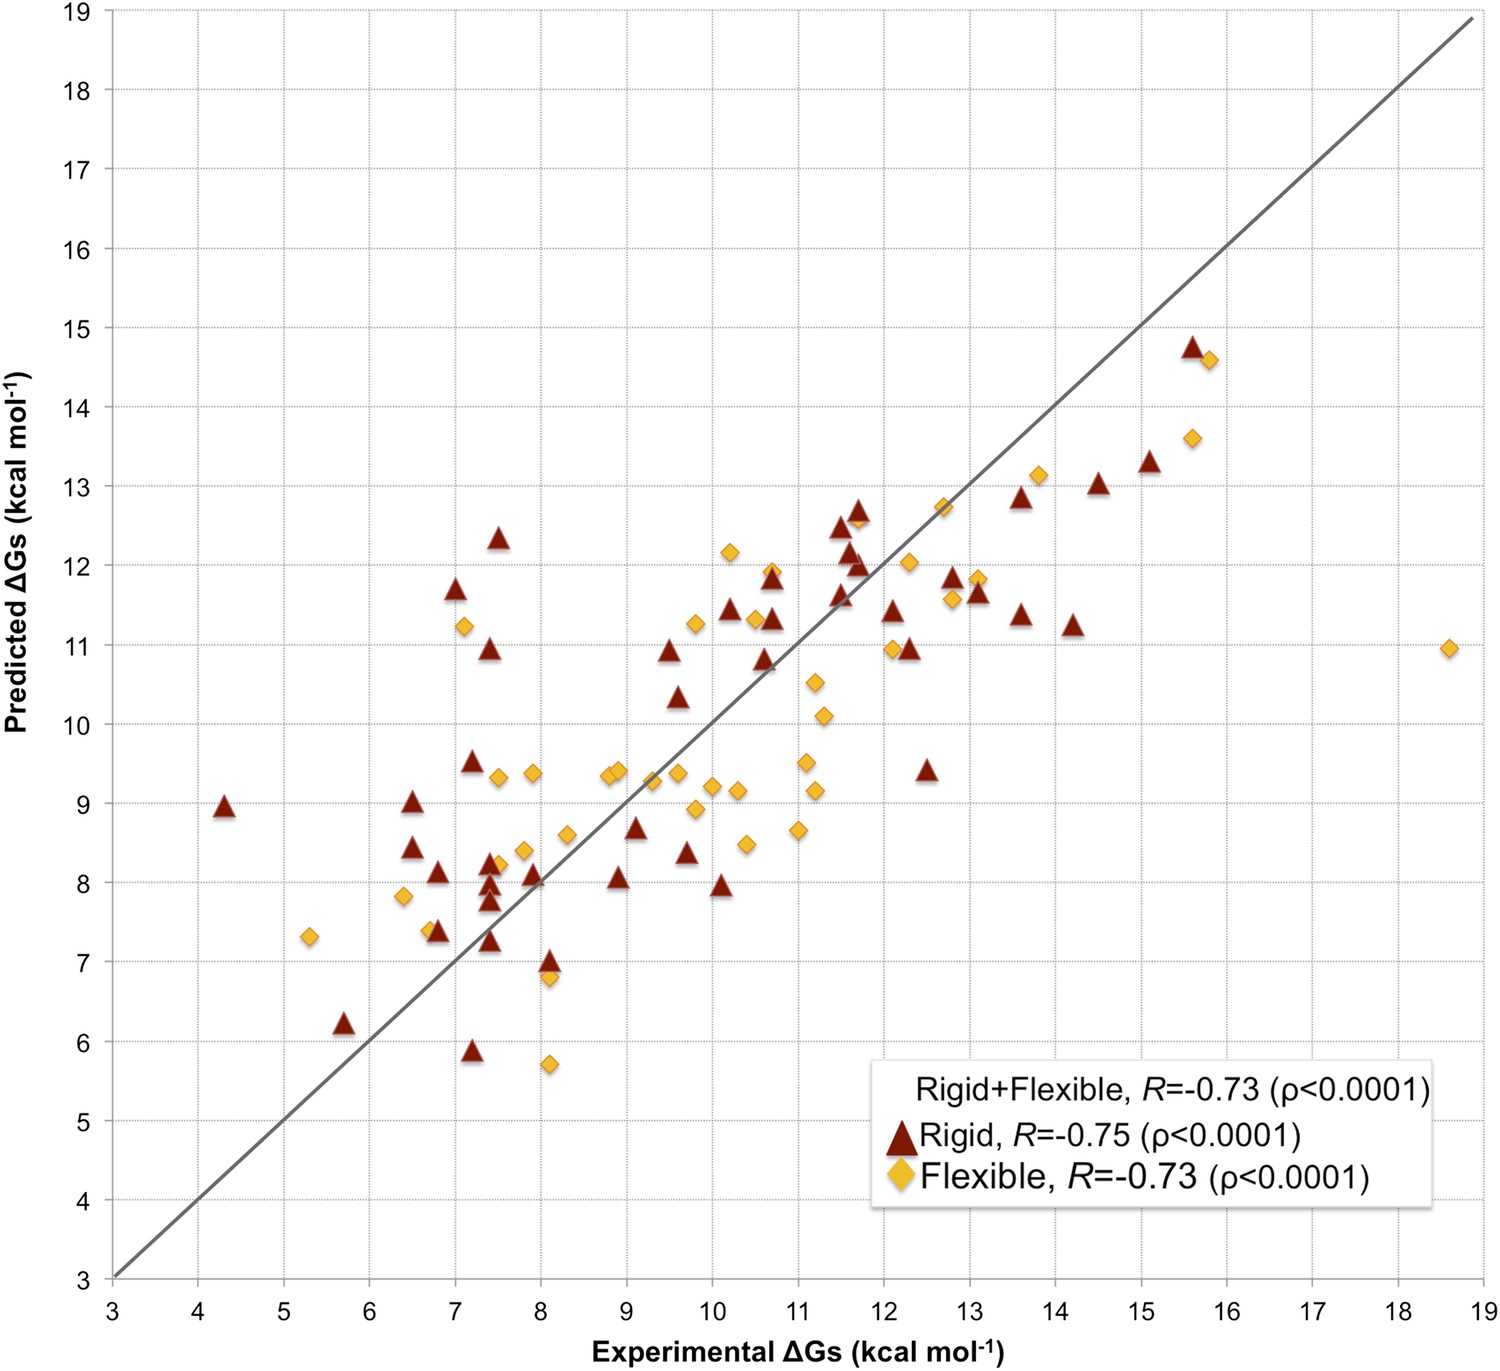
Scatter plot of predicted vs experimental binding affinities.
The predictions were made according to the inter-residue contacts (ICs)/non-interacting surface (NIS)-based model (Model 6, Equation 2) for the cleaned dataset of 81 protein–protein complexes. The correlation for all 81 complexes yields an R of −0.73 (ρ < 0.0001) with a RMSE of 1.89 kcal mol−1. When only rigid cases (interface RMSD between superimposed free and bound components ≤1.0 Å, red triangles) are considered, the correlation increases to R = −0.75 (ρ < 0.0001) with a RMSE of 1.88 kcal mol−1, while for flexible cases (interface RMSD >1.0 Å; yellow rhombus) R = −0.73 (ρ < 0.0001) with a RMSE of 1.88 kcal mol−1. The x = y line is shown as reference; binding affinities are reported as absolute values.
Figure 4
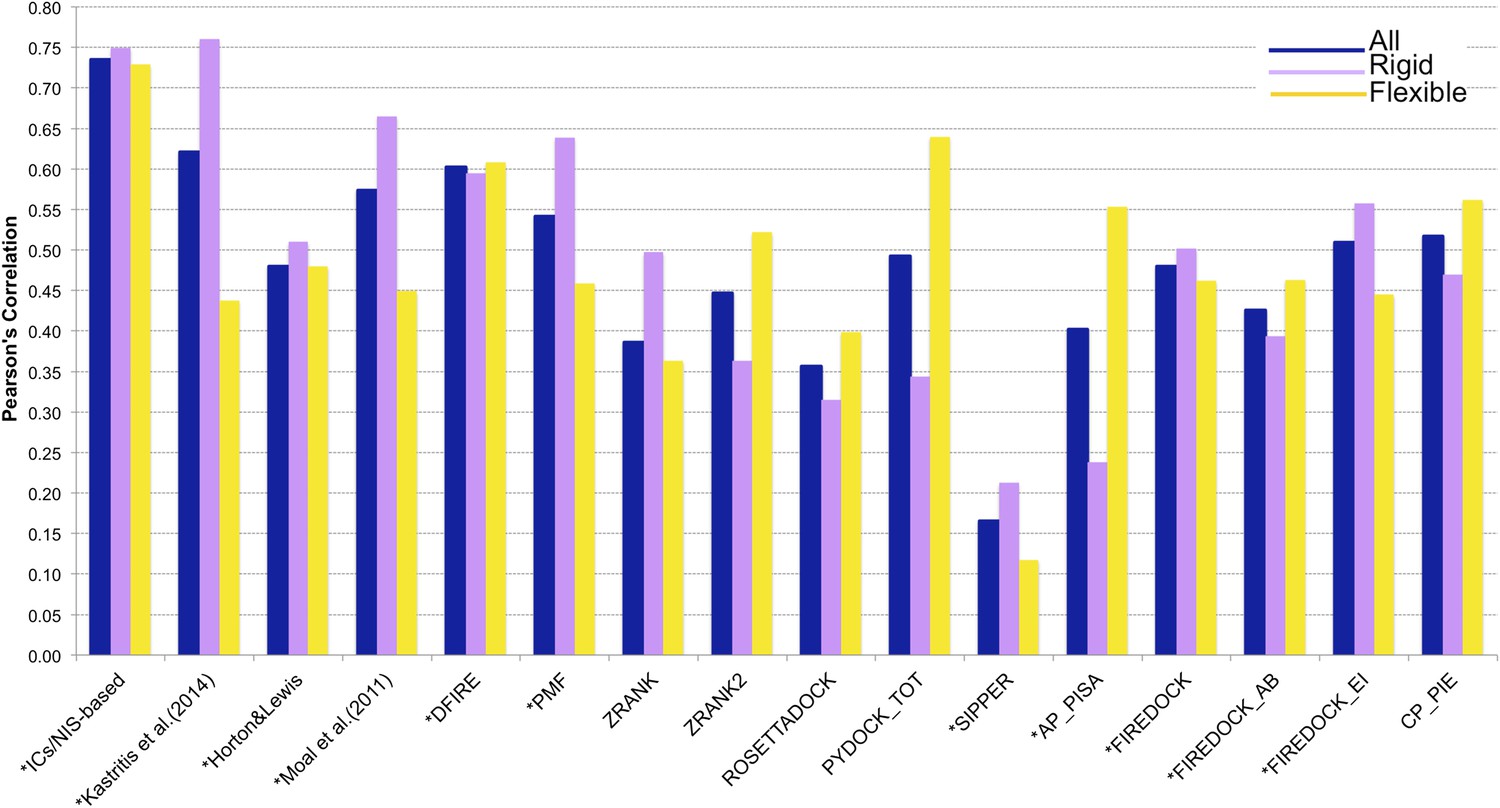
Comparison of the performance of our ICs/NIS-based model (Model 6, Equation 2) with other predictor models reported by Moal et al. (2011) and the CCHarPPI (Moal et al., 2015a, b) webserver.
The performance is expressed as Pearson's Correlation coefficient between experimental and predicted binding affinities. Predictions were made on the common set of 79 complexes between our cleaned dataset, the data tested by Moal et al. (2011) and the CCHarPPI (Moal et al., 2015a, b) pre-calculated data. Correlations for the entire set and the rigid (43) and flexible (36) complexes are reported as absolute values for easier comparison (methods marked with asterisk showed original negative correlations).
Figure 5 with 1 supplement
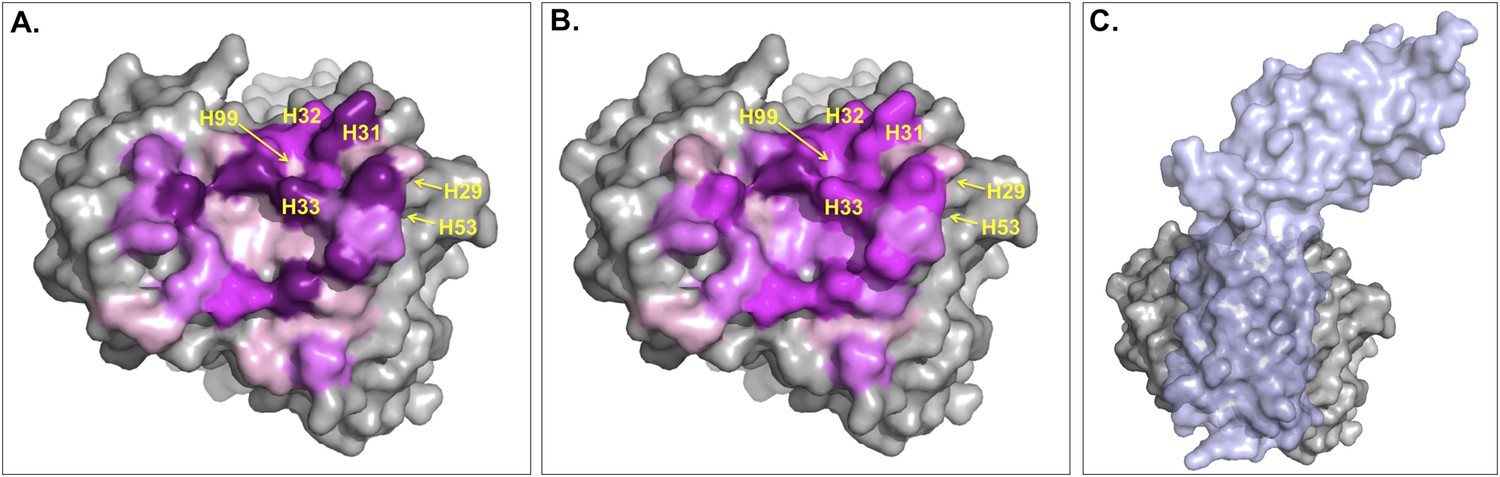
Surface representation of Fab D3H44; residues at the interface are colored according to their contribution (in percentage) to (A) the buried surface area (BSA) of Fab upon complex formation and (B) the total number of inter-residue contacts (ICs) made.
Increasing graduation of pink is used for the ranges 0–2%, 2–4%, 4–6%, and above 6% of BSA/ICs contribution. (C) Surface representation of Fab D3H44 (gray) in complex with Tissue factor (light blue), PDB code: 1JPS (Faelber et al., 2001). Fab D3H44 is represented in all panels with the same orientation. Values of residues BSA/ICs contribution are reported in Supplementary file 5. The following figure supplement is available for Figure 5.
Figure 5—figure supplement 1
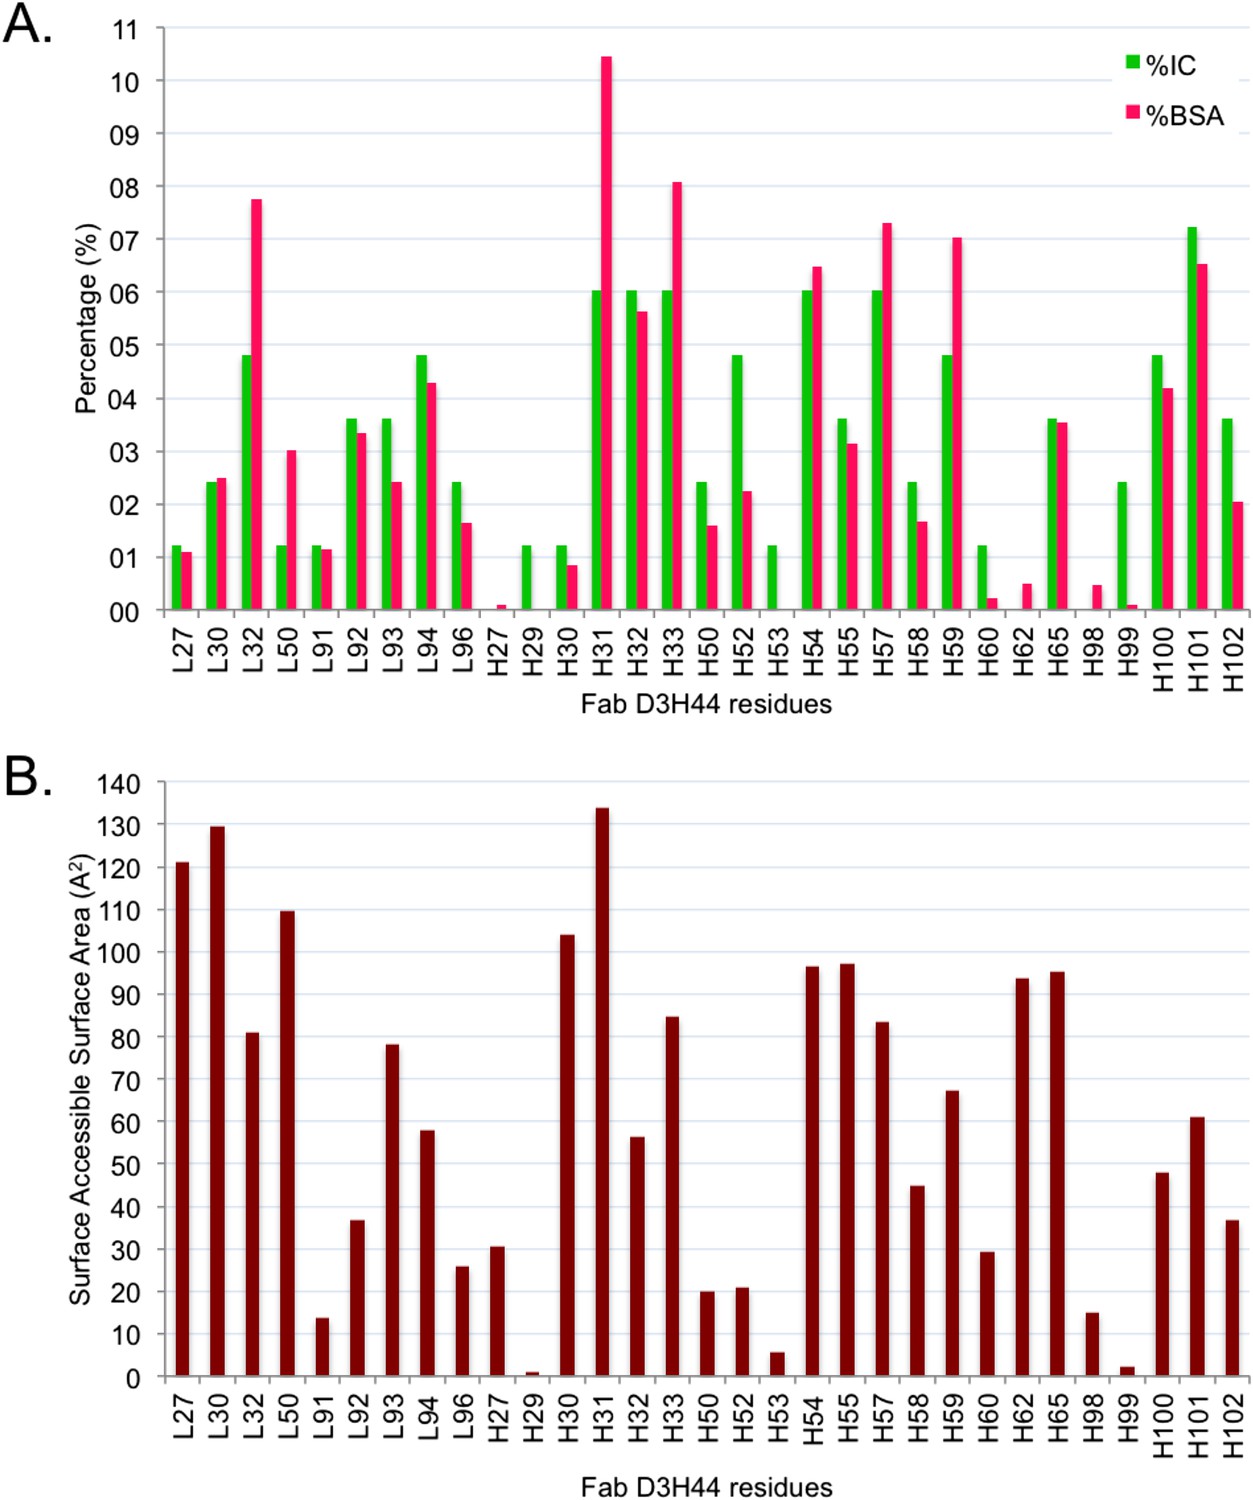
Comparison between BSA and ICs relative contribution.
(A) Relative contribution (percentage) of each Fab D3H44 interfacial residues to the total BSA (hot pink) and ICs (green).
(B) Corresponding solvent-accessible surface area in Å2 of the Fab D3H44 residues in the free form (separated proteins taken from the complex).
Tables
Table 1
Pearson's correlations and p-values (ρ) between inter-residue contacts (ICs) and buried surface area (BSA) and experimental binding affinities (ΔGs) for the entire dataset and subsets corresponding to various experimental method
| Class | #Complexes | RICs | RBSA | ||
|---|---|---|---|---|---|
| All | 122 | −0.50 | (ρ < 0.0001) | −0.32 | (ρ = 0.002) |
| Stopped-flow | 8 | −0.70 | (ρ = 0.03) | −0.55 | (ρ = 0.08) |
| SPR | 39 | −0.53 | (ρ = 0.0003) | −0.44 | (ρ = 0.002) |
| Spectroscopy | 14 | −0.65 | (ρ = 0.006) | −0.27 | (ρ = 0.2) |
| ITC | 20 | −0.55 | (ρ = 0.006) | −0.64 | (ρ = 0.001) |
| Inhibition assay | 17 | 0.05 | (ρ = 0.4) | −0.08 | (ρ = 0.4) |
| Fluorescence | 19 | 0.04 | (ρ = 0.4) | 0.34 | (ρ = 0.1) |
-
The ICs were calculated for a 4.0 Å cut-off.
Table 2
Pearson's correlations and p-values between experimental binding affinities and the inter-residue contacts (ICs), buried surface area (BSA) and non-interacting surface (NIS) (Kastritis et al., 2014) properties calculated on the ‘cleaned’ dataset
| Property | R | p-value |
|---|---|---|
| ICs_total | −0.59 | <0.0001 |
| ICs_charged/charged | −0.17 | =0.06 |
| ICs_charged/polar | −0.26 | =0.009 |
| ICs_charged/apolar | −0.45 | <0.0001 |
| ICs_polar/polar | −0.13 | =0.1 |
| ICs_polar/apolar | −0.56 | <0.0001 |
| ICs_apolar/apolar | −0.34 | =0.001 |
| ICs_hydrophilic/hydrophilic | −0.53 | <0.0001 |
| ICs_hydrophilic/hydrophobic | −0.34 | =0.001 |
| ICs_hydrophobic/hydrophilic | −0.05 | =0.3 |
| BSA_total | −0.46 | <0.0001 |
| BSA_polar | −0.36 | =0.0005 |
| BSA_apolar | −0.47 | <0.0001 |
| %NIS_polar | 0.07 | =0.06 |
| %NIS_apolar | −0.33 | =0.001 |
| %NIS_charged | 0.28 | =0.006 |
-
A fine classification of those properties based on the polar/apolar/charged and hydrophobic/hydrophilic nature of the amino acids is also reported. The property with the highest R value is highlighted in bold. The corresponding data are provided in Supplementary file 2.
Table 3
Optimization of binding affinity predictor models based on the regression model ΔGcalc = w1P1 + w2P2 + …. + Q
| Properties (PN) | Model 1 | Model 2 | Model 3 | Model 4 | Model 5 | Model 6 |
|---|---|---|---|---|---|---|
| ICs_total | 0.07782 | - | - | - | - | - |
| ICs_charged/charged | - | - | / | - | - | 0.09420 |
| ICs_charged/polar | - | - | / | - | - | / |
| ICs_charged/apolar | - | - | 0.11627 | - | - | 0.10038 |
| ICs_polar/polar | - | - | −0.12655 | - | - | −0.19522 |
| ICs_polar/apolar | - | - | 0.23595 | - | - | 0.22609 |
| ICs_apolar/apolar | - | - | / | - | - | / |
| ICs_hydrophil/hydrophil | - | - | - | 0.09055 | - | - |
| ICs_hydrophil/hydrophob | - | - | - | 0.05726 | - | - |
| ICs_hydrophob/hydrophil | - | - | - | 0.06037 | - | - |
| BSA_total | - | 0.00278 | - | - | - | - |
| BSA_polar | - | - | - | - | 0.00131 | - |
| BSA_apolar | - | - | - | - | 0.00400 | - |
| %NIS_polar | - | - | - | - | - | / |
| %NIS_apolar | - | - | - | - | - | −0.18786 |
| %NIS_charged | - | - | - | - | - | −0.13872 |
| Intercept (Q) | 4.78839 | 5.66032 | 5.13766 | 4.90452 | 5.44809 | 15.9433 |
| R | −0.59 | −0.46 | −0.67 | −0.60 | −0.48 | −0.73 |
| p-value | <0.0001 | <0.0001 | <0.0001 | <0.0001 | <0.0001 | <0.0001 |
| RMSE (kcal mol−1) | 2.25 | 2.46 | 2.08 | 2.22 | 2.45 | 1.89 |
-
The weights wN are reported for each properties PN used to train Model N. Properties that have not been used for training the Model or have been evaluated as not relevant from the Akaike's An Information Criterion (AIC) evaluation are reported as ‘-’ and ‘/’, respectively. At the bottom of the table, the correlation coefficient and prediction error (expressed as R and RMSE) are reported.
Additional files
-
Supplementary file 1
List of entries removed from the original binding affinity benchmark (Alberts, 1998) because of gaps at interface.
- https://doi.org/10.7554/eLife.07454.012
-
Supplementary file 2
ICs, NIS and BSA values (and their sub-classification) calculated on the cleaned dataset. Correlations of these to the binding affinity are reported in Table 2.
- https://doi.org/10.7554/eLife.07454.013
-
Supplementary file 3
Table summarizing the weights (wN) and performance (expressed as Pearson's coefficient R and RMSE) of the fourfold cross-validation, repeated 10 times, of the following binding affinity regression model:
Each coefficient has been reported as average on the four models trained on the respective folds.
- https://doi.org/10.7554/eLife.07454.014
-
Supplementary file 4
Predicted binding affinities based on ICs (this work) and other methods (see ‘Materials and methods’) for the set of 79 common complexes between the cleaned dataset and the data tested reported by Moal et al. (2011). Performance results are summarized in Figure 4.
- https://doi.org/10.7554/eLife.07454.015
-
Supplementary file 5
List of Fab D3H44 antibody residues in the binding interface of the complex with the Tissue factor (PDB code of the complex: 1JPS). For each residue N, its relative contribution (expressed as a percentage) to the total number of inter-residue contacts made and to the total buried surface area of the Fab is reported. ICN and BSAN are the interface contacts and the buried surface area of residue N, respectively; ICtotal is 83; BSAFab_total is evaluated as half of the BSA for the complex corresponding to 926 Å2.
- https://doi.org/10.7554/eLife.07454.016
Download links
A two-part list of links to download the article, or parts of the article, in various formats.
Downloads (link to download the article as PDF)
Open citations (links to open the citations from this article in various online reference manager services)
Cite this article (links to download the citations from this article in formats compatible with various reference manager tools)
Contacts-based prediction of binding affinity in protein–protein complexes
eLife 4:e07454.
https://doi.org/10.7554/eLife.07454


