Crispant analysis in zebrafish as a tool for rapid functional screening of disease-causing genes for bone fragility
- Center for Medical Genetics Ghent, Department of Biomolecular Medicine, Ghent University, Belgium
- Center for X-ray Tomography, Department of Physics and Astronomy, Ghent University, Belgium
- Department of Orthopaedics and Sports Medicine, University of Washington, United States
- Institute for Stem Cell and Regenerative Medicine, University of Washington, United States
Figures
Figure 1 with 5 supplements

Measurements of osteoblast-positive surface area and mineralized surface area of the head skeleton in 7 and 14 dpf crispants.
The first four genes are associated with the pathogenesis of osteoporosis, while the last six are linked to osteogenesis imperfecta. (a) Schematic overview of the ventral and lateral perspective of the head of zebrafish larvae at 7 and 14 dpf. The notochord tip (n), the opercle (o) the mineralized vertebrae (v), the eyes (e) and parasphenoid (p) are shown. (b) Quantification of the osteoblast-positive surface area of the total head and the mineralized surface area of the total head and notochord tip at 7 dpf in comparison with their respective controls. (c) Quantification of the osteoblast-positive surface area of the total head and the mineralized surface area of the total head, opercle and notochord tip and number of vertebrae at 14 dpf in comparison with their respective controls. For easier visualization, obtained results were normalized to the respective controls (normalization = individual value crispant (or control) / mean control) (n=10). Statistical significance is evaluated using the Mann-Whitney U -test on non-normalized data and significant differences were visualized using an asterix (*=p ≤ 0,05; **=p ≤ 0,01; ***=p ≤ 0,001; ****=p ≤ 0,0001). Error bars show the standard deviation of non-normalized data.
-
Figure 1—source data 1
Raw data on osteoblast-positive surface area and mineralized surface area of the head skeleton in 7 and 14 dpf crispants.
- https://cdn.elifesciences.org/articles/100060/elife-100060-fig1-data1-v2.xlsx
Figure 1—figure supplement 1
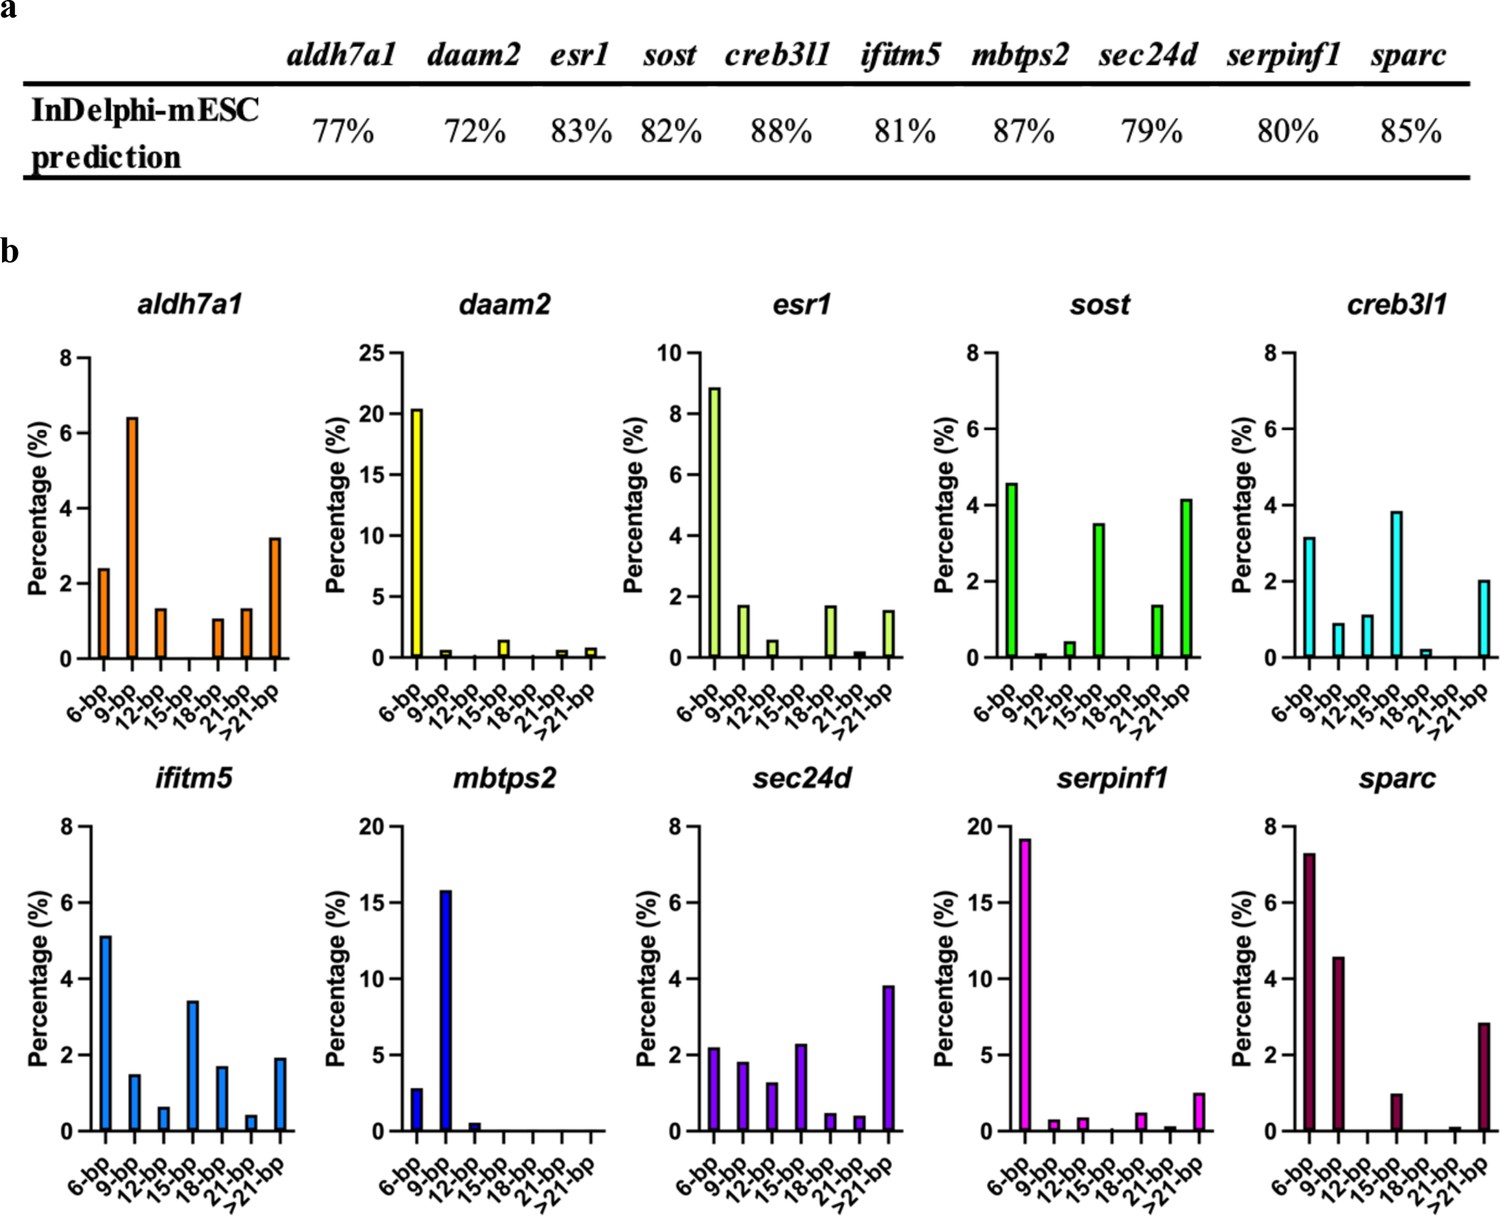
InDelphi prediction and In-frame analysis.
The first four genes are associated with the pathogenesis of osteoporosis, while the last six are linked to osteogenesis imperfecta. (a) The predicted indel percentage using the InDelphi-mESC prediction tool. (b) Visualization of the in-frame analysis of the different crispants, showing the percentages of 9, 12, 15, 18, 21 and more than 21 base pair deletions in the crispants.
Figure 1—figure supplement 2
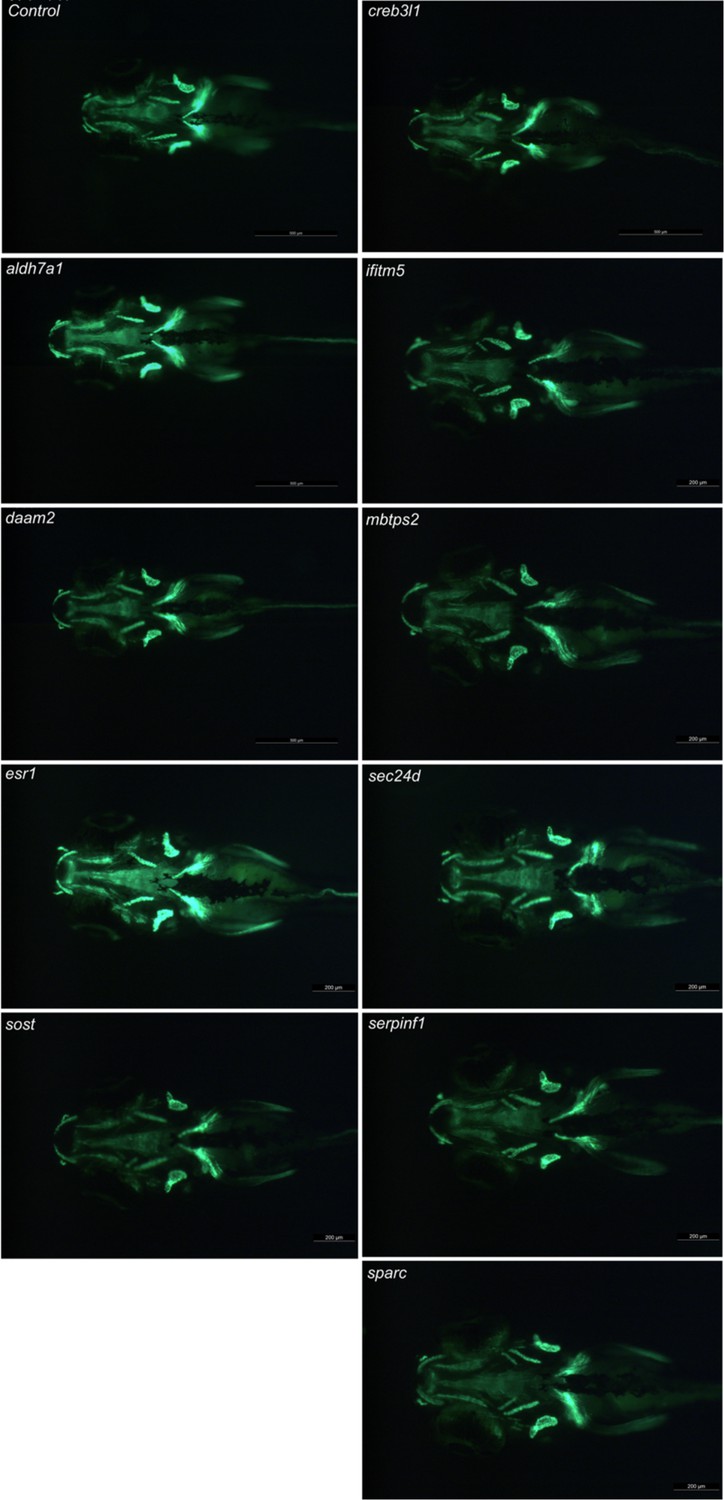
Osteoblast-positive head area at 7 dpf.
Visualization of the osteoblast using the osx:Kaede transgenic line. The four genes on the left are associated with the pathogenesis of osteoporosis, while the six genes on the right are linked to osteogenesis imperfecta. The presented image shows a representative image of the specific crispants. Images are taken with the Leica microscope and the osx:Kaede positive larvae are visualized from a ventral perspective. Scale bars = 500 μm and 200 μm.
Figure 1—figure supplement 3
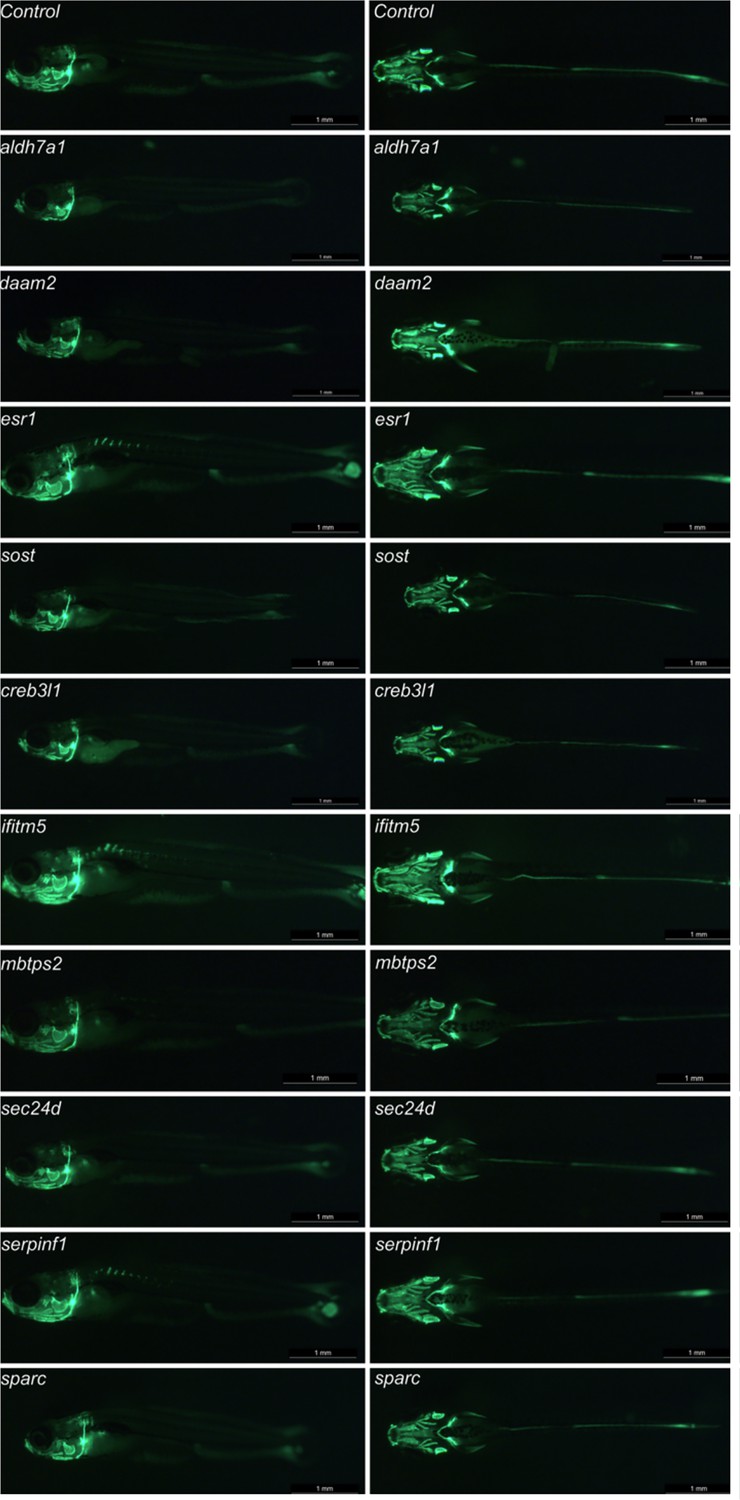
Osteoblast-positive head area at 14 dpf.
Visualization of the osteoblast using the osx:Kaede transgenic line. The first four genes are associated with the pathogenesis of osteoporosis, while the last six are linked to osteogenesis imperfecta. The presented image shows a representative image of the specific crispants. Images are taken with the Leica microscope and the osx:Kaede-positive larvae are visualized from a ventral and lateral perspective. Scale bars = 1 mm.
Figure 1—figure supplement 4
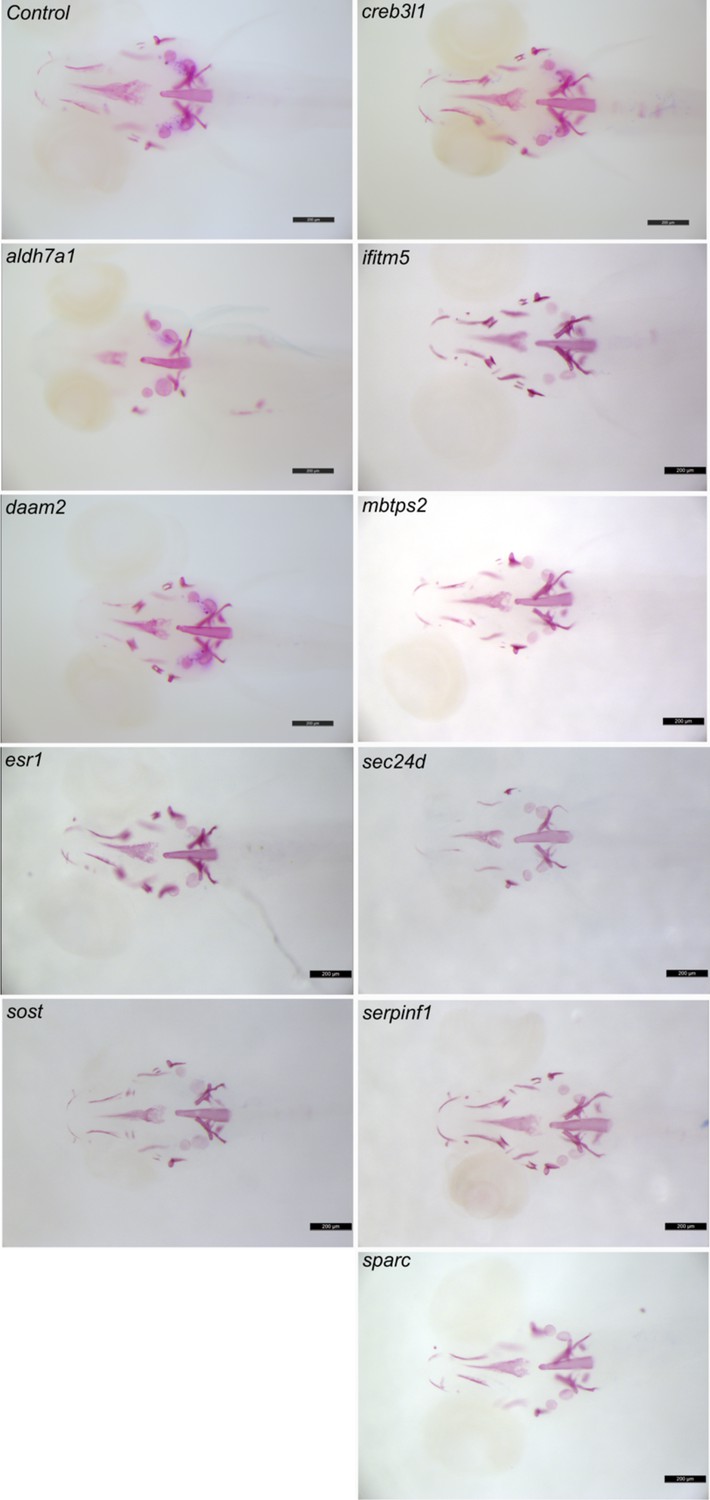
Mineralization in the head area at 7 dpf.
Visualization of the mineralization after ARS staining. The four genes on the left are associated with the pathogenesis of osteoporosis, while the six genes on the right are linked to osteogenesis imperfecta. The presented image shows a representative image of the specific crispants. Images are taken with the Leica microscope and the stained larvae are visualized from a ventral perspective. Scale bars = 200 μm.
Figure 1—figure supplement 5
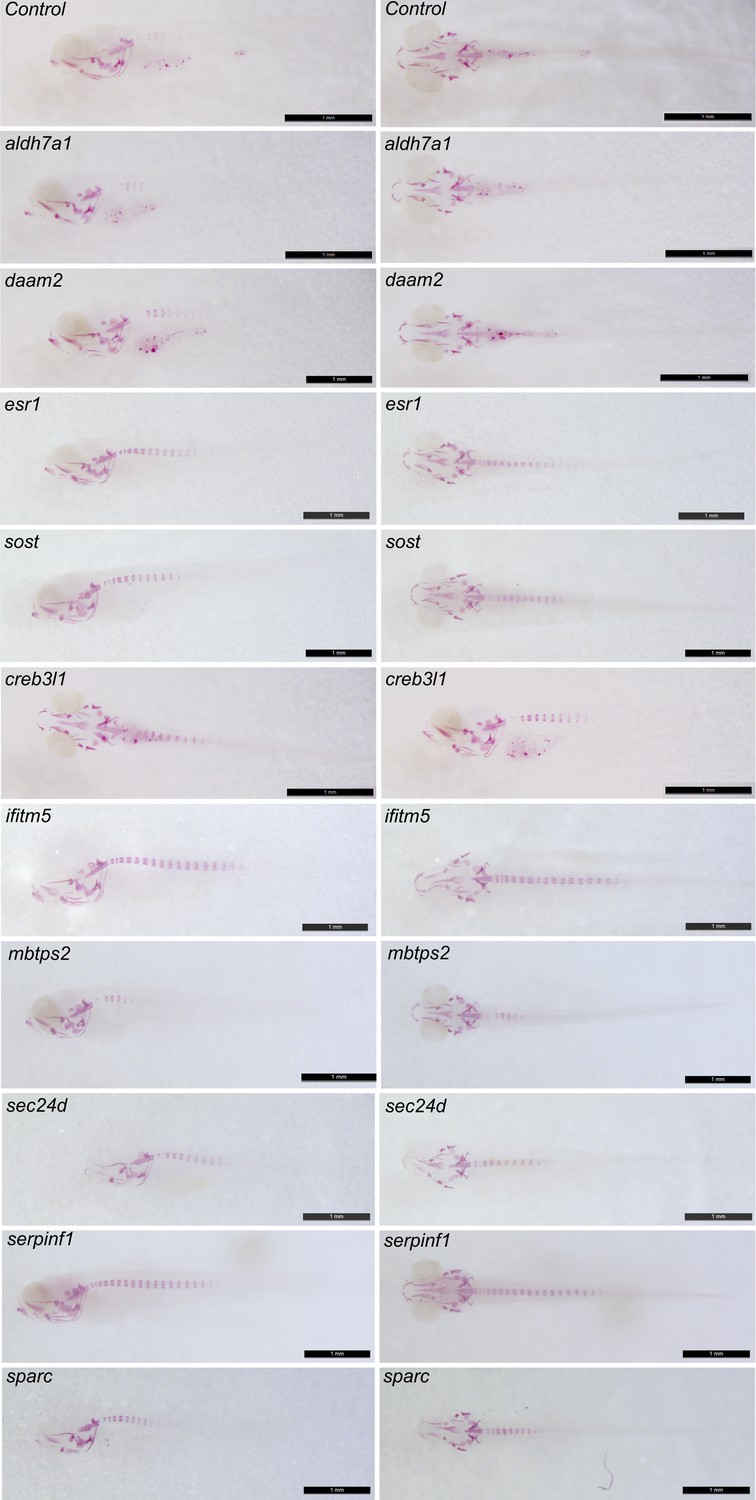
Mineralization in the head area at 14 dpf.
Visualization of the mineralization after ARS staining. The first four genes are associated with the pathogenesis of osteoporosis, while the last six are linked to osteogenesis imperfecta. The presented image shows a representative image of the specific crispants. Images are taken with the Leica microscope and the stained larvae are visualized from a ventral and lateral perspective. Scale bars = 1 mm.
Figure 2
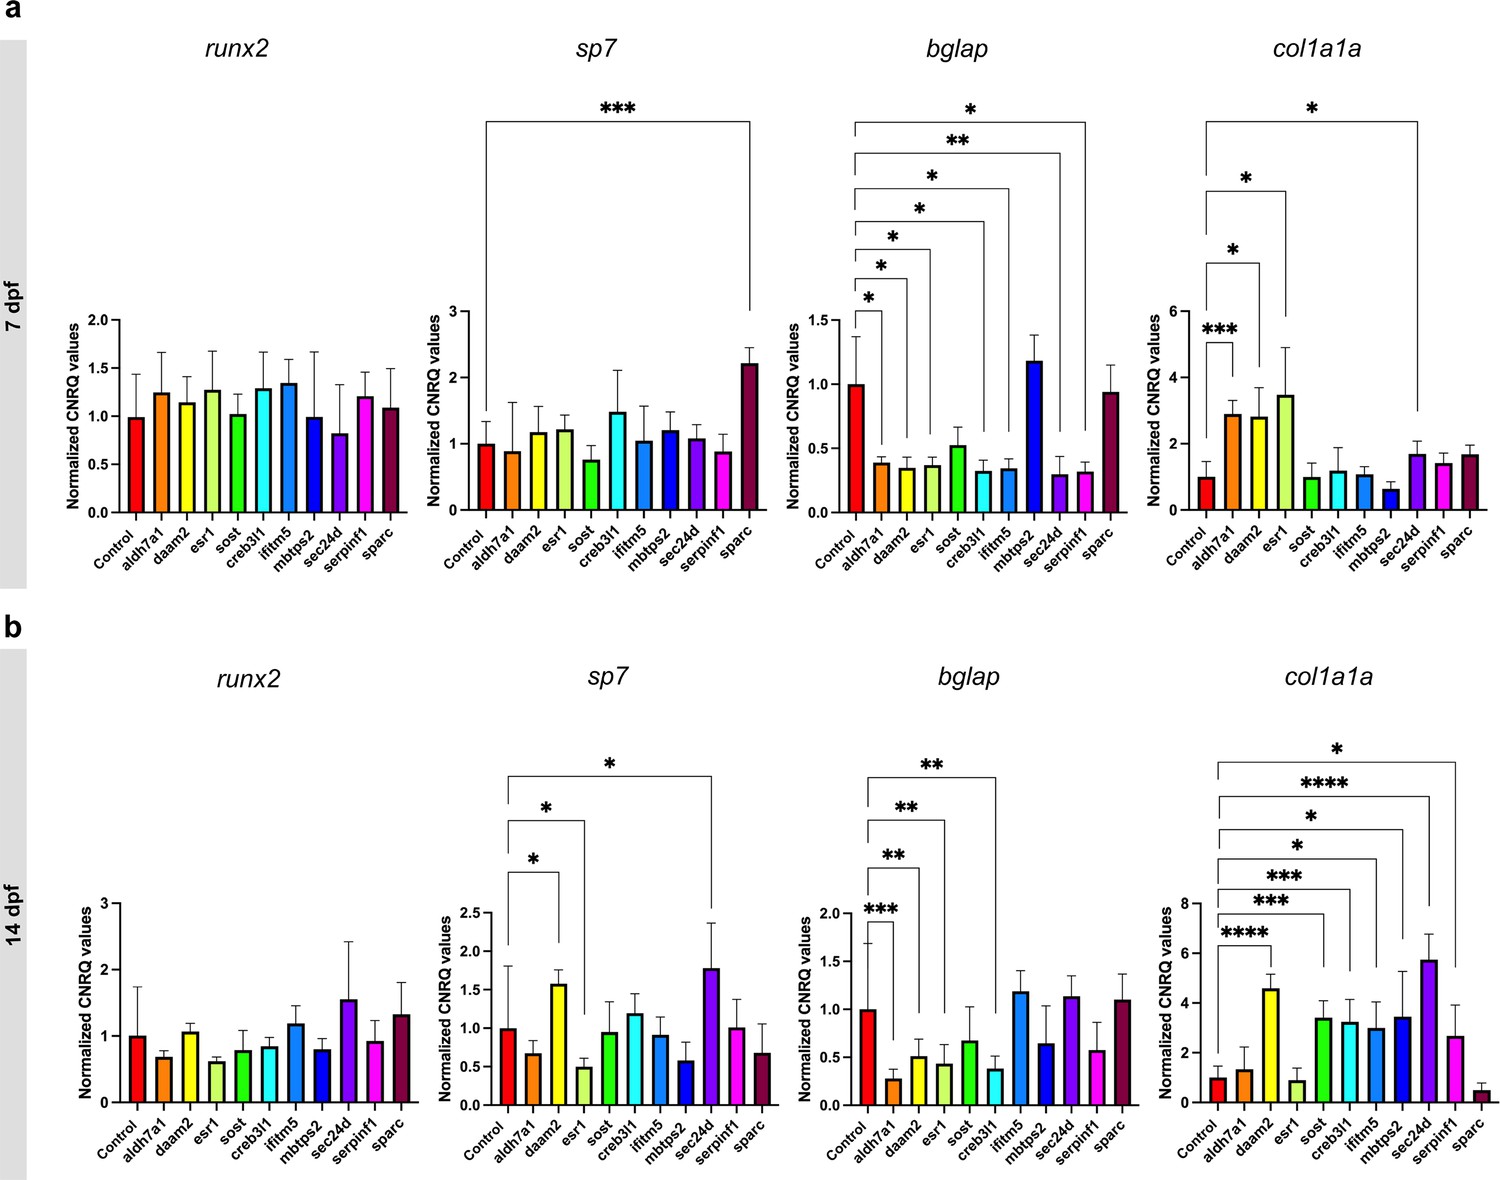
RT-qPCR expression analysis of runx2, sp7, bglap and col1a1a in crispants at 7 (a) and 14 dpf (b) and their respective controls, normalized according to the controls (normalization = individual values crispant (or control) / mean control).
The first four genes are associated with the pathogenesis of osteoporosis, while the last six are linked to osteogenesis imperfecta. Statistical significance is evaluated using the Mann-Whitney U test on non-normalized data and significant differences were visualized using an asterix (*=p ≤ 0.05; **=p ≤ 0.01; ***=p ≤ 0.001; ****=p ≤ 0.0001). Error bars show the standard deviation of non-normalized data.
-
Figure 2—source data 1
Raw qPCR output data from the qBASE+ software (Biogazelle).
- https://cdn.elifesciences.org/articles/100060/elife-100060-fig2-data1-v2.xlsx
Figure 3
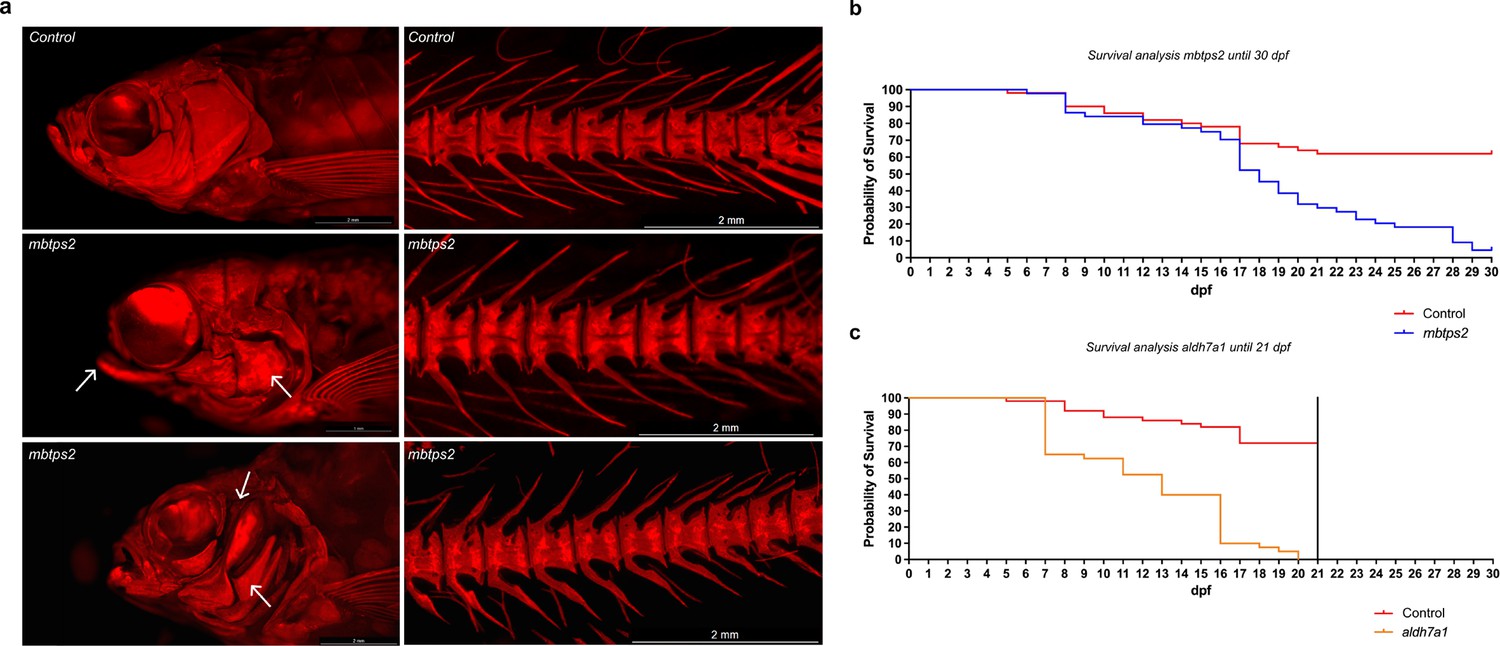
ARS images of mbtps2 crispants and survival analysis of aldh7a1 and mbtps2 crispants.
(a) ARS images of control fish and crispants for mbtps2, showing severe craniofacial abnormalities (arrows). (b) Survival curve of controls and crispants for mbtps2, showing a reduction in survival starting from 17 dpf. (c) Survival curve of controls and crispants for aldh7a1, showing a reduction in survival starting from 7 dpf.
-
Figure 3—source data 1
Raw survival curve data for aldh7a1 and mbtps2 crispants.
- https://cdn.elifesciences.org/articles/100060/elife-100060-fig3-data1-v2.xlsx
Figure 4 with 3 supplements
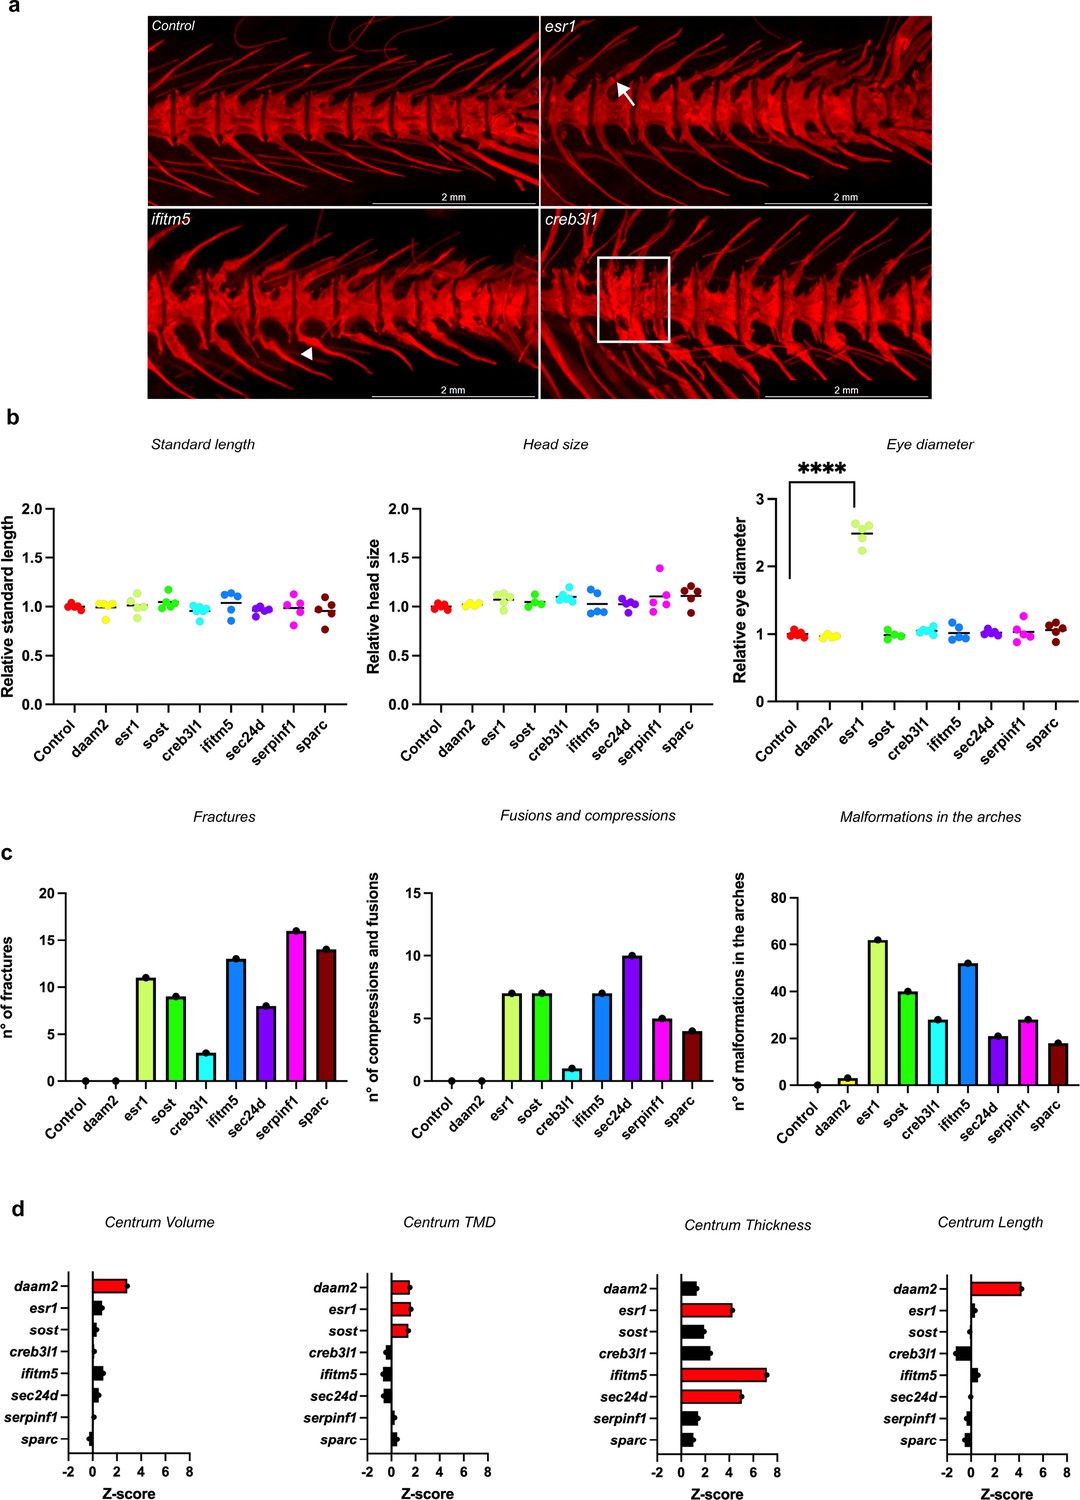
Skeletal phenotyping of adult crispants and their respective controls.
The first three genes are associated with the pathogenesis of osteoporosis, while the last five are linked to osteogenesis imperfecta. (a) Pictures of ARS-stained vertebral column of a control and three crispants (from left to right: esr1, ifitm5 and creb3l1), showing fractures (arrow), fusions and compressions (squared) and malformations in the arches (arrowhead). (b) Measurements of the standard length, the head size and the eye diameter of the crispants compared to their control. The standard length was measured from the snout tip to the tail base. The head size was measured from the snout tip to the supraoccipital bone and the eye diameter was measured from the lateral ethmoid to the hyomandibula. The data was normalized for easier visualization (normalization = individual value crispants (or controls) / mean control (n=5)). (c) Quantification of the number of fractures, fusions or compressions and malformations in the arches of crispants and the controls. For this quantification, twelve vertebrae were selected per fish and a total of 5 crispants per assay was evaluated. Statistical analysis was evaluated using the Mann-Whitney U -test on non-normalized data and significant differences were visualized using an asterix (*=p ≤ 0.05; **=p ≤ 0.01; ***=p ≤ 0.001; ****=p ≤ 0.0001). Error bars showed the standard deviation of non-normalized data. (d) Quantification of skeletal parameters by quantitative micro-computed tomography (μCT) analysis. In the graphical representation, the different crispants were listed. Statistically significant differences from the control values for a given crispant were depicted as red bars. Significance levels were determined through the global test analysis (Figure 4—figure supplement 2).
-
Figure 4—source data 1
Raw data on skeletal phenotyping parameters.
- https://cdn.elifesciences.org/articles/100060/elife-100060-fig4-data1-v2.xlsx
Figure 4—figure supplement 1
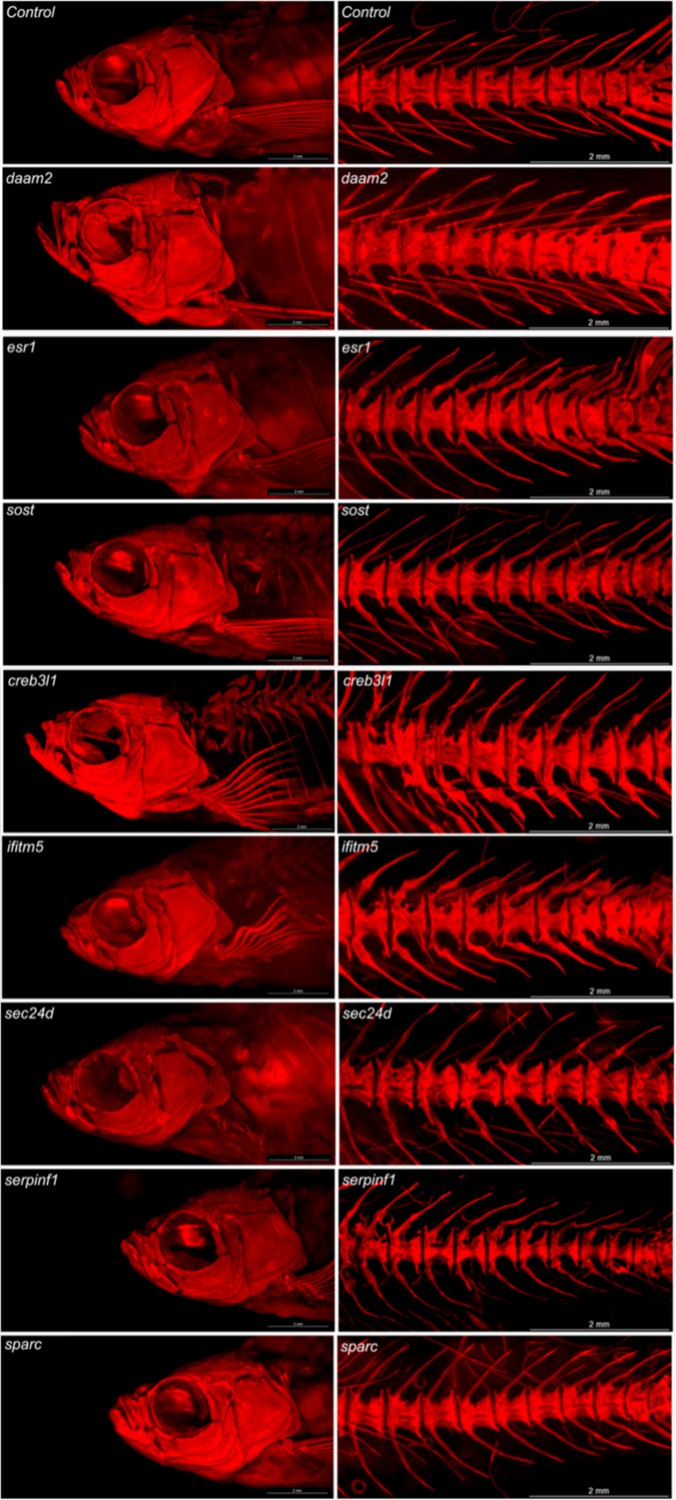
Mineralization in the skeleton at 90 dpf.
Visualization of the mineralization after ARS staining. The first three genes are associated with the pathogenesis of osteoporosis, while the last five are linked to osteogenesis imperfecta. The presented image shows a representative image of the specific crispants. Images are taken with the Leica microscope and the stained adults are visualized from a lateral perspective. Scale bars = 1 mm.
Figure 4—figure supplement 2
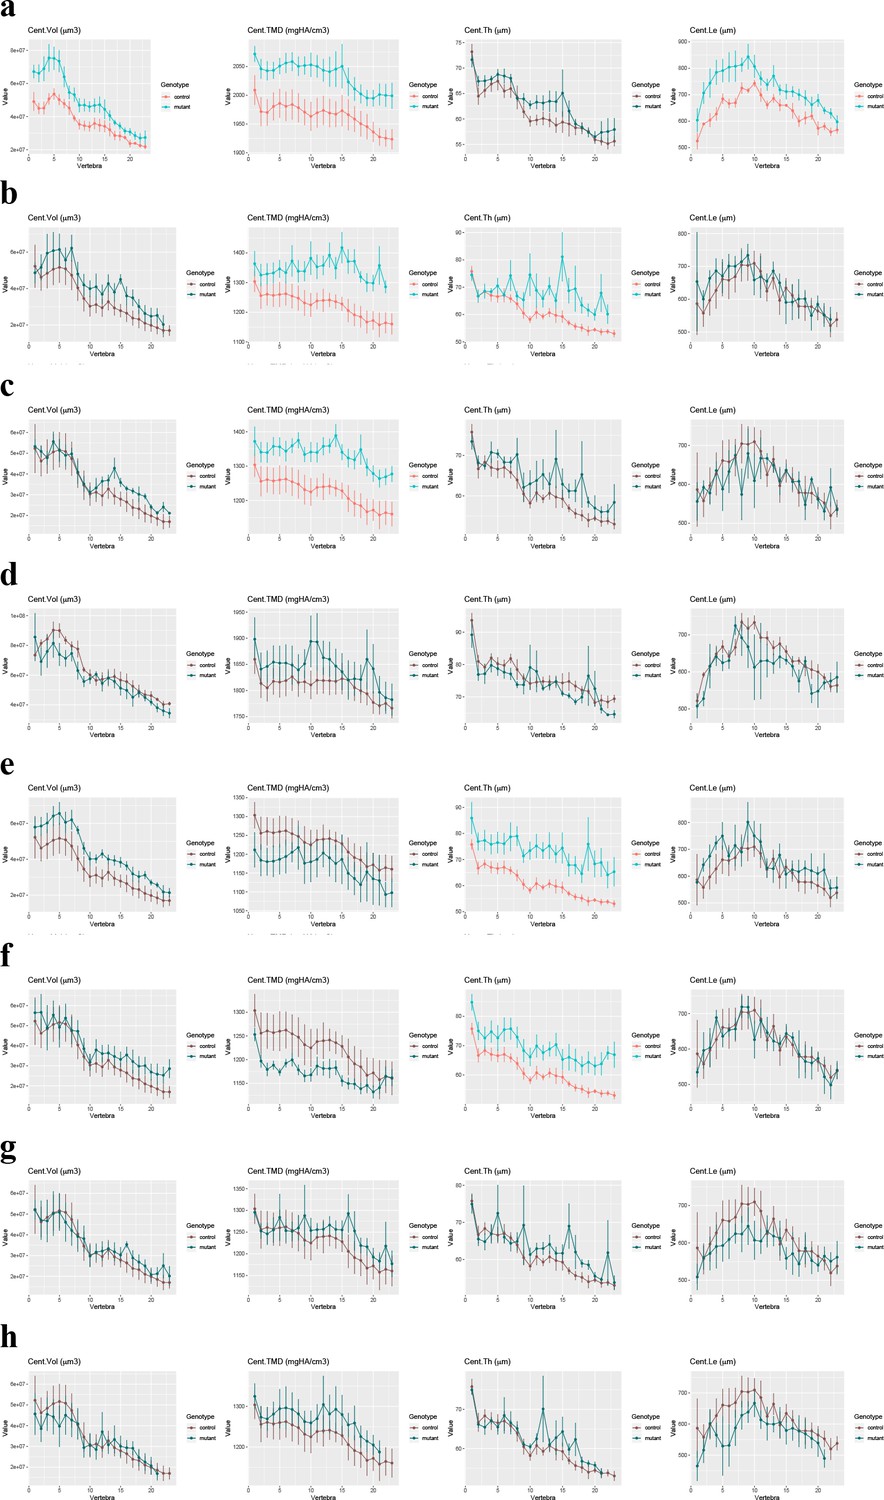
Quantitative μCT-scanning analysis of the vertebral column of the crispants using FishCuT software.
Whole-body μCT-scanning was performed for the evaluation of skeletal structures in the vertebral column. Different bone related parameters are visualized: Tissue Mineral Density (TMD), Volume (Vol), Thickness (Th), and Length (Le). (a) Results of crispants for daam2. (b) Results for crispants for esr1. (c) Results for crispants for sost. (d) Results for crispants for creb3l1. (e) Results for crispants for ifitm5. (f) Results for crispants for sec24d. (g) Results for crispants for serpinf1. (h) Results for crispants for sparc. The first three genes are associated with the pathogenesis of osteoporosis, while the last five are linked to osteogenesis imperfecta. Statistically significant differences were represented with a lighter color scheme for easy visualization.
Figure 4—figure supplement 3
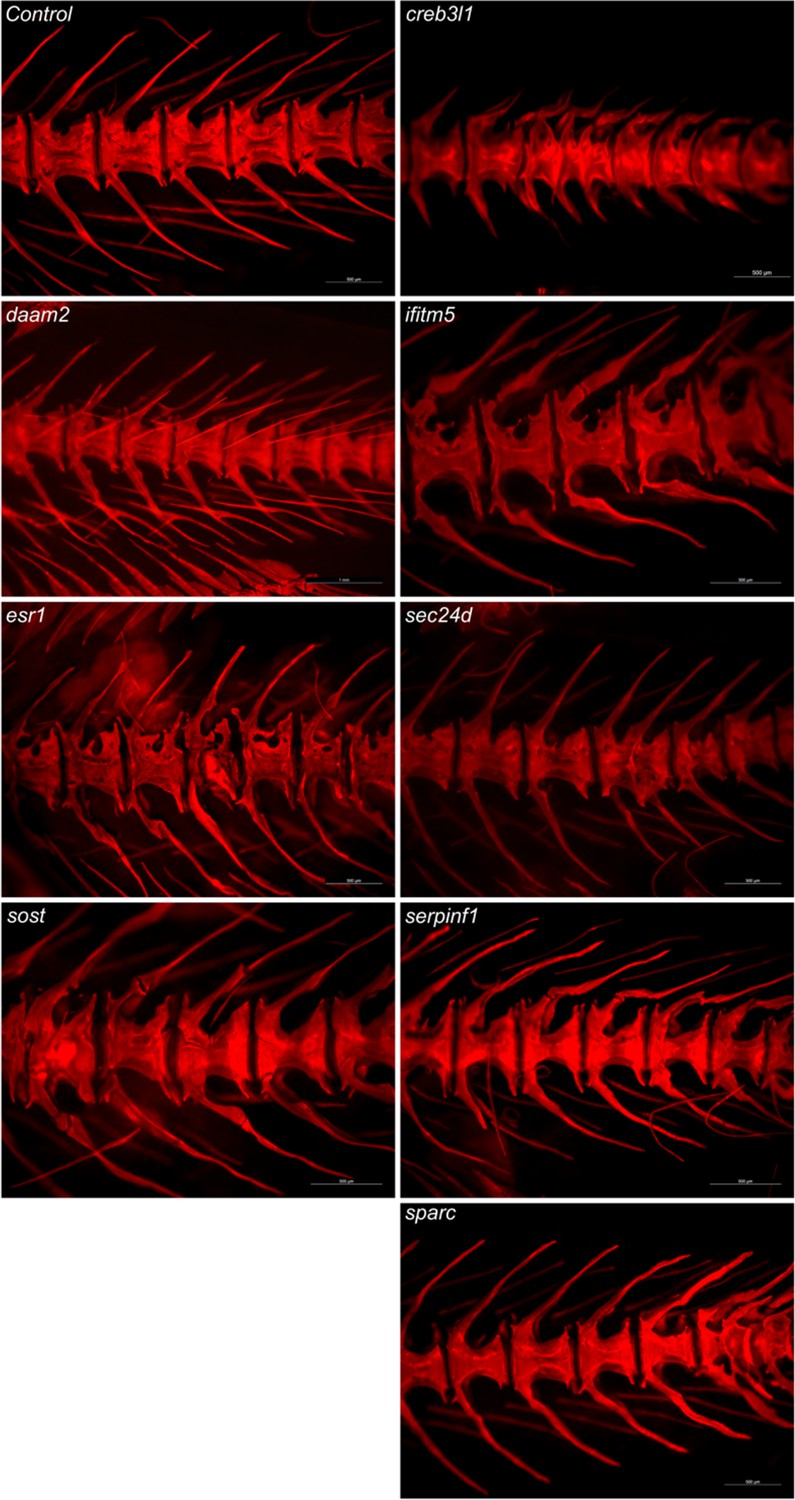
Mineralization in the skeleton at 90 dpf.
Representative images of skeletal mineralization following Alizarin Red S (ARS) staining in a second clutch, demonstrating the consistency of the observed skeletal phenotype. The three genes on the left are associated with the pathogenesis of osteoporosis, while the last five genes on the right are linked to osteogenesis imperfecta. Images show specific crispants from a lateral view, captured using a Leica microscope. Scale bars = 1 mm.
Tables
Table 1
InDelphi-mESC prediction, indel, out-of-frame indel and in-frame rates for the different crispants, determined by NGS from pools of 1dpf embryos.
The first four genes are associated with the pathogenesis of osteoporosis, while the last six are linked to osteogenesis imperfecta. The percentage of reads likely to affect the protein function is calculated based on the percentage of reads with out-of-frame indels combined with the percentage of reads with in-frame deletions of equal to or more than 6 basepairs.
| aldh7a1 | daam2 | esr1 | sost | creb3l1 | ifitm5 | mbtps2 | sec24d | serpinf1 | sparc | |
|---|---|---|---|---|---|---|---|---|---|---|
| % reads with indel | 87% | 96% | 92% | 80% | 71% | 90% | 94% | 85% | 92% | 92% |
| % reads with out-of-frame indel | 66% | 57% | 64% | 64% | 49% | 73% | 73% | 63% | 55% | 72% |
| % reads with in frame indel ≥6 bp | 16% | 24% | 15% | 14% | 11% | 15% | 19% | 12% | 25% | 16% |
| % reads likely affecting protein function | 82% | 81% | 79% | 78% | 60% | 88% | 92% | 75% | 80% | 88% |
Table 2
Overview of the different measurements in crispants at 7, 14, and 90 dpf.
The first four genes are associated with the pathogenesis of osteoporosis, while the last six are linked to osteogenesis imperfecta. (-): downregulation or less, (+) upregulation or more, ns: not significant, asterix defines statistical significance (* = p ≤ 0.05; ** = p ≤ 0.01; *** = p ≤ 0.001; **** = p ≤ 0.0001).
| aldh7a1 | daam 2 | esr1 | sost | creb3l1 | ifitm 5 | mbtps2 | sec24d | serpinf1 | sparc | |
|---|---|---|---|---|---|---|---|---|---|---|
| Osteoblast-positive surface area total head | ||||||||||
| 7 dpf | ns | ns | (+)* | ns | ns | ns | ns | ns | ns | ns |
| 14 dpf | ns | ns | (+)*** | ns | ns | (+)** | ns | ns | ns | ns |
| Osteoblast-positive surface area operculum 14 dpf | ns | ns | (+)*** | ns | ns | (+)** | ns | ns | (+)** | (+)* |
| Mineralized surface area total head | ||||||||||
| 7 dpf | (–)* | ns | ns | ns | ns | ns | ns | (–)**** | ns | ns |
| 14 dpf | (–)* | ns | ns | ns | ns | ns | ns | ns | ns | ns |
| Mineralized surface area notochord tip | ||||||||||
| 7 dpf | ns | ns | ns | ns | (+)* | (+)* | ns | (+)* | ns | ns |
| 14 dpf | ns | ns | (+)** | ns | ns | (+)* | ns | ns | ns | ns |
| Mineralized surface area operculum 14 dpf | ns | ns | ns | ns | ns | ns | ns | (–)** | ns | ns |
| Number of mineralized vertebrae 14 dpf | ns | ns | ns | ns | ns | ns | ns | (–)** | ns | ns |
| runx2 expression | ||||||||||
| 7 dpf | ns | ns | ns | ns | ns | ns | ns | ns | ns | ns |
| 14 dpf | ns | ns | ns | ns | ns | ns | ns | ns | ns | ns |
| sp7 expression | ||||||||||
| 7 dpf | ns | ns | ns | ns | ns | ns | ns | ns | ns | (+)*** |
| 14 dpf | ns | (+)* | (–)* | ns | ns | ns | ns | (+)* | ns | ns |
| bglap expression | ||||||||||
| 7 dpf | (–)* | (–)* | (–)* | ns | (–)* | (–)* | ns | (–)** | (–)* | ns |
| 14 dpf | (–)*** | (–)** | (–)** | ns | (–)** | ns | ns | ns | ns | ns |
| col1a1a expression | ||||||||||
| 7 dpf | (+)*** | (+)* | (+)* | ns | ns | ns | ns | (+)* | ns | ns |
| 14 dpf | ns | (+)**** | ns | (+)*** | (+)*** | (+)* | (+)**** | (+)* | ns | |
| Standard length 90 dpf | ns | ns | ns | ns | ns | ns | ns | ns | ||
| Head size 90 dpf | ns | ns | ns | ns | ns | ns | ns | ns | ||
| Diameter eye 90 dpf | ns | ns | ns | ns | ns | ns | ns | ns | ||
| Centrum volume 90 dpf | (+)* | ns | ns | ns | ns | ns | ns | ns | ||
| Centrum TMD 90 dpf | (+)* | (+)* | (+)* | ns | ns | ns | ns | ns | ||
| Centrum thickness 90 dpf | ns | (+)* | ns | ns | (+)* | (+)* | ns | ns | ||
| Centrum Length 90 dpf | (+)* | ns | ns | ns | ns | ns | ns | ns | ||
Key resources table
| Reagent type (species) or resource | Designation | Source or reference | Identifiers | Additional information |
|---|---|---|---|---|
| Genetic reagent (Danio rerio) | osx:Kaede transgenic line | Zebrafish Facility Ghent (ZFG) Core Facility | NA | NA |
| Commercial assay or kit | RNeasy Mini Kit 250 reagentia | Qiagen | 74106 | NA |
| Commercial assay or kit | iScript cDNA Synthesis Kit | Bio-rad | 1708891 | NA |
| Commercial assay or kit | SsoAdvanced Universal SYBR Green Supermix | Bio-rad | 172–5274 | NA |
| Other | Alizarin red S staining | Merck life sience bv | A5533-25G | NA |
Additional files
-
Supplementary file 1
Supplementary material: detailed information on human and mouse mutations, off-target effects, and sequences for genotyping and qPCR analysis.
(a) Overview of selected genes for crispant analysis, with reported mutations and/or polymorphisms associated with skeletal and non-skeletal phenotypes in human, mice and zebrafish. The conservation between human and zebrafish is reported in the last column. The first four genes are associated with the pathogenesis of osteoporosis, while the last six are linked to osteogenesis imperfecta. (b) Assessment of off-target effects in crispants. Genes that are possibly targeted by the selected crRNA for each of the crispants are called ‘off-target genes’ in this table (mm=number of mismatches). The top 3 ranked off-target effects, selected based on a high CFD (cutting frequency determination) score, are listed, together with their chromosomal position, forward and reverse primer for amplification, the CFD (cutting frequency determination) score and the off-target percentage, based on NGS analysis of a pool of DNA of 1-day old crispants (n=10). (c) Crispant genotyping. Crispant genes with crRNA sequence, forward and reverse primers and assay specifications for Next-generation sequencing (NGS) are listed in this table. The first four genes are associated with the pathogenesis of osteoporosis, while the last six are linked to osteogenesis imperfecta. Primers are designed using Primer3 (https://primer3.ut.ee). (d) qPCR primers. Skeletal marker genes and reference genes with forward and reverse primers are listed in this table. Primers are designed using NCBI PrimerBlast (https://www.ncbi.nlm.nih.gov/tools/primer-blast).
- https://cdn.elifesciences.org/articles/100060/elife-100060-supp1-v2.docx
-
MDAR checklist
- https://cdn.elifesciences.org/articles/100060/elife-100060-mdarchecklist1-v2.docx
Download links
A two-part list of links to download the article, or parts of the article, in various formats.
Downloads (link to download the article as PDF)
Open citations (links to open the citations from this article in various online reference manager services)
Cite this article (links to download the citations from this article in formats compatible with various reference manager tools)
Crispant analysis in zebrafish as a tool for rapid functional screening of disease-causing genes for bone fragility
eLife 13:RP100060.
https://doi.org/10.7554/eLife.100060.3


