Contraction-induced endocardial id2b plays a dual role in regulating myocardial contractility and valve formation
- Department of Cardiology, Center for Genetic Medicine, The Fourth Affiliated Hospital of School of Medicine, and International School of Medicine, International Institutes of Medicine, Zhejiang University, China
- Division of Medical Genetics and Genomics, The Children's Hospital, Zhejiang University School of Medicine, National Clinical Research Center for Child Health, China
- Institute of Genetics, Zhejiang University School of Medicine, China
- TaiKang Medical School (School of Basic Medical Sciences), Wuhan University, China
- Hubei Provincial Key Laboratory of Developmentally Originated Disease, China
- Department of Biophysics, and Kidney Disease Center of the First Affiliated Hospital, Zhejiang University School of Medicine, China
- Liangzhu Laboratory, Zhejiang University Medical Center, China
- Zhejiang Provincial Key Laboratory for Cancer Molecular Cell Biology, Life Sciences Institute, Zhejiang University, China
Figures
Figure 1
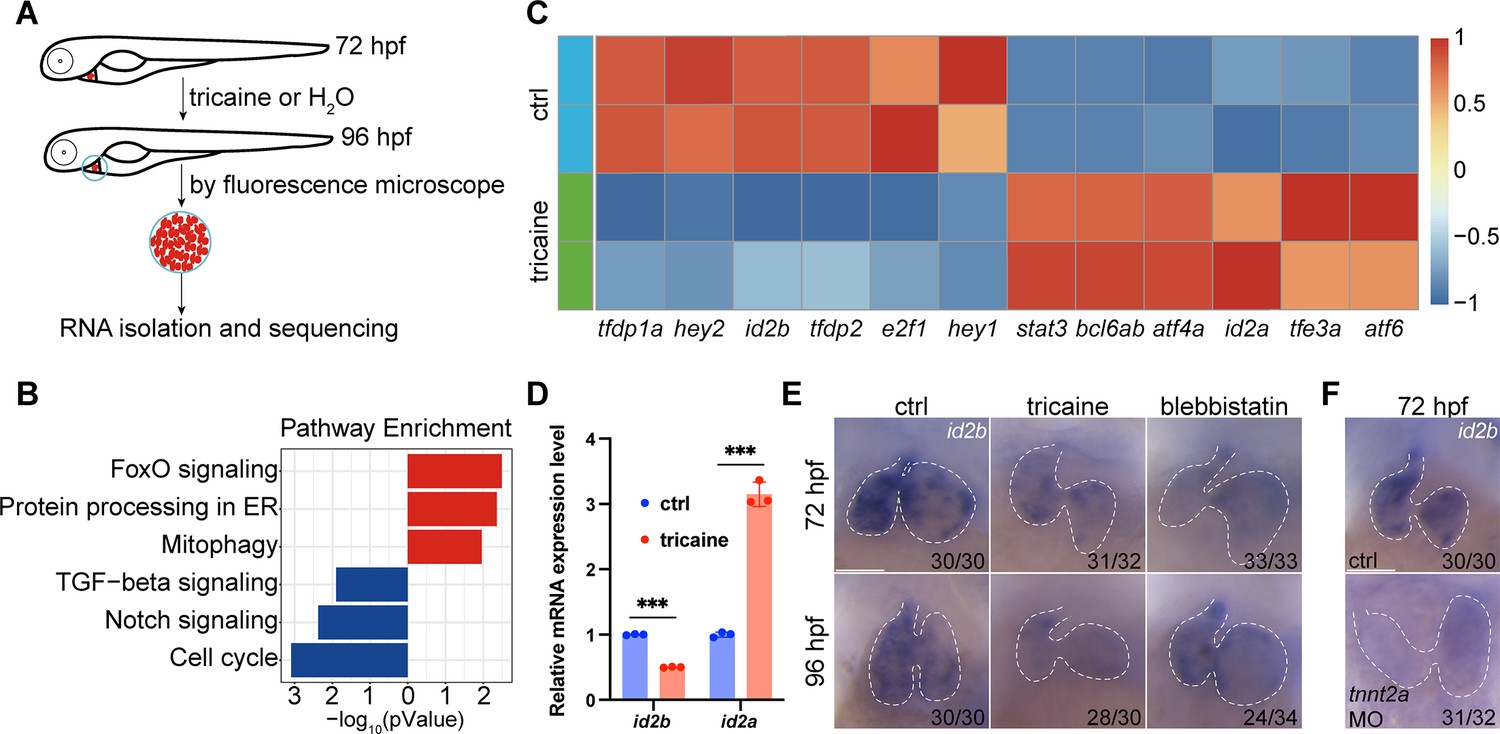
Identification of id2b as a blood flow-sensitive gene.
(A) Schematic showing the experimental procedures, including treatment, heart collection, and RNA-sequencing of zebrafish embryonic hearts. (B) KEGG enrichment analysis depicting differentially expressed genes encoding transcription factors and transcriptional regulators between control (ctrl) and tricaine-treated embryonic hearts. Red and blue rectangles represent upregulated and downregulated gene sets, respectively. |log2fold change|≥0.585, adjusted p-value<0.1. Each replicate contains approximately 1000 hearts. (C) Heatmap exhibiting representative genes from KEGG pathways mentioned in (B). (D) Quantitative real-time PCR (qRT-PCR) analysis of id2b and id2a mRNA in control and tricaine-treated embryonic hearts. Data were normalized to the expression of actb1. Each sample contains ~1000 embryonic hearts. N=3 biological replicates. (E) In situ hybridization of id2b in 72 hr post-fertilization (hpf) and 96 hpf ctrl, tricaine (1 mg/mL), and blebbistatin (10 μM)-treated embryos. Numbers at the bottom of each panel indicate the ratio of representative staining. (F) In situ hybridization showing reduced id2b expression in tnnt2a morpholino-injected embryos at 72 hpf compared to control. Data are presented as mean ± s.e.m. Unpaired two-tailed Student’s t-tests were used to determine statistical significance. ***p<0.001. Scale bars, 50 μm.
Figure 2
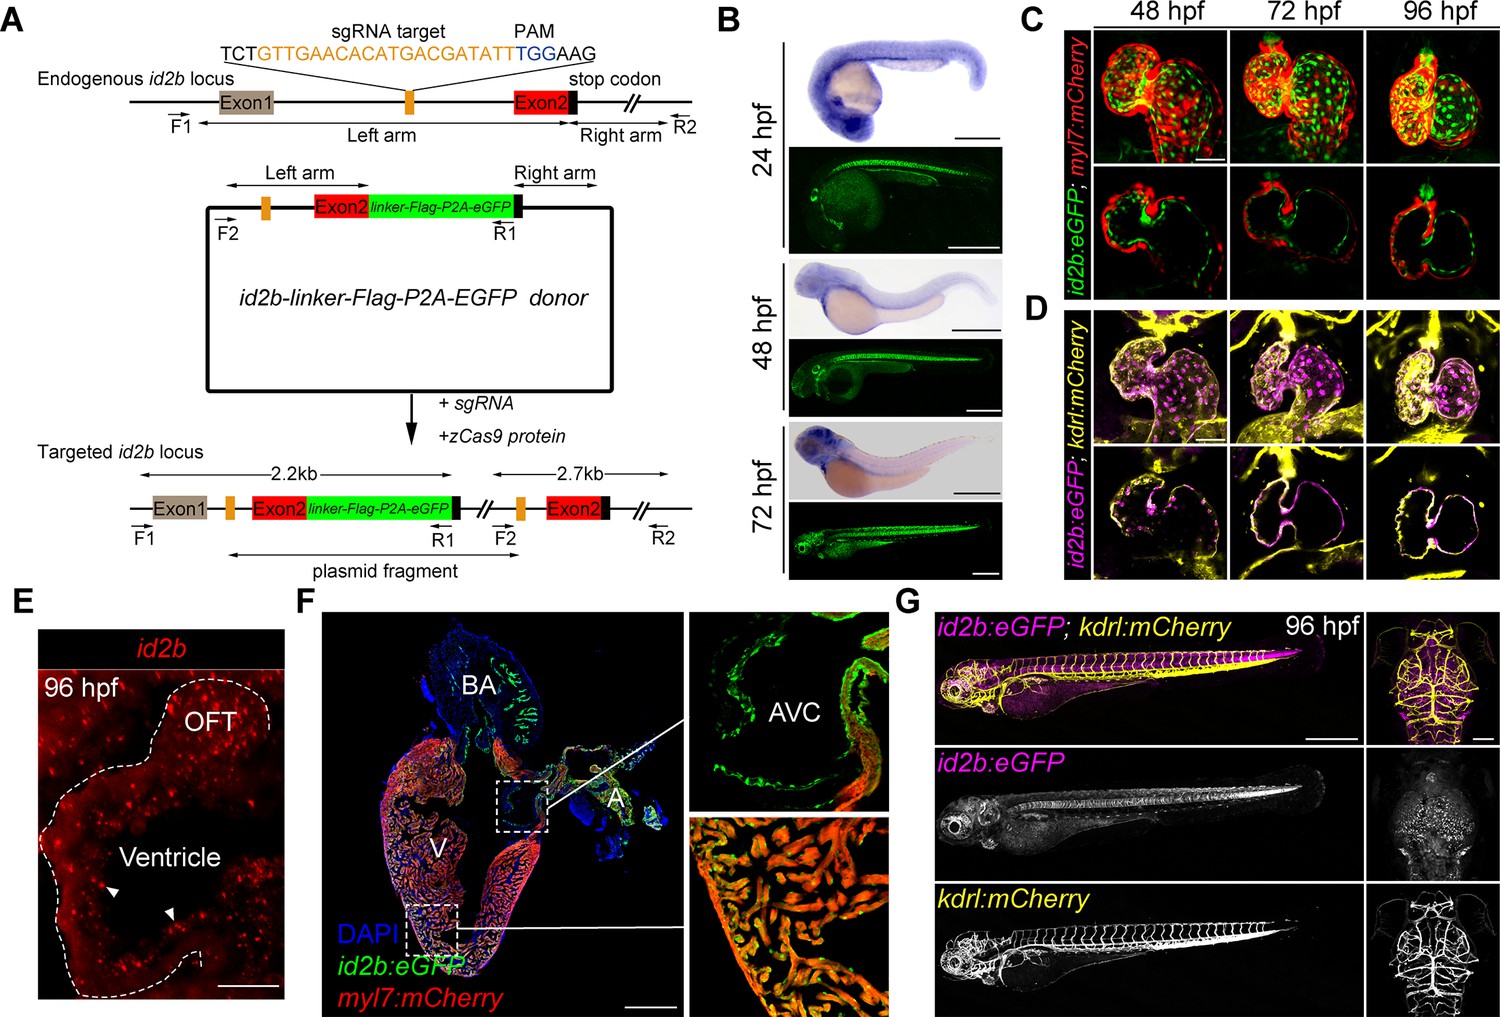
The spatiotemporal expression of id2b.
(A) Schematic of the intron targeting-mediated eGFP knock-in at the id2b locus using the CRISPR-Cas9 system. The sgRNA targeting sequence and the protospacer adjacent motif (PAM) sequence are shown in orange and blue, respectively. The donor plasmid comprises left and right arm sequences and a linker-FLAG-P2A-eGFP cassette denoted by black lines with double arrows and green box, respectively. The linker-FLAG-P2A-eGFP cassette was integrated into the id2b locus upon co-injection of the donor plasmid with sgRNA and zCas9 protein, enabling detection by PCR using two pairs of primers (F1, R1 and F2, R2) - the former length yielding a length of about 2.2 kb and the latter about 2.7 kb. (B) Zebrafish id2b expression pattern, as indicated by in situ hybridization of embryos at designated time points, was consistent with the fluorescence localization of id2b:eGFP, revealing expression in the heart, brain, retina, notochord, pronephric duct, and other tissues. (C) Maximum intensity projections (top) and confocal sections (bottom) of id2b:eGFP; Tg(myl7:mCherry) hearts at designated time points. (D) Maximum intensity projections (top) and confocal sections (bottom) of id2b:eGFP; Tg(kdrl:mCherry) embryos at specific time points. Magenta, id2b:eGFP; yellow, kdrl:mCherry. (E) RNAscope analysis of id2b in 96 hr post-fertilization (hpf) embryonic heart. White dashed line outlines the heart. OFT, outflow tract. (F) Immunofluorescence of adult id2b:eGFP; Tg(myl7:mCherry) heart section (left panel). Enlarged views of boxed areas are shown in the right panel. Green, eGFP; red, mCherry; blue, DAPI. BA, bulbus arteriosus; V, ventricle; A, atrium; AVC, atrioventricular canal. (G) Confocal z-stack maximum intensity projection of id2b:eGFP;Tg(kdrl:mCherry) embryos at 96 hpf showing the whole body (lateral view) and the head (top view). Scale bars, 500 μm (B, F, left, and G), 50 μm (C and D), 25 μm (E), 100 μm (G, right).
Figure 3 with 1 supplement
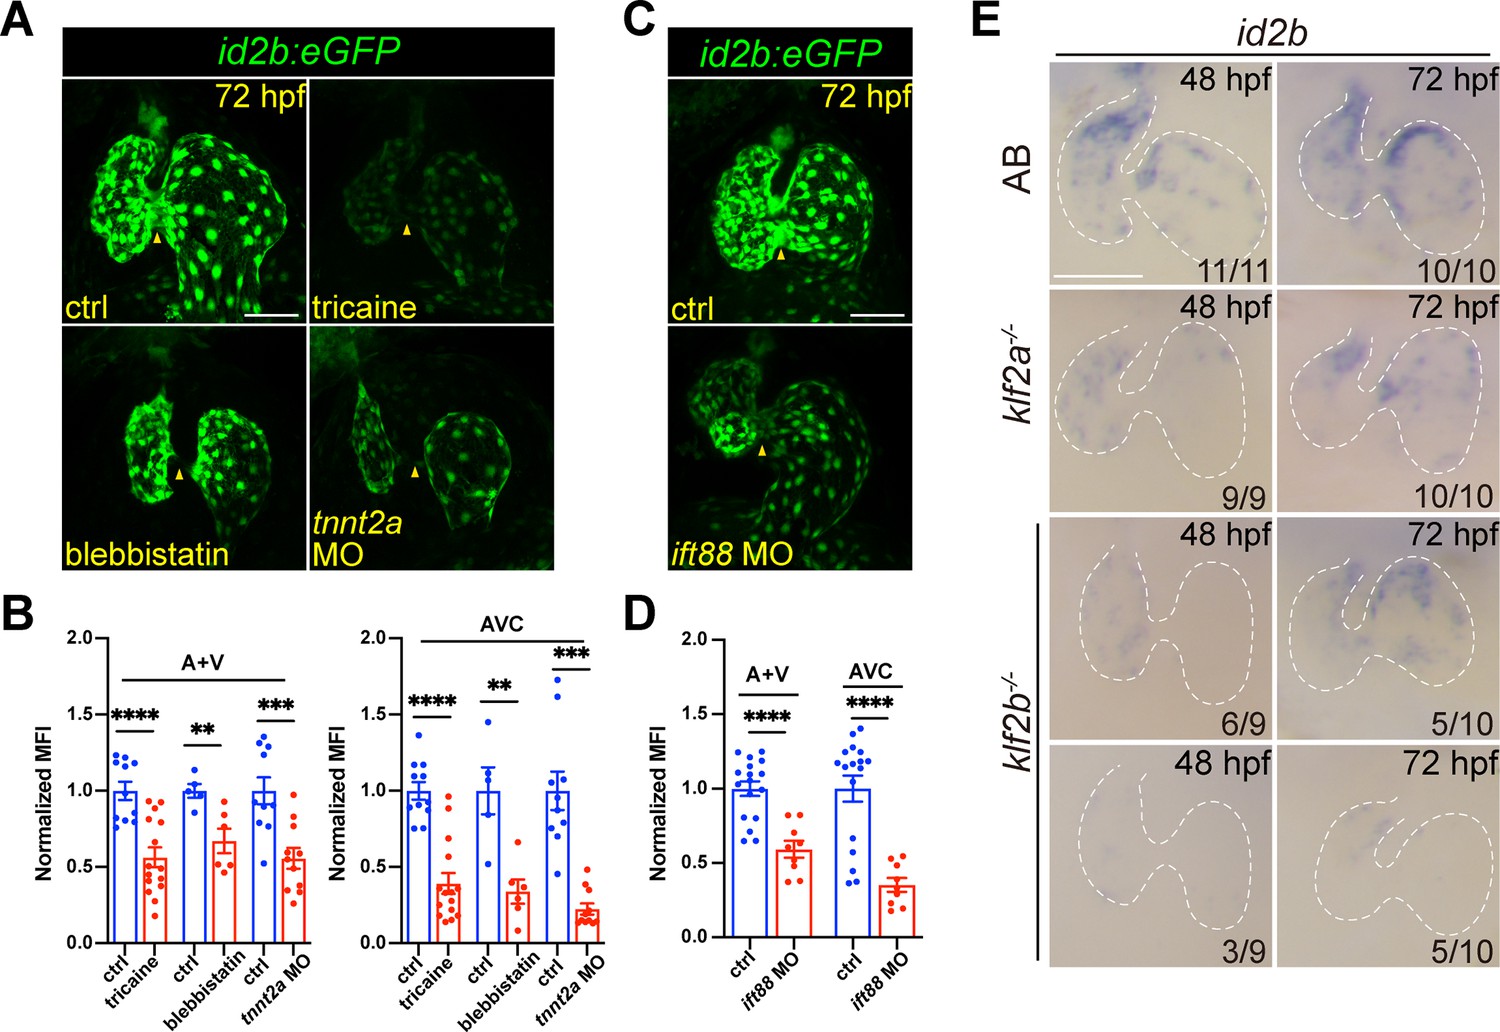
Cardiac contraction promotes endocardial id2b expression through primary cilia.
(A) Representative confocal z-stack (maximal intensity projection) of id2b:eGFP embryos under different conditions: control, tricaine-treated, blebbistatin-treated, and tnnt2a morpholino-injected. Images were captured using the same magnification. (B) Quantification of mean fluorescence intensity (MFI) of id2b:eGFP in the working myocardium (atrium and ventricle, A+V) and atrioventricular canal (AVC) in (A). Data normalized to the MFI of control hearts. n=(11, 15) (ctrl versus tricaine); n=(5, 6) (ctrl versus blebbistatin); n=(10,11) (ctrl versus tnnt2a MO). (C) Representative confocal z-stack (maximal intensity projection) of control and ift88 morpholino-injected id2b:eGFP embryos. (D) Normalized MFI of id2b:eGFP in the working myocardium (A+V) and AVC in (C). n=(17, 9). (E) Whole-mount in situ hybridization showing id2b expression in control, klf2a-/-, and klf2b-/- embryos at 48 hr post-fertilization (hpf) and 72 hpf. Numbers at the bottom of each panel indicate the ratio of representative staining. Data are presented as mean ± s.e.m. Unpaired two-tailed Student’s t-tests were used to determine statistical significance. **p<0.01, ***p<0.001, ****p<0.0001. Scale bars, 50 μm.
Figure 3—figure supplement 1
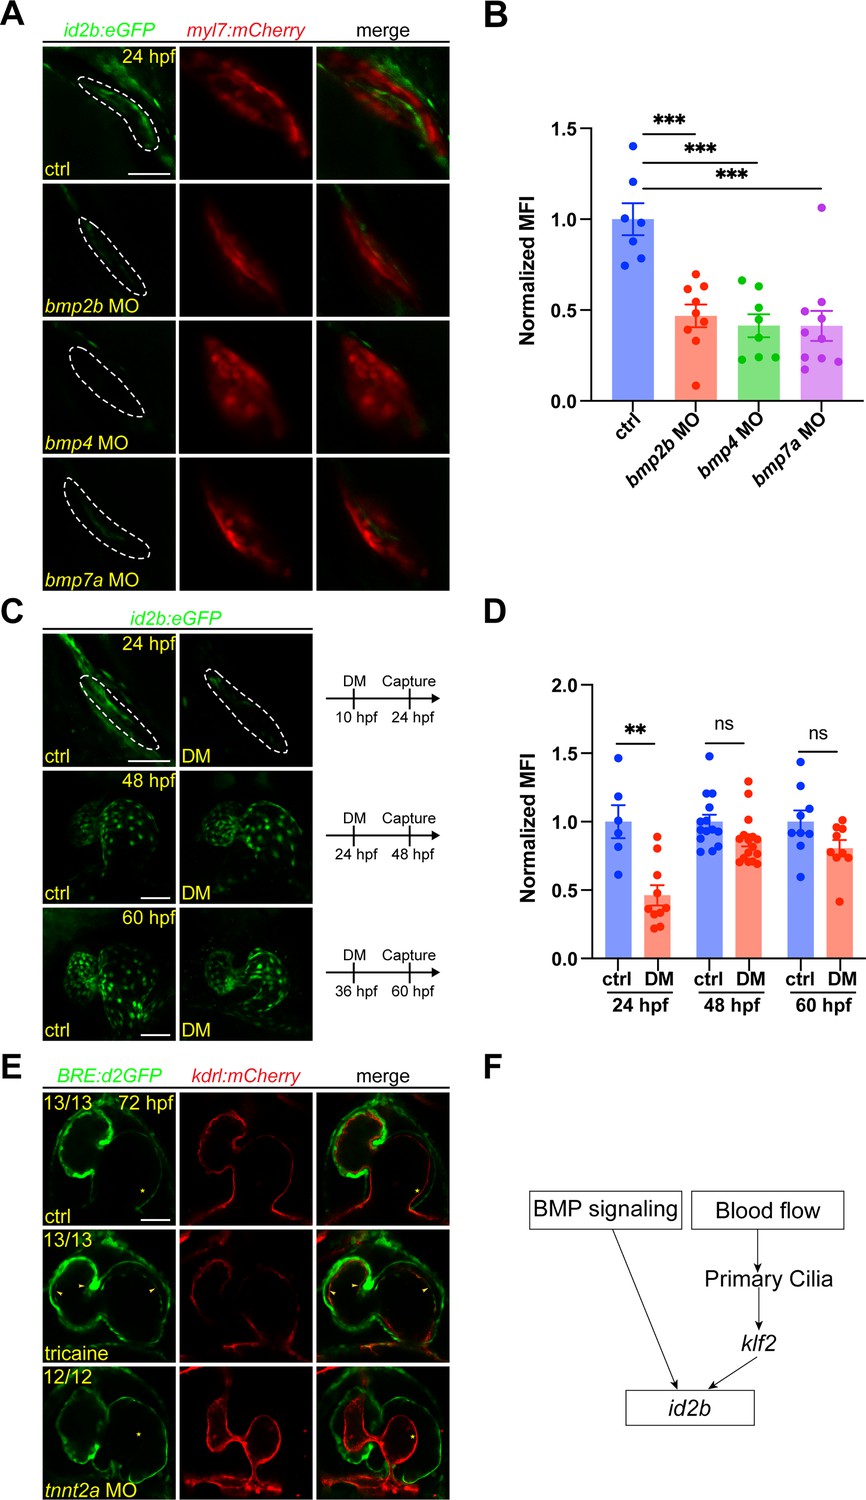
Blood flow and bone morphogenetic protein (BMP) signaling independently activates id2b expression.
(A) Representative confocal maximal intensity projection of control (non-injected), bmp2b, bmp4, and bmp7a morpholino-injected id2b:eGFP; Tg(myl7:mCherry) hearts at 24 hr post-fertilization (hpf). White circles outline eGFP signal. (B) Quantification of mean fluorescence intensity of id2b:eGFP in (A). Data normalized to the mean fluorescence intensity of control hearts. n=(7, 9, 8, 10). (C) Representative confocal maximal intensity projection of DMSO and Dorsomorphin (DM)-treated id2b:eGFP hearts at 24, 48, and 60 hpf. Embryos were treated from 10 to 24 hpf, from 24 to 48 hpf, or from 36 to 60 hpf. White circles outline eGFP signal. (D) Quantification of mean fluorescence intensity of id2b:eGFP in (C). Data normalized to the mean fluorescence intensity of DMSO-treated hearts. n=(6, 10) (24 hpf); n=(14, 16) (48 hpf); n=(9, 9) (60 hpf). (E) Confocal optical sections of control, tricaine-treated, and tnnt2a morpholino-injected 72 hpf Tg(BRE:d2GFP); Tg(kdrl:mCherry) hearts. Yellow asterisks, endocardial cells. Yellow arrowheads, BMP signal. Numbers at the top of each panel indicate the ratio of representative images. (F) Schematic diagram of blood flow and BMP signaling-mediated id2b expression. Data are presented as mean ± s.e.m. Unpaired two-tailed Student’s t-tests were used to determine statistical significance.**p<0.01, ***p<0.001. ns, not significant. Scale bars, 50 μm.
Figure 4 with 1 supplement
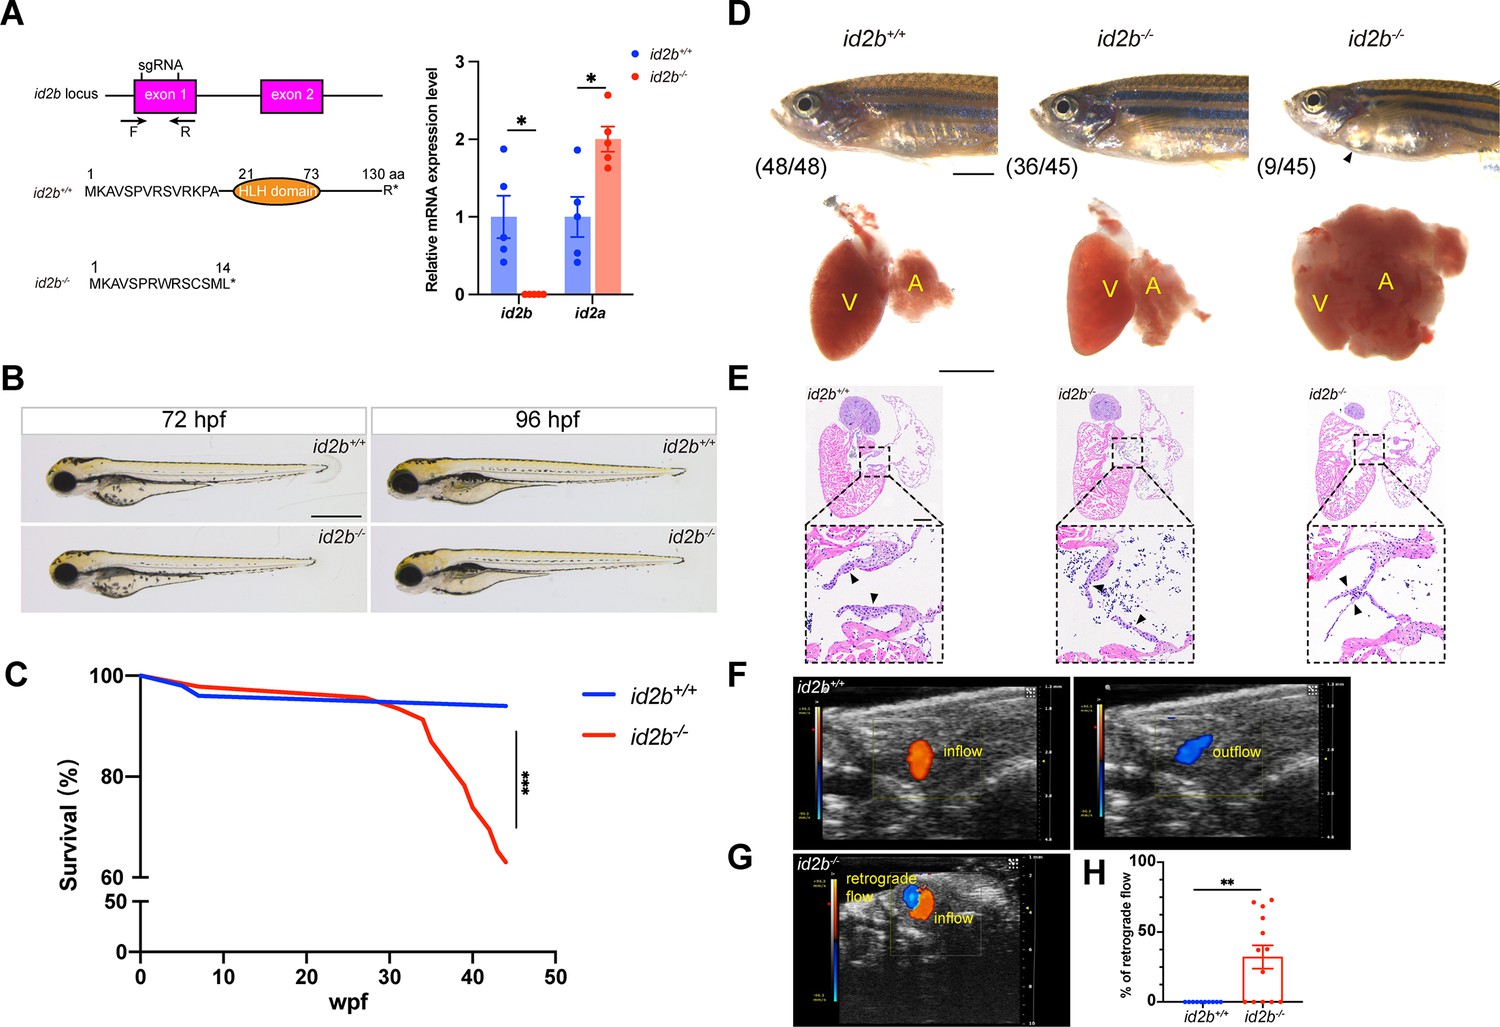
id2b-/- adults exhibit thinner atrioventricular valve leaflets and prominent retrograde blood flow.
(A) Two sgRNAs, represented by short vertical lines, were designed to create id2b-/- mutants. Co-injection of the two sgRNAs with zCas9 protein induces a 157 bp truncation in the exon 1 of id2b, which can be detected by genotyping primers marked with arrows. This genetic modification leads to the formation of a premature stop codon and the subsequent loss of the helix-loop-helix (HLH) domain. Right, quantitative real-time PCR (qRT-PCR) analysis of id2b and id2a mRNA levels in id2b+/+ and id2b-/- adult hearts. (B) No discernible morphological differences were observed between id2b+/+ and id2b-/- larvae at both 72 hr post-fertilization (hpf) and 96 hpf. (C) Kaplan-Meier survival curve analysis and log-rank test of id2b+/+ (n=50) and id2b-/- (n=46). Wpf, weeks post-fertilization. (D) Pericardial edema and an enlarged atrium are evident in a subset of id2b-/- adults. V, ventricle; A, atrium. (E) id2b-/- adults developed thinner atrioventricular valve leaflets (denoted by arrowheads) compared to id2b+/+. Enlarged views of boxed areas are shown in the bottom panels. (F, G) Echocardiograms of adult id2b+/+ (F) and id2b-/- (G) hearts. Unidirectional blood flow was observed in the id2b+/+ heart, while retrograde blood flow was evident in the id2b-/- heart. (H) Ratio of retrograde flow area over inflow area shows a significant increase in retrograde flow in id2b-/- (n=13) compared to id2b+/+ (n=10). Data are presented as mean ± s.e.m. Unpaired two-tailed Student’s t-tests were used to determine statistical significance. *p<0.05, **p<0.01, ***p<0.001. Scale bars, 500 μm (B and D, bottom), 2 mm (D, top), 200 μm (E).
Figure 4—figure supplement 1
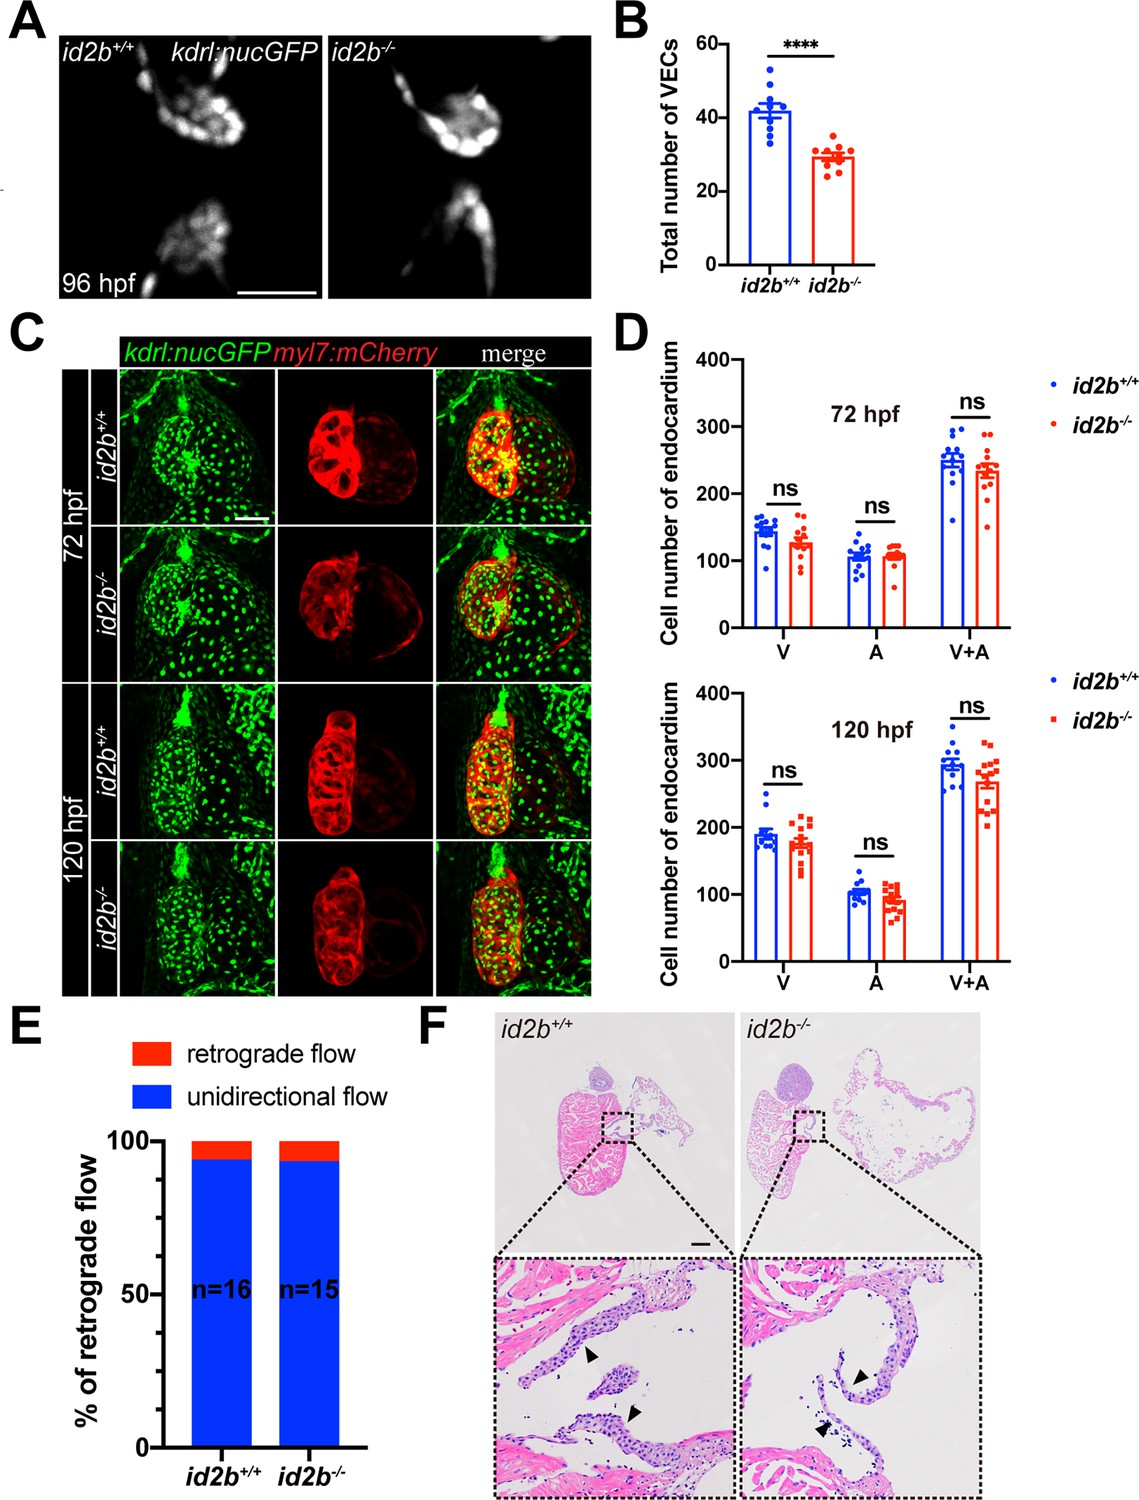
id2b-/- larvae exhibit a decreased number of valve endocardial cells while maintaining normal atrioventricular valve function.
(A) Representative confocal images of valve endocardial cells in 96 hr post-fertilization (hpf) id2b+/+ and id2b-/- hearts carrying Tg(kdrl:nucGFP). (B) Quantification of the number of valve endocardial cells in id2b+/+ and id2b-/- hearts. VECs, valve endocardial cells. n=(10, 10). (C) Representative confocal images of 72 and 120 hpf id2b+/+ and id2b-/- hearts in Tg(kdrl:nucGFP); Tg(myl7:mCherry) transgenic background. (D) Statistical analysis of the number of endocardial cells in the ventricle (V), atrium (A), and combined (A+V) in id2b+/+ and id2b-/- hearts. n=(13, 13) (72 hpf); n=(12, 15) (120 hpf). (E) Quantification of blood flow patterns in 96 hpf id2b+/+ (n=16) and id2b-/- (n=15) hearts. (F) Hematoxylin and eosin (HE) staining of adult id2b-/- and id2b+/+ hearts after echocardiographic analysis in Figure 4F and G. Enlarged views of boxed areas are shown in the bottom panels. Data are presented as mean ± s.e.m. p-values were calculated by unpaired two-tailed Student’s t-tests. ****p<0.0001. ns, not significant. Scale bars, 20 μm (A), 50 μm (C), 200 μm (F).
Figure 5 with 2 supplements
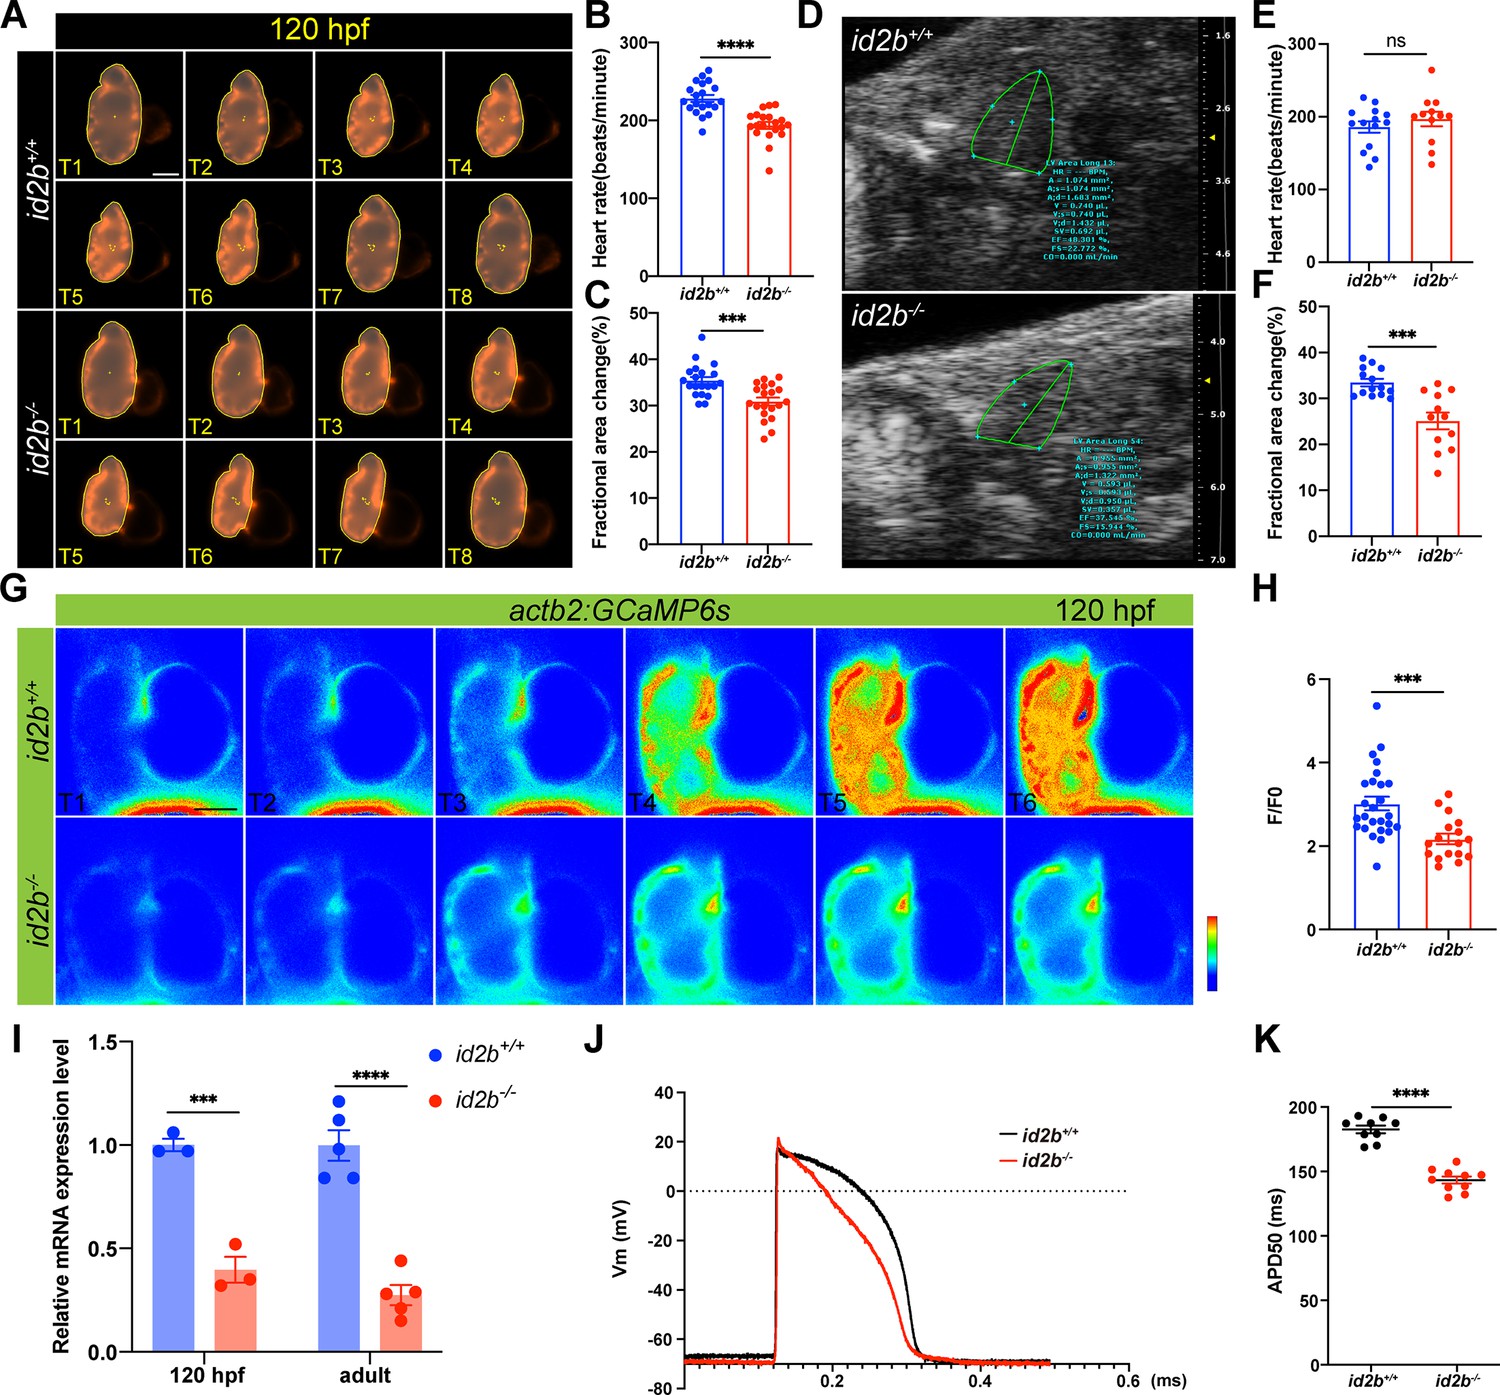
Reduced cardiac contractile function and compromised calcium handling in id2b-/- mutants.
(A) Time-lapse imaging (from T1 to T8) illustrates the cardiac contraction-relaxation cycle of 120 hr post-fertilization (hpf) id2b+/+ and id2b-/- hearts carrying myl7:mCherry. (B and C) id2b-/- larvae (n=20) display a significant decrease in heart rate and fractional area change compared to id2b+/+ (n=20). (D) Echocardiograms of adult id2b+/+ and id2b-/- hearts. (E and F) id2b-/- fish (n=12) exhibit reduced cardiac contractile function with preserved heart rate compared to id2b+/+ (n=14). (G) Time-lapse imaging illustrates the calcium dynamics of 120 hpf id2b+/+ and id2b-/- hearts carrying actb2:GCaMP6s. (H) Ratio of maximal fluorescence intensity (F) over basal fluorescence intensity (F0) of GCaMP6s signal. n=(26, 17). (I) Quantitative real-time PCR (qRT-PCR) analysis of cacnα1c mRNA in id2b+/+ and id2b-/- hearts at 120 hpf (N=3 biological replicates, with each sample containing 500–1000 embryonic hearts) and adult stage (N=5 biological replicates). Data were normalized to the expression of actb1. (J) The action potential of ventricular cardiomyocytes in adult id2b+/+ (n=9) and id2b-/- (n=9) hearts. (K) Statistical data showed a notable difference between id2b+/+ and id2b-/- accordingly. Data are presented as mean ± s.e.m. p-values were calculated by unpaired two-tailed Student’s t-tests. ***p<0.001, ****p<0.0001, ns, not significant. Scale bars, 50 μm.
Figure 5—figure supplement 1
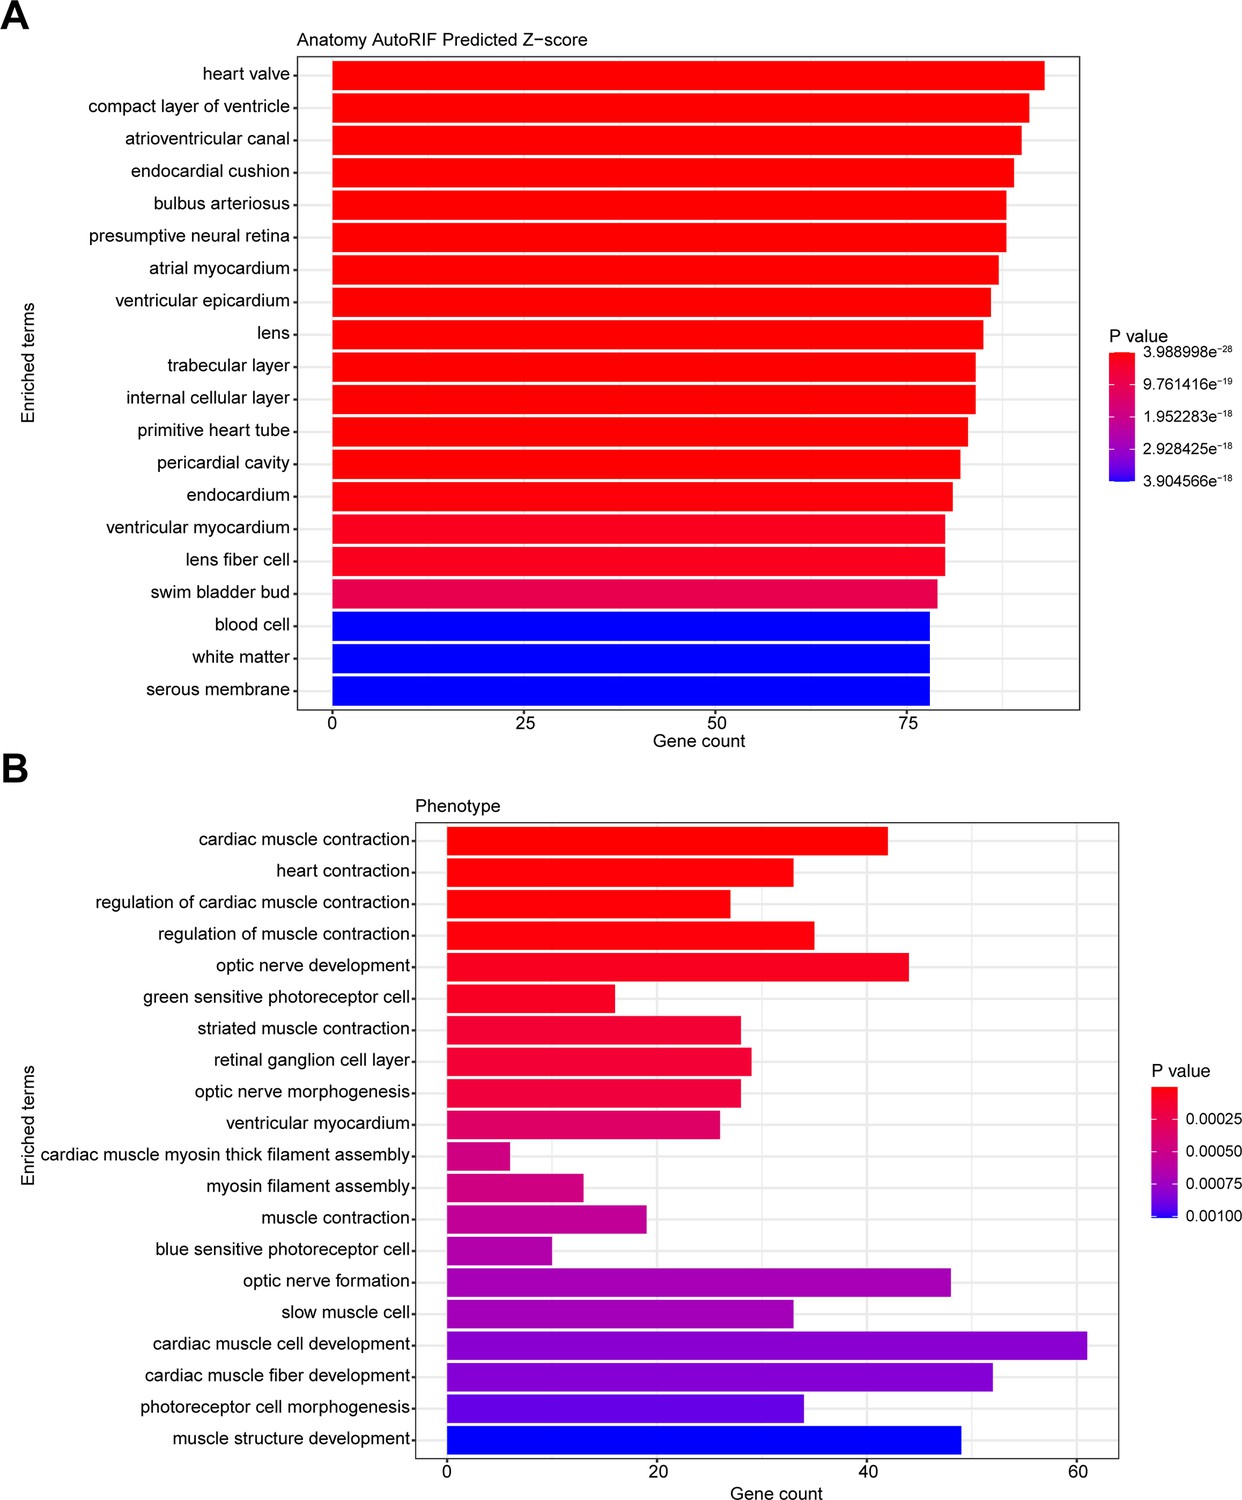
id2b loss-of-function impacts both valve formation and cardiac contraction.
(A) The top 20 predicted tissue expression patterns based on the differentially expressed genes from id2b+/+ and id2b-/- hearts at 120 hr post-fertilization (hpf) were displayed. (B) The top 20 predicted phenotypes related to the differentially expressed genes from id2b+/+ and id2b-/- hearts at 120 hpf were illustrated.
Figure 5—figure supplement 2
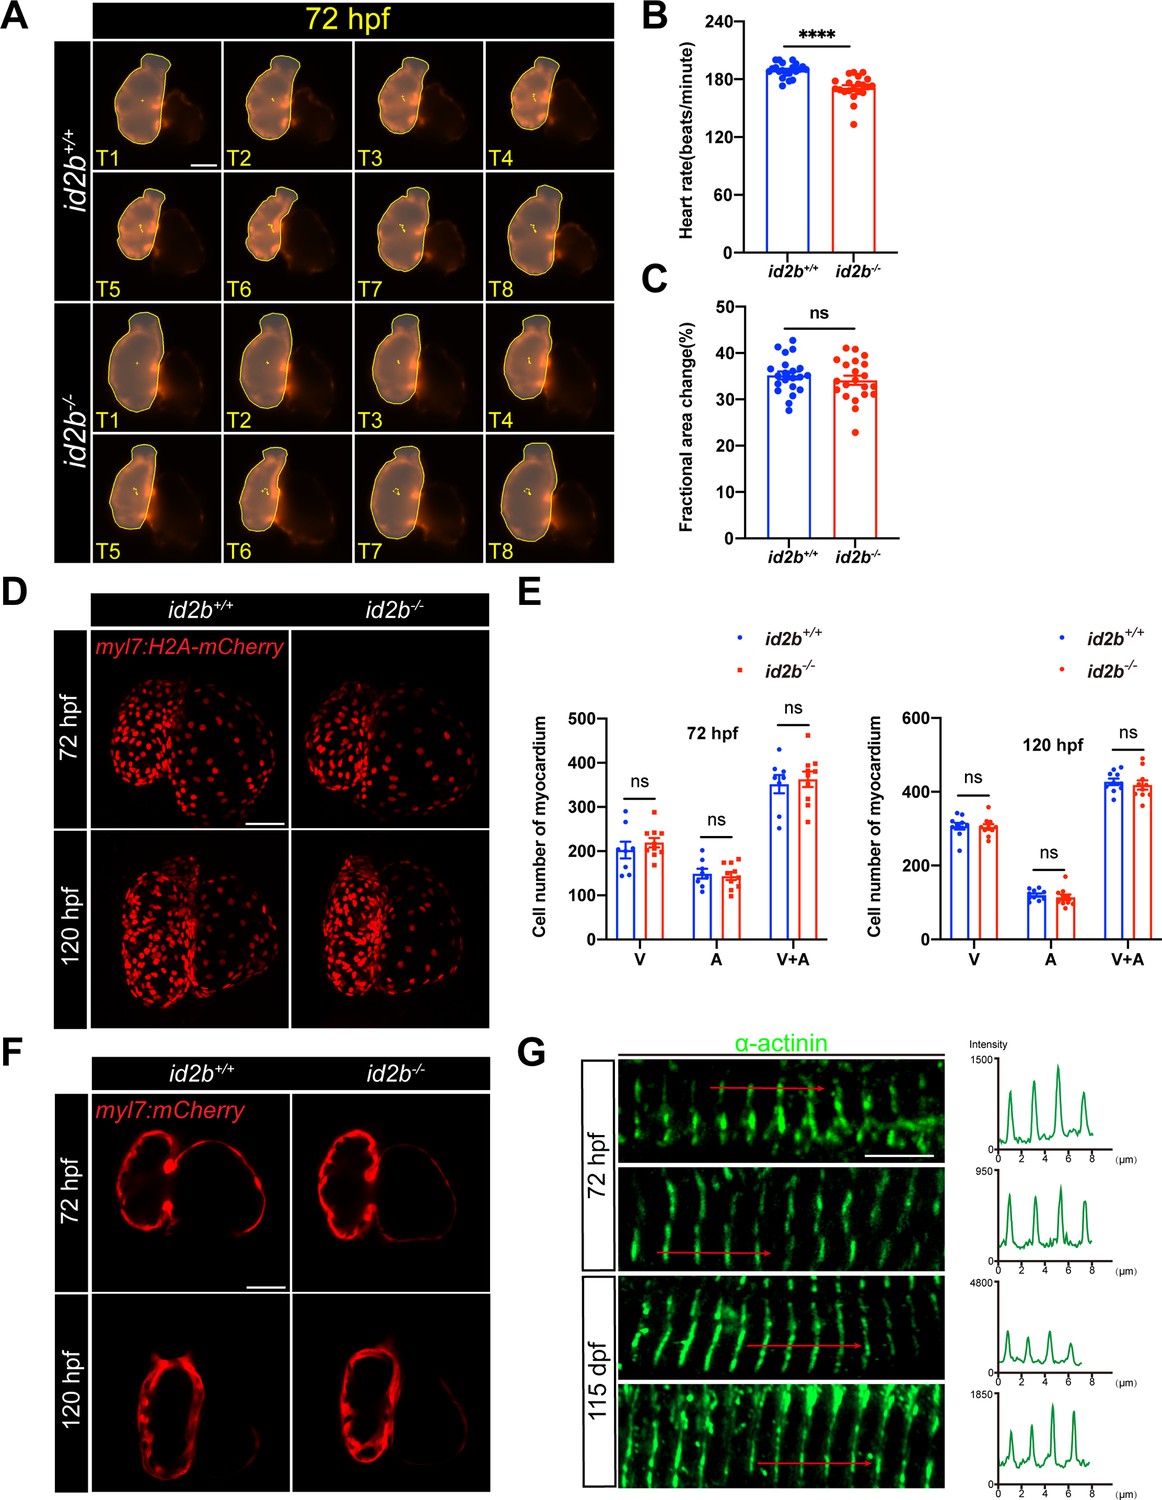
id2b-/- hearts develop normal trabeculae and sarcomeres.
(A) Time-lapse imaging (from T1 to T8) illustrates the cardiac contraction-relaxation cycle of 72 hr post-fertilization (hpf) id2b+/+ and id2b-/- hearts carrying myl7:mCherry. (B and C) Heart rate and fractional area change in id2b-/- (n=21) and id2b+/+ (n=21) at 72 hpf. (D) Representative confocal z-stack of 72 and 120 hpf id2b+/+ and id2b-/- hearts with Tg(myl7:H2A-mCherry) transgene. (E) Quantification of the number of cardiomyocytes in the ventricle (V), atrium (A), and combined (A+V) in (D). n=(8, 10) (72 hpf); n=(10, 10) (120 hpf). (F) Representative confocal images of 72 and 120 hpf id2b+/+ and id2b-/- hearts carrying Tg(myl7:mCherry). (G) Confocal immunofluorescence images of α-actinin (green) in embryonic (72 hpf) and adult (115 dpf) hearts (left). Right: fluorescence intensity profiles for α-actinin. Data are presented as mean ± s.e.m. p-values were calculated by unpaired two-tailed Student’s t-tests. ****p<0.0001. ns, not significant. Scale bars, 50 μm (D and F), 5 μm (G).
Figure 6 with 1 supplement
Nrg1 serves as a pivotal mitogen mediating the function of id2b.
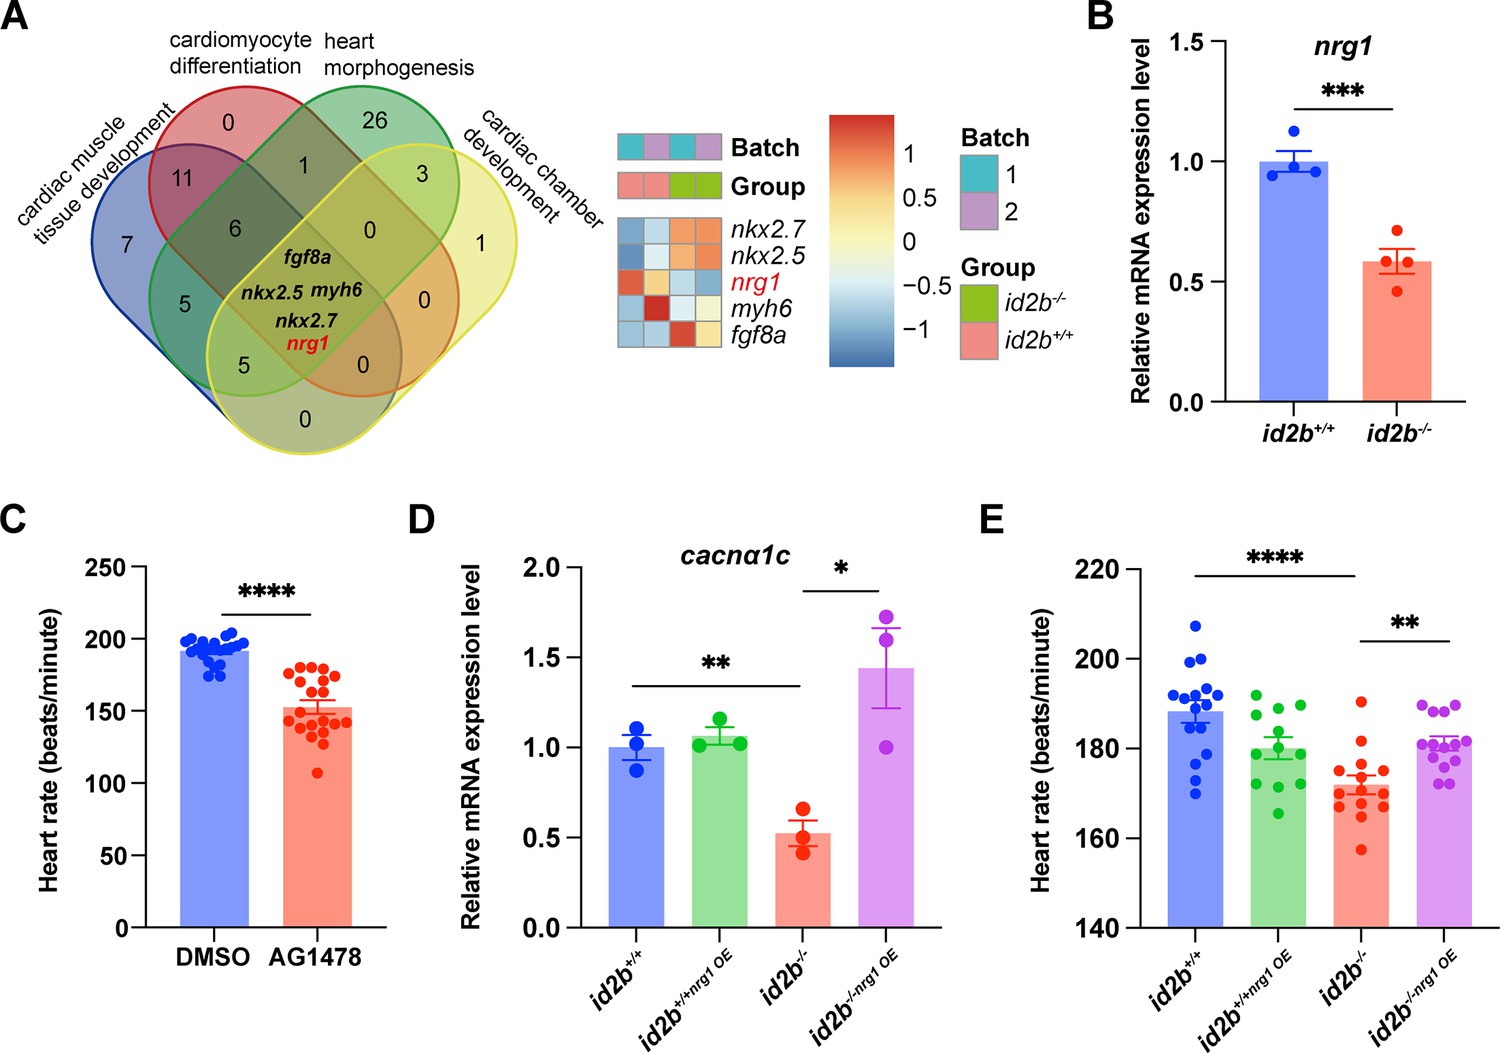
(A) Identification of genes (fgf8a, nkx2.5, myh6, nrg1, and nkx2.7) associated with four distinct heart development processes: cardiac muscle tissue development, cardiomyocyte differentiation, heart morphogenesis, and cardiac chamber development. The heatmap illustrates scaled-normalized expression values for the mentioned genes. (B) Quantitative real-time PCR (qRT-PCR) analysis of nrg1 mRNA in 120 hr post-fertilization (hpf) id2b+/+ and id2b-/- embryonic hearts. Data were normalized to the expression of actb1. N=4 biological replicates, with each sample containing 500–1000 embryonic hearts. (C) Heart rate in 120 hpf larvae treated with AG1478 (n=20) and DMSO (n=20). (D) id2b+/+ and id2b-/- larvae were injected with nrg1 mRNA at the one-cell stage, followed by qRT-PCR analysis of cacnα1c mRNA at 72 hpf. Data were normalized to the expression of actb1. N=3 biological replicates, with each sample containing 100–200 embryonic hearts. (E) The heart rate of 72 hpf id2b+/+ and id2b-/- larvae injected with nrg1 mRNA at one-cell stage. n=(16, 12, 14, 14). Data are presented as mean ± s.e.m. p-values were calculated by unpaired two-tailed Student’s t-tests. *p<0.05, **p<0.01, ***p<0.001, ****p<0.0001.
Figure 6—figure supplement 1
nrg1 is expressed in the endocardial cells.
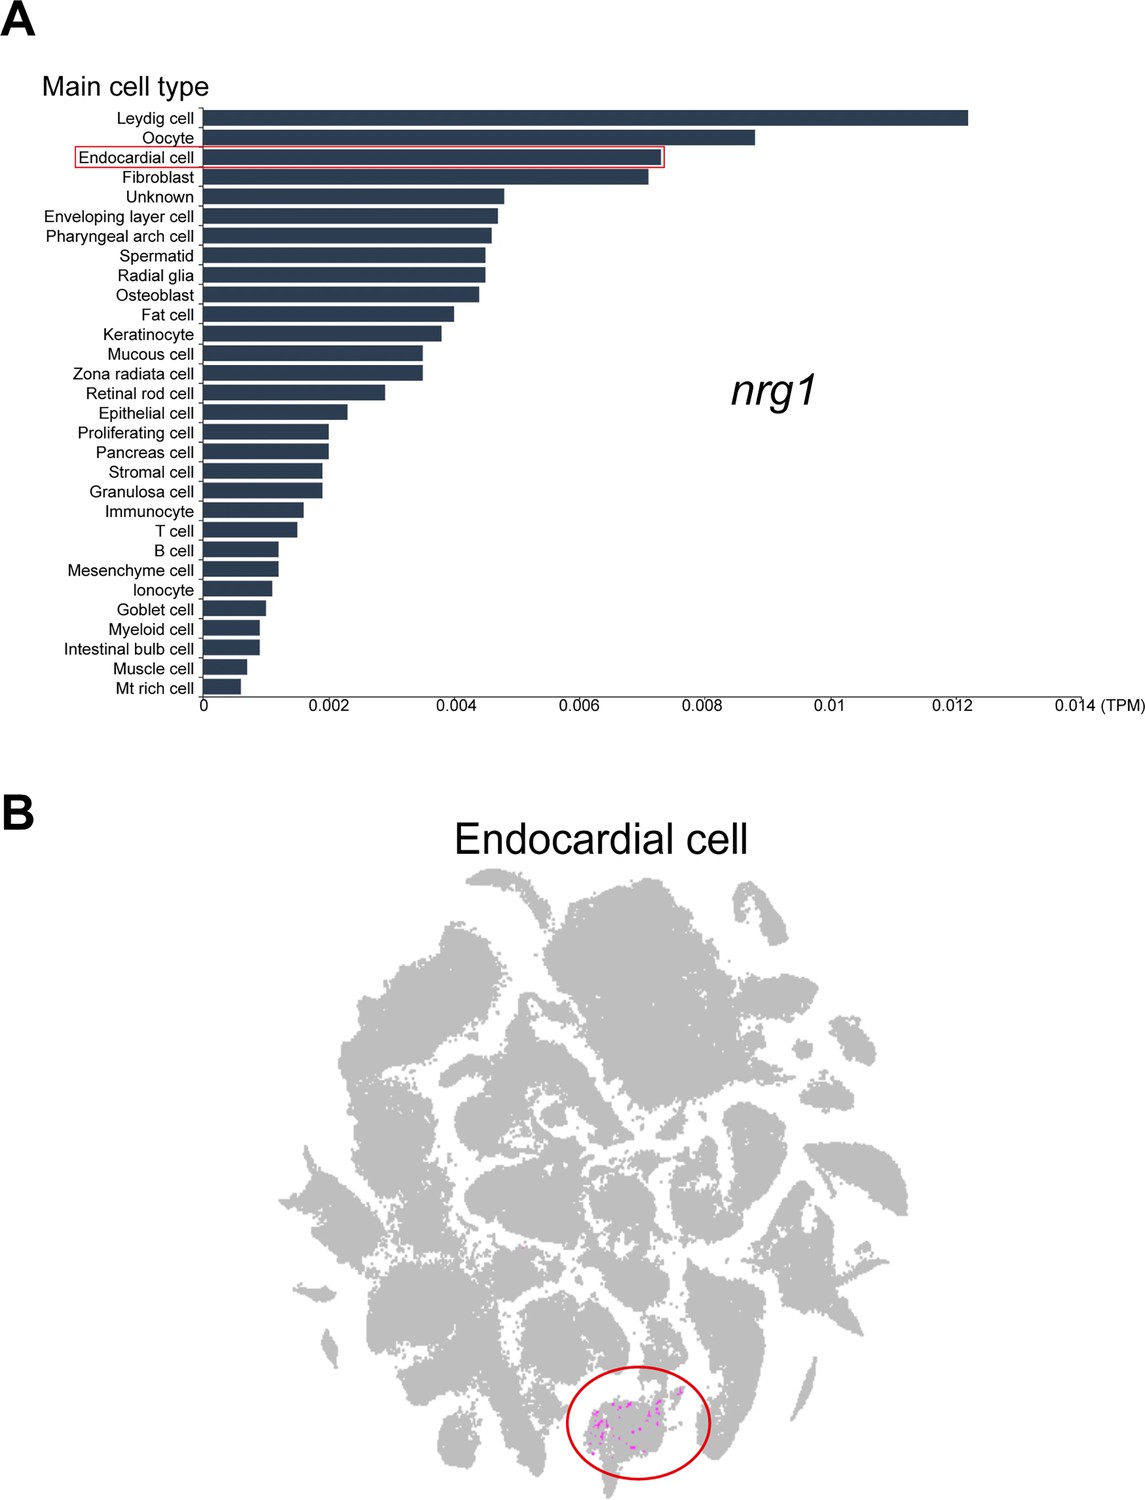
(A) Analysis of nrg1 expression using the zebrafish single-cell landscape database. The red rectangle highlights endocardial cells. (B) Identification of the endocardial cell population in the zebrafish cell landscape. Purple dots represent endocardial cells, and the red oval denotes cell populations from the heart. Images were generated using the Zebrafish Cell Landscape (ZCL) at http://bis.zju.edu.cn/ZCL/.
Figure 7 with 1 supplement
Id2b interacts with Tcf3b to restrict its inhibition on nrg1 expression.
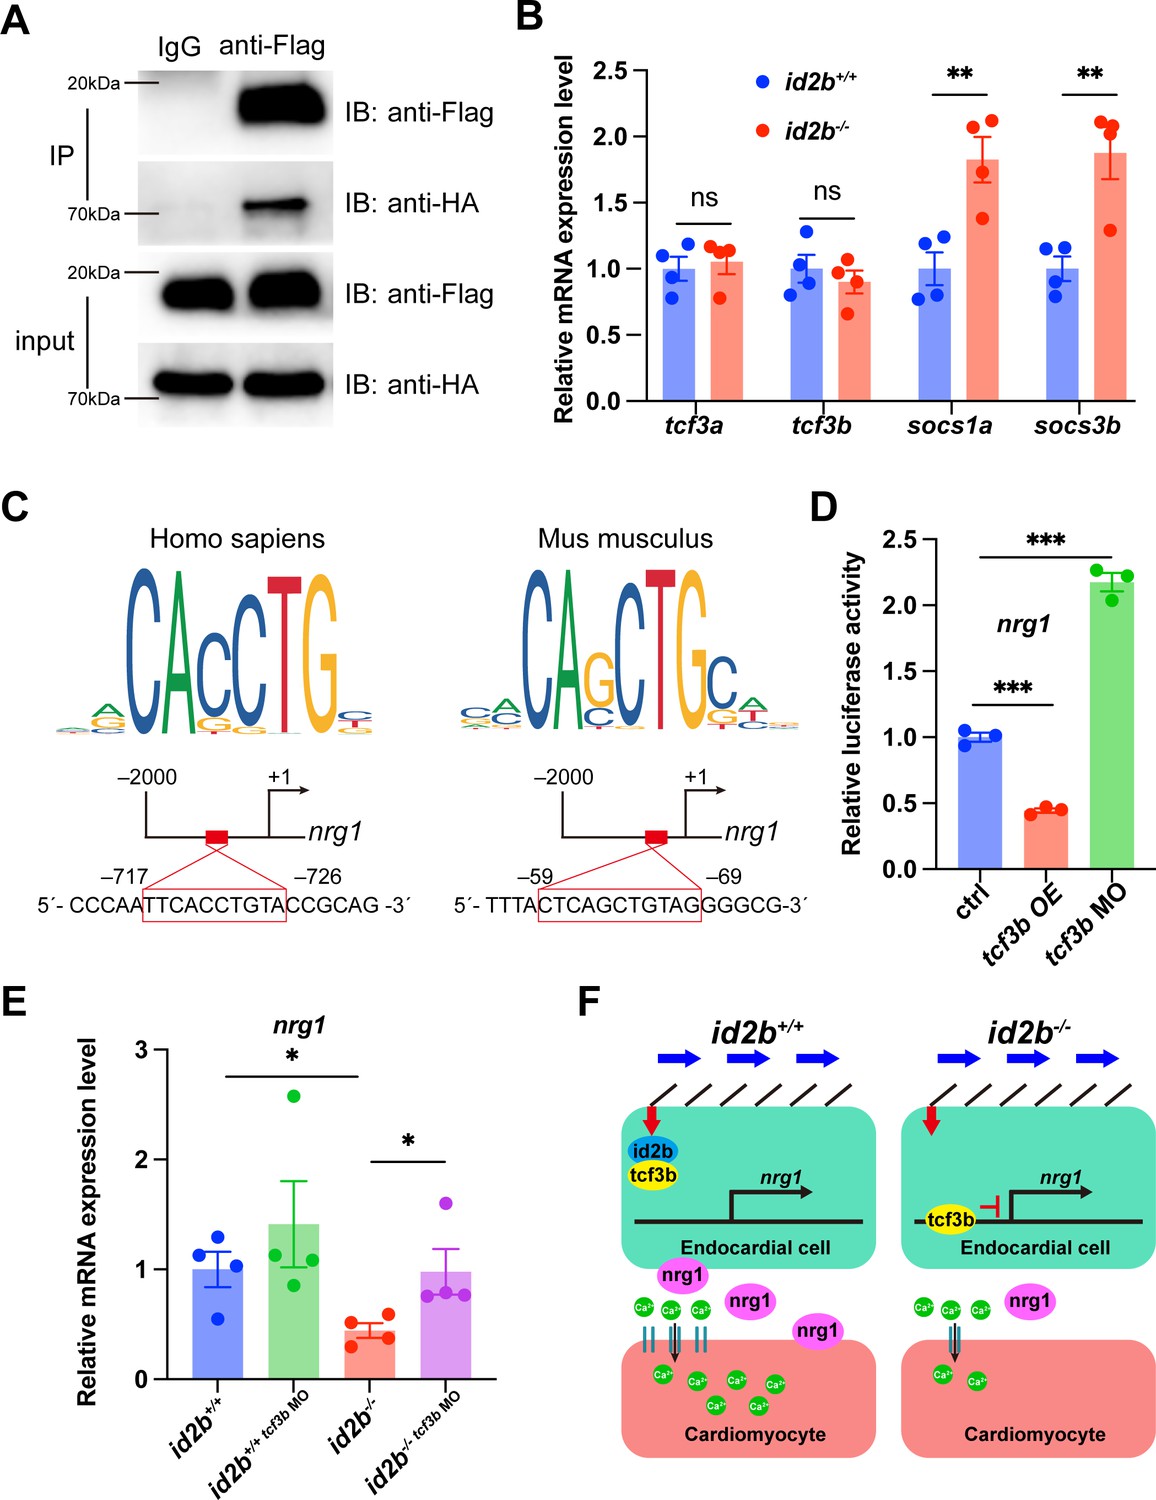
(A) Immunoprecipitation (IP) assays of Flag-id2b and HA-tcf3b co-transfected 293T cells. (B) Quantitative real-time PCR (qRT-PCR) analysis of tcf3a, tcf3b, socs1a, and socs3b mRNA in 120 hr post-fertilization (hpf) id2b+/+ and id2b-/- embryonic hearts. Data were normalized to the expression of actb1. N=4 biological replicates, with each sample containing 500–1000 embryonic hearts. (C) Two potential Tcf3b-binding sites, with sequences corresponding to the human TCF3 (left) and mouse Tcf3 (right) binding motifs, were predicted in the 2000 bp DNA sequence upstream of the zebrafish nrg1 transcription start site using JASPAR. (D) Luciferase assay showing the expression of nrg1 in embryos with tcf3b overexpression (tcf3b OE) and morpholino-mediated tcf3b knockdown (tcf3b MO). N=3 biological replicates. (E) qRT-PCR analysis of nrg1 mRNA in 72 hpf id2b+/+ and id2b-/- embryonic hearts injected with control and tcf3b morpholino. Data were normalized to the expression of actb1. N=4 biological replicates, with each sample containing 100–200 embryonic hearts. (F) Schematic model for id2b-mediated regulation of myocardium function. During heart development, blood flow operates through primary cilia, initiating endocardial id2b expression. Subsequently, the interaction between Id2b and Tcf3b restricts the activity of Tcf3b, ensuring proper nrg1 expression, which in turn promotes L-type calcium channel (LTCC) expression (left). However, in the absence of Id2b, Tcf3b inhibits nrg1 expression. The reduced Nrg1 hinders LTCC expression in cardiomyocytes, resulting in decreased extracellular calcium entry and disruption of myocardial function. Data are presented as mean ± s.e.m. p-values were calculated by unpaired two-tailed Student’s t-tests. *p<0.05, **p<0.01, ***p<0.001. ns, not significant.
-
Figure 7—source data 1
Source data for western blot shown in Figure 7A.
- https://cdn.elifesciences.org/articles/101151/elife-101151-fig7-data1-v1.zip
-
Figure 7—source data 2
Original files for western blot shown in Figure 7A.
- https://cdn.elifesciences.org/articles/101151/elife-101151-fig7-data2-v1.zip
Figure 7—figure supplement 1
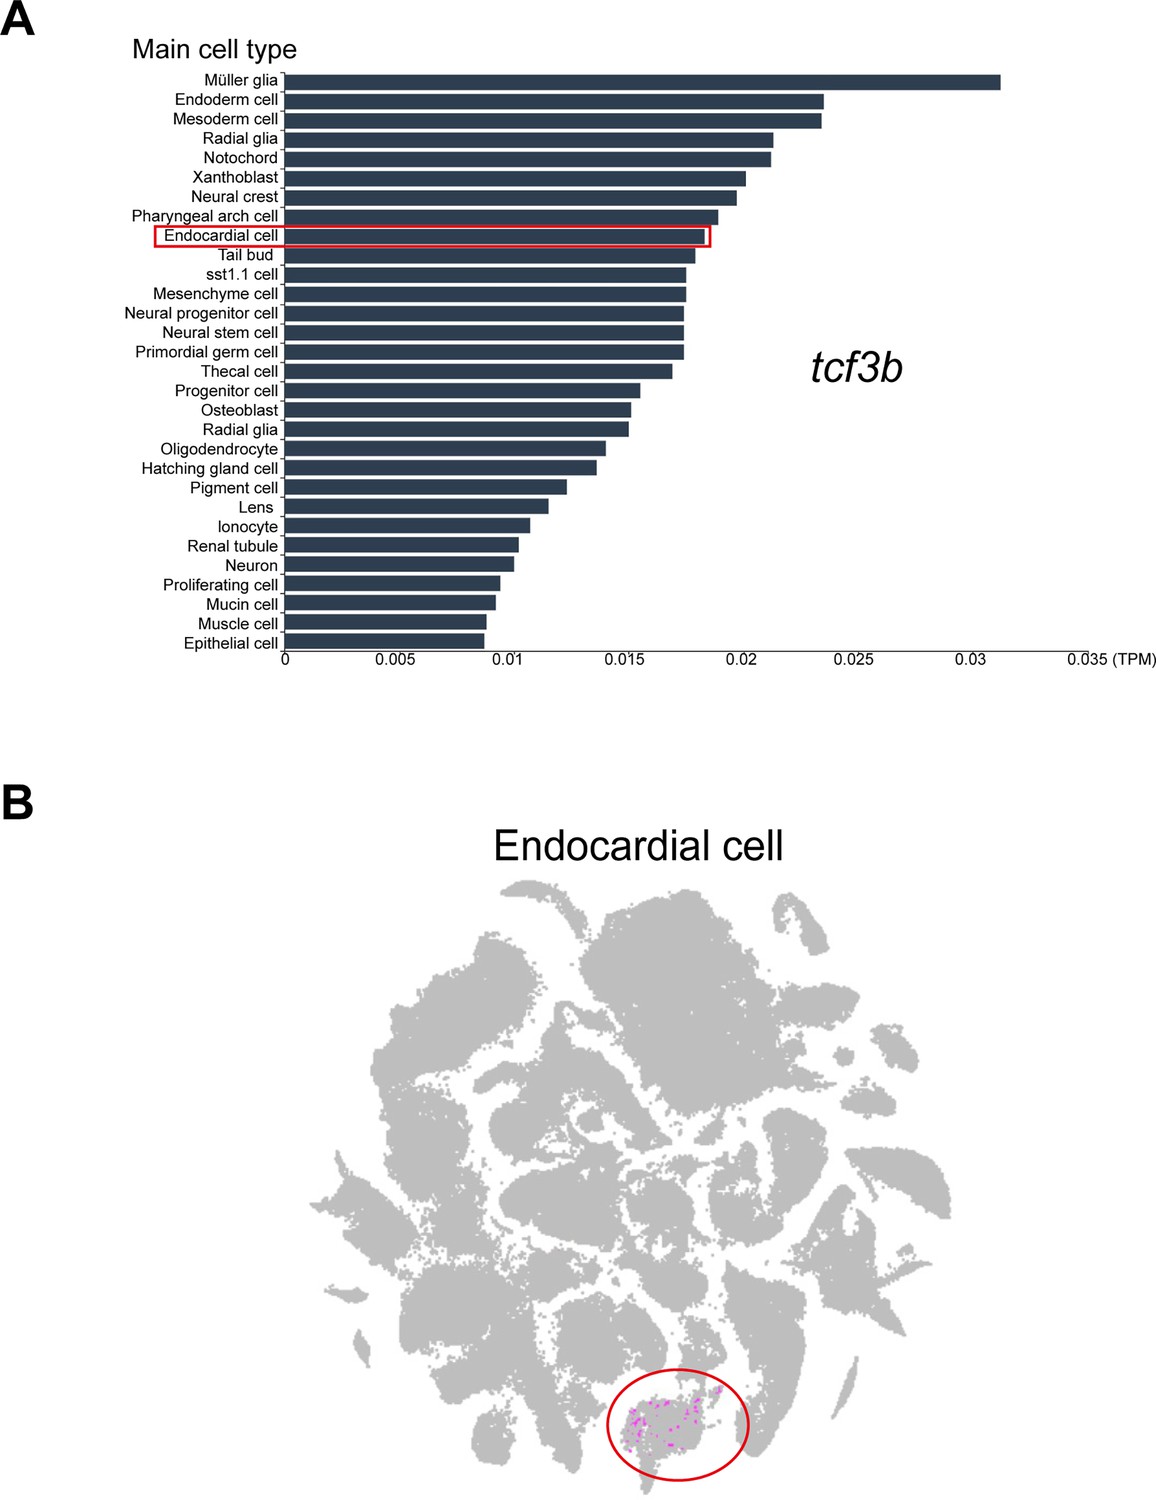
Expression landscape of zebrafish tcf3b.
(A) The major cell types expressing tcf3b were displayed according to the zebrafish single-cell landscape. (B) Identification of the endocardial cell population in the zebrafish cell landscape. Purple dots represent endocardial cells, and the red oval denotes cell populations from the heart. Images were generated using the Zebrafish Cell Landscape (ZCL) at http://bis.zju.edu.cn/ZCL/.
Author response image 1
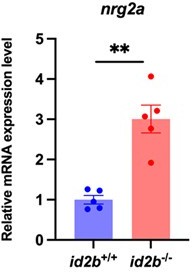
Expression levels of nrg2a.
qRT-PCR analysis of nrg2a mRNA in id2b+/+ and id2b-/- adult hearts. Data were normalized to the expression of actb1. N=5 biological replicates, with each sample containing two adult hearts.
Videos
Video 1
96 hr post-fertilization (hpf) id2b+/+ larvae displayed unidirectional blood flow in the atrioventricular (AV) canal.
Scale bar, 50 μm.
Video 2
96 hr post-fertilization (hpf) id2b-/- larvae displayed unidirectional blood flow in the atrioventricular (AV) canal.
Scale bar, 50 μm.
Additional files
Download links
A two-part list of links to download the article, or parts of the article, in various formats.
Downloads (link to download the article as PDF)
Open citations (links to open the citations from this article in various online reference manager services)
Cite this article (links to download the citations from this article in formats compatible with various reference manager tools)
Contraction-induced endocardial id2b plays a dual role in regulating myocardial contractility and valve formation
eLife 13:RP101151.
https://doi.org/10.7554/eLife.101151.3


