ACVR2A facilitates trophoblast cell invasion through TCF7/c-JUN pathway in pre-eclampsia progression
- Department of Obstetrics and Gynecology, Obstetrics; Guangdong Provincial Key Laboratory of Major Obstetric Diseases; Guangdong Provincial Clinical Research Center for Obstetrics and Gynecology; Guangdong-Hong Kong-Macao Greater Bay Area Higher Education Joint Laboratory of Maternal-Fetal Medicine; The Third Affiliated Hospital, Guangzhou Medical University, China
Figures
Figure 1 with 2 supplements
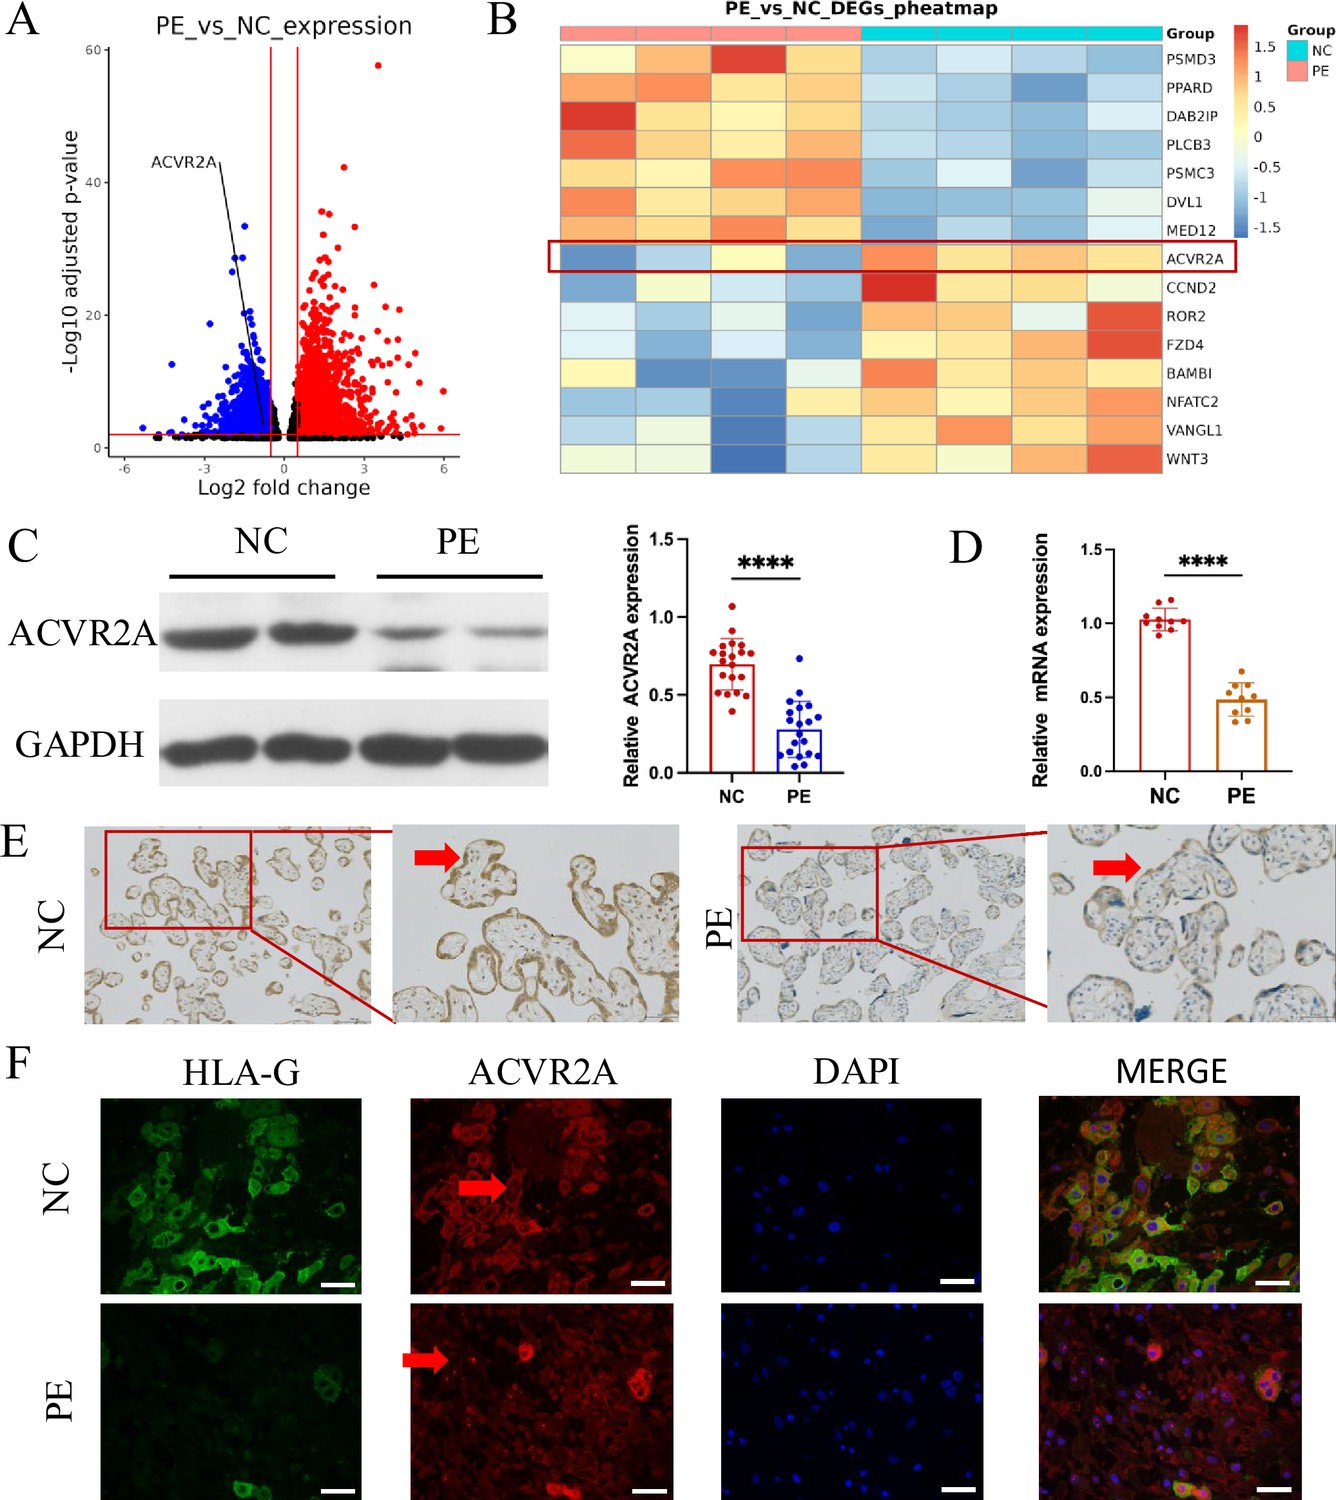
ACVR2A was downregulated in placental tissue associated with pre-eclampsia (PE).
(A) Comparison of the RNA-seq volcano maps of all genes in the placenta of normal control (NC) and patients with PE evidently showed that the expression of the ACVR2A gene significantly decreased in patients with PE. (B) Heatmap of differentially expressed genes in PE versus control placental samples. Genes were selected based on significant differential expression (false discovery rate [FDR] <0.05, |log2(fold change)| ≥1) and their involvement in the WNT signaling pathway, as determined through KEGG and GSEA analyses. ACVR2A is highlighted alongside other genes of interest to illustrate its association with the molecular landscape of PE. (C) Western blot analysis demonstrated reduced levels of ACVR2A in PE placental tissue (n = 20) compared with control placentas. (D) RT-qPCR was employed to assess the ACVR2A mRNA expression in placental tissues of NC (n = 10) and patients with PE (n = 10). (E) Immunohistochemical staining was conducted using rabbit IgG anti-human ACVR2A antibody on sections from NC and PE placentas. Sections were counterstained with hematoxylin. The ACVR2A levels were markedly lower in patients with PE (n = 10) than in NC. (F) Immunofluorescence co-localization of rabbit IgG anti-human ACVR2A antibodies and HLA-G antibodies (a marker of extrachorionic trophoblastic cells) was performed in NC and PE maternal placenta. The expression pattern of the ACVR2A antibody closely resembles that of the HLA-G antibody, primarily expressed in extravillous trophoblast (EVT) cells (****p < 0.0001 compared with NC group).
-
Figure 1—source data 1
Original western blot shown in Figure 1C (labelled).
- https://cdn.elifesciences.org/articles/101236/elife-101236-fig1-data1-v1.zip
-
Figure 1—source data 2
Original western blot shown in Figure 1C.
- https://cdn.elifesciences.org/articles/101236/elife-101236-fig1-data2-v1.zip
Figure 1—figure supplement 1
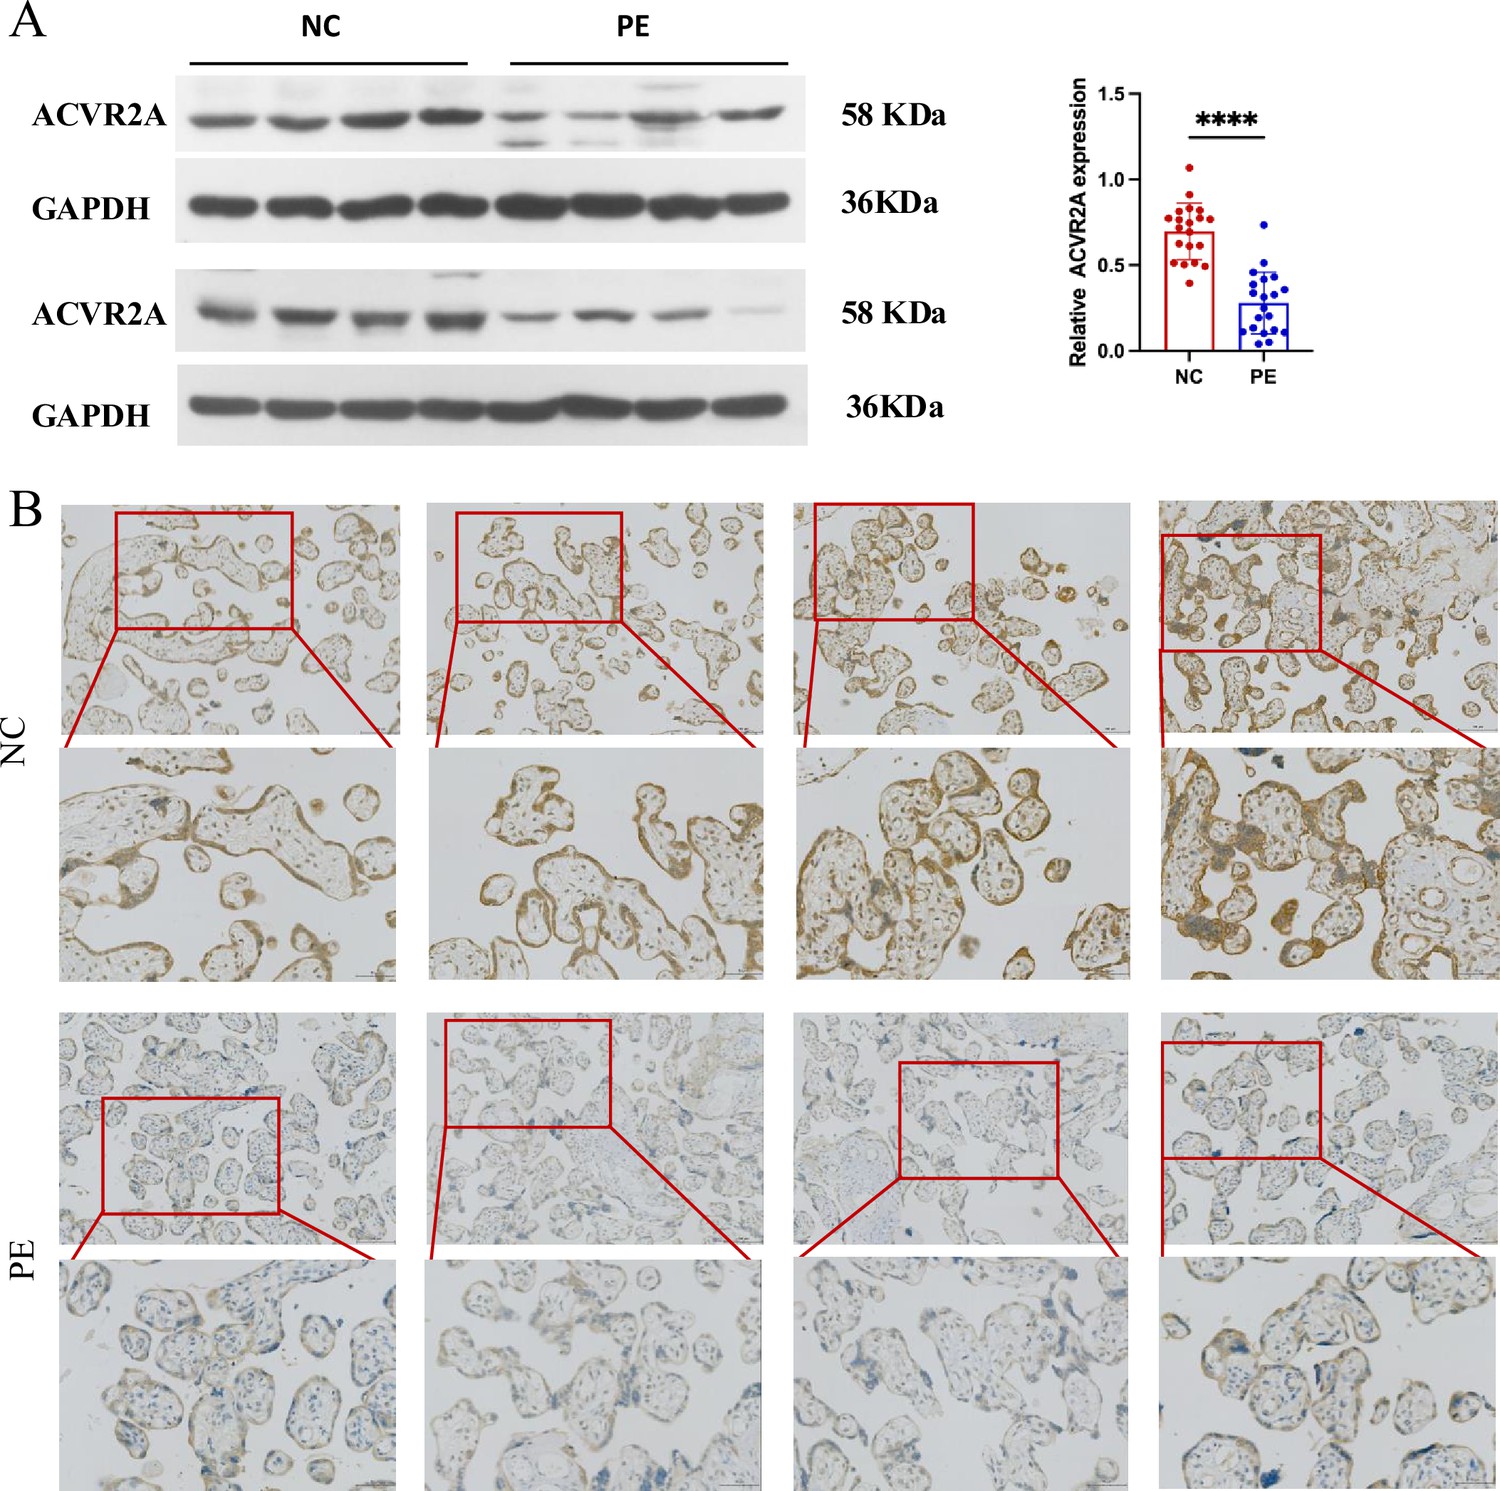
Downregulation of ACVR2A expression in pre-eclampsia placental tissue: insights from western blot and immunohistochemistry.
(A) Western blot analysis demonstrated reduced levels of ACVR2A in pre-eclampsia placental tissue (n = 20) compared to control placentas. (B) Immunohistochemical staining using rabbit IgG anti-human ACVR2A antibody on sections from normal control pregnant women and pre-eclampsia placentas. Sections were counterstained with hematoxylin. ACVR2A levels were markedly lower in patients with pre-eclampsia (n = 10) compared to normal control subjects (****p < 0.0001 compared with NC group).
-
Figure 1—figure supplement 1—source data 1
Original gel image of ACVR2A shown in Figure 1—figure supplement 1A (labelled).
- https://cdn.elifesciences.org/articles/101236/elife-101236-fig1-figsupp1-data1-v1.pdf
-
Figure 1—figure supplement 1—source data 2
Original gel image of ACVR2A shown in Figure 1—figure supplement 1A.
- https://cdn.elifesciences.org/articles/101236/elife-101236-fig1-figsupp1-data2-v1.zip
Figure 1—figure supplement 2
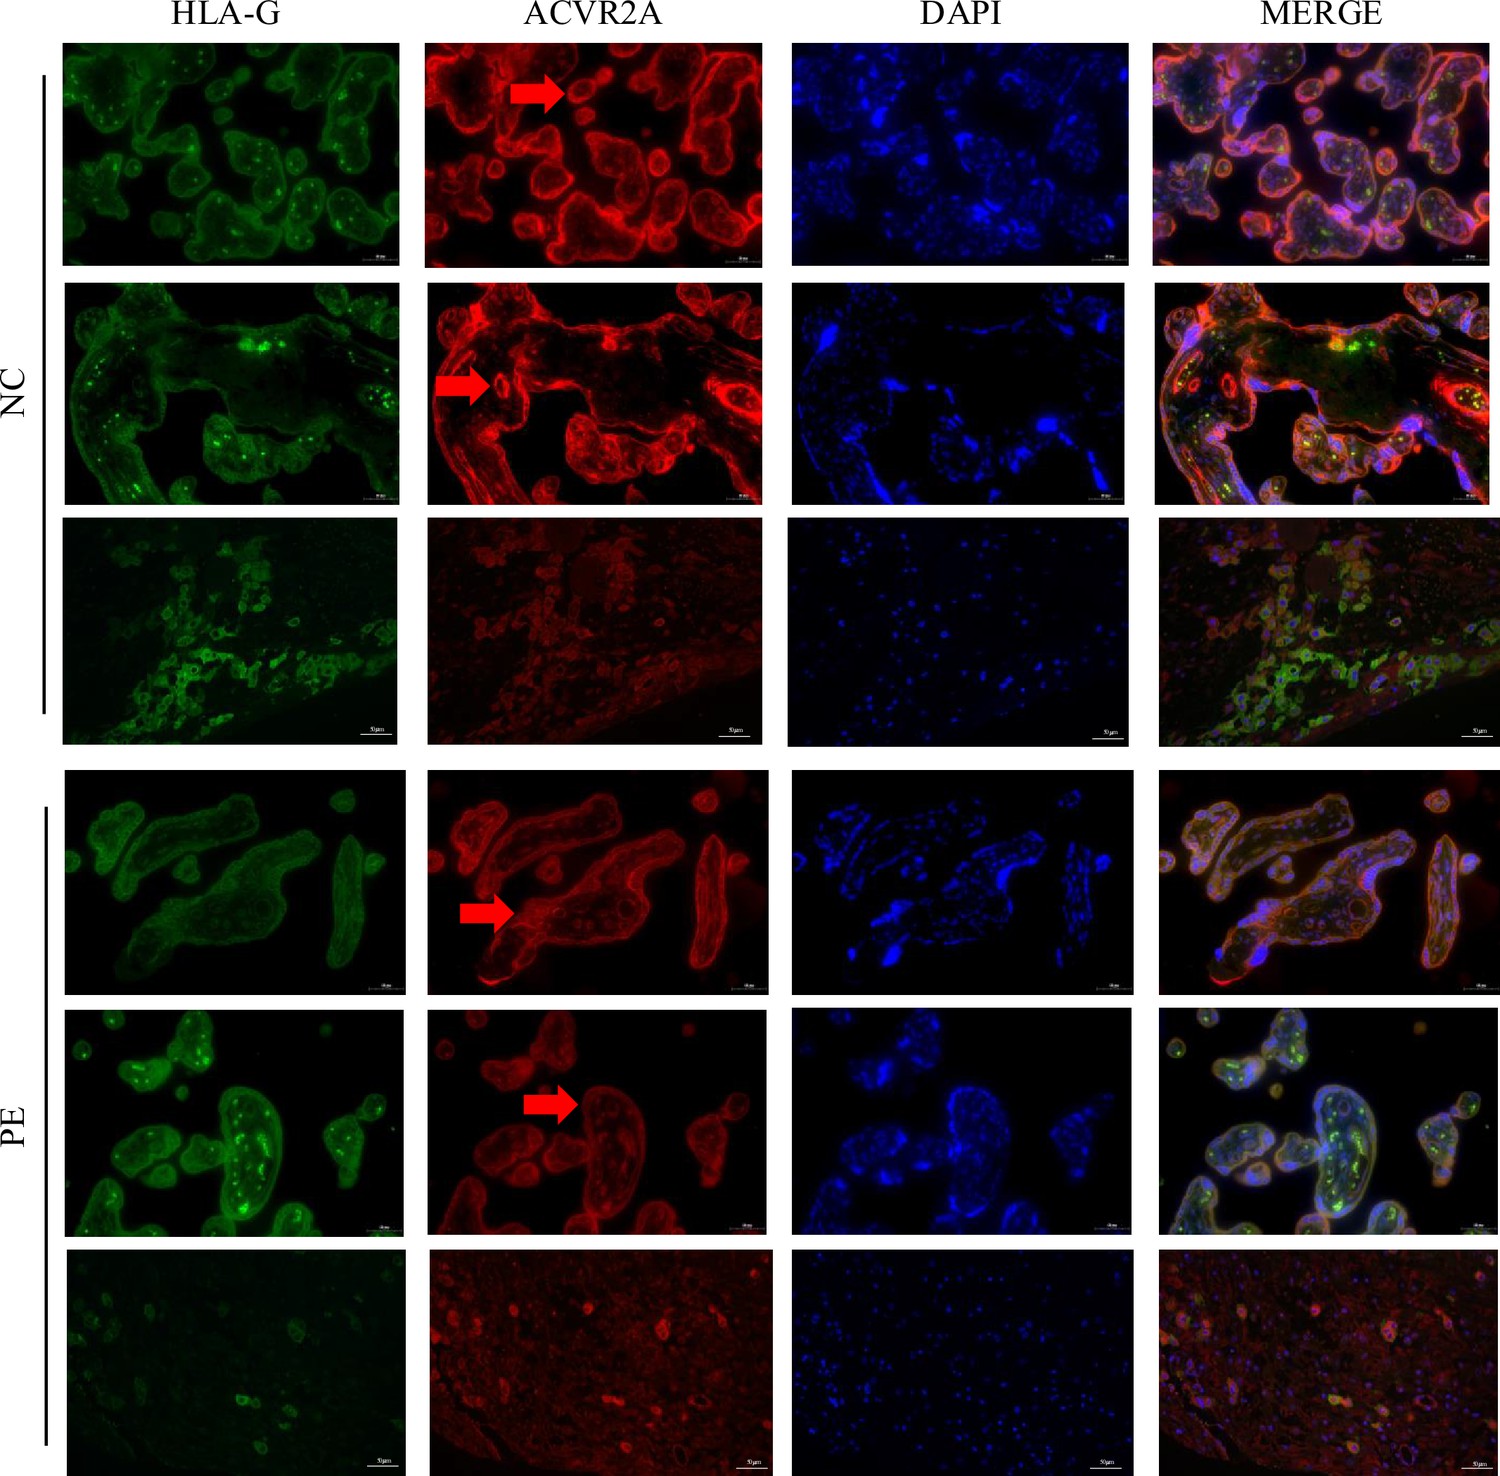
Reduced ACVR2A expression in trophoblast cells of pre-eclampsia placental tissue revealed by immunofluorescence co-localization with HLA-G.
Immunofluorescence co-localization of rabbit IgG anti-human ACVR2A antibodies and HLA-G antibodies (a marker of extrachorionic trophoblastic cells) in normal control and pre-eclampsia maternal placenta. The expression pattern of the ACVR2A antibody closely resembles that of the HLA-G antibody, primarily expressed in extravillous trophoblast (EVT) cells.
Figure 2 with 3 supplements
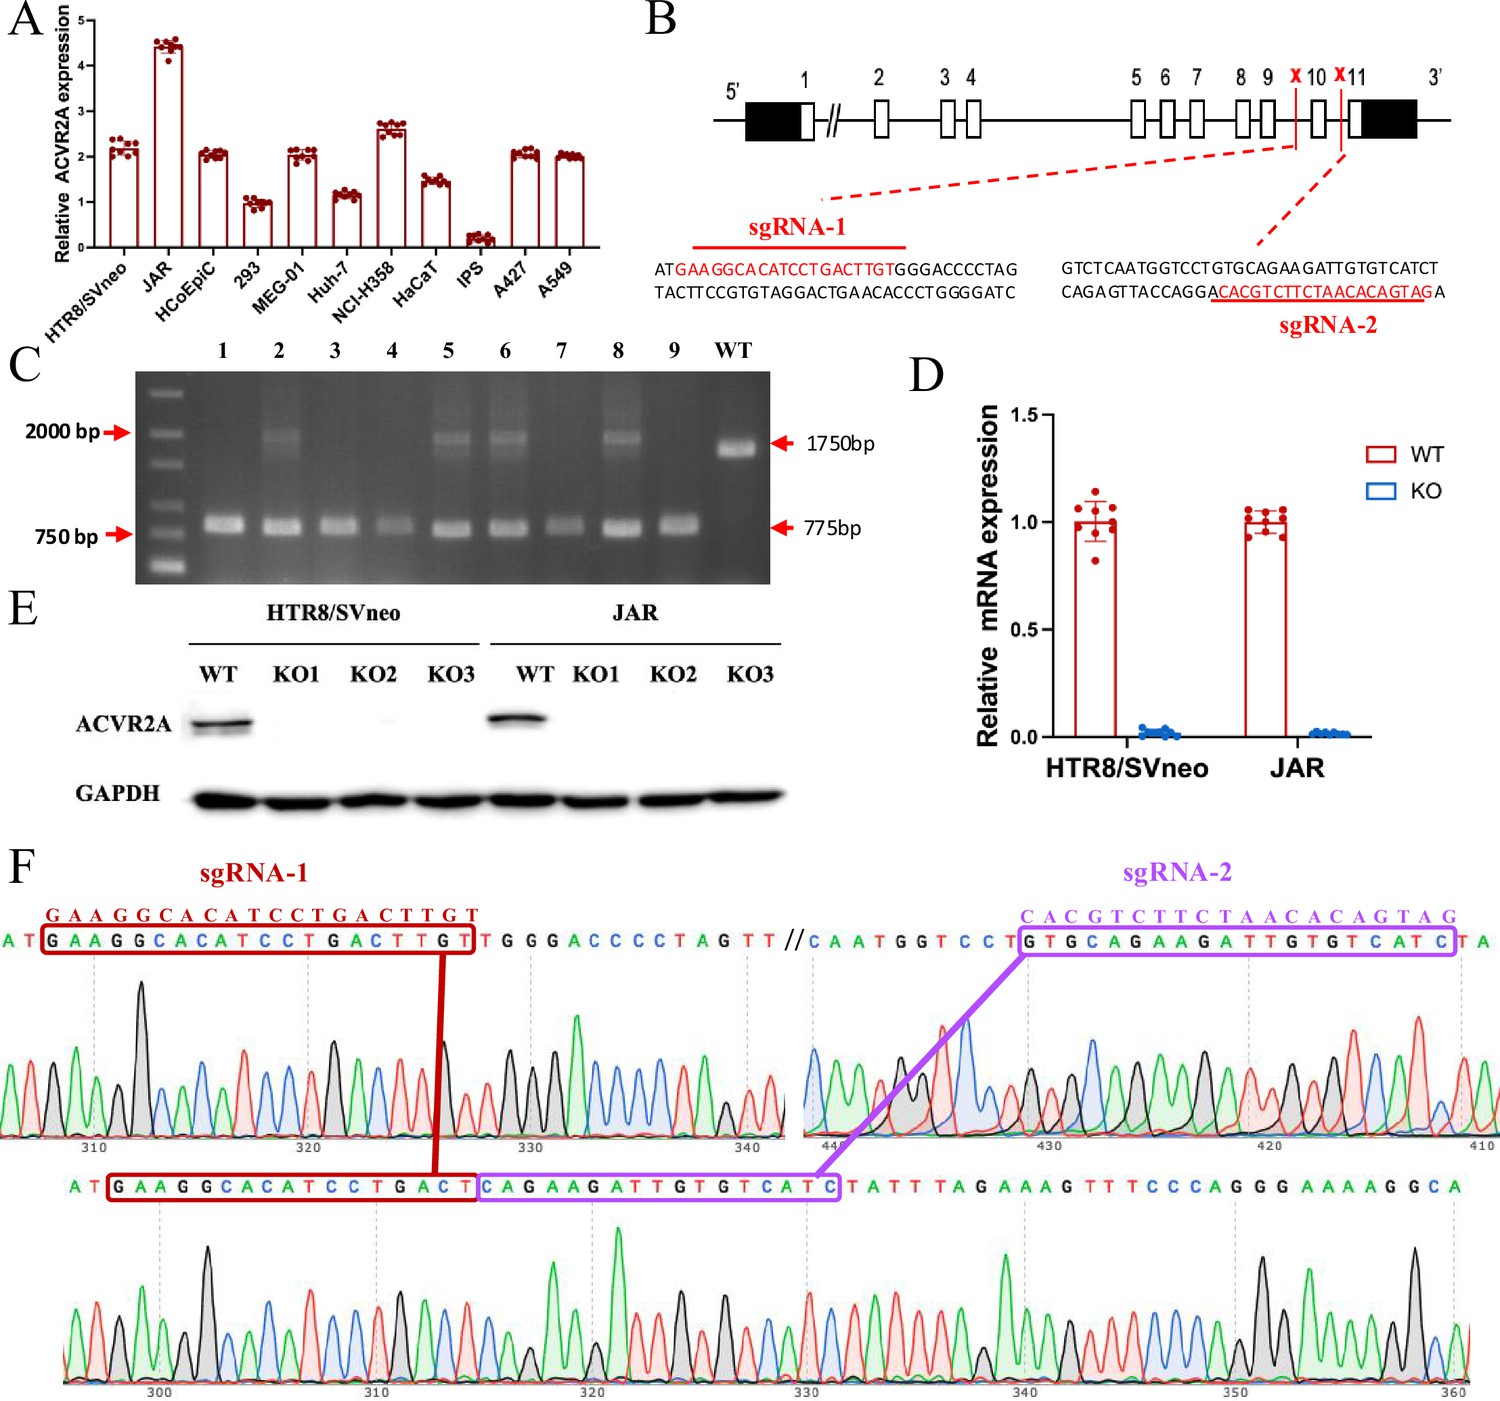
The ACVR2A gene in JAR and HTR8/SVneo cells was successfully knocked out using CRISPR/Cas9 gene editing technology.
(A) RT-qPCR was employed to assess the ACVR2A mRNA expression across various cell lines. The expression of ACVR2A in HTR8/SVneo and JAR was comparable to that in multiple cancer cell lines, with JAR exhibiting a higher ACVR2A expression. (B) DNA sequence of ACVR2A and target sequence site information of sgRNA-1 and sgRNA-2. (C) The knockout efficiency of the ACVR2A gene in HTR8/SVneo and JAR cell lines was assessed through polymeric primer PCR, confirmed by agarose gel electrophoresis, and reconfirmed through four rounds of monoclonal cell communities. The specific experimental results are shown in Figure 2—figure supplement 1. (D) The ACVR2A mRNA levels were measured in HTR8/SVneo and JAR cell lines, and the normal control group was compared with the two ACVR2A-KO cell lines after three rounds of validation . (E) Western blot analysis showing ACVR2A protein levels in wild-type (WT) and knockout (KO) HTR8/SVneo and JAR cell lines. The ACVR2A protein is significantly absent in KO cell lines compared to WT, confirming successful knockout of the ACVR2A gene. (F) Sanger sequencing confirmed the expression of ACVR2A in ACVR2A-KO monoclonal cell lines and successfully knocked out the DNA fragment between the ACVR2A gene sgRNA-1 and sgRNA-2. The specific experimental results are shown in Figure 2—figure supplements 2 and 3.
-
Figure 2—source data 1
Original western blot shown in Figure 2E (labelled).
- https://cdn.elifesciences.org/articles/101236/elife-101236-fig2-data1-v1.zip
-
Figure 2—source data 2
Original western blot shown in Figure 2E.
- https://cdn.elifesciences.org/articles/101236/elife-101236-fig2-data2-v1.zip
Figure 2—figure supplement 1
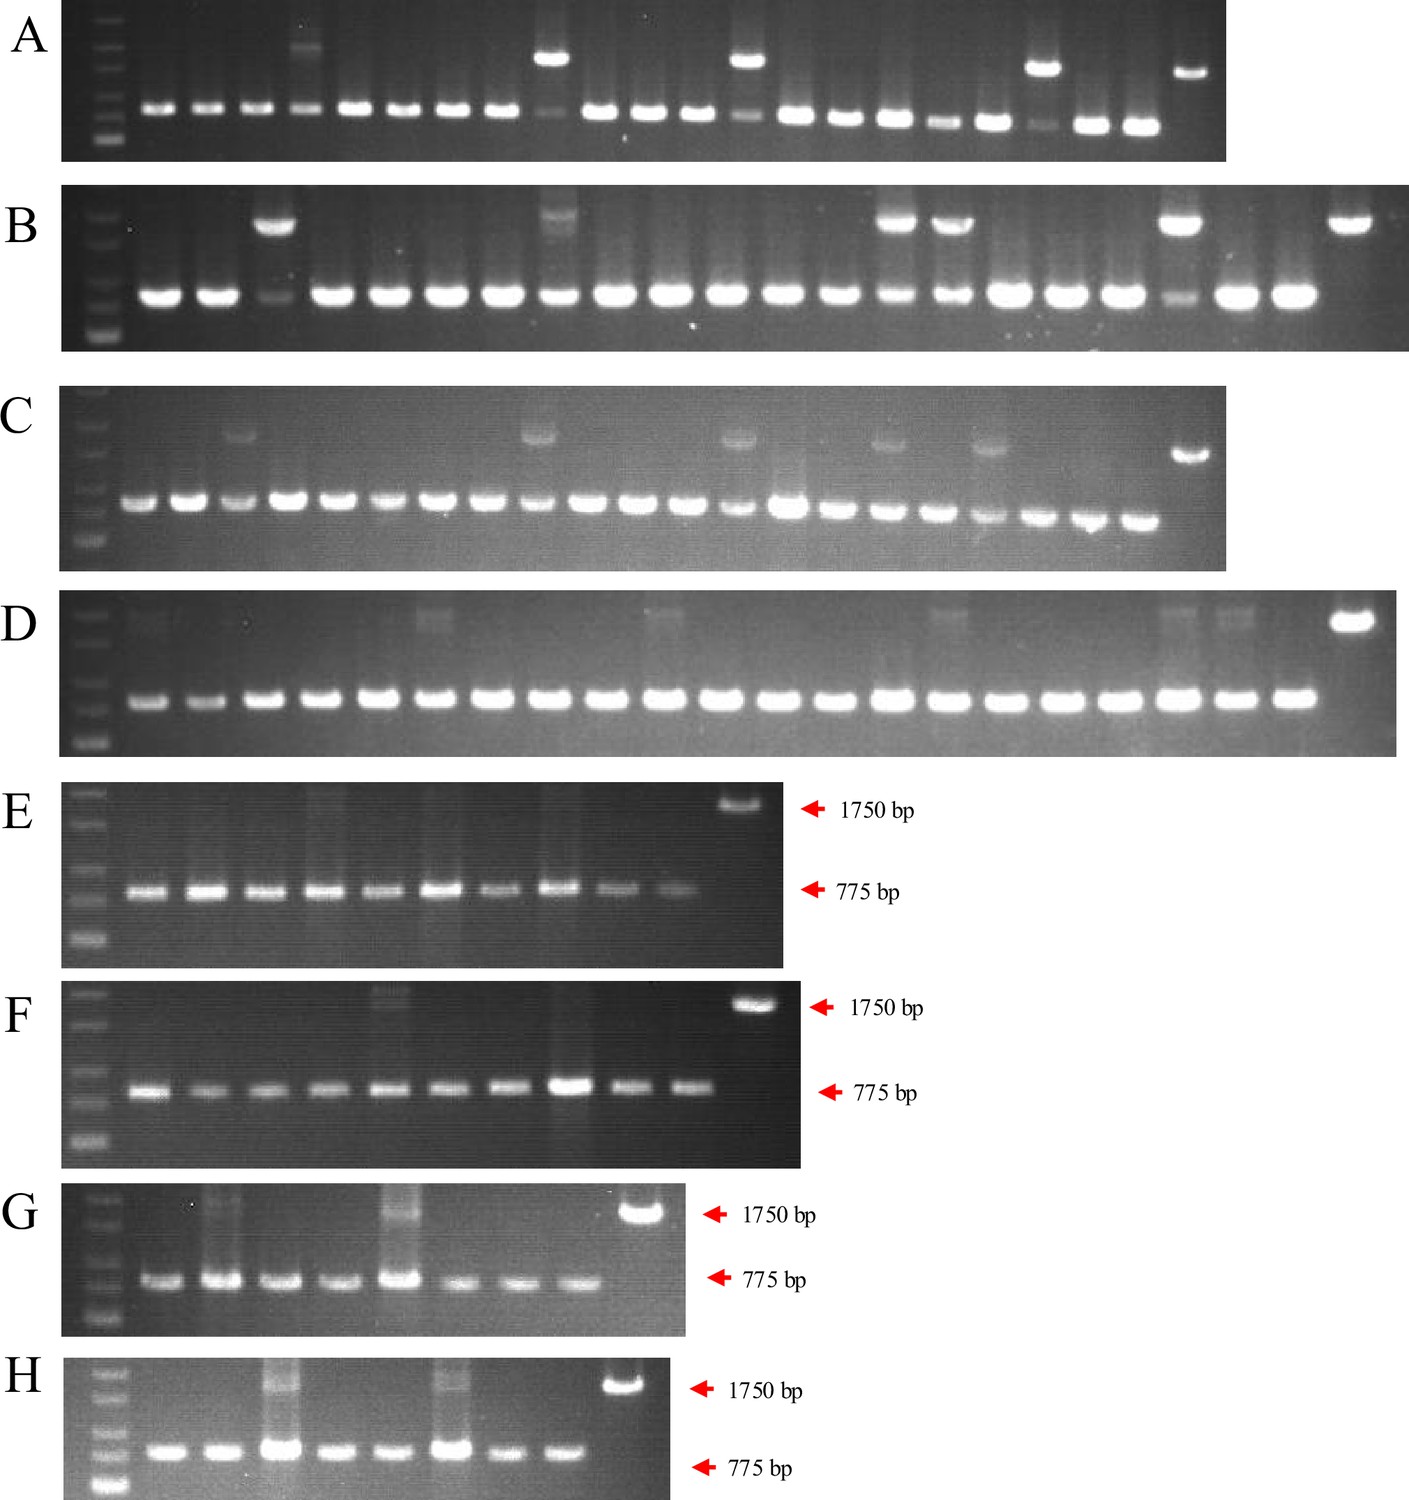
Genotype identification led to the selection of three pairs of HTR8/SVneo and JAR cell lines with complete ACVR2A knockout.
(A) Identification of the first batch of ACVR2A gene knockout monoclonal cell lines in the HTR8/SVneo cell line. (B) Identification of the first batch of ACVR2A gene knockout monoclonal cell lines in the JAR cell line. (C) Identification of the second batch of ACVR2A gene knockout monoclonal cell lines in the HTR8/SVneo cell line. (D) Identification of the second batch of ACVR2A gene knockout monoclonal cell lines in the JAR cell line. (E) Identification of the third batch of ACVR2A gene knockout monoclonal cell lines in the HTR8/SVneo cell line. (F) Identification of the third batch of ACVR2A gene knockout monoclonal cell lines in the JAR cell line. (G) Identification of the fourth batch of ACVR2A gene knockout monoclonal cell lines in the HTR8/SVneo cell line. (H) Identification of the fourth batch of ACVR2A gene knockout monoclonal cell lines in the JAR cell line.
-
Figure 2—figure supplement 1—source data 1
Original agarose gel electrophoresis gel patterns shown in Figure 2—figure supplement 1 (labelled).
- https://cdn.elifesciences.org/articles/101236/elife-101236-fig2-figsupp1-data1-v1.zip
-
Figure 2—figure supplement 1—source data 2
Original agarose gel electrophoresis gel patterns shown in Figure 2—figure supplement 1.
- https://cdn.elifesciences.org/articles/101236/elife-101236-fig2-figsupp1-data2-v1.zip
Figure 2—figure supplement 2
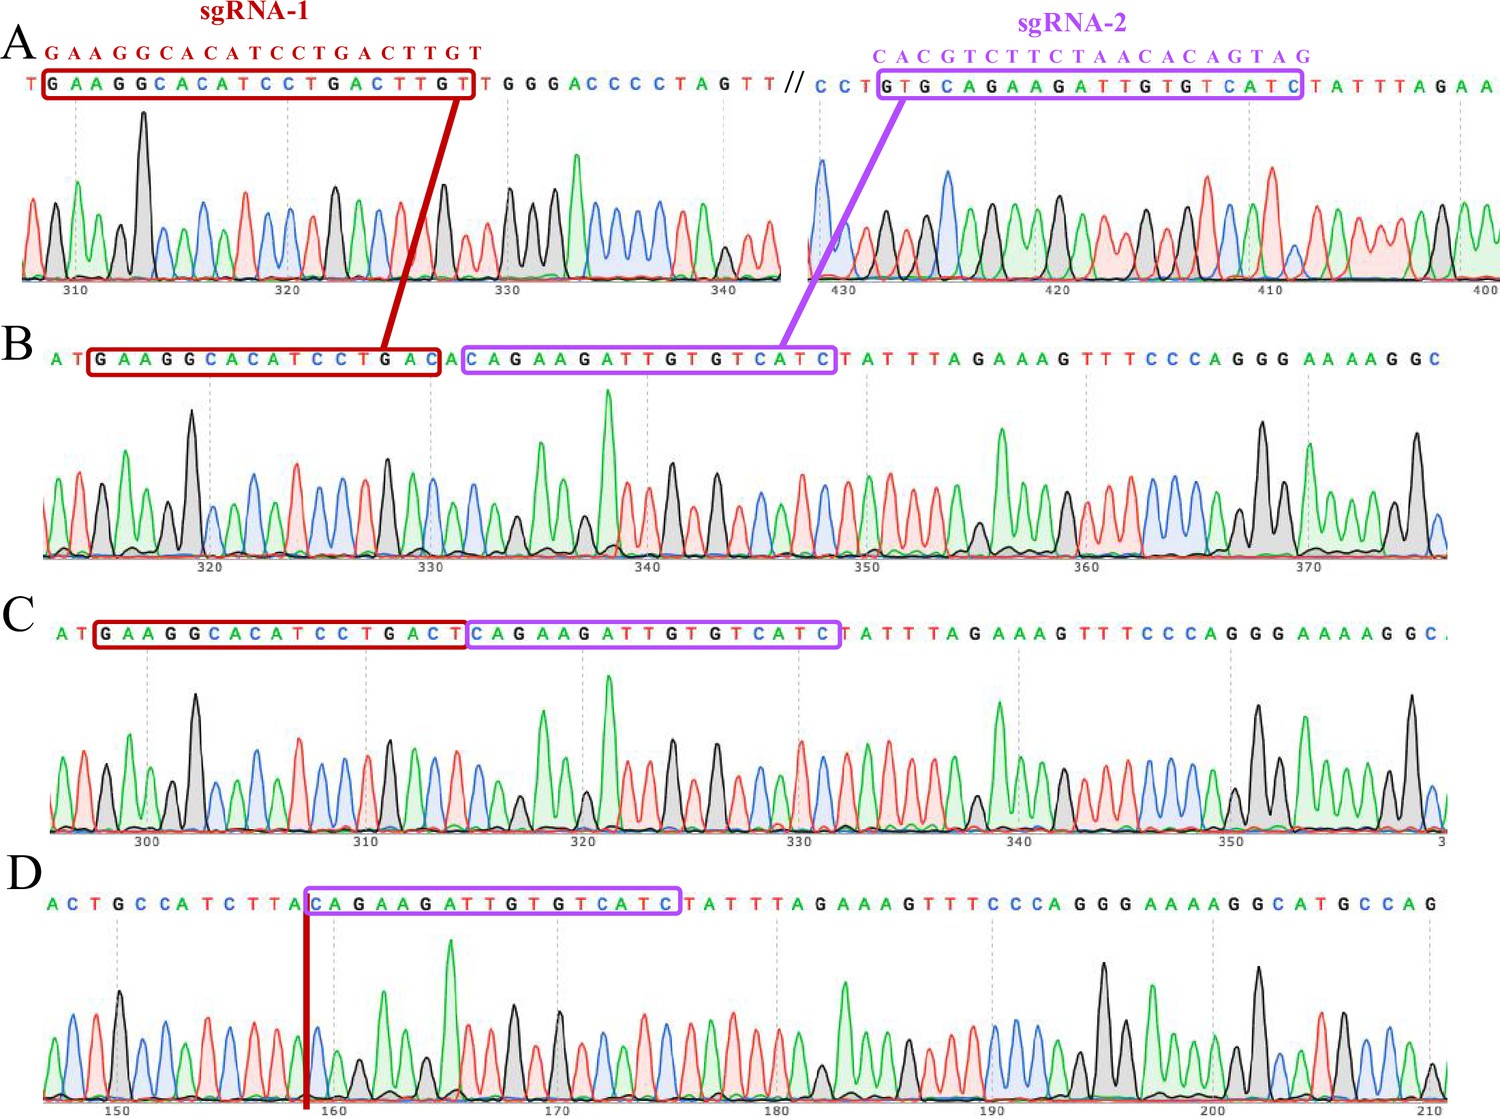
The complete knockout of the ACVR2A gene in HTR8/Svneo monoclonal cell lines was confirmed through Sanger sequencing electrophoresis.
The Sanger sequencing technique was employed to validate the successful knockout (KO) of the ACVR2A gene in these specific trophoblast cell lines. Each lane corresponds to a distinct monoclonal cell line: HTR8/SVneo wild type (A), HTR8/SVneo KO-1 (B), HTR8/SVneo KO-2 (C), and HTR8/SVneo KO-3 (D). The electropherograms provide a visual representation of the DNA fragments, confirming the precise and targeted deletion of the ACVR2A gene in the knockout cell lines. The distinct peaks and patterns in the electropherograms indicate the specific alterations made during the gene editing process. These sequencing results validate the efficacy of CRISPR/Cas9-mediated ACVR2A gene knockout in the HTR8/Svneo trophoblast cell lines.
Figure 2—figure supplement 3
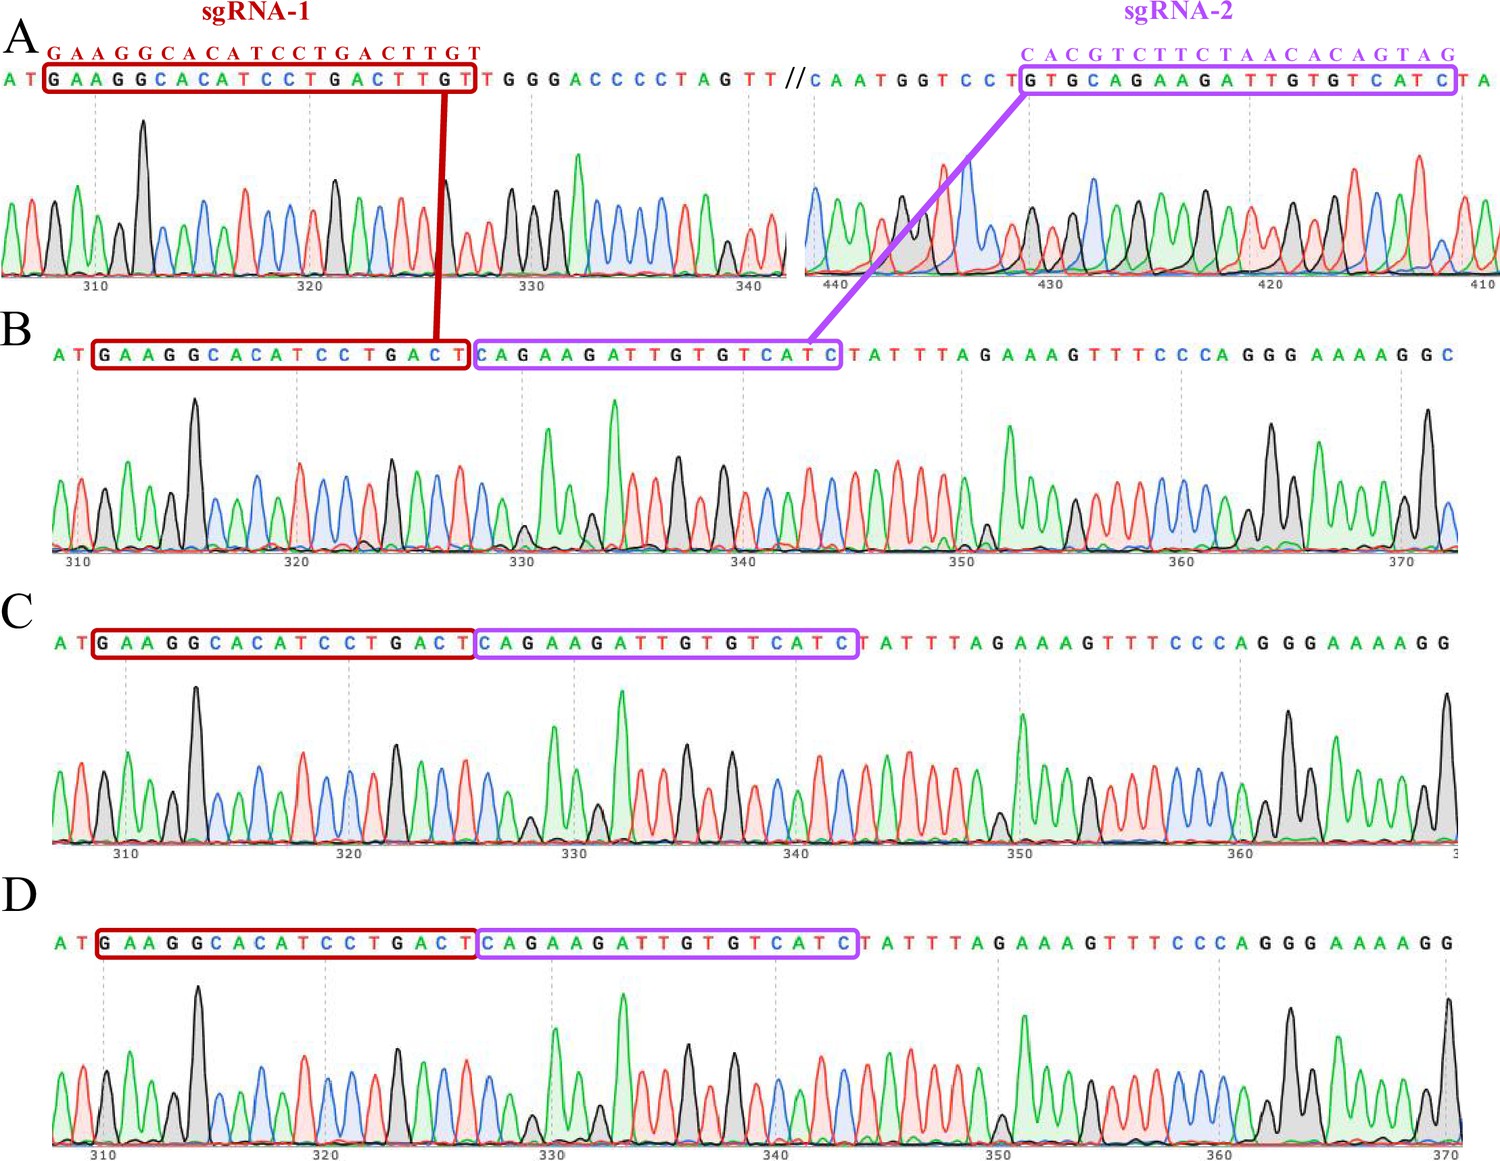
The complete knockout of the ACVR2A gene in JAR monoclonal cell lines was confirmed through Sanger sequencing electrophoresis.
Each lane corresponds to a specific monoclonal cell line: JAR wild type (A), JAR KO-1 (B), JAR KO-2 (C), and JAR KO-3 (D). The electropherograms capture the unique DNA fragment patterns generated during the gene editing process, confirming the successful deletion of the ACVR2A gene in the knockout cell lines. The distinctive peaks and sequences in the electropherograms offer a visual validation of the precision and accuracy of the CRISPR/Cas9 gene editing technique in inducing targeted genetic changes. These sequencing results serve as a crucial verification step, establishing the reliability of the JAR-ACVR2A-KO monoclonal cell lines for subsequent investigations into the functional implications of ACVR2A in trophoblast cells and its potential relevance to conditions such as pre-eclampsia.
Figure 3
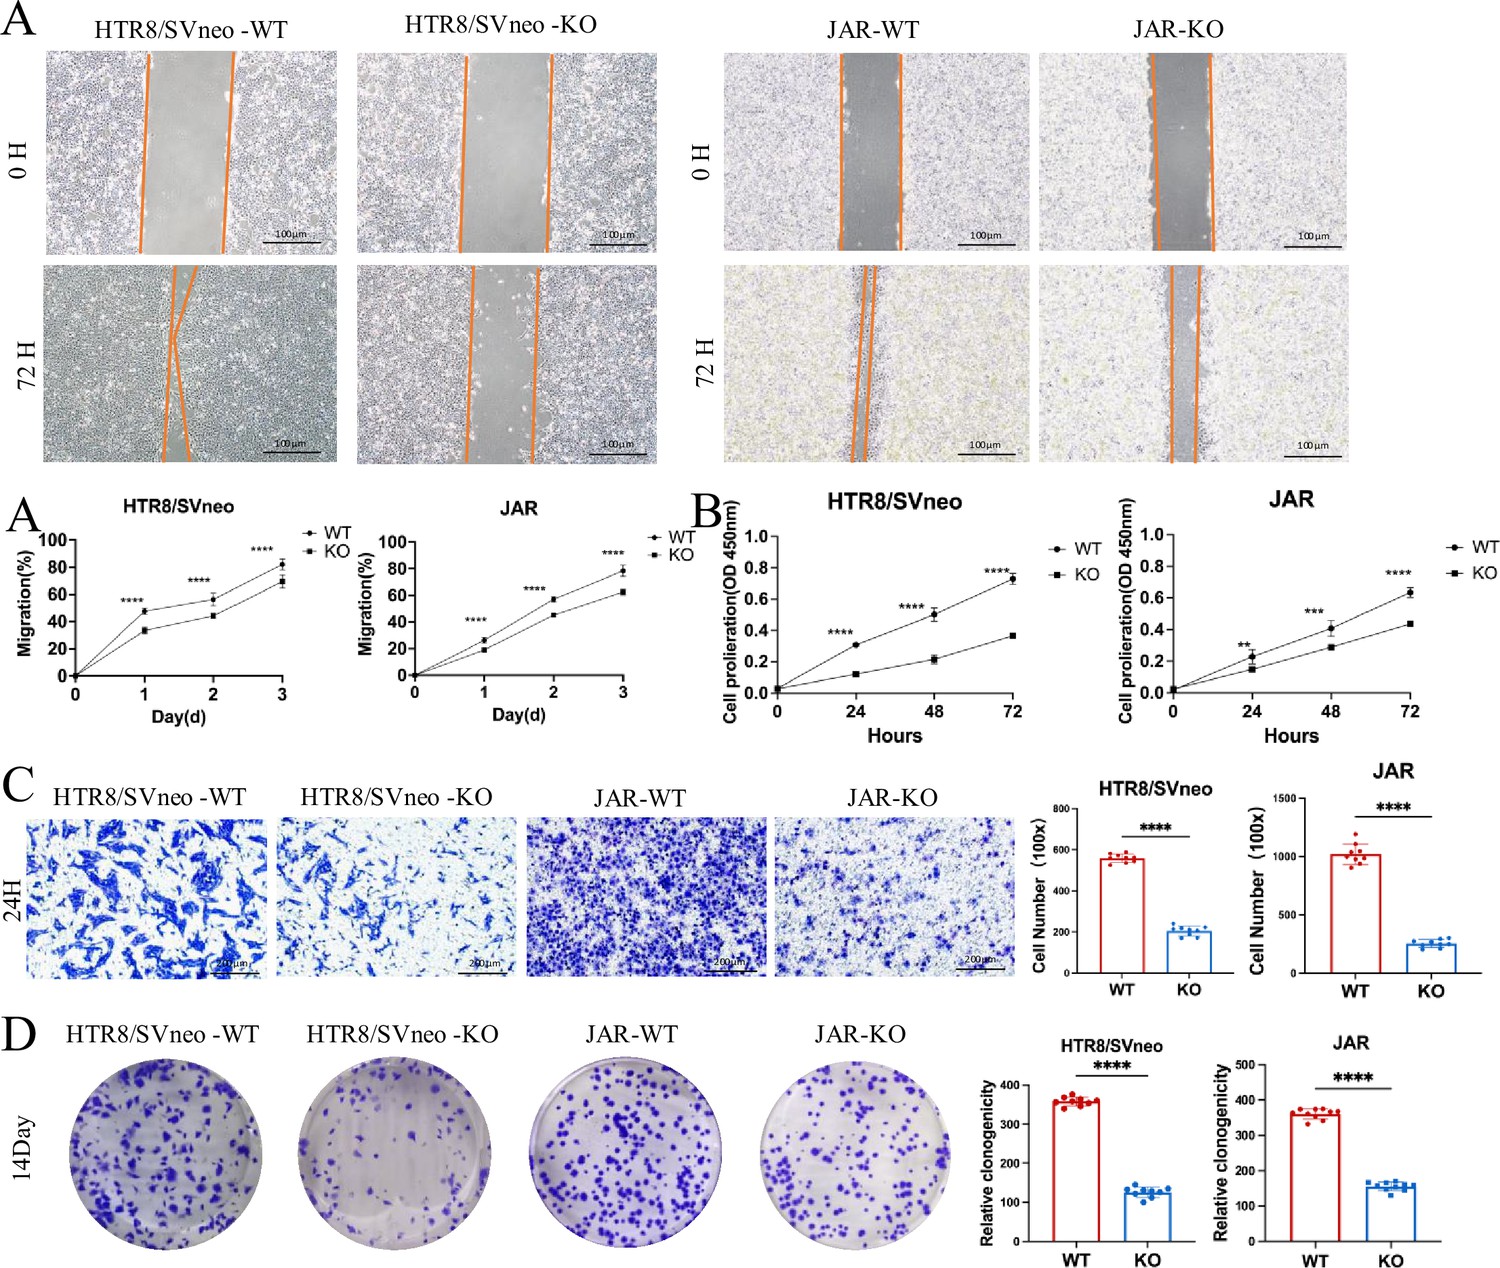
Effects of ACVR2A knockout on trophoblast cell function.
(A) Cell scratch assay was conducted in a 6-well plate to assess alterations in the migration ability of HTR8/SVneo and JAR cells following ACVR2A gene knockout. Three visual fields were randomly selected under a 100×microscope for continuous observation, calculation, and difference analysis. Scale bar: 100 µm. (B) CCK-8 method was employed to assess the proliferation of HTR8/SVneo and JAR cells after ACVR2A gene knockout. (C) Cell invasion was quantified by counting cells in five randomly selected fields of view at ×300 magnification. Images shown in the figure were captured at lower magnification (×100) to provide an overview of the experimental and control groups. Scale bar: 200 µm. (D) Colony formation was detected by single-cell clone assay. Colony formation assay conducted in a 6-well plate to assess changes in the individual cell proliferation capacity of HTR8/SVneo and JAR cells following ACVR2A gene knockout. Colony formation assays were repeated independently at least 10 times to ensure reproducibility. The results are expressed as the mean ± SD of these replicate experiments (*p < 0.05, **p < 0.01, ***p < 0.001, and ****p < 0.0001 compared with normal control group).
Figure 4
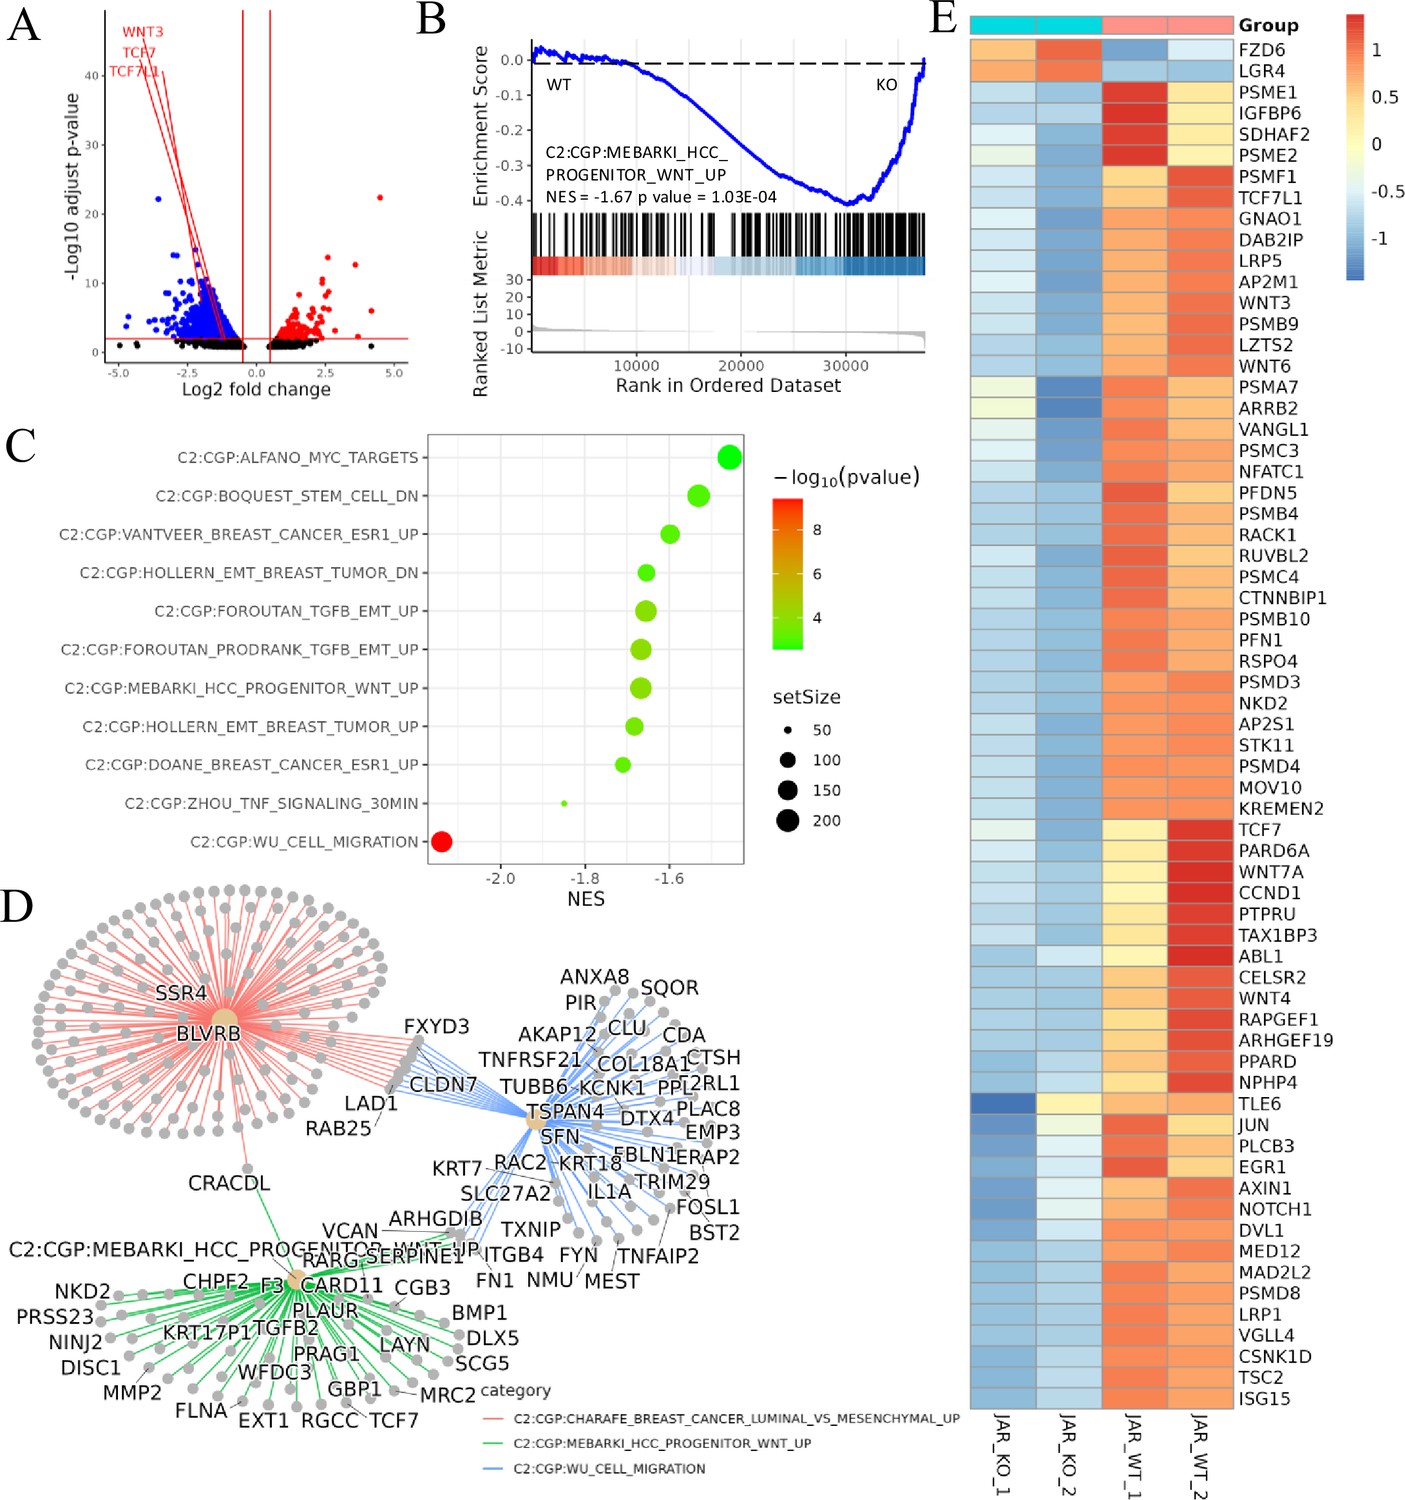
Transcriptomic analysis revealed that ACVR2A may suppress cell biological behavior through the Wnt/TCF7 pathway in JAR cell lines.
(A) The volcano plots of RNA-seq for all the genes compared JAR-ACVR2A-KO and WT. (B) One representative hallmark pathway, the Wnt pathway, in the ACVR2A-KO group. (C) The enriched biological process pathways of cell invasion and migration based on differentially expressed genes (DEGs) (p-value cutoff = 0.05). (D) The category netplot depicted the linkages of downregulated genes and three biological concepts that are related to ACVR2A as a network. (E) The heatmap showed DEGs in the Wnt pathway between experimental and normal control groups. Red and blue represent significantly upregulated and downregulated genes, respectively.
Figure 5
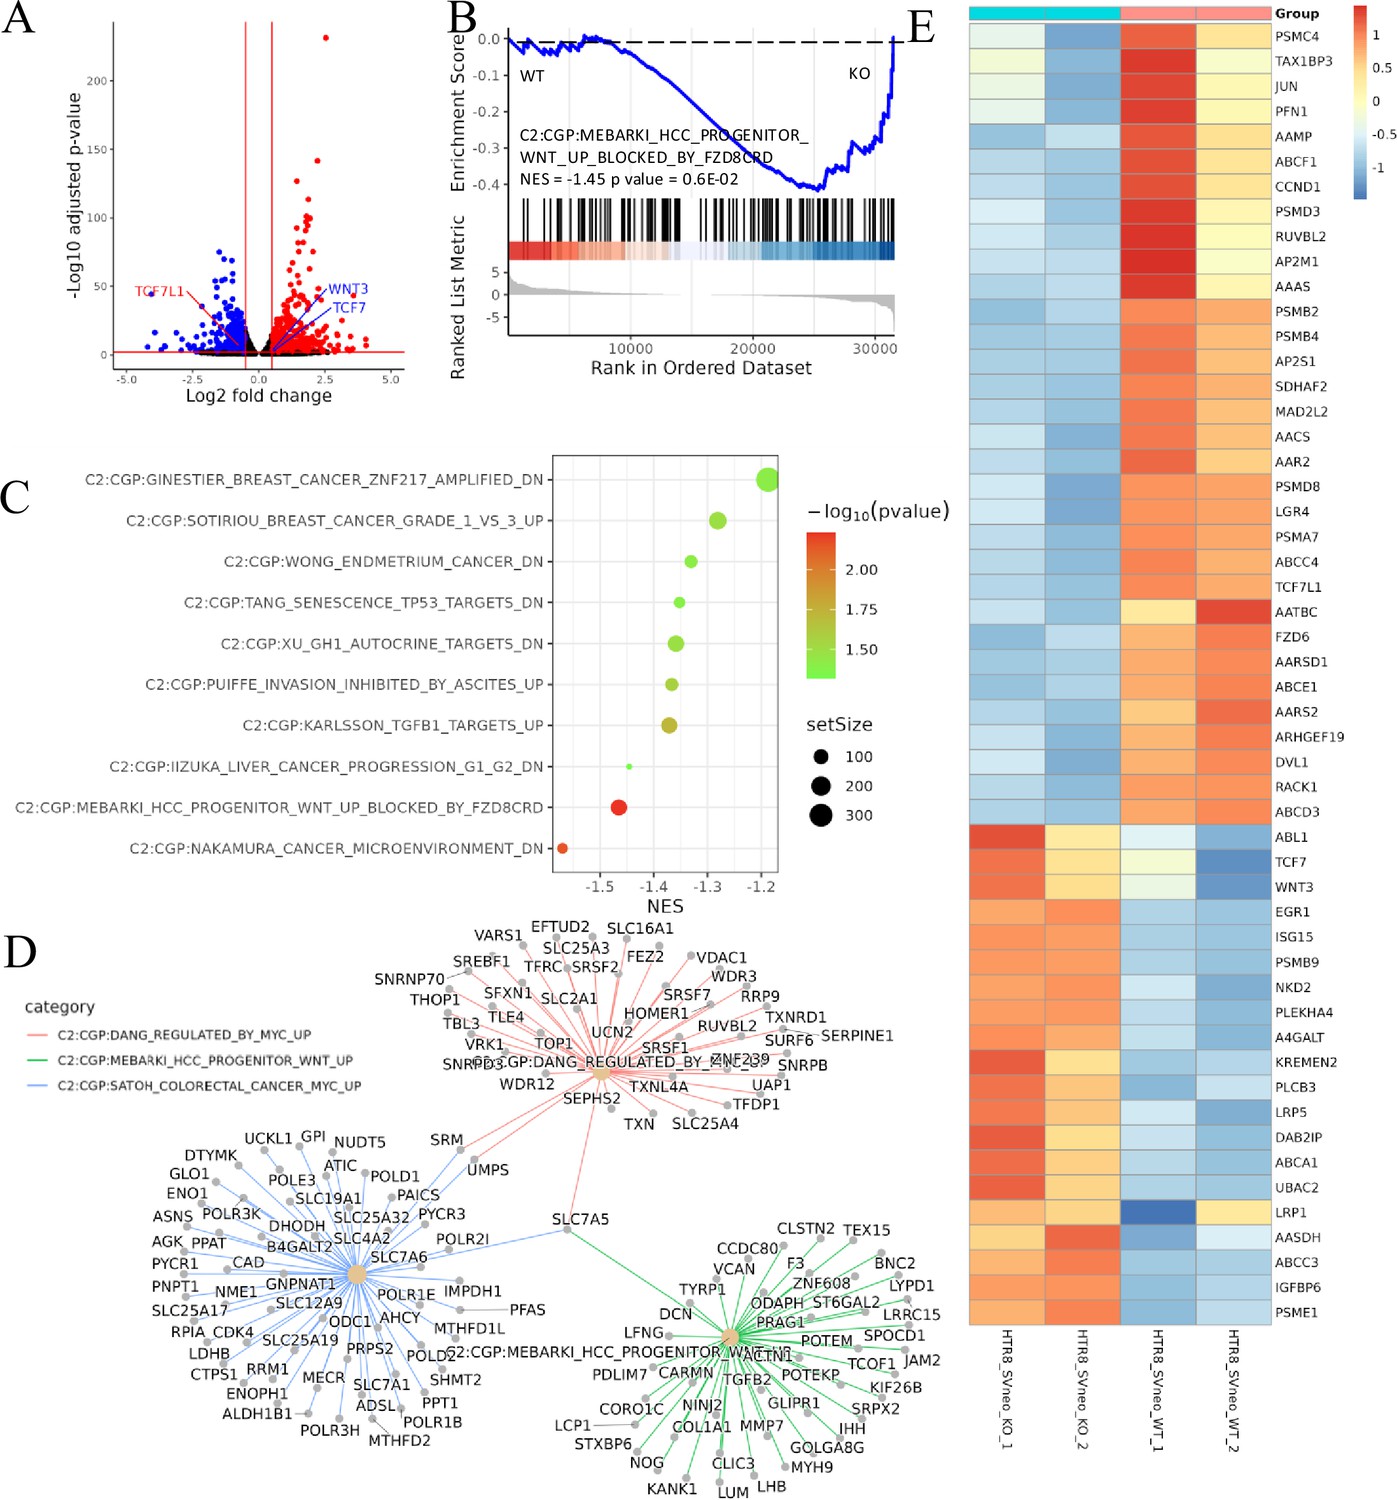
Transcriptomic analysis revealed that ACVR2A may suppress cell biological behavior through the Wnt/TCF7 pathway in HTR8/SVneo cell lines.
(A) Volcano plots of RNA-seq for all the genes compared HTR8/SVneo-ACVR2A-KO and WT. (B) One representative hallmark pathway, the Wnt pathway, in the ACVR2A-KO group. (C) The enriched biological process pathways in cell invasion and migration based on differentially expressed genes (DEGs) (p-value cutoff = 0.05). (D) The category netplot depicted the linkages of downregulated genes and three biological concepts that are related to ACVR2A as a network. (E) Heatmap of DEGs about Wnt pathway between experimental and normal control groups. Red and blue represent significantly upregulated and downregulated genes, respectively.
Figure 6
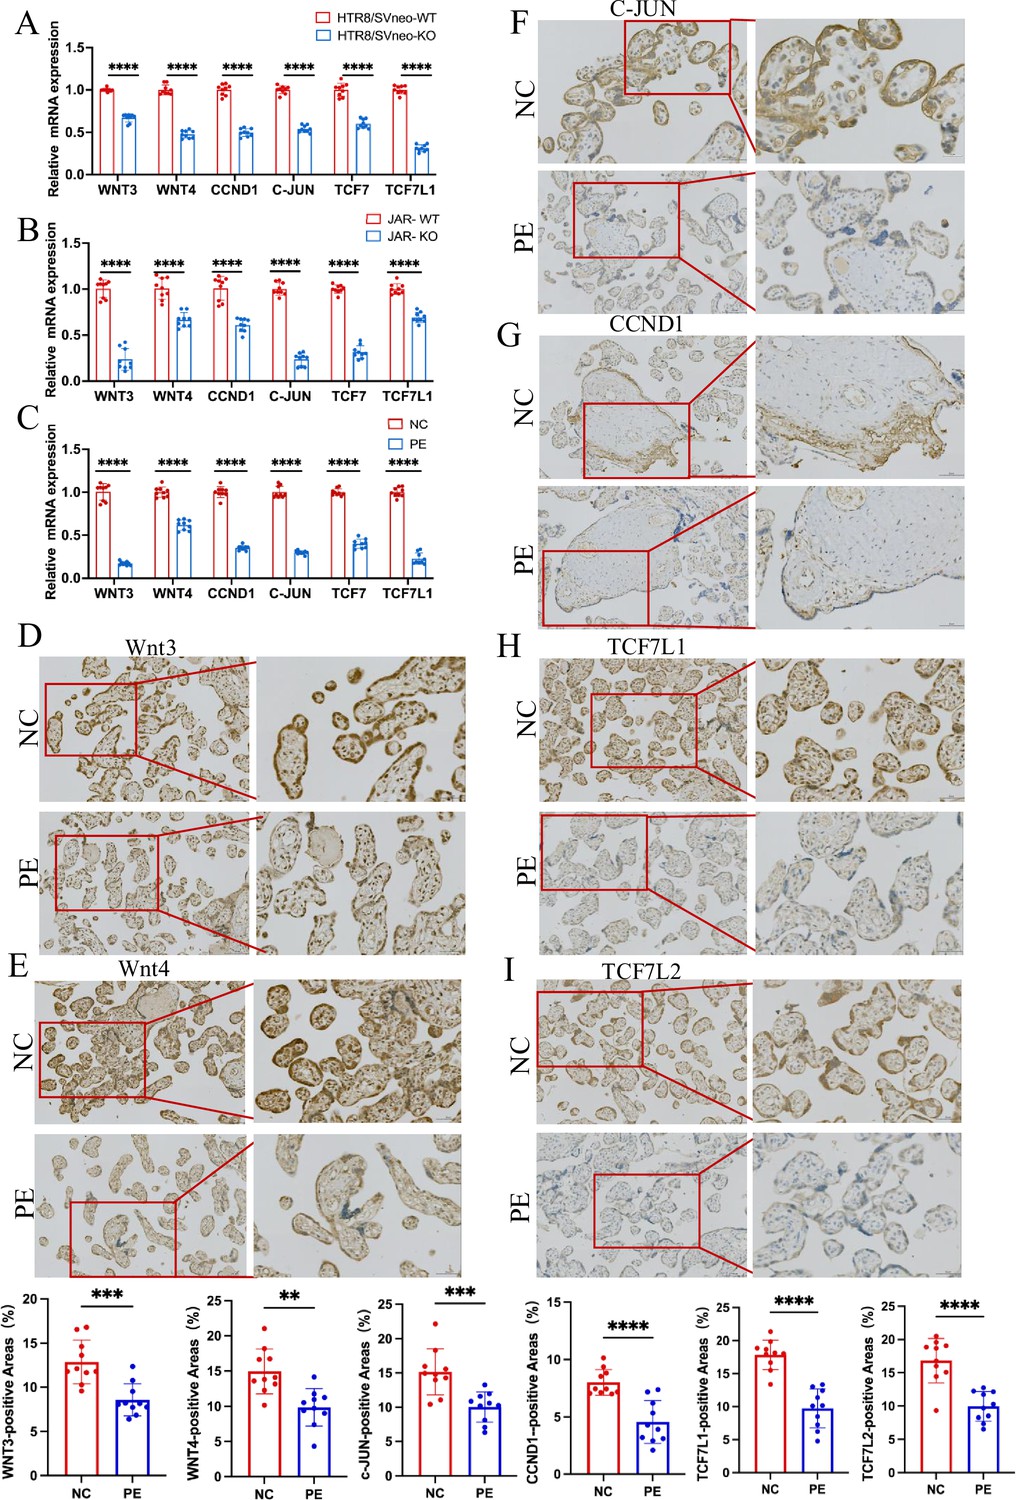
RT-PCR and immunohistochemistry validated that ACVR2A modulates cellular behavior via the TCF7/c-JUN pathway.
(A) RT-qPCR analysis of differentially expressed genes (DEGs) (Wnt3, Wnt4, TCF7, TCF7L1, CCND1, and c-JUN) expression enriched in Wnt/TCF pathway following HTR8/SVneo ACVR2A knockout. (B) RT-qPCR analysis of DEGs (Wnt3, Wnt4, TCF7, TCF7L1, CCND1, and c-JUN) expression enriched in Wnt/TCF pathway following JAR ACVR2A knockout. (C) RT-qPCR analysis of DEGs (Wnt3, Wnt4, TCF7, TCF7L1, CCND1, and c-JUN) expression enriched in Wnt/TCF pathway expression in the placenta of normal control pregnant women (NC) and patients with pre-eclampsia (PE). (D-I) Immunohistochemical staining of normal control pregnant women and PE placentas using rabbit IgG anti-human Wnt3, Wnt4, TCF7L1, TCF7L2, CCND1, and c-JUN antibody. Sections were counterstained with hematoxylin, and positive cells were quantified using ImageJ software (**p < 0.01; ***p < 0.001;****p < 0.0001).
Figure 7
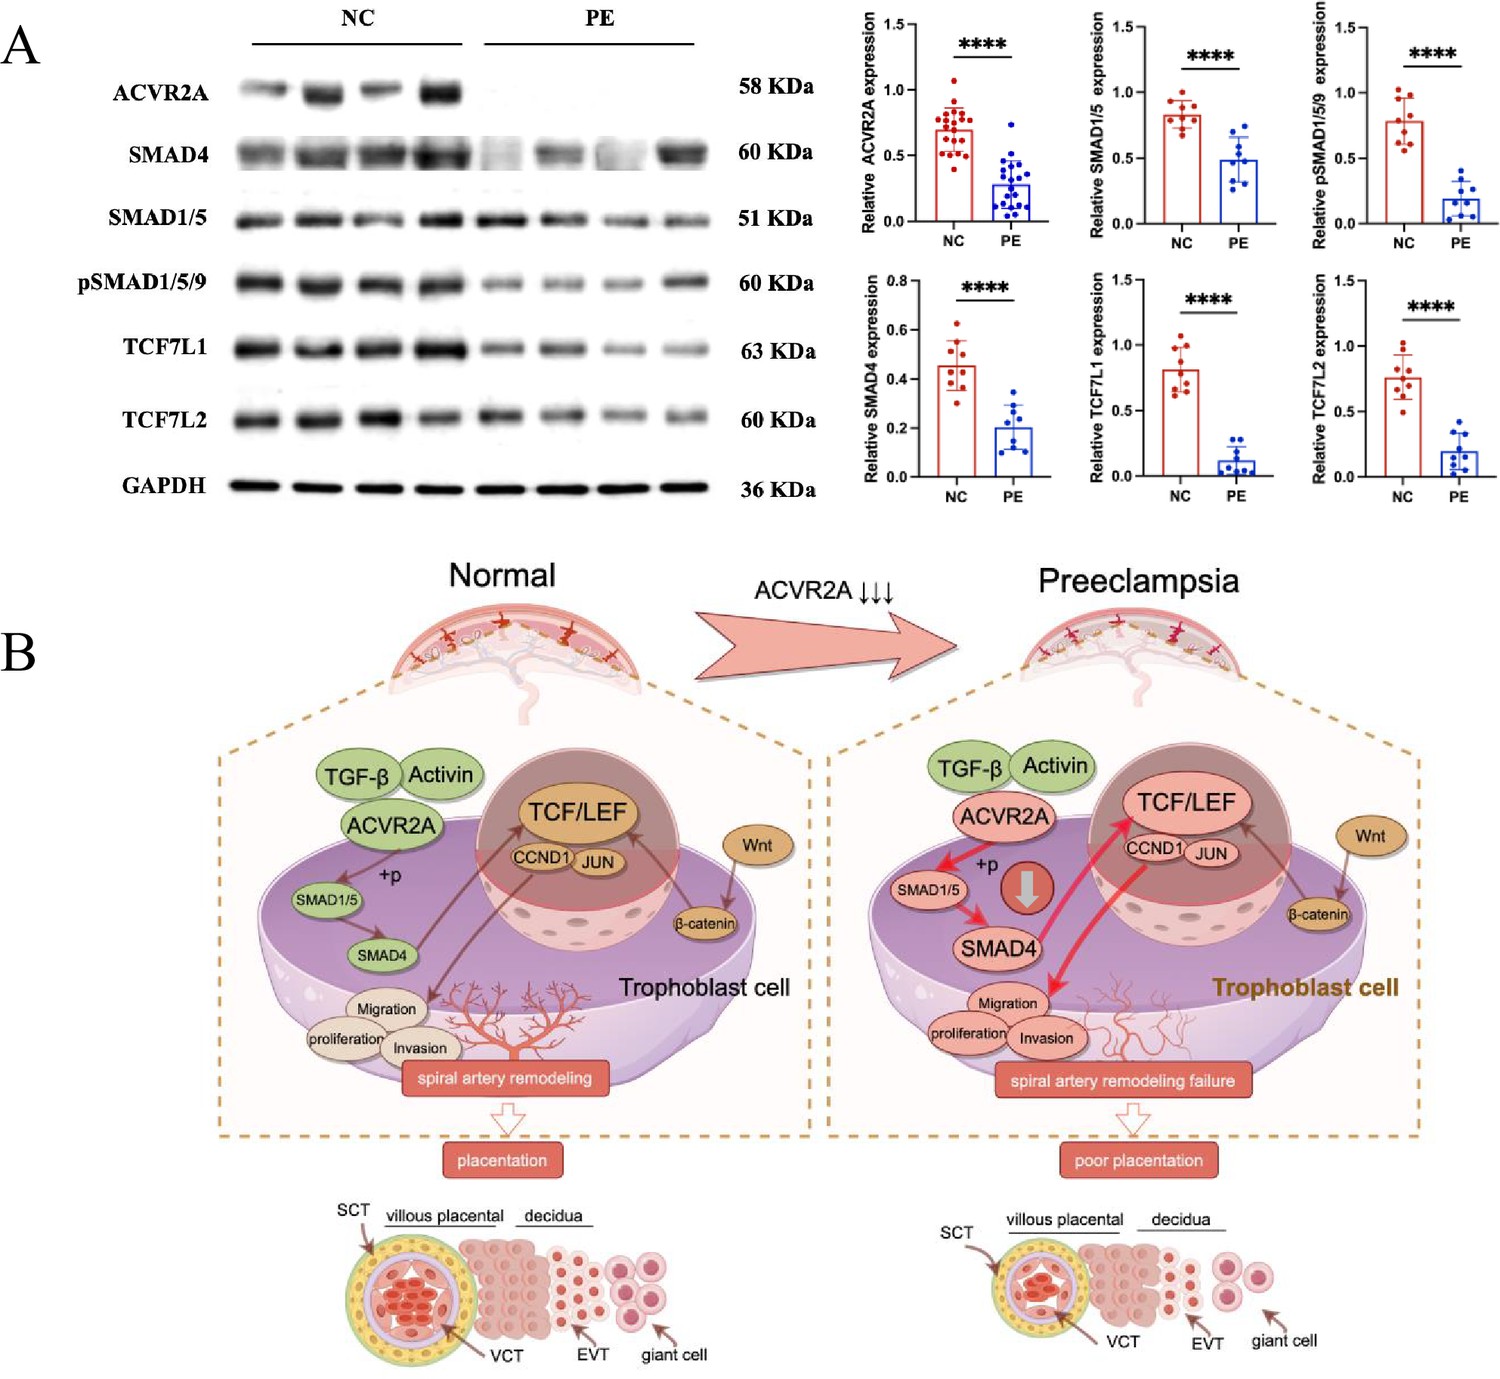
Reduced ACVR2A expression impairs SMAD and TCF7/c-JUN signaling in pre-eclampsia, leading to abnormal trophoblast function.
(A) Western blot analysis showing reduced expression of ACVR2A, SMAD4, SMAD1/5, pSMAD1/5/9, TCF7L1, and TCF7L2 in PE placental tissues compared to normotensive controls. GAPDH was used as a loading control. Densitometric analysis quantifying protein expression levels is shown in the accompanying bar graphs. Data are presented as mean ± SD (n = 10 for each group). Statistical significance was determined using a two-tailed Student’s t-test (****p < 0.0001). (B) Schematic illustration of the proposed mechanisms by which ACVR2A regulates trophoblast cell function in normal and pre-eclampsia conditions. (Colors: green indicates normal conditions and functional pathways, while red highlights abnormalities or disrupted pathways in pre-eclampsia. Arrows: solid dark brown arrows: normal signaling pathways and interactions. Bold red arrows: disrupted or abnormal signaling pathways in pre-eclampsia.) In normal placentas, ACVR2A activates the SMAD1/5-SMAD4 axis, promoting trophoblast invasion, migration, and spiral artery remodeling via the TCF7/c-JUN pathway. In pre-eclampsia, reduced ACVR2A expression impairs SMAD signaling, leading to downregulation of TCF7 and its downstream targets (e.g., CCND1 and JUN), contributing to poor placentation. (draw by FigDraw).
-
Figure 7—source data 1
Original data related to Figure 7A western blot (labelled).
- https://cdn.elifesciences.org/articles/101236/elife-101236-fig7-data1-v1.zip
-
Figure 7—source data 2
Original data related to Figure 7A western blot.
- https://cdn.elifesciences.org/articles/101236/elife-101236-fig7-data2-v1.zip
-
Figure 7—source data 3
Original data related to Figure 7A western blot.
- https://cdn.elifesciences.org/articles/101236/elife-101236-fig7-data3-v1.zip
Tables
Table 1
ACVR2A gene polymorphisms and pre-eclampsia risk summary.
| Study participants | Associated SNPs | p-value | OR | Nature of variant (s) | Reference |
|---|---|---|---|---|---|
| 150 PE cases and 175 controls; Philippine women | rs1014064 | 0.556 | 0.8699 | Intronic | Amosco et al., 2019 |
| rs2161983 | 0.4717 | 0.8921 | Intronic | ||
| Rs1014064, Age, BMI | 0.005 | Intronic | |||
| 443 PE cases and 693 controls; Brazil women; association with early-onset pre-eclampsia found after grouping in accordance to gestational age at delivery | rs1424954 | 0.002 | 1.86 | Promoter region | Ferreira et al., 2015 |
| rs1014064 | 0.004 | 1.77 | Intronic | ||
| rs2161983 | 0.008 | 1.70 | Intronic | ||
| rs3768687 | 0.039 | 1.52 | Intronic | ||
| 176 PE cases, 20 eclampsia and 90 controls; Australian/New Zealand women | rs10497025 | 0.025 | Intronic | Fitzpatrick et al., 2009 | |
| rs13430086 | 0.010 | 3′UTR | |||
| LF004 | 0.018 | Intronic | |||
| LF013 | 0.018 | Intronic | |||
| LF020 | 0.018 | Intronic | |||
| 1139 PE cases and 2269 controls; Norwegian women | rs1014064 | 0.0184 | 0.86 | Intronic | Roten et al., 2009 |
| rs17742134 | 0.0214 | 1.17 | Intronic | ||
| rs1424941 | 0.0171 | 1.18 | Intronic | ||
| rs2161983 | 0.0196 | 0.86 | Intronic | ||
| rs3768687 | 0.0214 | 0.86 | Intronic | ||
| rs3764955 | 0.0327 | 0.87 | Intronic | ||
| 121 PE cases and 71 controls; Australian/New Zealand women | rs1424954 | 0.007 | Promoter region | Moses et al., 2006 | |
| rs1364658 | 0.04 | Intronic | |||
| rs1895694 | 0.05 | Intronic | |||
| 140 PE cases and 380 controls; Northern Chinese women | rs1424954 | 0.013 | 0.687 | Promoter region | Yanan et al., 2020 |
| rs1014064 | 0.016 | 0.693 | Intronic | ||
| rs1128919 | 0.018 | 0.536 | Synonymous | ||
| rs3768687 | 0.019 | 0.701 | Intronic | ||
| rs3764955 | 0.024 | 1.784 | Intronic | ||
| rs13430086 | 0.029 | 0.729 | 3′UTR | ||
| 94 PE cases and 116 controls; Turkish women | rs1128919 | 0.02 | 0.44 | Synonymous | Zeybek et al., 2013 |
| rs13430086 | 0.02 | 0.28 | 3′UTR | ||
| rs10497025 | 0.025 | 0.010 | Intronic |
Additional files
-
Supplementary file 1
Clinical characteristics of pre-eclamptic and normal control pregnancies.
- https://cdn.elifesciences.org/articles/101236/elife-101236-supp1-v1.docx
-
Supplementary file 2
Sequences of the primers for RT-qPCR.
- https://cdn.elifesciences.org/articles/101236/elife-101236-supp2-v1.docx
-
Supplementary file 3
Sequences of the genotyping primers.
- https://cdn.elifesciences.org/articles/101236/elife-101236-supp3-v1.docx
-
Supplementary file 4
Details of immunohistochemical antibodies.
- https://cdn.elifesciences.org/articles/101236/elife-101236-supp4-v1.docx
-
MDAR checklist
- https://cdn.elifesciences.org/articles/101236/elife-101236-mdarchecklist1-v1.docx
Download links
A two-part list of links to download the article, or parts of the article, in various formats.
Downloads (link to download the article as PDF)
Open citations (links to open the citations from this article in various online reference manager services)
Cite this article (links to download the citations from this article in formats compatible with various reference manager tools)
ACVR2A facilitates trophoblast cell invasion through TCF7/c-JUN pathway in pre-eclampsia progression
eLife 14:RP101236.
https://doi.org/10.7554/eLife.101236.3


