S100a4+ alveolar macrophages accelerate the progression of precancerous atypical adenomatous hyperplasia by promoting the angiogenic function regulated by fatty acid metabolism
- Institute of Clinical Pathology, Key Laboratory of Transplantation Engineering and Immunology, Ministry of Health, West China Hospital, Sichuan University, China
- Institute of Respiratory Health, Frontiers Science Center for Disease-related Molecular Network, West China Hospital, Sichuan University, China
- College of Computer Science, Sichuan University, China
- State Key Laboratory of Respiratory Health and Multimorbidity, West China Hospital, Sichuan University, China
- Department of Pathology, West China Hospital, Sichuan University, China
- Department of Pulmonary and Critical Care Medicine, West China Hospital, Sichuan University, China
- Precision Medicine Key Laboratory of Sichuan Province, West China Hospital, Sichuan University, China
- Key Laboratory of Systems Health Science of Zhejiang Province, Hangzhou Institute for Advanced Study, University of Chinese Academy of Sciences, China
Figures
Figure 1 with 1 supplement
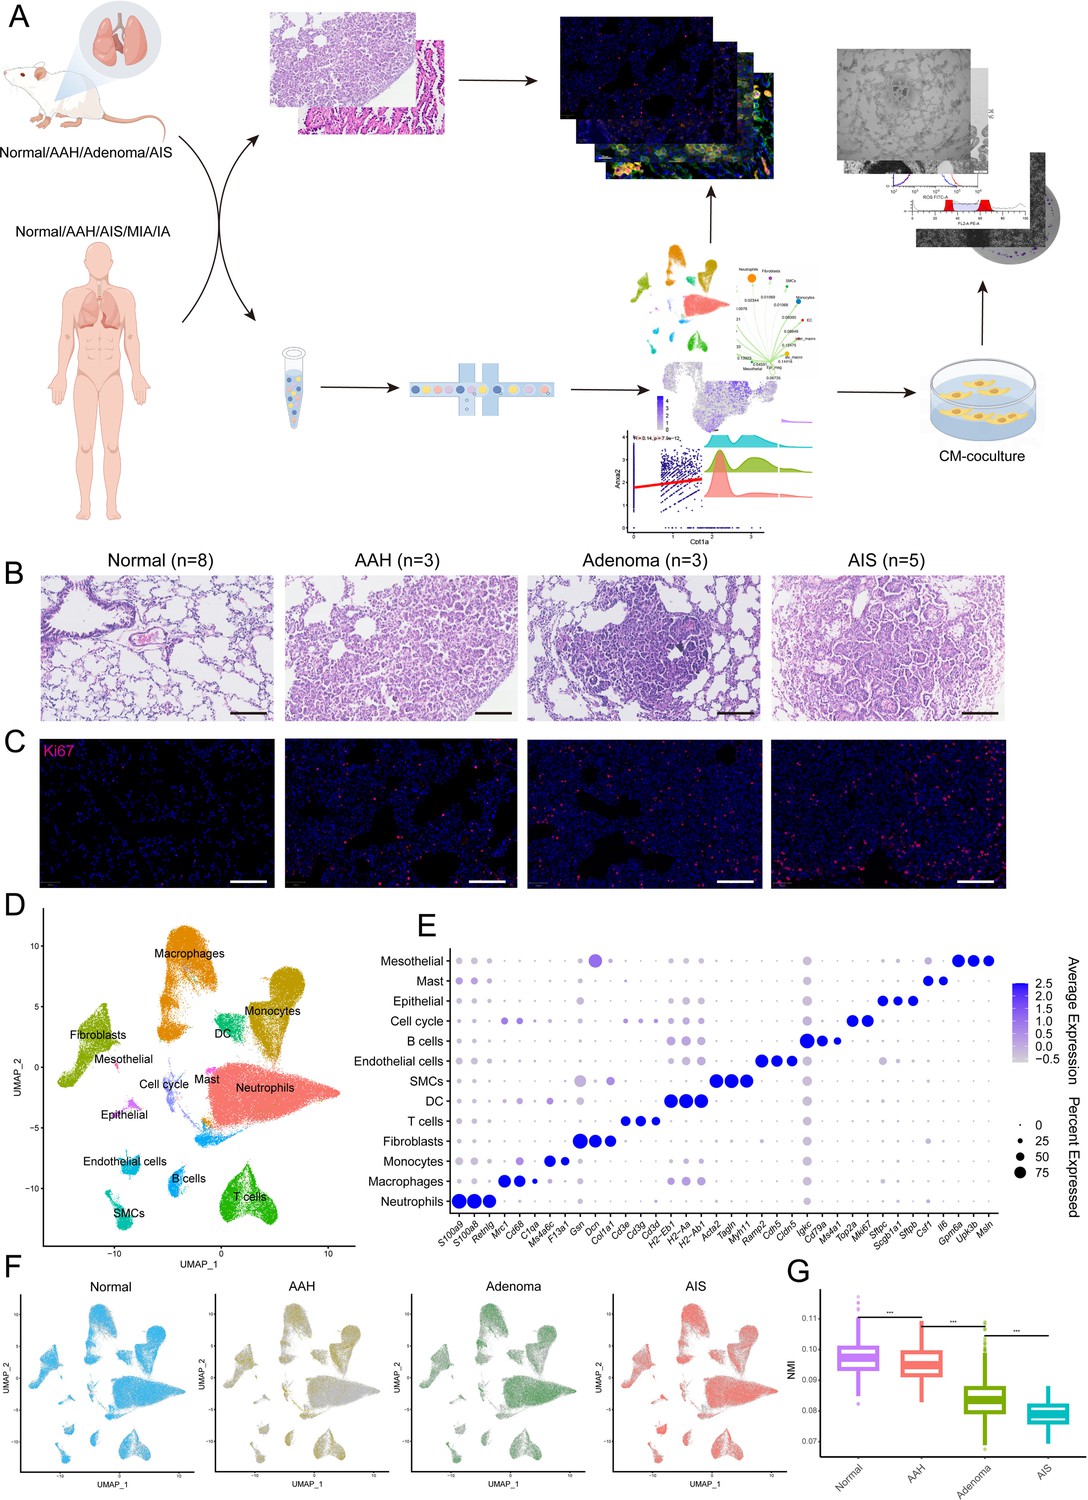
Histopathological grading and single-cell transcriptome profiles of mouse lung adenocarcinoma (LUAD) precancerous lesions.
(A) Analysis and experimental flow chart of this study. (B) Hematoxylin and eosin (H&E) images of normal tissue and three stages of precancerous lesions (AAH, adenoma, and AIS) in mice. Scale bar: 100 µm. (C) Immunofluorescence staining of Ki67 at the four histopathological stages. Scale bar: 100 µm. (D) Uniform Manifold Approximation and Projection (UMAP) plot of 13 cell types from mouse single-cell RNA sequencing (scRNA-seq) data. (E) Dotplot of marker genes in all cell types. (F) Cell distribution at the four stages. (G) Reduced transcriptional homogeneity with progression of precancerous lesions. Transcriptional heterogeneity between cells is inversely proportional to normalized mutual information (NMI). AAH: atypical adenomatous hyperplasia; AIS: adenocarcinoma in situ; MIA: minimally invasive adenocarcinoma; IA: invasive adenocarcinoma; CM: conditioned medium; DC: dendritic cell; SMC: smooth muscle cell; ***p<0.001.
Figure 1—figure supplement 1

Quality assessment and cell fraction analysis of mouse single-cell RNA sequencing (scRNA-seq) data.
(A) The number of cells in each sample that passed quality control (QC) and were retained for all further analyses. (B) The distribution of the number of detected genes after QC filtering in the cells across samples. (C) Fraction of cells from each cell type across the four stages. (D) Fraction of cells from each cell type in each sample.
Figure 2 with 1 supplement
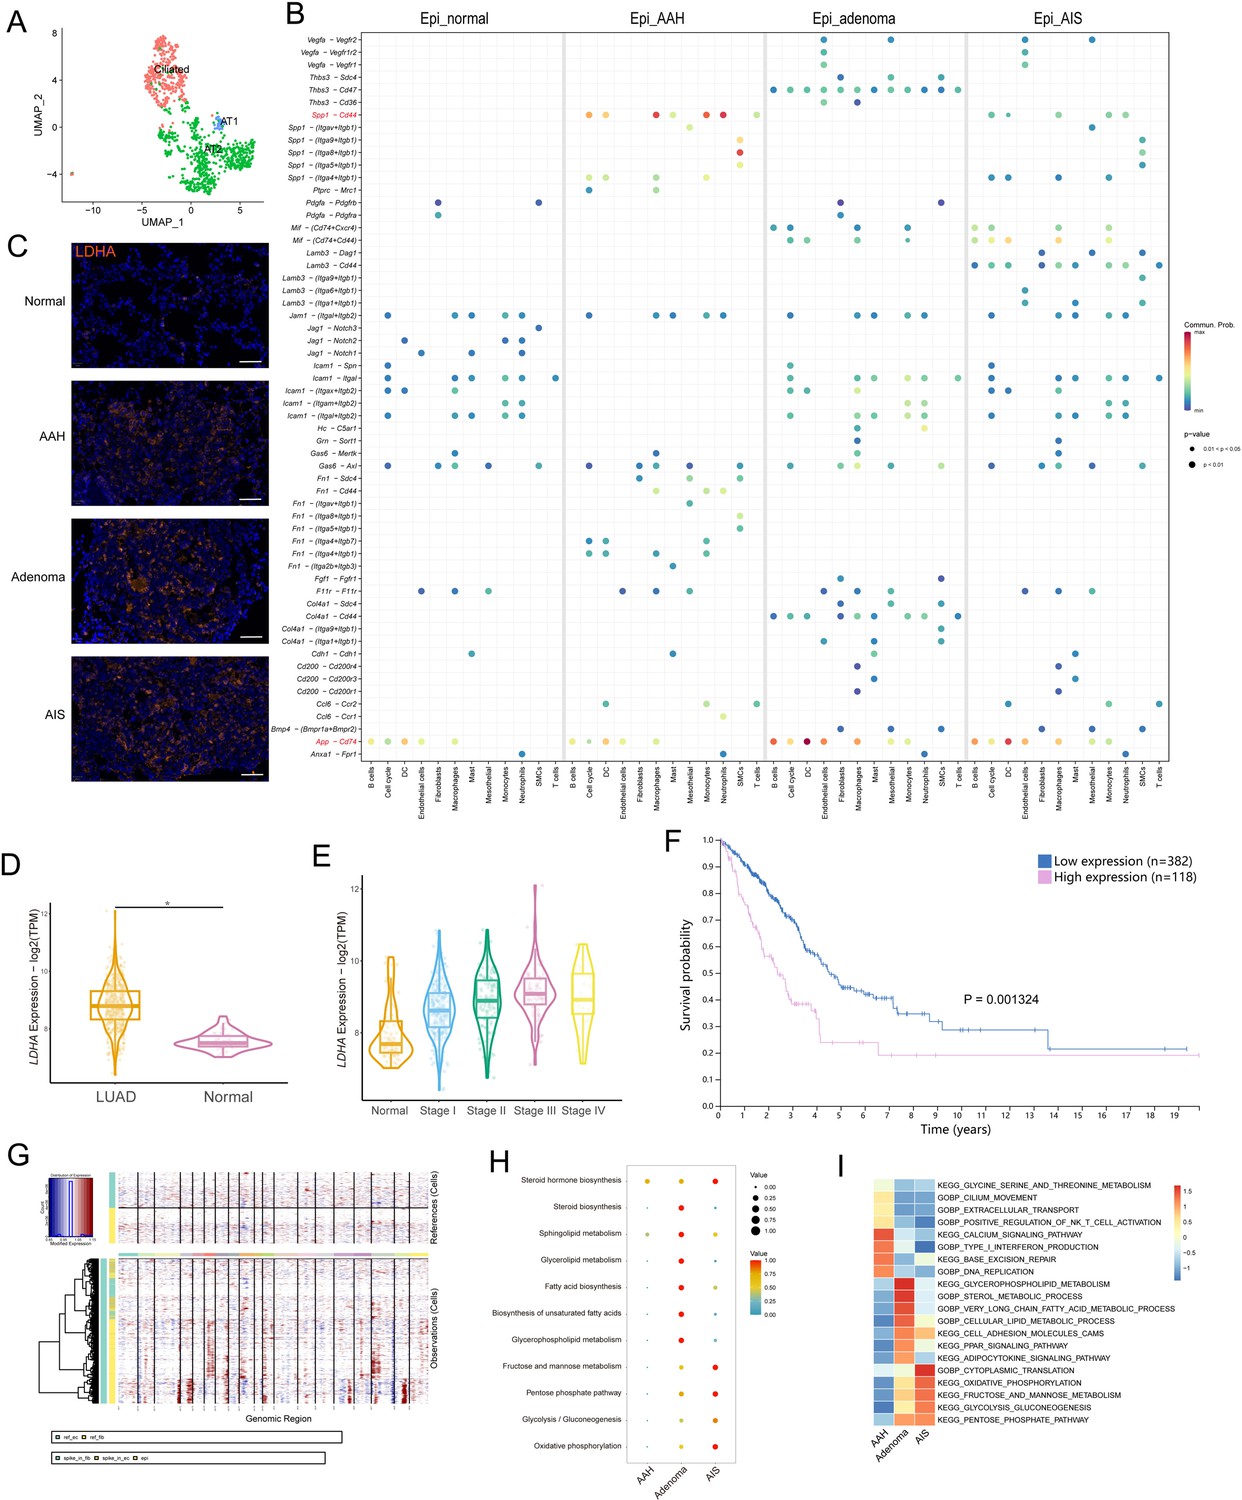
Identification of initiation-associated epithelial marker Ldha and analysis of malignant epithelial cells.
(A) Uniform Manifold Approximation and Projection (UMAP) plot of epithelial cell subtypes. (B) Dotplot showing the significance (p-value) and strength (communication probability) of specific interactions between epithelial cells and other cell types at the four stages. Data was obtained by Cell Chat analysis. (C) Immunofluorescence staining of LDHA at the four stages. Scale bar: 50 µm. (D) LDHA expression in LUAD and normal tissues from the The Cancer Genome Atlas (TCGA) database. (E) LDHA expression in stage I-IV LUAD and normal tissues from the TCGA database. (F) Correlation of LDHA expression with overall survival of LUAD patients in the TCGA database. (G) Copy number variations (CNVs) (red, amplifications; blue, deletions) across the chromosomes (columns) inferred from the single-cell RNA sequencing (scRNA-seq) of each epithelial cell (rows). (H) scMetabolism analysis of malignant epithelial cells at precancerous stages. (I) Gene Set Variation Analysis (GSVA) enrichment analysis of malignant epithelial cells at precancerous stages. AT1/2: type I/II alveolar epithelial cells; LUAD: lung adenocarcinoma; *p<0.05.
Figure 2—figure supplement 1

Single-cell metabolic state clustering.
(A) Uniform Manifold Approximation and Projection (UMAP) plot showing 16 metabolic clusters of mouse single-cell RNA sequencing (scRNA-seq) data. (B) Cell types corresponding to (A). (C) Metabolic pathway activity analysis for each cluster. (D) Heatmap of potential initiation-associated epithelial DEGs. (E) UMAP plot of malignant epithelial cells inferred by copy number variation (CNV) analysis.
Figure 3 with 1 supplement
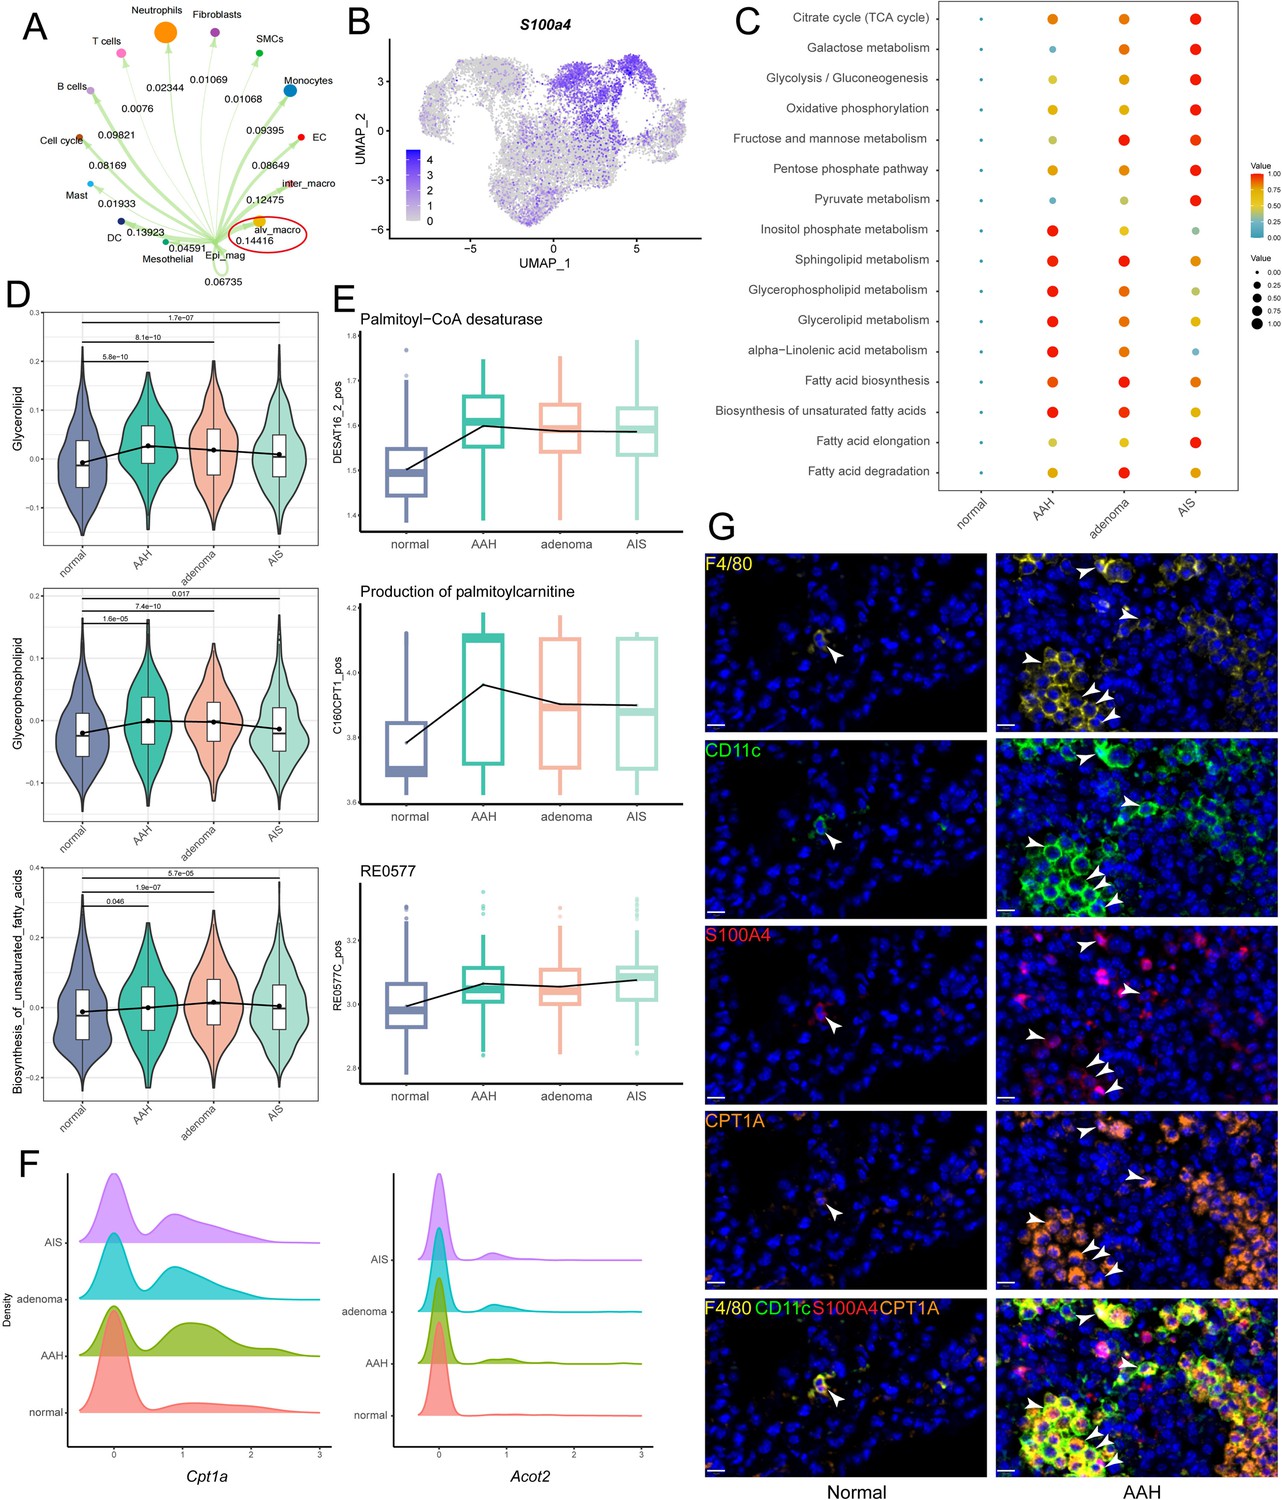
S100a4+ alv-macro was active in lipid metabolism at the adenomatous hyperplasia (AAH) stage.
(A) Malignant epithelial cells showed the strongest communication weight with alveolar macrophages, as shown by Cell Chat analysis. (B) Uniform Manifold Approximation and Projection (UMAP) plot of S100a4 expression in alveolar macrophages. (C) scMetabolism analysis of S100a4+ alv-macro at the four stages. (D) Changes in scores of representative lipid metabolism-related gene sets across the four stages. (E) Compass analysis showing the reaction activities of fatty acid metabolism across the four stages. (F) Density plots of Cpt1a and Acot2 at the four stages. The x-axis represents the gene expression level, and the y-axis represents the density of numbers of cells. (G) Multiplex immunofluorescence validation of F4/80+/CD11c+/S100A4+ alv-macro in mouse normal and AAH tissues and comparison of tissue expression of CPT1A in this subpopulation. Scale bar: 10 µm. EC: endothelial cell.
Figure 3—figure supplement 1

Identification of S100a4+ alv-macro.
(A) Cell chat analysis of malignant epithelial cells and other cell types. (B) Uniform Manifold Approximation and Projection (UMAP) plot of macrophage subtypes. (C) UMAP plots of selected marker genes for alveolar macrophage (Itgax and Siglecf) and interstitial macrophage (Itgam and Cx3cr1). (D) Alveolar macrophage showing the highest correlation coefficient of 0.68 with malignant epithelial cell, as shown by Spearman’s correlation analysis. (E) Heatmap of DEGs in four subsets of alveolar macrophage. (F) UMAP plot of four subsets of alveolar macrophage. (G) UMAP plot of all cell types including alveolar macrophage and interstitial macrophage. (H) UMAP plots of selected marker genes for macrophage (Adgre1) and alveolar macrophage (Itgax).
Figure 4 with 1 supplement
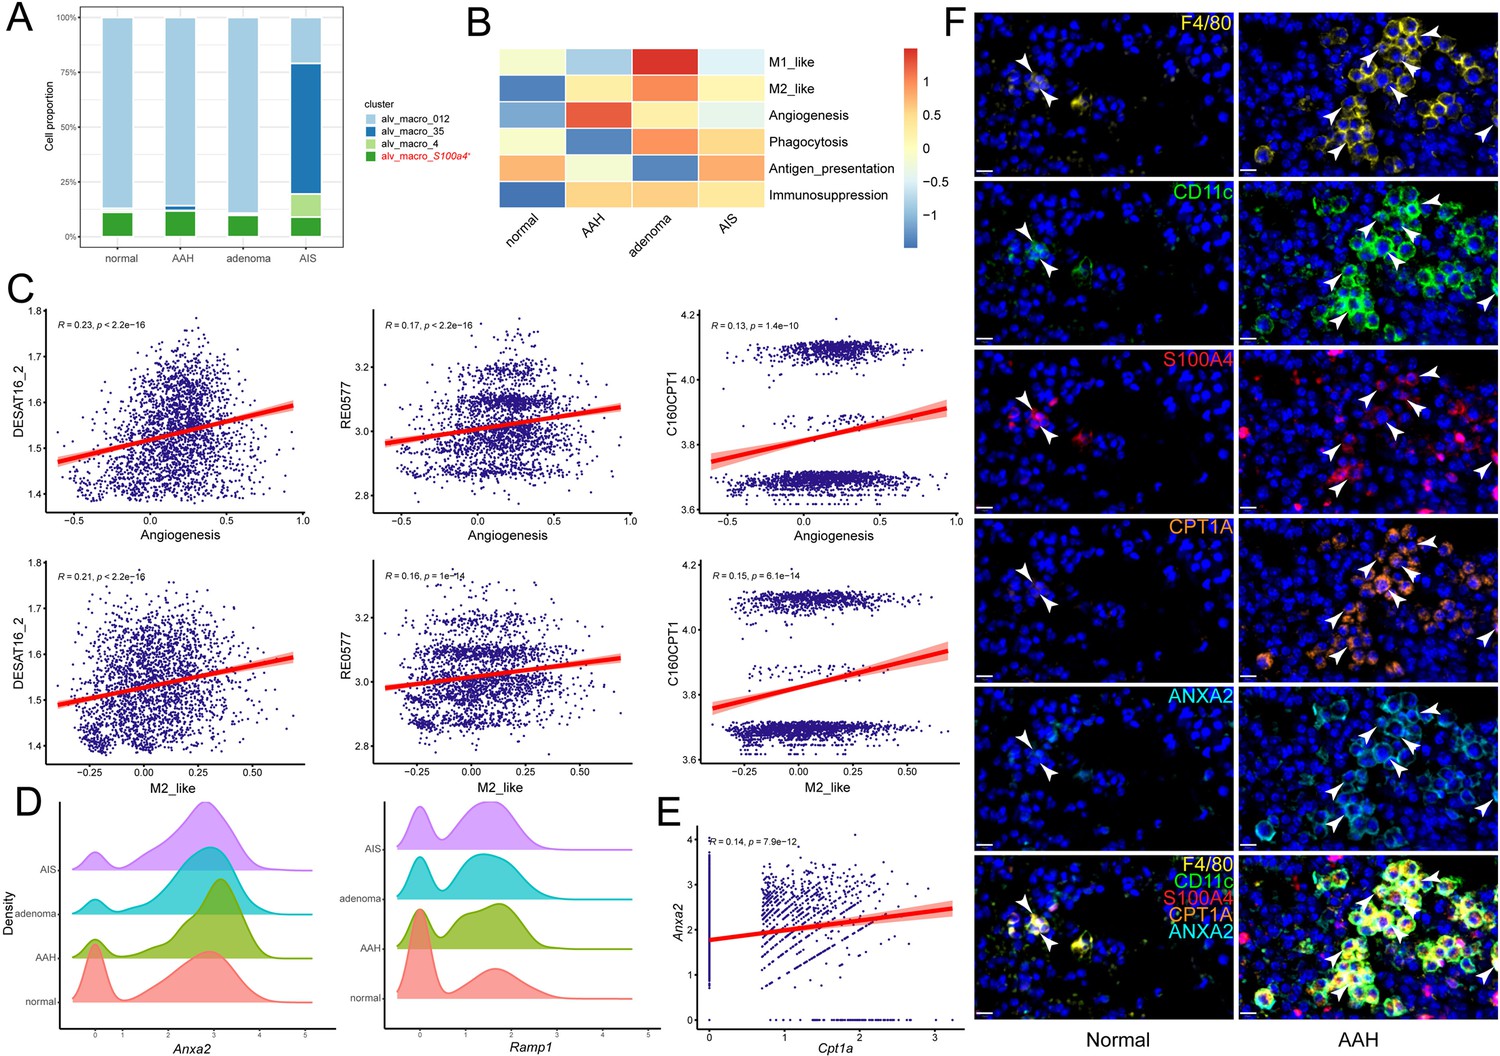
The pro-angiogenic function of S100a4+ alv-macro was related to fatty acid metabolism.
(A) Cell proportion comparison of S100a4+ alv-macro in alveolar macrophages. (B) Macrophage functional program analysis of S100a4+ alv-macro across the four stages. (C) Pearson correlation analysis of angiogenesis and M2-like function with fatty acid metabolic reactions in S100a4+ alv-macro. (D) Density plots of Anxa2 and Ramp1 at the four stages. (E) Correlation analysis of Cpt1a and Anxa2 expression in S100a4+ alv-macro. (F) Multiplex immunofluorescence validation of the correlation between CPT1A and ANXA2 expression in F4/80+/CD11c+/S100A4+ alv-macro of mouse normal and AAH tissues. Scale bar: 10 µm.
Figure 4—figure supplement 1

Correlation analysis between lipid metabolism and macrophage functions in S100a4+ alv-macro.
(A) Cell proportion of S100a4+ alv-macro in macrophages. (B) Pearson correlation analysis of lipid metabolism and well-known macrophage functions (phagocytosis, antigen presentation, angiogenesis, immunosuppression, and M2-like polarization).
Figure 5 with 1 supplement
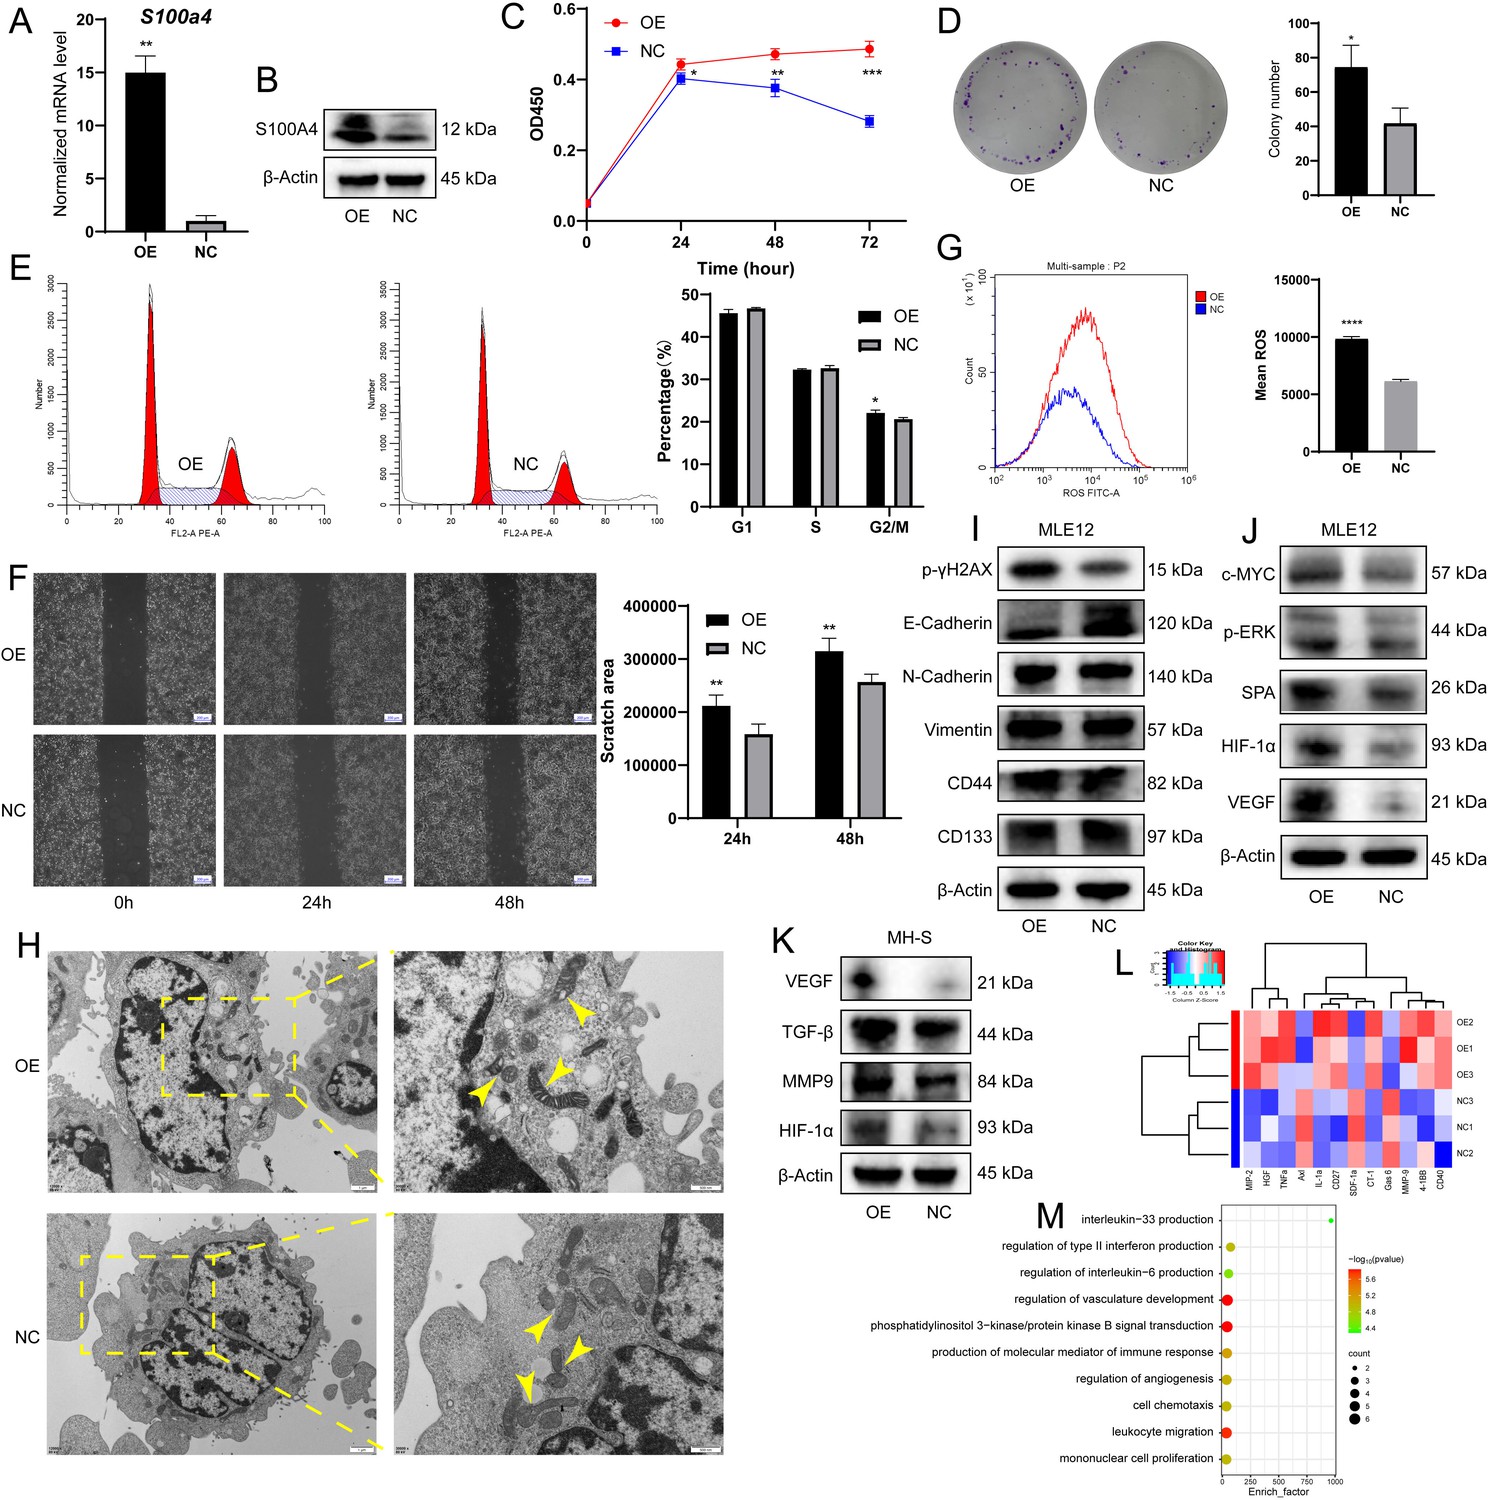
S100a4-OE MH-S promoted malignant transformation of MLE12 epithelial cells in vitro.
(A) S100a4 mRNA expression level in MH-S after transfection, n = 5. (B) S100A4 protein expression level in MH-S after transfection. (C) CCK8 assay showing cell proliferation of MLE12 after coculture with S100a4-OE MH-S, n = 6. (D) Colony-forming ability of MLE12 after coculture, as shown by the colony formation assay, n = 3. (E) Cell cycle distribution of MLE12 after coculture, as shown by cell cycle analysis, n = 3. (F) Wound healing assay showing cell migration of MLE12 after coculture, n = 3. Scale bar: 200 µm. (G) Intracellular ROS level of MLE12 after coculture, n = 3. (H) Transmission electron microscopy showing the morphological changes of mitochondria in MLE12 after coculture. Scale bar: 1 µm and 500 nm. (I) Western blotting of DNA damage marker p-γH2AX, EMT markers (E-Cadherin, N-Cadherin, and Vimentin), and stem-like markers (CD44 and CD133) in MLE12 after coculture. (J) Western blotting of tumorigenesis-associated proteins (c-MYC, p-ERK, SPA, VEGF, and HIF-1α) in MLE12 after coculture. (K) Western blotting of macrophage pro-tumor indicators (VEGF, MMP9, TGF-β, and HIF-1α) in S100a4-OE MH-S. (L) Heatmap of cytokine assay for differential factors secreted after MH-S transfection. (M) Enrichment analysis of GO biological processes for differential factors. The results shown above represent three or more replicates. OE: overexpression; NC: negative control; ROS: reactive oxygen species; *p<0.05, **p<0.01, ***p<0.001, ****p<0.0001.
-
Figure 5—source data 1
PDF file containing original western blots for Figure 5B, indicating the relevant bands.
- https://cdn.elifesciences.org/articles/101731/elife-101731-fig5-data1-v1.zip
-
Figure 5—source data 2
Original files for western blot analysis displayed in Figure 5B.
- https://cdn.elifesciences.org/articles/101731/elife-101731-fig5-data2-v1.zip
-
Figure 5—source data 3
PDF file containing original western blots for Figure 5I, indicating the relevant bands.
- https://cdn.elifesciences.org/articles/101731/elife-101731-fig5-data3-v1.zip
-
Figure 5—source data 4
Original files for western blot analysis displayed in Figure 5I.
- https://cdn.elifesciences.org/articles/101731/elife-101731-fig5-data4-v1.zip
-
Figure 5—source data 5
PDF file containing original western blots for Figure 5J, indicating the relevant bands.
- https://cdn.elifesciences.org/articles/101731/elife-101731-fig5-data5-v1.zip
-
Figure 5—source data 6
Original files for western blot analysis displayed in Figure 5J.
- https://cdn.elifesciences.org/articles/101731/elife-101731-fig5-data6-v1.zip
-
Figure 5—source data 7
PDF file containing original western blots for Figure 5K, indicating the relevant bands.
- https://cdn.elifesciences.org/articles/101731/elife-101731-fig5-data7-v1.zip
-
Figure 5—source data 8
Original files for western blot analysis displayed in Figure 5K.
- https://cdn.elifesciences.org/articles/101731/elife-101731-fig5-data8-v1.zip
Figure 5—figure supplement 1

S100a4-knockdown MH-S did not promote the malignant transformation of MLE12 epithelial cells in vitro.
(A) S100a4 mRNA expression level in MH-S after siRNA transfection, n = 5. (B) S100A4 protein expression level in MH-S after siRNA transfection. (C) CCK8 assay of MLE12 after coculture with S100a4-knockdown MH-S, n = 6. (D) Wound healing assay of MLE12 after coculture, n = 3. Scale bar: 200 µm. (E) Intracellular reactive oxygen species (ROS) level of MLE12 after coculture, n = 3. The results shown above represent three or more replicates. **p<0.01, ****p<0.0001, ns: not significant.
-
Figure 5—figure supplement 1—source data 1
PDF file containing original western blots for Figure 5—figure supplement 1B, indicating the relevant bands.
- https://cdn.elifesciences.org/articles/101731/elife-101731-fig5-figsupp1-data1-v1.zip
-
Figure 5—figure supplement 1—source data 2
Original files for western blot analysis displayed in Figure 5—figure supplement 1B.
- https://cdn.elifesciences.org/articles/101731/elife-101731-fig5-figsupp1-data2-v1.zip
Figure 6
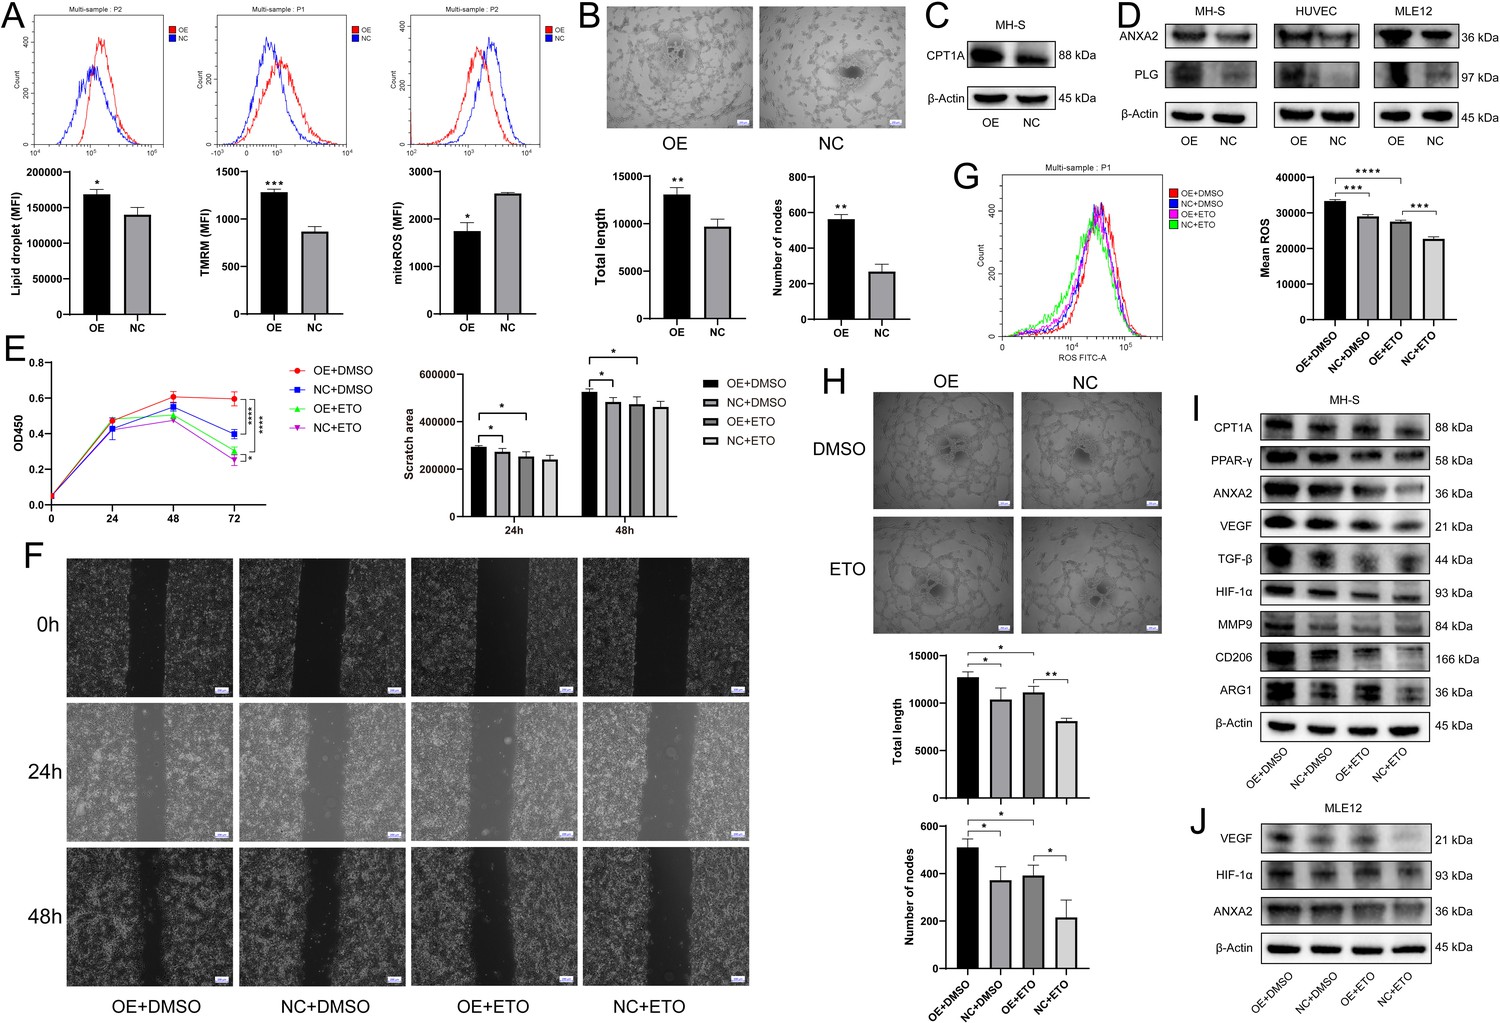
S100a4-OE MH-S controlled pro-angiogenic and pro-tumorigenic functions through Cpt1a induction.
(A) Determination of intracellular lipid droplet accumulation, mitochondrial membrane potential, and mitochondrial reactive oxygen species (ROS) by flow cytometry, n = 3. (B) Tube formation of human umbilical vein endothelial cells (HUVECs) after coculture with S100a4-OE MH-S, quantified by total tube length and number of nodes, n = 5. Scale bar: 200 µm. (C) Western blotting of fatty acid metabolism-related CPT1A in S100a4-OE MH-S. (D) Western blotting of ANXA2 and PLG in S100a4-OE MH-S and cocultured HUVEC and MLE12. (E) CCK8 assay of cocultured MLE12 after treatment of ETO to S100a4-OE MH-S, n = 6. (F) Wound healing assay of cocultured MLE12 after treatment of ETO to S100a4-OE MH-S, n = 3. Scale bar: 200 µm. (G) Intracellular ROS production of cocultured MLE12 after treatment of ETO to S100a4-OE MH-S, n = 3. (H) Tube formation of cocultured HUVECs after treatment of ETO to S100a4-OE MH-S, n = 3. Scale bar: 200 µm. (I) Western blotting of fatty acid metabolism-related proteins (CPT1A and PPAR-γ), angiogenesis-related proteins (ANXA2, VEGF, TGF-β, HIF-1α, and MMP9), and M2 polarization markers (CD206 and ARG1) in S100a4-OE MH-S after treatment of ETO. (J) Western blotting of angiogenesis-related proteins (ANXA2, VEGF, and HIF-1α) in cocultured MLE12 after treatment of ETO to S100a4-OE MH-S. The results shown above represent three or more replicates. MFI: mean fluorescence intensity; ETO: etomoxir; *p<0.05, **p<0.01, ***p<0.001, ****p<0.0001.
-
Figure 6—source data 1
PDF file containing original western blots for Figure 6C, indicating the relevant bands.
- https://cdn.elifesciences.org/articles/101731/elife-101731-fig6-data1-v1.zip
-
Figure 6—source data 2
Original files for western blot analysis displayed in Figure 6C.
- https://cdn.elifesciences.org/articles/101731/elife-101731-fig6-data2-v1.zip
-
Figure 6—source data 3
PDF file containing original western blots for Figure 6D, indicating the relevant bands.
- https://cdn.elifesciences.org/articles/101731/elife-101731-fig6-data3-v1.zip
-
Figure 6—source data 4
Original files for western blot analysis displayed in Figure 6D.
- https://cdn.elifesciences.org/articles/101731/elife-101731-fig6-data4-v1.zip
-
Figure 6—source data 5
PDF file containing original western blots for Figure 6I, indicating the relevant bands.
- https://cdn.elifesciences.org/articles/101731/elife-101731-fig6-data5-v1.zip
-
Figure 6—source data 6
Original files for western blot analysis displayed in Figure 6I.
- https://cdn.elifesciences.org/articles/101731/elife-101731-fig6-data6-v1.zip
-
Figure 6—source data 7
PDF file containing original western blots for Figure 6J, indicating the relevant bands.
- https://cdn.elifesciences.org/articles/101731/elife-101731-fig6-data7-v1.zip
-
Figure 6—source data 8
Original files for western blot analysis displayed in Figure 6J.
- https://cdn.elifesciences.org/articles/101731/elife-101731-fig6-data8-v1.zip
Figure 7 with 1 supplement
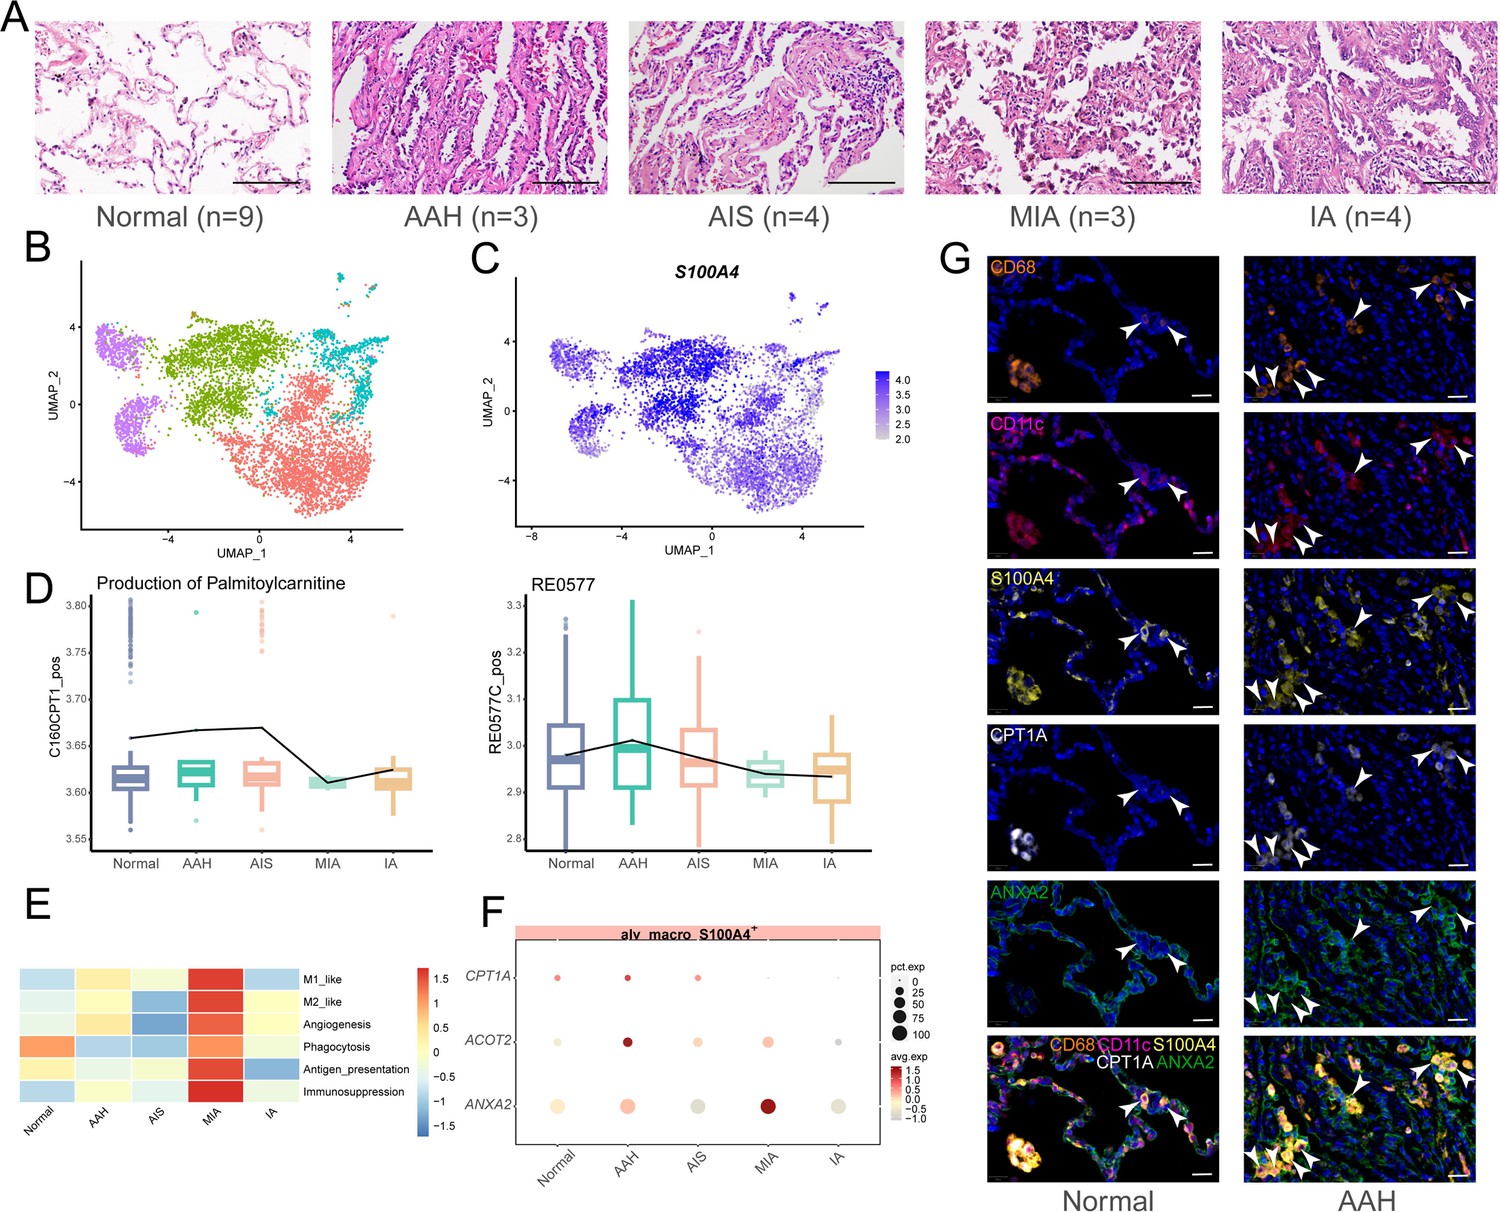
S100A4+ alv-macro with a similar pattern in the human AAH stage.
(A) H&E images of five stages of human lung adenocarcinoma (LUAD) development (normal, adenomatous hyperplasia AAH, adenocarcinoma in situ AIS, minimally invasive adenocarcinoma MIA, and invasive adenocarcinoma IA). Scale bar: 100 µm. (B) Uniform Manifold Approximation and Projection (UMAP) plot of subclusters of alveolar macrophages. (C) UMAP plot of S100A4 expression in alveolar macrophages. (D) Compass analysis of the reaction activities of fatty acid metabolism in S100A4+ alv-macro across the five stages. (E) Macrophage functional analysis of S100A4+ alv-macro across the five stages. (F) Dotplot of expression of CPT1A, ACOT2, and ANXA2 in the five stages. (G) Multiplex immunofluorescence staining of CPT1A and ANXA2 expression in CD68+/CD11c+/S100A4+ alv-macro of human normal and AAH tissues. Scale bar: 20 µm.
Figure 7—figure supplement 1

Metabolic clustering of human single-cell RNA sequencing (scRNA-seq) data and metabolic enrichment analysis of human malignant epithelial cells.
(A) Uniform Manifold Approximation and Projection (UMAP) plot showing 21 metabolic clusters of human scRNA-seq data. (B) Cell types corresponding to (A). (C) Metabolic pathway activity analysis for each cluster. (D) Copy number variations (CNVs) across the chromosomes are inferred from the human scRNA-seq of each epithelial cell. (E) Gene Set Variation Analysis (GSVA) enrichment analysis of malignant epithelial cells at four pathological stages. (F) scMetabolism analysis of malignant epithelial cells at four pathological stages.
Figure 8
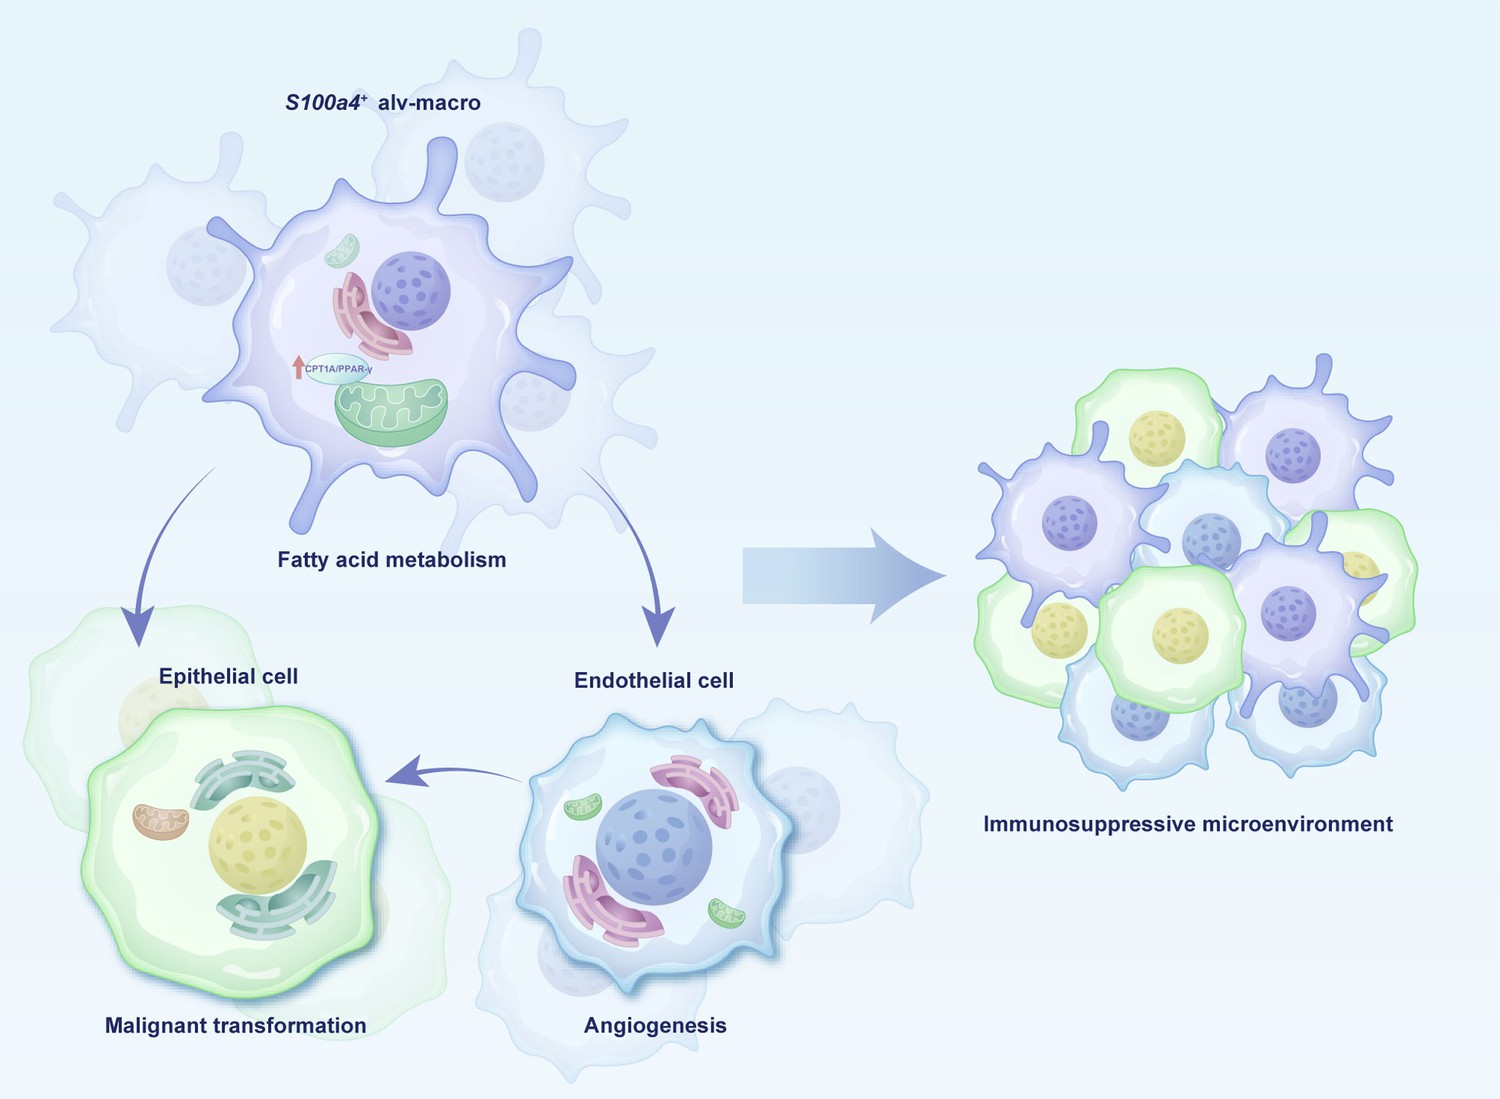
Schema of cell interactions in the precancerous microenvironment.
Additional files
-
Supplementary file 1
List of genes for macrophage functions.
- https://cdn.elifesciences.org/articles/101731/elife-101731-supp1-v1.xlsx
-
MDAR checklist
- https://cdn.elifesciences.org/articles/101731/elife-101731-mdarchecklist1-v1.docx
Download links
A two-part list of links to download the article, or parts of the article, in various formats.
Downloads (link to download the article as PDF)
Open citations (links to open the citations from this article in various online reference manager services)
Cite this article (links to download the citations from this article in formats compatible with various reference manager tools)
S100a4+ alveolar macrophages accelerate the progression of precancerous atypical adenomatous hyperplasia by promoting the angiogenic function regulated by fatty acid metabolism
eLife 13:RP101731.
https://doi.org/10.7554/eLife.101731.3


