CD131 contributes to ulcerative colitis pathogenesis by promoting macrophage infiltration
- Department of General Surgery, Shengjing Hospital of China Medical University, China
- Department of Pathology, Shengjing Hospital of China Medical University, China
- Department of Gastroenterology, Shengjing Hospital of China Medical University, China
- Department of Oncology, Capital Medical University Affiliated Beijing Friendship Hospital, China
Figures
Figure 1 with 2 supplements
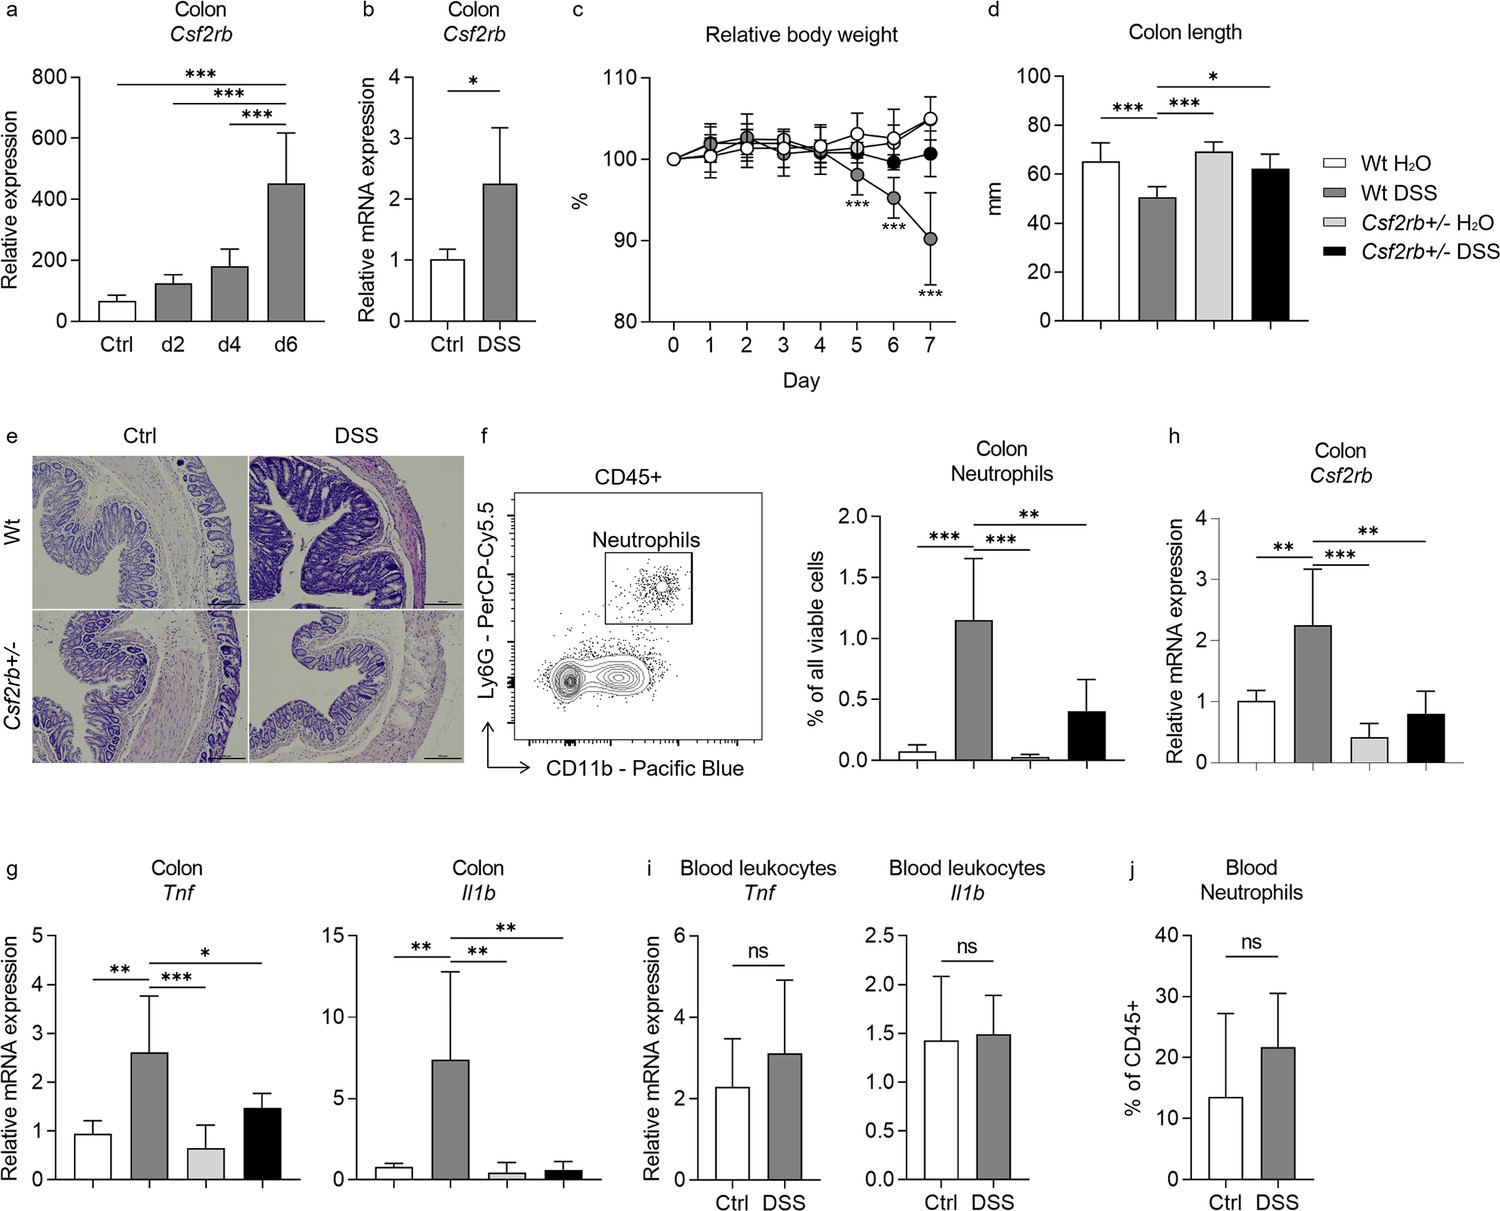
CD131 contributed to dextran sulfate sodium (DSS)-induced murine colitis.
(a) Gene expression dataset shows the change of relative Csf2rb gene expression in murine colon tissues with time after DSS administration. (b) Relative Csf2rb mRNA expression level in colon tissues of control and DSS-treated wt mice. Comparison between wt and CD131-deficient mice during steady state (administrating normal drinking water) and DSS-induced colitis, including: (c) relative body weight change; (d) colon length; (e) a group of exemplary hematoxylin and eosin (H&E) histology sections of murine colon showing inflammatory infiltration and tissue destruction; scale bars indicate 100 μm; (f) an exemplary graph showing the gating strategy for identifying CD11b+Ly6G+ neutrophils on multi-color flow cytometry and their relative cell number in the colonic tissues normalized to all viable cells; (g) relative Tnf and Il1b mRNA expression levels in colon tissues; and (h) relative Csf2rb mRNA expression level in colon tissues. (i) Relative Tnf and Il1b mRNA expression levels in blood leukocytes of control and DSS-treated wt mice. (j) Relative CD11b+Ly6G+ neutrophils in the blood of control and DSS-treated wt mice, normalized to all viable CD45+ leukocytes. ***p < 0.001; **p < 0.01; *p < 0.05; ns, not significant.
Figure 1—figure supplement 1
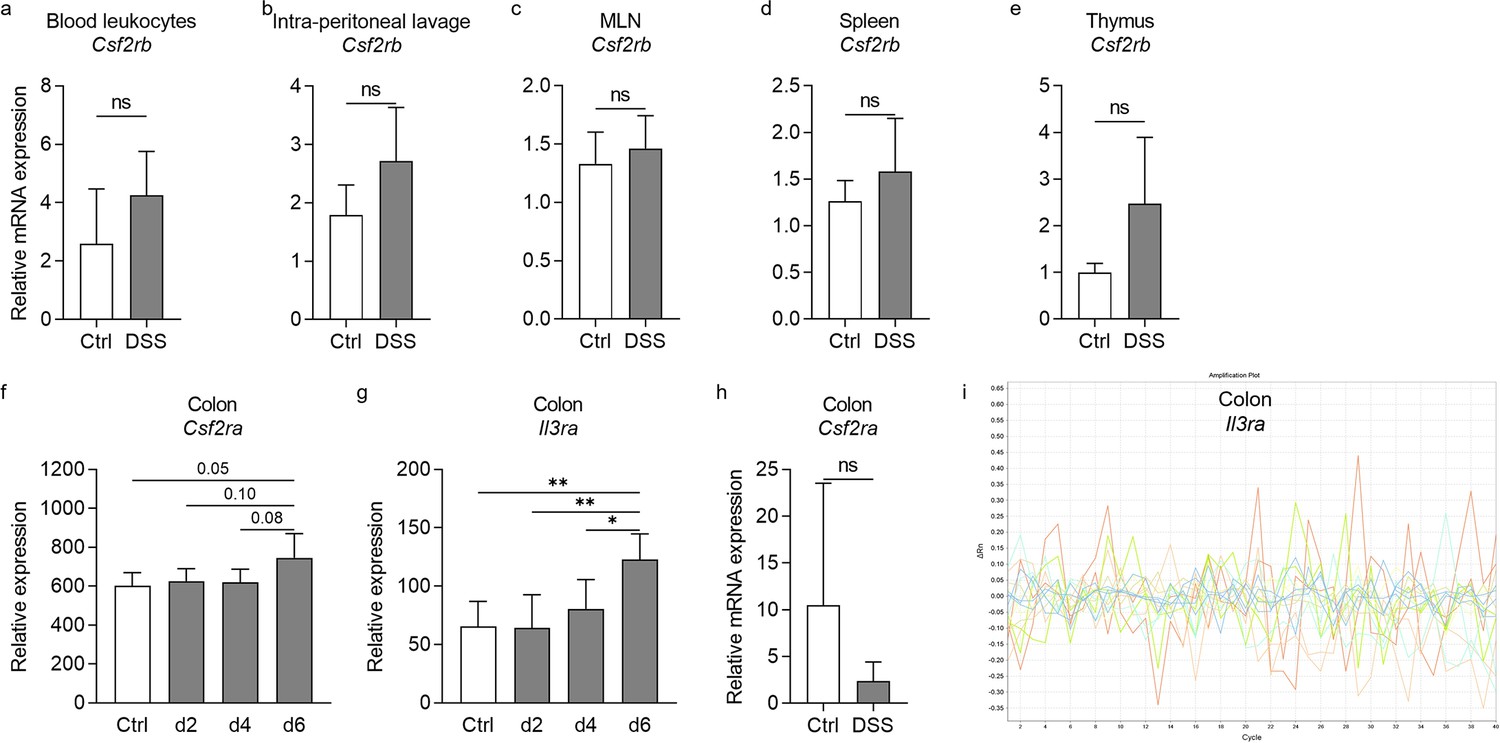
CD131 contributed to DSS-induced murine colitis.
Relative Csf2rb mRNA expression levels in blood leukocytes (a), intra-peritoneal lavage cells (b), mesenteric lymph nodes (MLN, c), spleen (d), and thymus (e) of control and dextran sulfate sodium (DSS)-treated wt mice. (f, g) Gene expression dataset shows the change of relative Csf2ra and Il3ra gene expression levels in murine colon tissues with time after DSS administration. (h) Relative Csf2ra mRNA expression level in colon tissues of control and DSS-treated wt mice. (i) Amplification plot from Applied Biosystems 7500 Fast Real-Time PCR System showing that Il3ra mRNA expression in colon tissues was not detectable. **p < 0.01; *p < 0.05; ns, not significant.
Figure 1—figure supplement 2
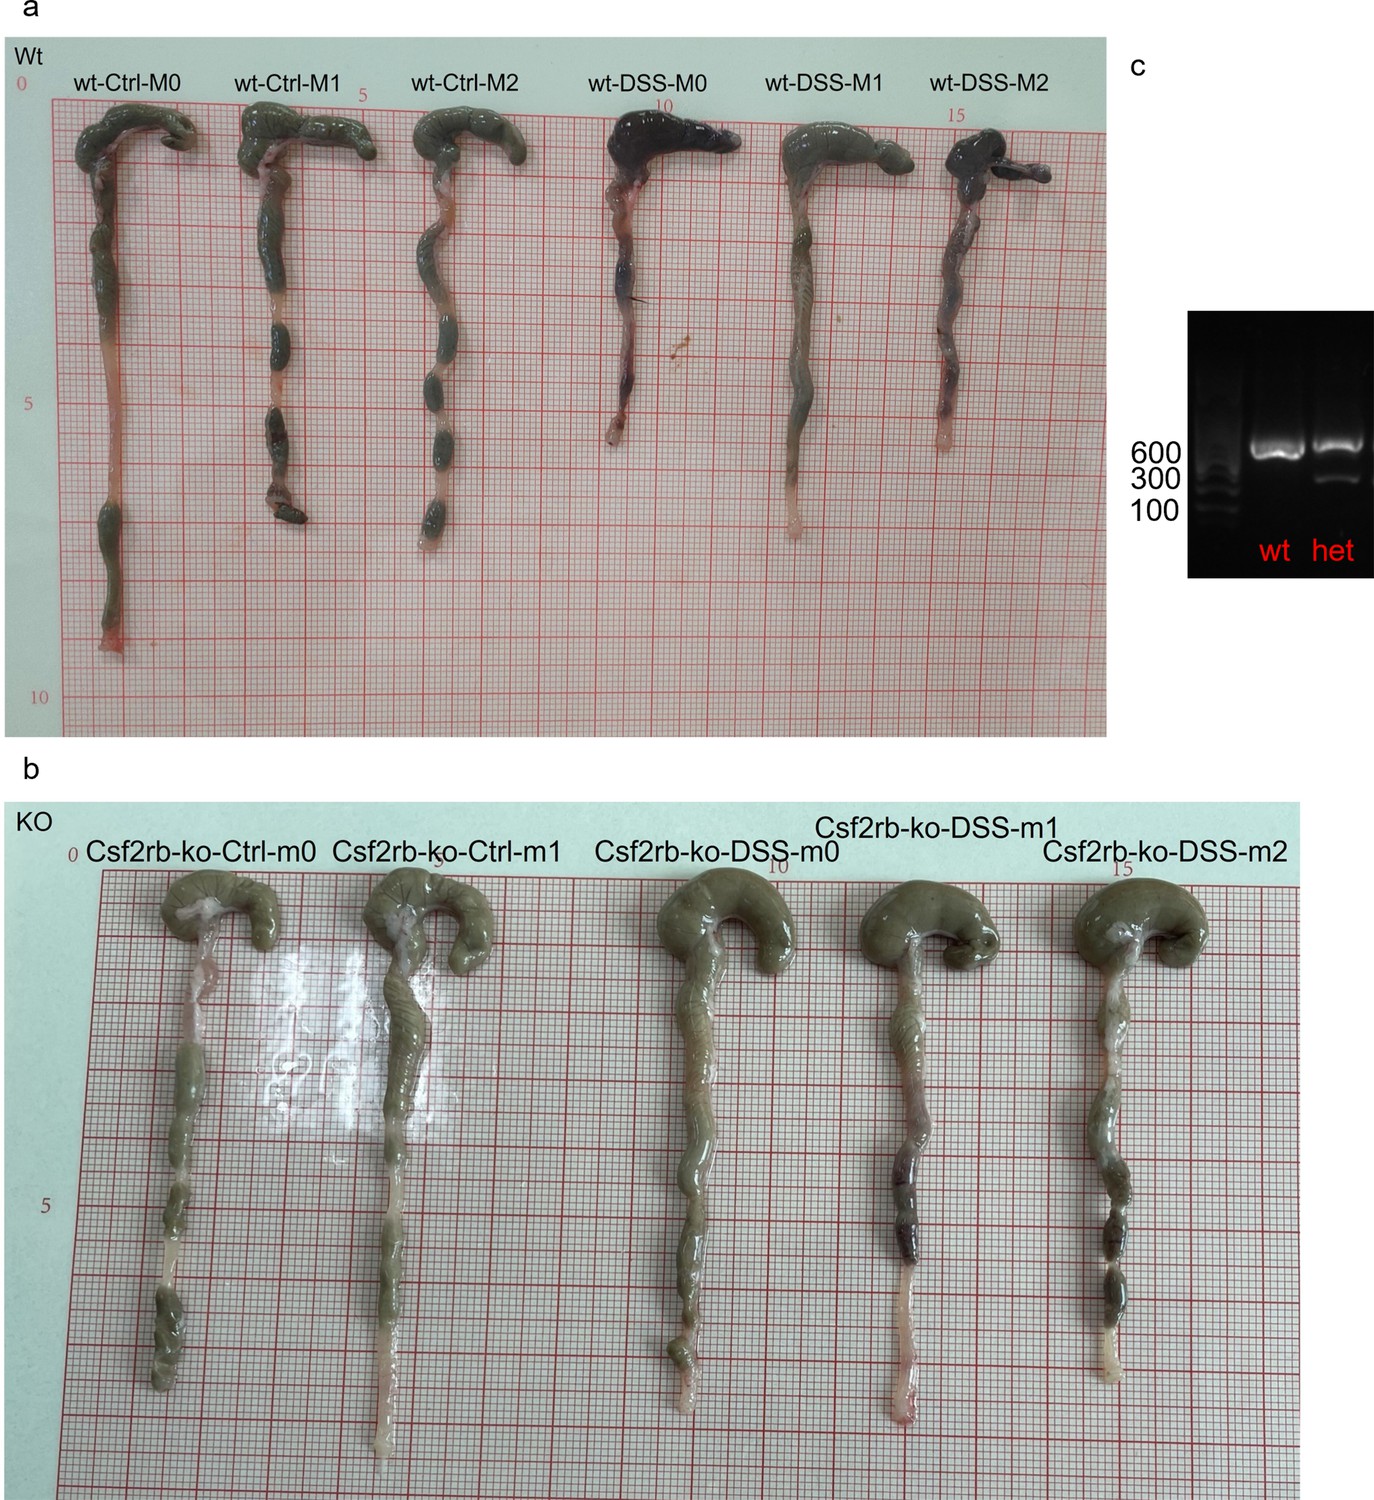
CD131 contributed to DSS-induced murine colitis.
(a, b) Exemplary photos of colons sampled from wt and CD131-deficient mice that were treated with normal drinking water (Ctrl) or dextran sulfate sodium (DSS). (c) An exemplary graph of 1.5% agarose gel electrophoresis showing wt and heterozygous knock-out (het) genotypes on murine tail biopsies genotyping.
Figure 2 with 2 supplements
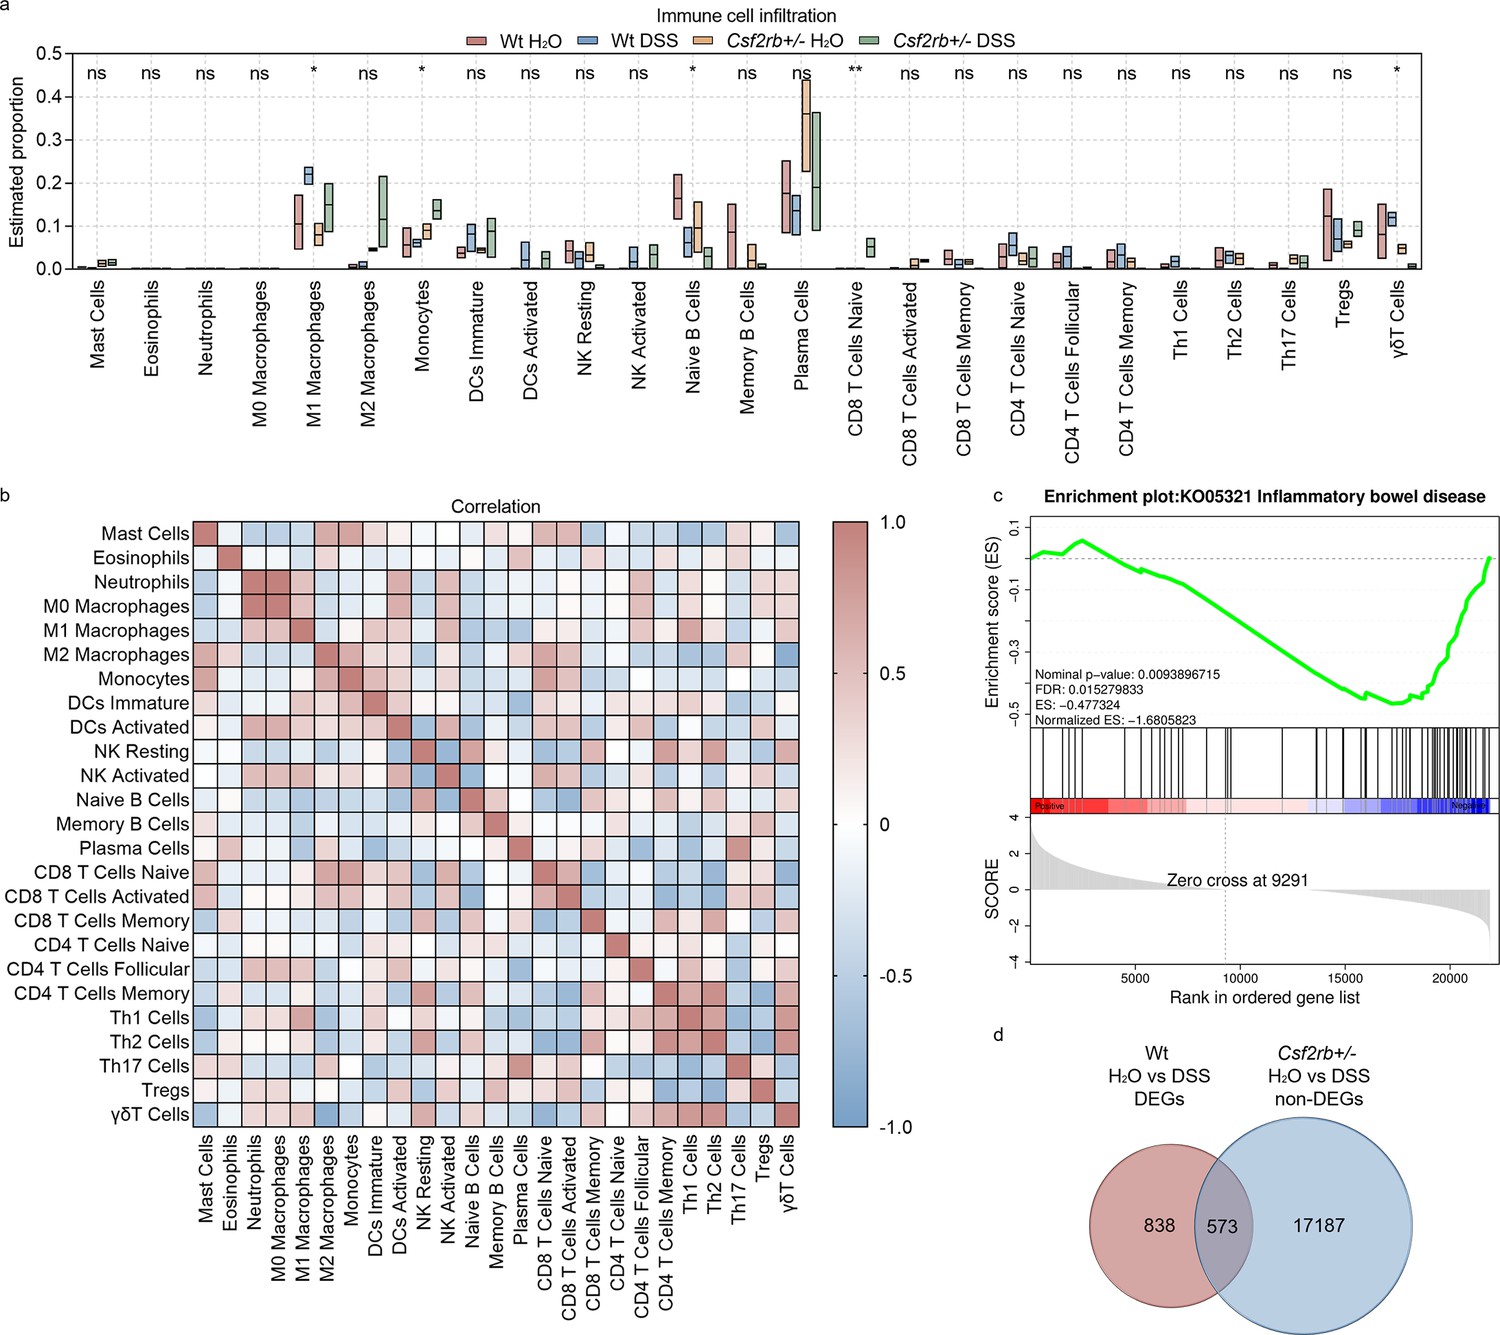
CD131 was associated with immune cell infiltration signature.
(a) Immune cell infiltration analysis of the colon tissues of wt and CD131-deficient mice during steady state and dextran sulfate sodium (DSS)-induced colitis. **p < 0.01; *p < 0.05; ns, not significant. (b) Correlation analysis of the estimated infiltrating immune cells. (c) Gene set enrichment analysis (GSEA) of colon tissues between wt and CD131-deficient mice showing that inflammatory bowel disease-related pathway was enriched in wt mice. (d) Venn graph showing 1411 differentially expressed genes (DEGs) between control and DSS-treated wt mice, as well as 17,760 non-DEGs between control and DSS-treated CD131-deficient mice; the intersection resulted in 573 genes.
Figure 2—figure supplement 1
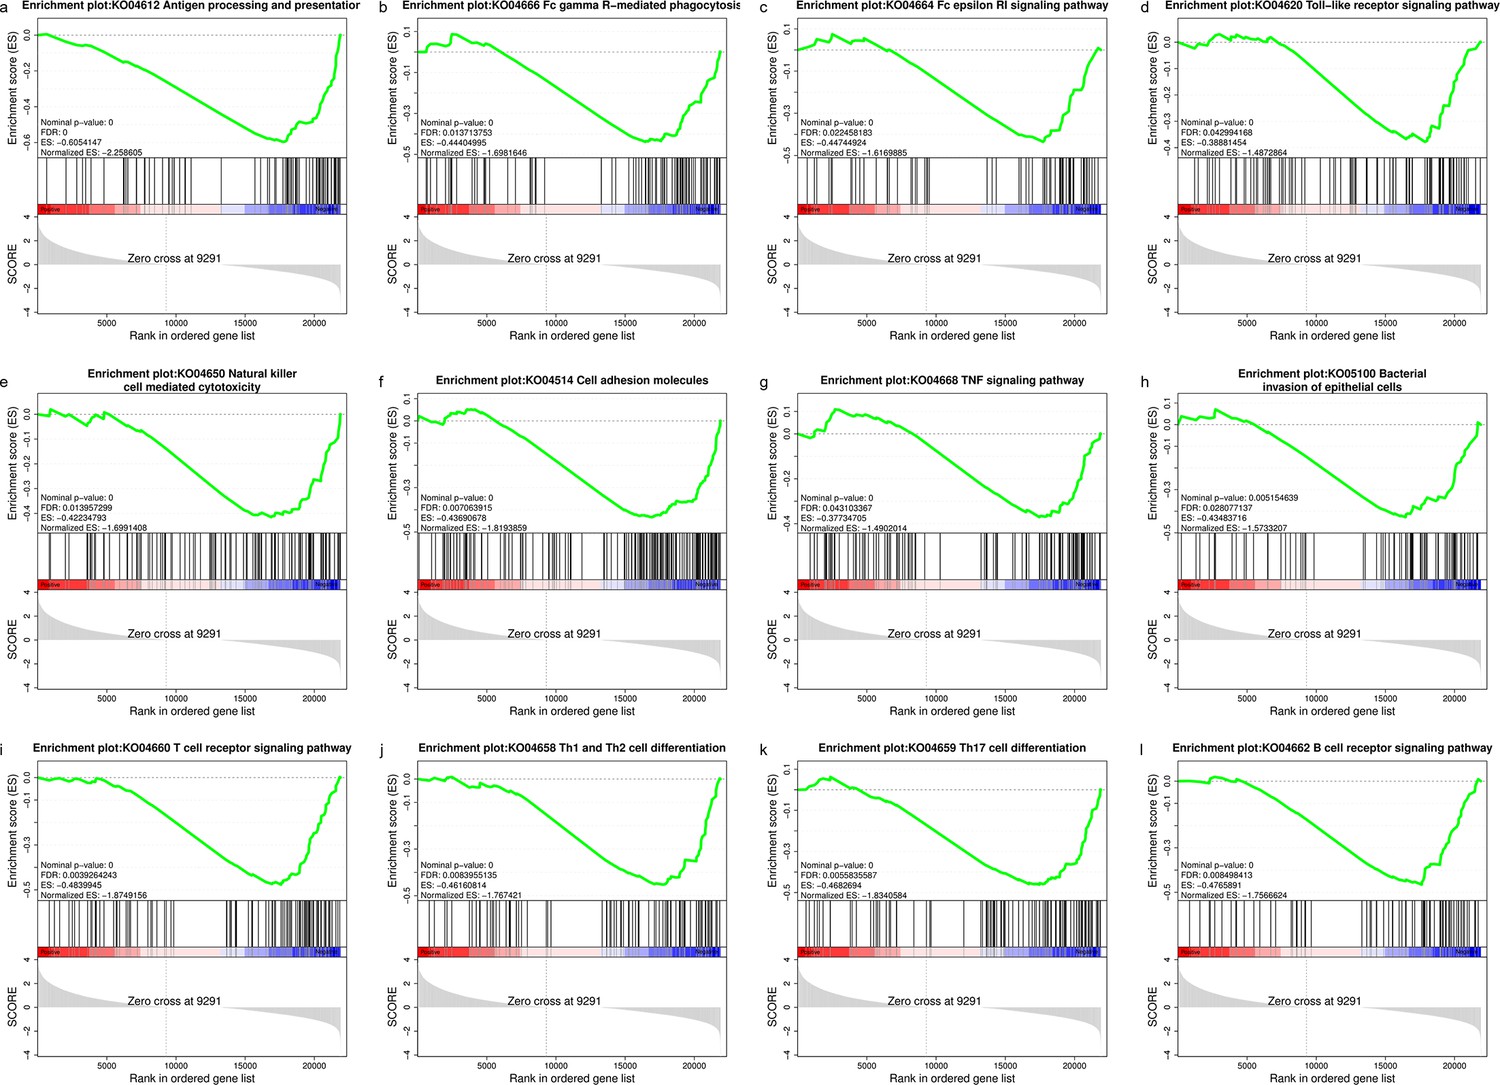
CD131 was associated with immune cell infiltration signature.
Gene set enrichment analysis (GSEA) of colon tissues between wt and CD131-deficient mice showing that several innate and acquired immune-related pathways, including (a) antigen processing and presentation, (b) FcγR-mediated phagocytosis, (c) FcεRI signaling pathway, (d) Toll-like receptor signaling pathway, (e) natural killer cell-mediated cytotoxicity, (f) cell adhesion molecules, (g) Tumor necrosis factor (TNF) signaling pathway, (h) bacterial invasion of epithelial cells, (i) T cell receptor signaling pathway, (j) Th1 and Th2 cell differentiation, (k) Th17 cell differentiation, and (l) B cell receptor signaling pathway, were enriched in wt mice.
Figure 2—figure supplement 2
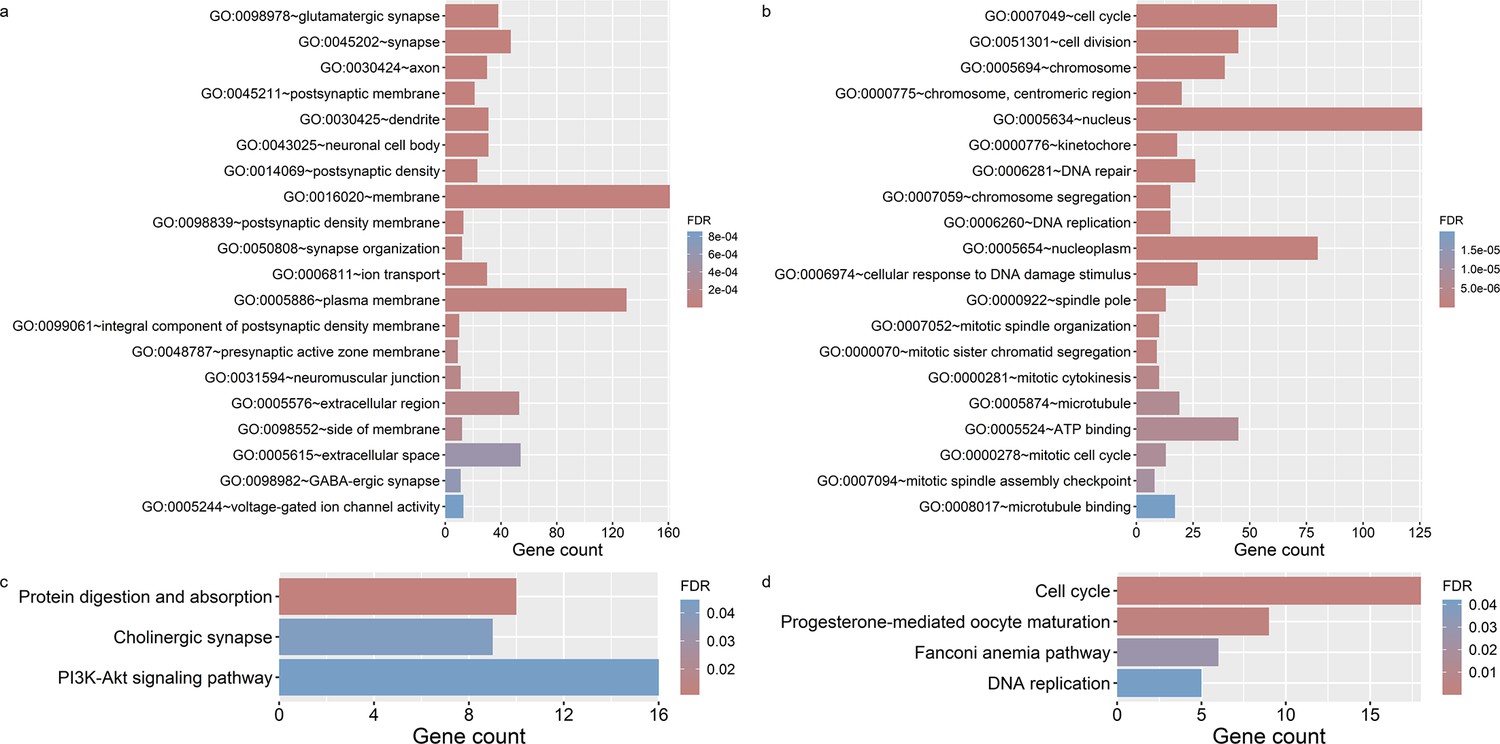
CD131 was associated with immune cell infiltration signature.
Gene Ontology (GO) enrichment analysis of the up- (a) and down-regulated (b), intersected, differentially expressed genes (DEGs). Kyoto Encyclopedia of Genes and Genomes (KEGG) enrichment analysis of the up- (c) and down-regulated (d), intersected, DEGs.
Figure 3 with 2 supplements
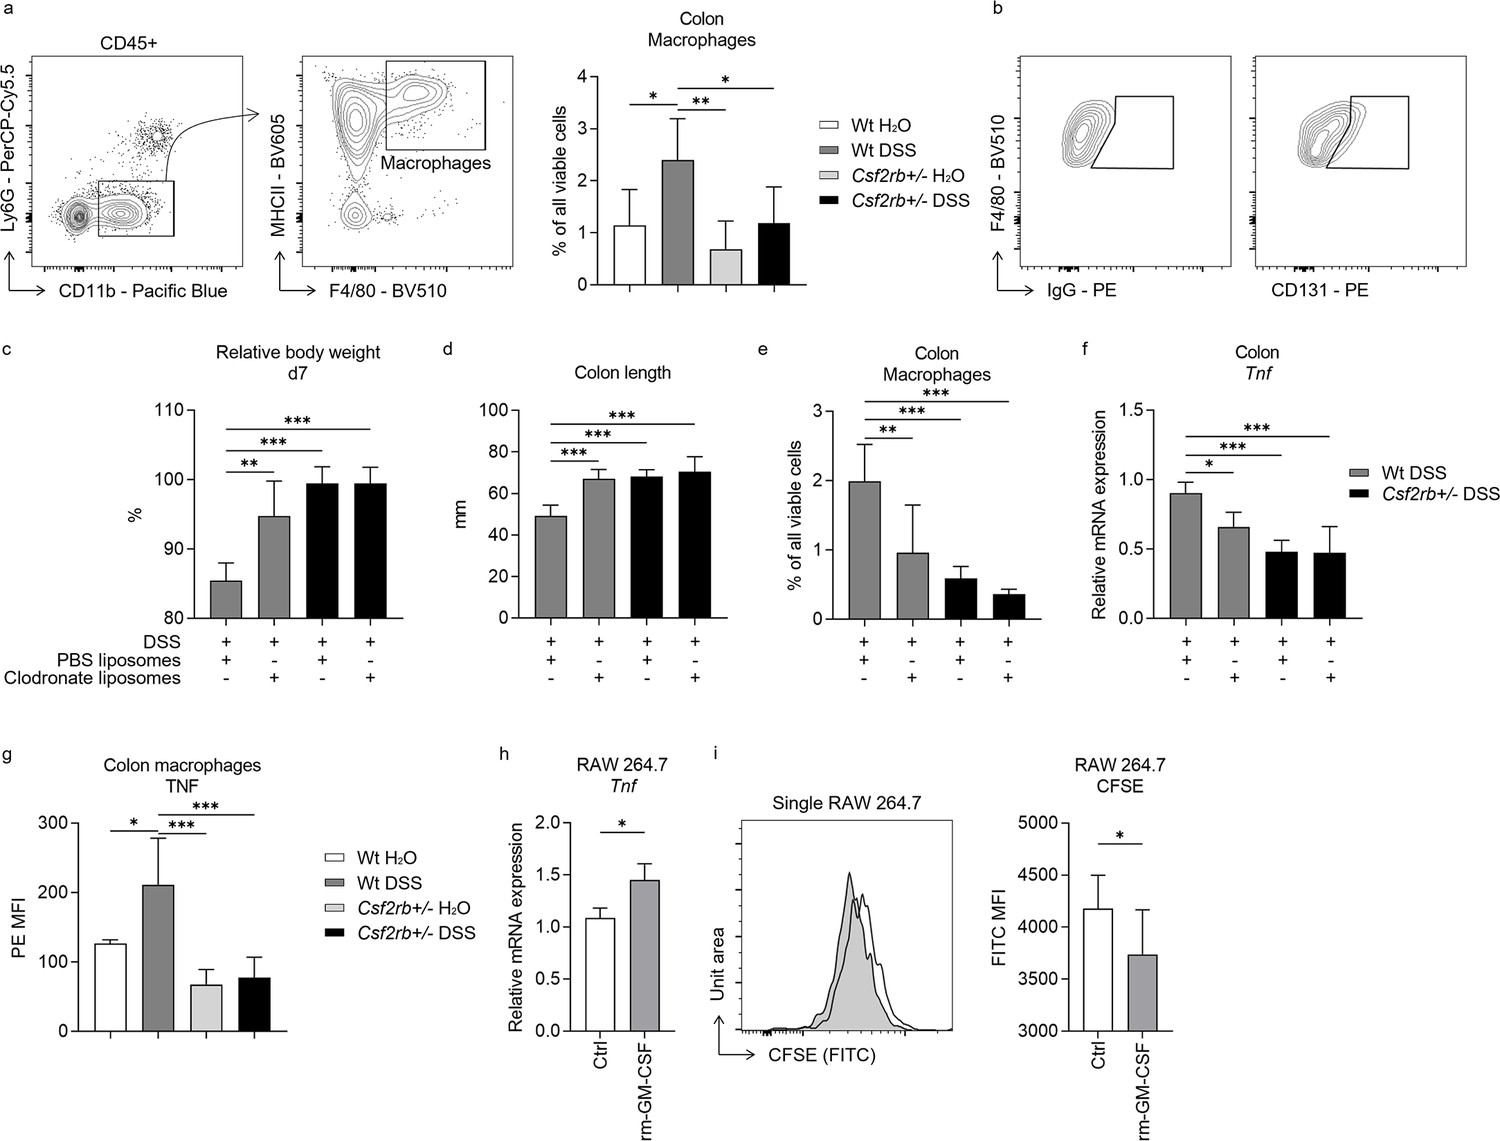
Macrophages and CD131 synergistically contributed to dextran sulfate sodium (DSS)-induced murine colitis.
(a) Exemplary graphs showing the gating strategy for identifying CD11b+MHCII+F4/80+ macrophages on multi-color flow cytometry and their relative cell number, normalized to all viable cells, in the colonic tissues of wt and CD131-deficient mice treated with normal drinking water or DSS. (b) Exemplary graphs showing the gating strategy for identifying CD131+F4/80+ macrophages. Comparison between wt and CD131-deficient mice treated with DSS plus either PBS liposomes or clodronate liposomes, including: (c) relative body weight at day 7; (d) colon length; (e) relative number of macrophages in the colonic tissues normalized to all viable cells; and (f) relative Tnf mRNA expression level in colon tissues. (g) Multi-color flow cytometry showing TNF mean fluorescence intensity (MFI) on colon macrophages in wt and CD131-deficient mice treated with normal drinking water or DSS. RAW 264.7 murine macrophage cell line treated with control or rm-GM-CSF, and relative Tnf mRNA expression level (h) and CFSE MFI (i) were observed. ***p < 0.001; **p < 0.01; *p < 0.05.
Figure 3—figure supplement 1
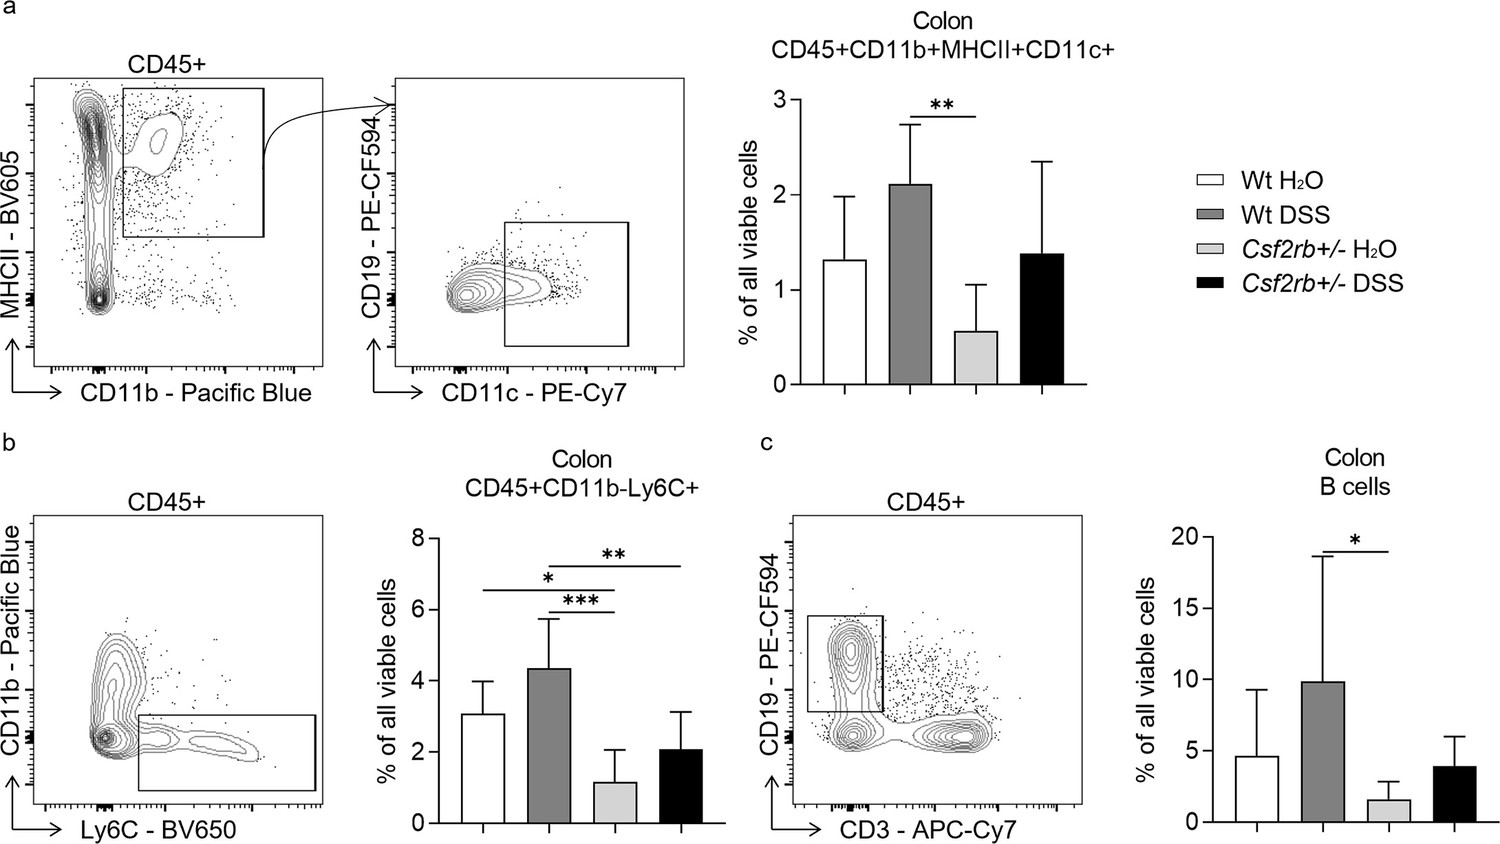
Macrophages and CD131 synergistically contributed to DSS-induced murine colitis.
(a) Exemplary graphs showing the gating strategy for identifying CD45+CD11b+MHCII+CD11c+ cells on multi-color flow cytometry and their relative cell number, normalized to all viable cells, in the colonic tissues of wt and CD131-deficient mice treated with normal drinking water or dextran sulfate sodium (DSS). (b) An exemplary graph showing the gating strategy for identifying CD45+CD11b−Ly6C+ cells on multi-color flow cytometry and their relative cell number, normalized to all viable cells, in the colonic tissues of wt and CD131-deficient mice treated with normal drinking water or DSS. (c) An exemplary graph showing the gating strategy for identifying CD45+CD19+CD3 B cells on multi-color flow cytometry and their relative cell number, normalized to all viable cells, in the colonic tissues of wt and CD131-deficient mice treated with normal drinking water or DSS. ***p < 0.001; **p < 0.01; *p < 0.05.
Figure 3—figure supplement 2
Macrophages and CD131 synergistically contributed to DSS-induced murine colitis.
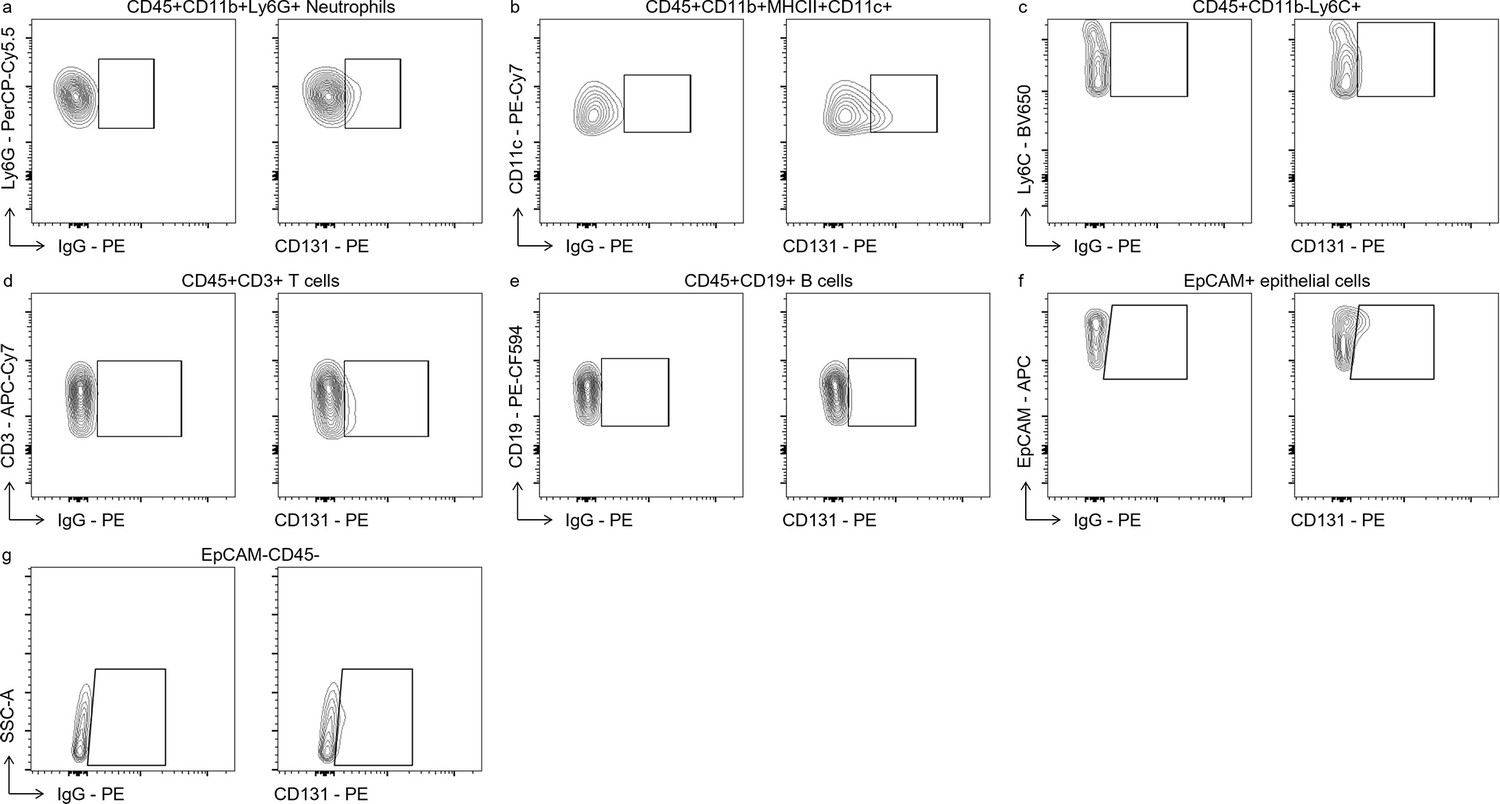
Exemplary graphs showing the gating strategy for identifying (a) CD131+CD11b+Ly6G+ neutrophils, (b) CD131+CD45+CD11b+MHCII+CD11c+ cells, (c) CD131+CD45+CD11b−Ly6C+ cells, (d) CD131+CD45+CD3+ T cells, (e) CD131+CD45+CD19+ B cells, (f) CD131+EpCAM+ epithelial cells, and (g) CD131+ EpCAM−CD45− cells.
Figure 4 with 1 supplement
CCL4 mediated the effect of CD131 on chemotaxis and inflammatory response.
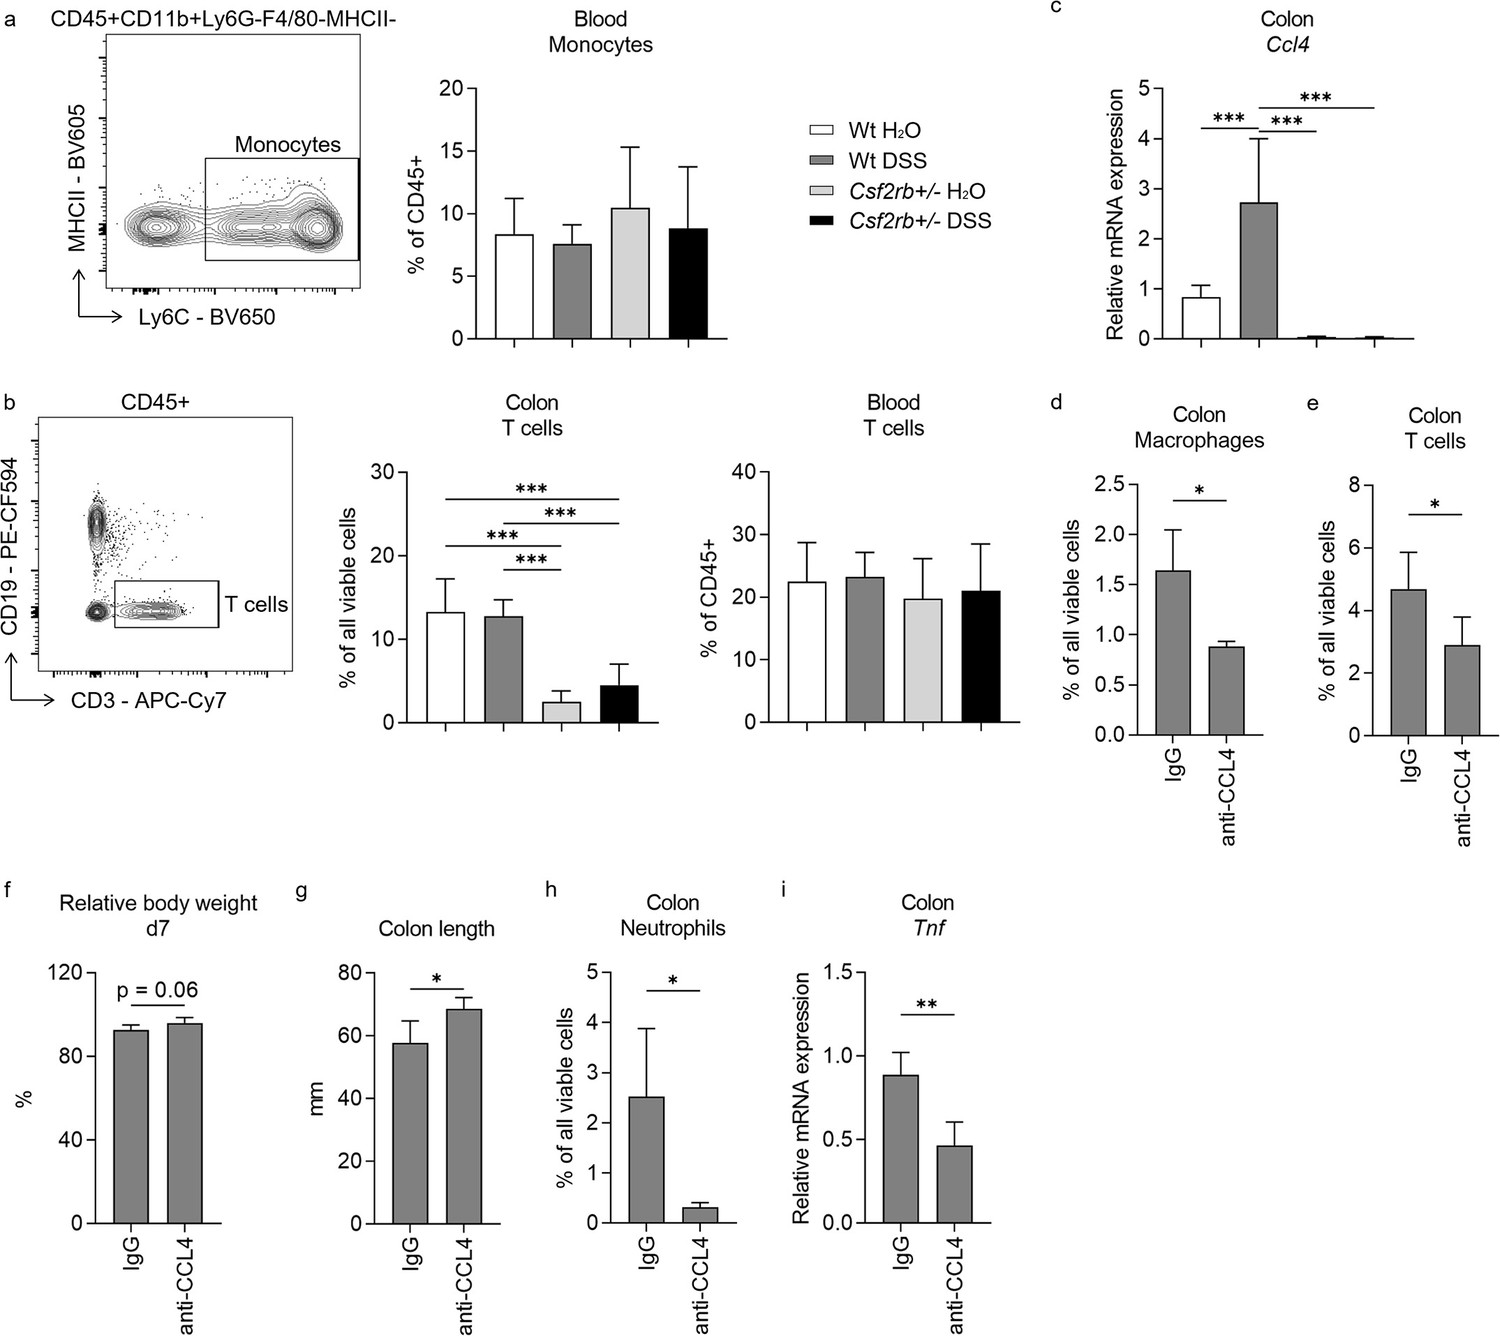
Comparison between wt and CD131-deficient mice treated with normal drinking water or dextran sulfate sodium (DSS), including: (a) An exemplary graph showing the gating strategy for identifying CD11b+Ly6C+ monocytes on multi-color flow cytometry, and their relative cell number in the blood normalized to all viable CD45+ leukocytes; (b) an exemplary graph showing the gating strategy for identifying CD3+ T cells on multi-color flow cytometry, as well as their relative cell number in the colonic tissues normalized to all viable cells, and in the blood normalized to all viable CD45+ leukocytes; (c) relative Ccl4 mRNA expression in the colon tissues. Comparison between wt mice treated with DSS plus IgG isotype control and anti-CCL4 antibodies, including: (d) relative macrophage number in the colon tissues normalized to all viable cells; (e) relative T cell number in the colon tissues normalized to all viable cells; (f) relative body weight at day 7; (g) colon length; (h) relative neutrophil number in the colon tissues normalized to all viable cells; and (i) relative Tnf mRNA expression in the colon tissues. ***p < 0.001; **p < 0.01; *p < 0.05.
Figure 4—figure supplement 1
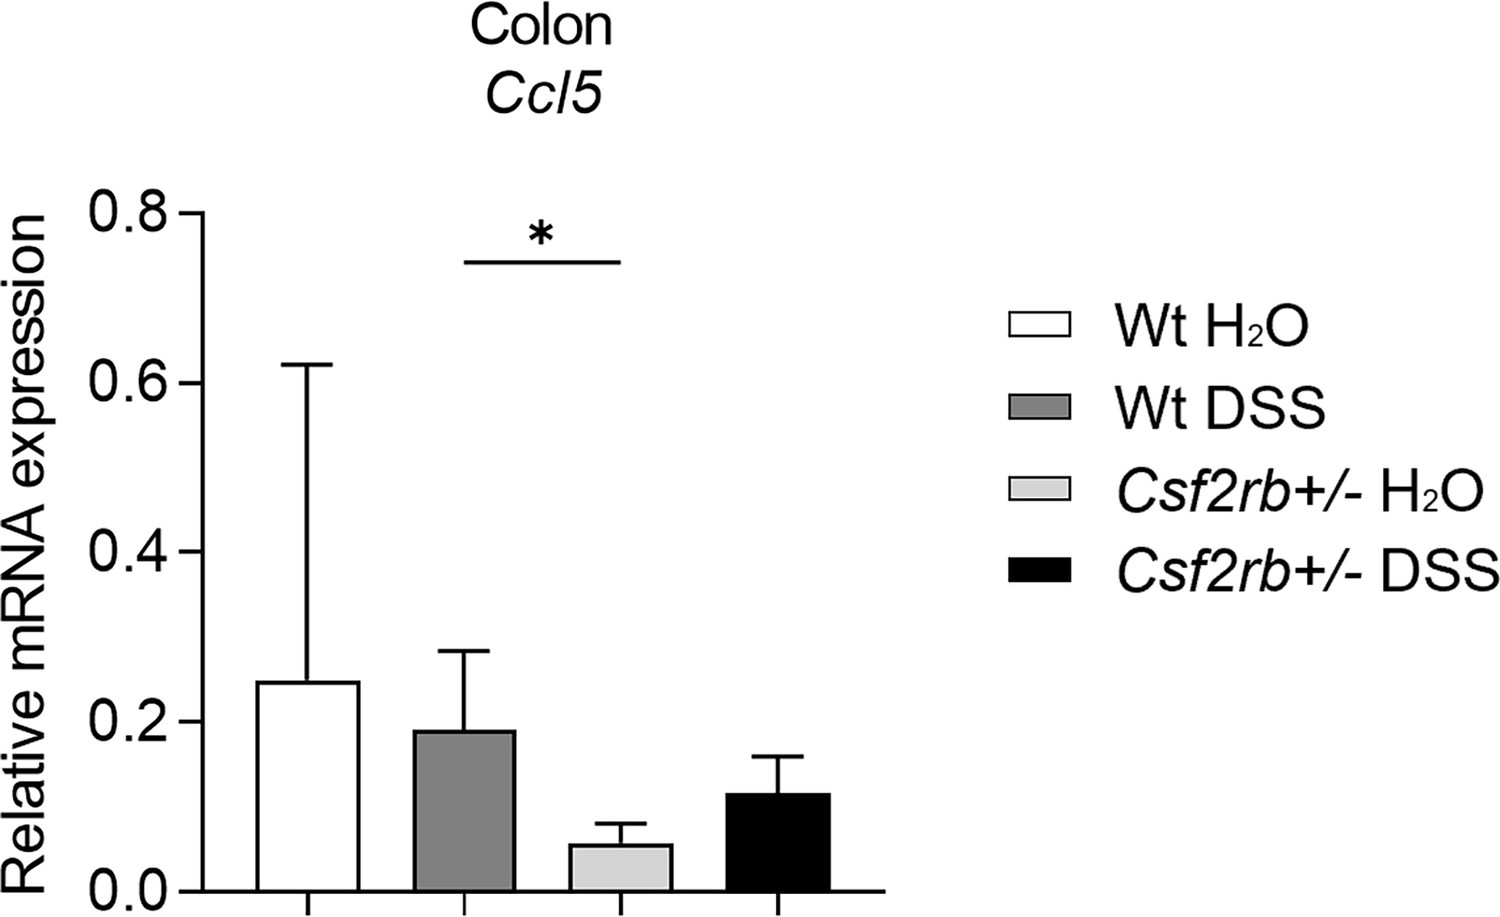
Relative Ccl5 mRNA expression levels in colon tissues of wt and CD131-deficient mice treated with normal drinking water or dextran sulfate sodium (DSS).
*p < 0.05.
Figure 5
CD131 was associated with endoscopic and pathological severity of ulcerative colitis (UC) as well as macrophage and T cell infiltration into the colon.
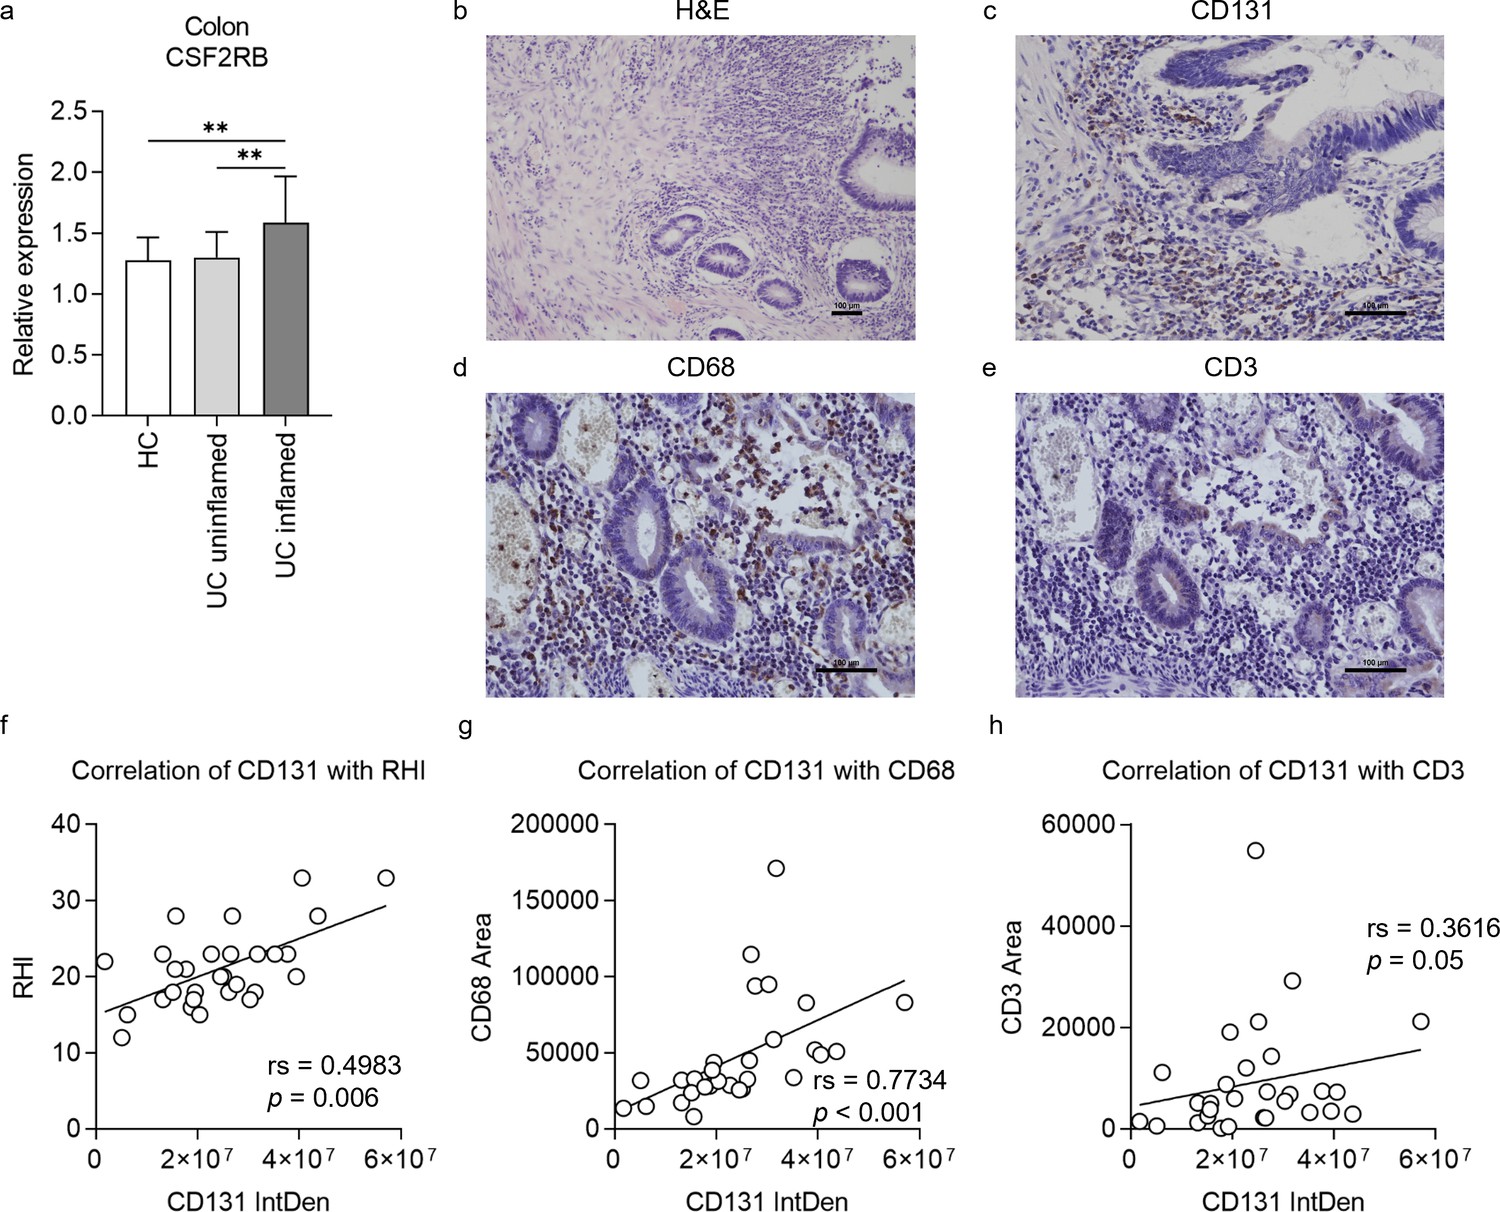
(a) Gene expression dataset shows relative CSF2RB gene expression in colonic tissues of healthy controls (HC), uninflamed UC patients and inflamed UC patients. **p < 0.01. A group of exemplary graphs showing histology sections of colonic tissues from UC patients stained with hematoxylin and eosin (H&E) (b), CD131 (c), CD68 (d) and CD3 (e); scale bars indicate 100 μm. (f) Immunohistochemistry (IHC) analysis showing correlation between CD131 integrated density (IntDen), reflecting its expression level, and Robarts histopathological index (RHI) on H&E, reflecting disease severity. (g) IHC analysis showing correlation between CD131 IntDen and CD68 area, reflecting relative positive macrophage cell number. (h) IHC analysis showing correlation between CD131 IntDen and CD3 area, reflecting relative positive T cell number.
Tables
Table 1
Demographic characteristics of ulcerative colitis patients and correlation with CD131 expression.
| UC patients | Correlation with CD131 expression | |||
|---|---|---|---|---|
| rs or τ | p | |||
| n | 29 | - | ||
| Age – year [median (range)] | 53 (35–80) | 0.112 | 0.564 | |
| Gender – n (%) | Female | 13 (44.8) | 0.172 | 0.273 |
| Male | 16 (55.2) | |||
| Disease duration – months [median (range)] | 48 (1–312) | −0.071 | 0.716 | |
| Smoking history – n (%) | Never | 20 (69.0) | 0.164 | 0.284 |
| Former | 7 (24.1) | |||
| Current | 2 (6.9) | |||
| Fever* – n (%) | No | 29 (100) | - | |
| Pulse – n (%) | ≤90 | 24 (82.8) | 0.082 | 0.603 |
| >90 | 5 (17.2) | |||
| Diarrhea – n (%) | No | 5 (19.2) | 0.016 | 0.922 |
| Yes | 21 (80.8) | |||
| Unknown | 3 | |||
| Blood in stool – n (%) | Fobt+ | 5 (17.2) | 0.036 | 0.817 |
| Visible | 24 (82.8) | |||
| Montreal Classification for disease extent† – n (%) | E2 | 3 (10.3) | 0.090 | 0.567 |
| E3 | 26 (89.7) | |||
| WBC‡ – n (%) | Low | 5 (17.2) | 0.138 | 0.358 |
| Normal | 17 (58.6) | |||
| Elevated | 7 (24.1) | |||
| Anemia** – n (%) | No | 2 (6.9) | 0.095 | 0.547 |
| Yes | 27 (93.1) | |||
| Elevated ESR§ – n (%) | No | 8 (50.0) | 0.297 | 0.172 |
| Yes | 8 (50.0) | |||
| Unknown | 13 | |||
| Mucosal appearance at endoscopy¶ – n (%) | Moderate | 4 (15.4) | 0.378 | 0.023 |
| Severe | 22 (84.6) | |||
| Unknown | 3 | |||
-
Italics indicate data not analyzed.
-
*
Fever was defined as body temperature higher than 37.3°C.
-
†
Montreal Classification for disease extent: E1, involvement limited to the rectum (i.e., proximal extent of inflammation is distal to the rectosigmoid junction); E2, involvement limited to the portion of the colorectum distal to the splenic flexure; E3, involvement extends proximal to the splenic flexure.
-
‡
Blood WBC count between (4.5–11) × 109 /l was considered normal.
-
§
Erythrocyte sedimentation rate (ESR) was considered elevated if >15 mm/hr in male or >20 mm/hr in female patients.
-
¶
Mucosal appearance at endoscopy was evaluated as per the Mayo score, including normal or inactive disease; mild disease (erythema, decreased vascular pattern, mild friability); moderate disease (marked erythema, absent vascular pattern, friability, erosions), and severe disease (spontaneous bleeding, ulceration). Fobt: fecal occult blood test.
-
**
Anemia was defined as blood hemoglobin less than 13.5 g/dl in male or 12.0 g/dl in female patients.
Additional files
-
Supplementary file 1
Gene set enrichment analysis (GSEA) pathway analysis of colon tissues between wt and CD131-deficient mice.
- https://cdn.elifesciences.org/articles/102637/elife-102637-supp1-v1.xlsx
-
Supplementary file 2
List of intersected differentially expressed genes (DEGs).
- https://cdn.elifesciences.org/articles/102637/elife-102637-supp2-v1.xlsx
-
Supplementary file 3
Gene Ontology (GO) enrichment analysis of the intersected, up-regulated differentially expressed genes (DEGs).
- https://cdn.elifesciences.org/articles/102637/elife-102637-supp3-v1.xlsx
-
Supplementary file 4
Gene Ontology (GO) enrichment analysis of the intersected, down-regulated differentially expressed genes (DEGs).
- https://cdn.elifesciences.org/articles/102637/elife-102637-supp4-v1.xlsx
-
Supplementary file 5
Kyoto Encyclopedia of Genes and Genomes (KEGG) enrichment analysis of the intersected, up-regulated differentially expressed genes (DEGs).
- https://cdn.elifesciences.org/articles/102637/elife-102637-supp5-v1.xlsx
-
Supplementary file 6
Kyoto Encyclopedia of Genes and Genomes (KEGG) enrichment analysis of the intersected, down-regulated differentially expressed genes (DEGs).
- https://cdn.elifesciences.org/articles/102637/elife-102637-supp6-v1.xlsx
-
Supplementary file 7
Demographic and clinical data of ulcerative colitis patients.
ESR: erythrocyte sedimentation rate; Fobt: fecal occult blood test; na: not available (data missing from clinical registry).
- https://cdn.elifesciences.org/articles/102637/elife-102637-supp7-v1.docx
-
MDAR checklist
- https://cdn.elifesciences.org/articles/102637/elife-102637-mdarchecklist1-v1.pdf
Download links
A two-part list of links to download the article, or parts of the article, in various formats.
Downloads (link to download the article as PDF)
Open citations (links to open the citations from this article in various online reference manager services)
Cite this article (links to download the citations from this article in formats compatible with various reference manager tools)
CD131 contributes to ulcerative colitis pathogenesis by promoting macrophage infiltration
eLife 13:RP102637.
https://doi.org/10.7554/eLife.102637.2


