Disentangling acute motor deficits and adaptive responses evoked by the loss of cerebellar output
- Edmond and Lily Safra Center for Brain Sciences, The Hebrew University of Jerusalem, Israel
- Department of Physical Therapy and Human Movement Sciences, Northwestern University Feinberg School of Medicine, United States
- Interdepartmental Neuroscience Center, Northwestern University Feinberg School of Medicine, United States
- Department of Neurosurgery, Sheba Medical Center, Israel
- Department of Biomedical Engineering, Northwestern University, United States
- Department of Physical Medicine & Rehabilitation, Northwestern University Feinberg School of Medicine, United States
Figures
Figure 1 with 1 supplement
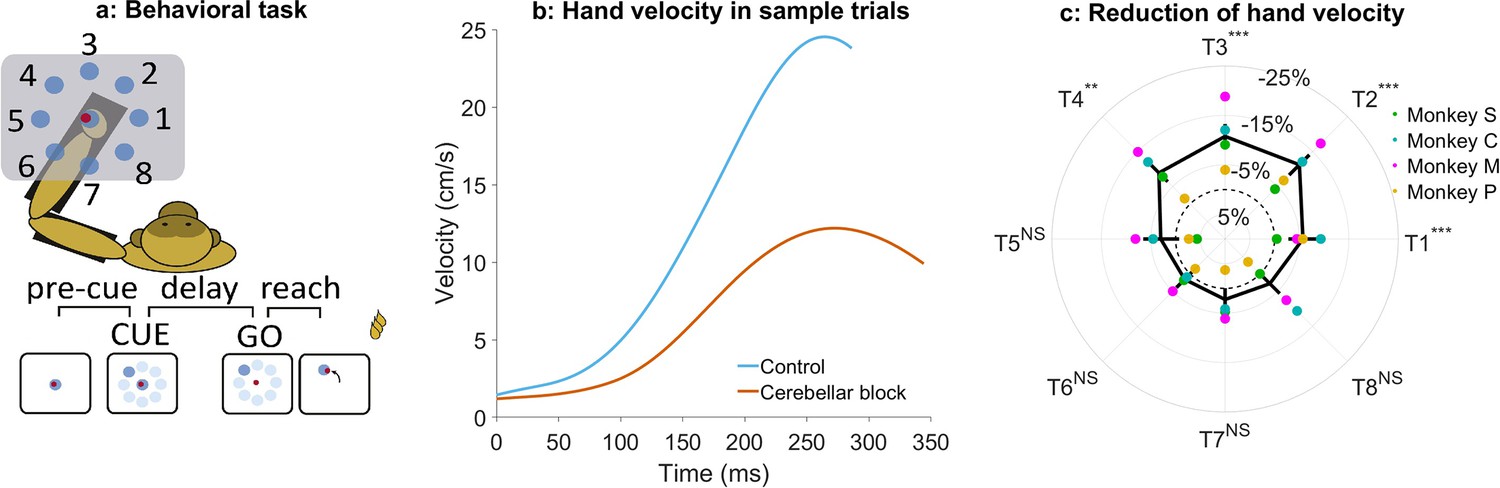
Effect of cerebellar block on peak hand velocity.
(a) Schematic of the monkey performing the delayed reaching task in the KINARM exoskeleton to eight peripheral targets on the horizontal plane. The locations of the eight targets are numbered. (b) Movement-onset aligned hand velocity profiles during a sample control and cerebellar block trial performed by monkey C to target 2. Entry of the control cursor into the peripheral target marked the end of the movement for the trial. Since the monkeys did not have to stop their movements fully for the trial to end (see Methods for a detailed explanation of this), the traces appear cutoff at the beginning of the deceleration/stopping phase of the movement. (c) Target-wise effect of the cerebellar block on peak hand velocity. For each session, the target-wise reduction in the median peak hand velocity during the cerebellar block trials was computed relative to that of control trials. The depicted values are the means ± 95% confidence intervals across all sessions pooled from all four monkeys. The means of individual monkeys are overlaid. The dashed circle indicates no change. Statistical significance is denoted as follows: p≥0.05 NS, p<0.05*, p<0.01**, p<0.001***. [T1-8: Targets 1–8].
Figure 1—figure supplement 1
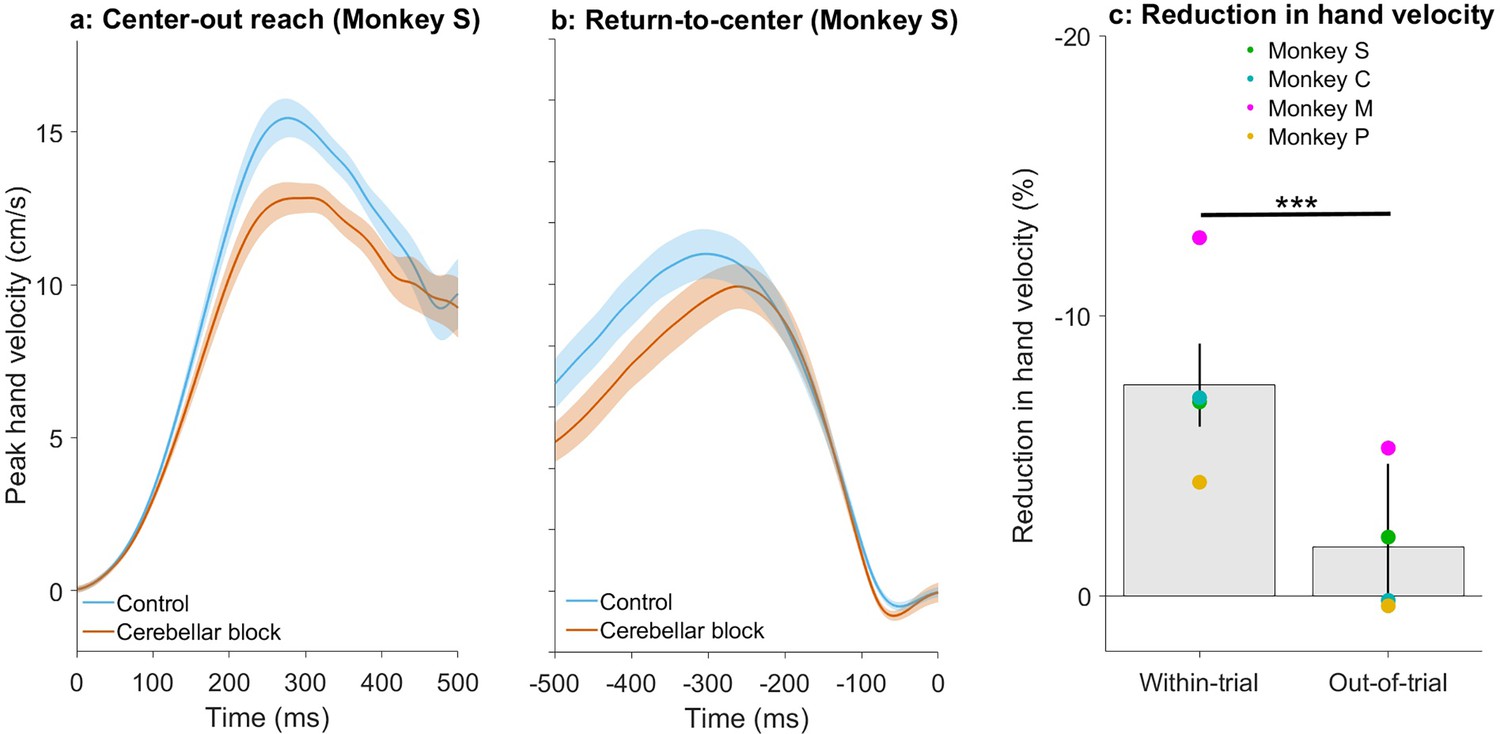
Effect of cerebellar block on peak hand velocity during within-trial vs. inter-trial movements.
(a) Movement-onset aligned hand velocity profiles of target-directed reaching movements performed by monkey S. We took the median velocity profile per target per session and then averaged across all targets to generate one velocity profile per session. The depicted data is the mean ± 95% confidence intervals across all sessions. Movement onset was defined as the first point when the hand velocity exceeded 5% of the peak. To facilitate visualization, we subtracted the individual baseline (mean of the first 10 ms from movement onset) from the plotted traces. (b) End-of-movement aligned hand velocity profiles of return-to-center movements performed by monkey S. We took the median velocity profiles per target per session and then averaged across all targets to generate one velocity profile per session. The depicted data is the mean ± 95% confidence intervals across all sessions. Movement end was defined as the last time point when the hand velocity exceeded 5% of the peak. To facilitate visualization, we subtracted the individual baseline (mean of the last 10 ms before the end of movement) from the plotted traces. (c) Effect of the cerebellar block on peak hand velocity for within-trial target-directed movements vs. out-of-trial return-to-center movements. For each session, the target-wise reduction in the median peak hand velocity during the cerebellar block trials was computed relative to that of control trials. The depicted values are the means ± 95% confidence intervals across all sessions pooled from all four monkeys. The means of individual monkeys are overlaid. Statistical significance is denoted as follows: p≥0.05 NS, p<0.05*, p<0.01**, p<0.001***.
Figure 2 with 1 supplement
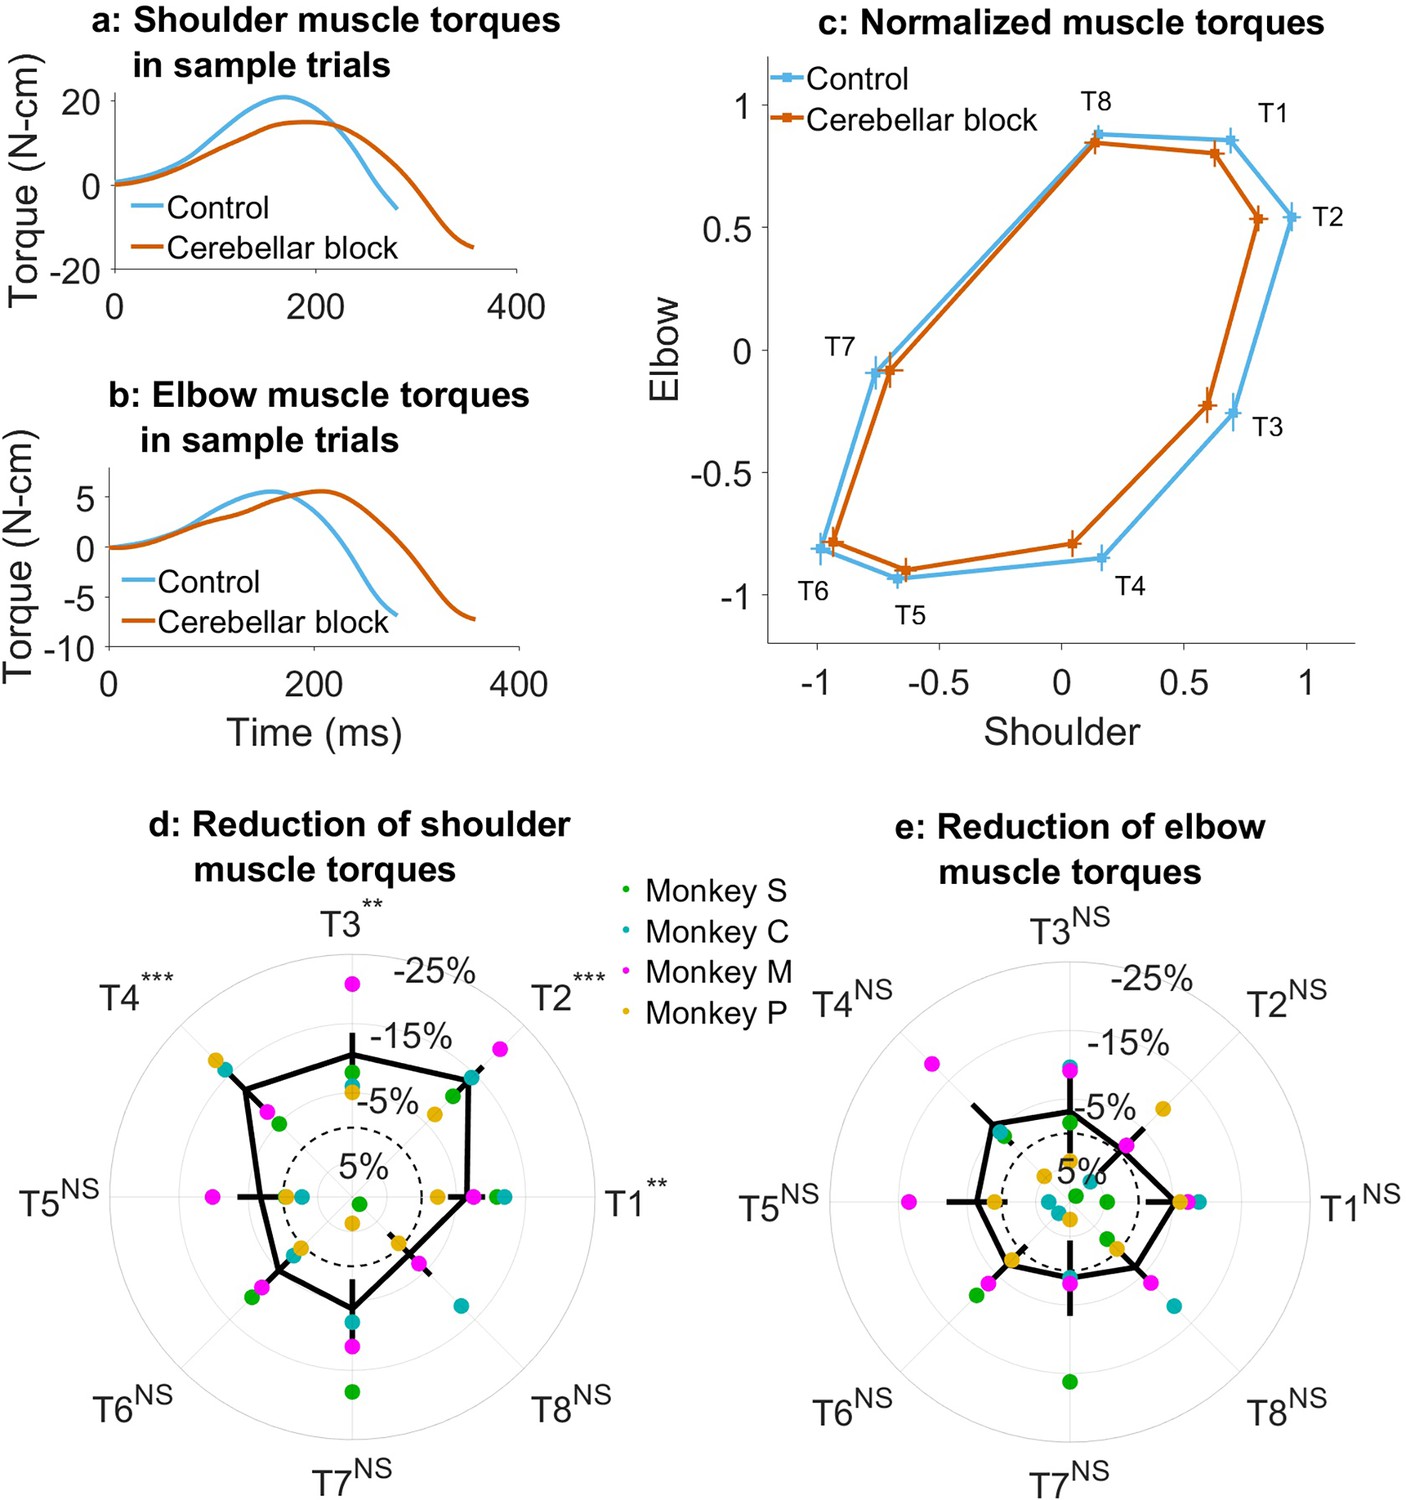
Effect of cerebellar block on muscle torques.
Movement-onset aligned shoulder (a) and elbow (b) muscle torque profiles during a sample control and cerebellar block trial performed by monkey C to target 2. Entry of the control cursor into the peripheral target marked the end of the movement for the trial. Since the monkeys did not have to stop their movements fully for the trial to end (see Methods for a detailed explanation of this), the traces appear cutoff at the beginning of the deceleration/stopping phase of the movement. (c) Normalized muscle torque impulse at the shoulder vs. elbow per target during control and cerebellar block. For each session, we computed the target-wise median muscle torque impulse during the acceleration phase of the movement across the control and cerebellar block trials. They were then normalized by the maximum absolute torque impulse across all the targets. The depicted values are the means across all the sessions pooled from the data of all four monkeys. The 95% confidence interval of the means is indicated by the horizontal and vertical bars for the shoulder and elbow joints, respectively. Target-wise effect of cerebellar block on shoulder (d) and elbow (e) muscle torque impulse. For each session, the target-wise reduction in the median torque impulse during the cerebellar block trials was computed relative to the maximum absolute value of the target-wise medians observed during the control trials. The depicted values are the means ± 95% confidence intervals across all sessions pooled from all four monkeys. The means of individual monkeys are overlaid. The dashed circle indicates no change. Statistical significance is denoted as follows: p≥0.05 NS, p<0.05*, p<0.01**, p<0.001***. [T1-8: Targets 1–8].
Figure 2—figure supplement 1
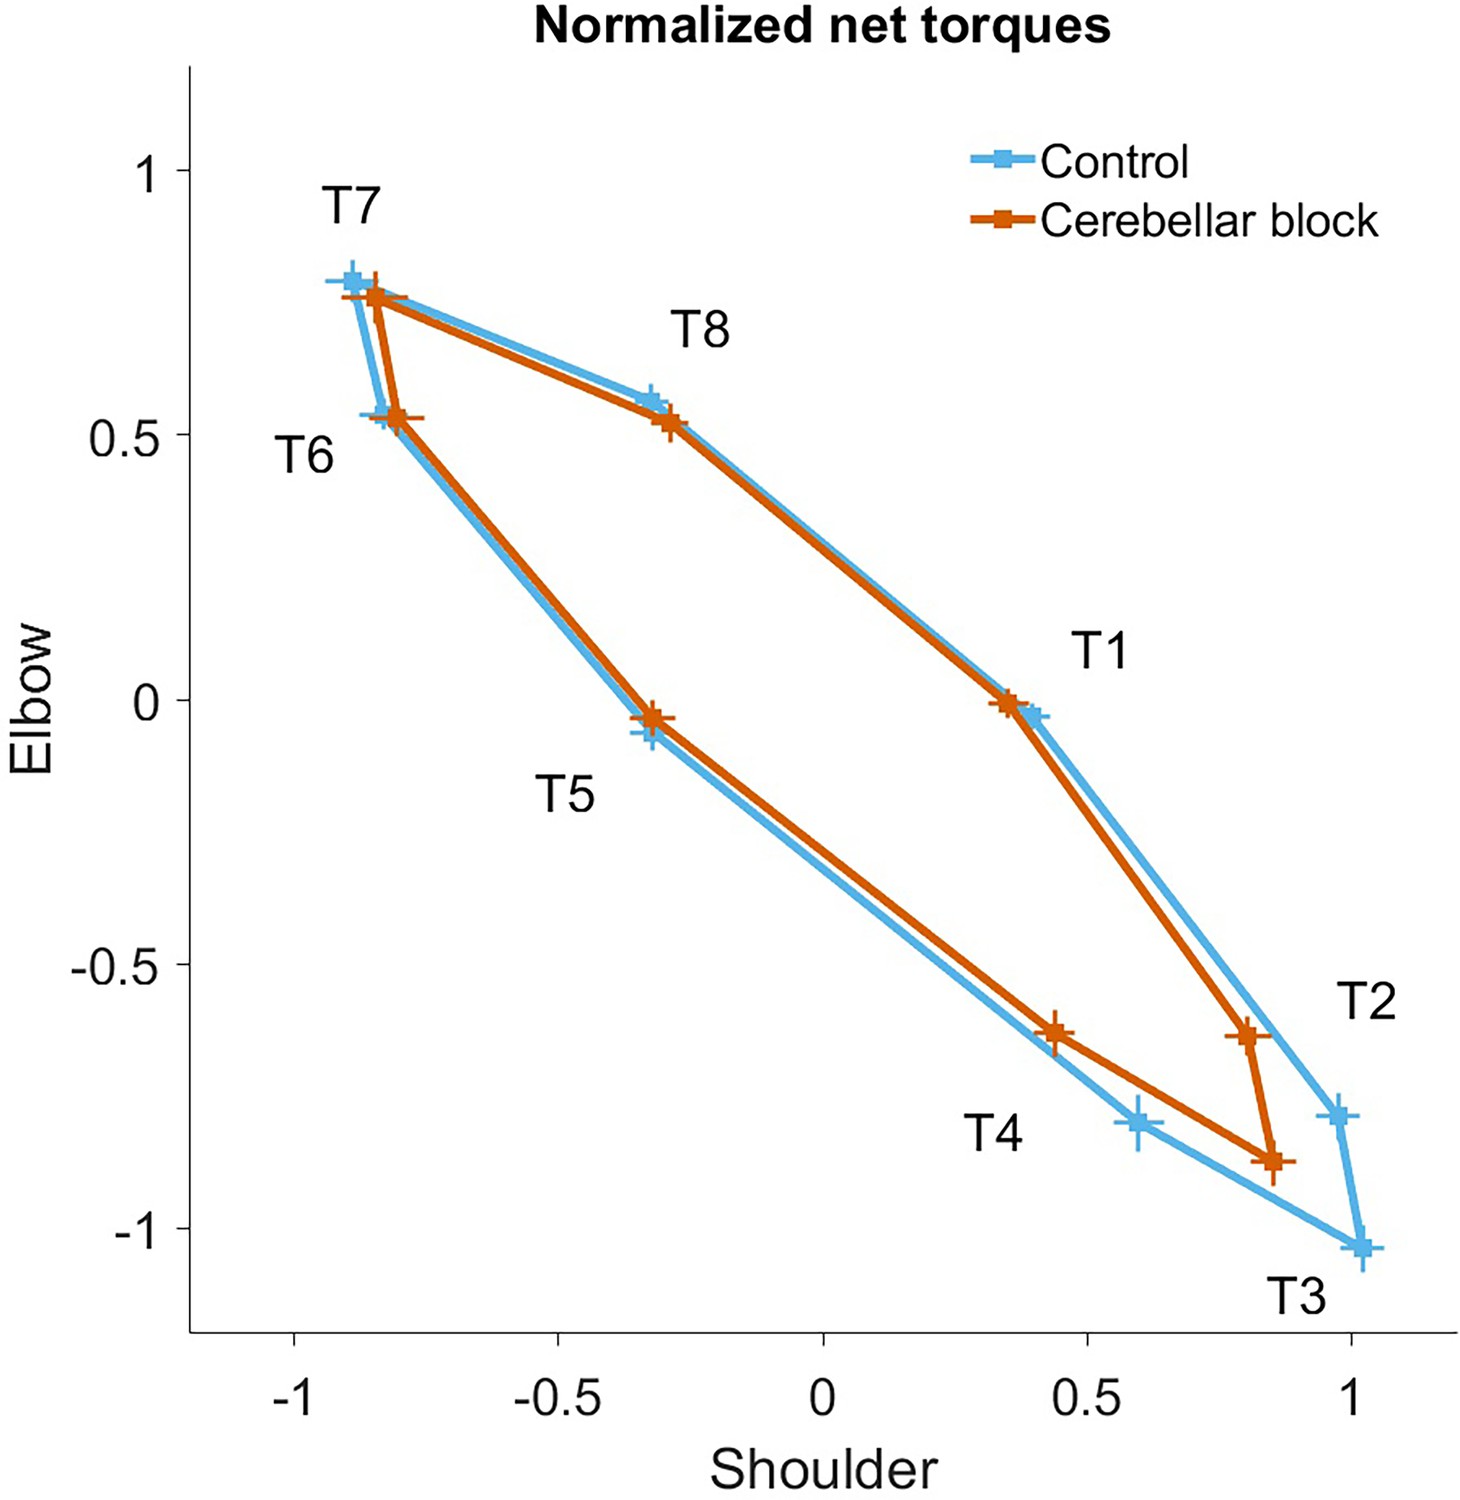
Normalized net torque impulse at the shoulder vs. elbow per target during control and cerebellar block conditions.
For each session, we computed the target-wise median net torque impulse during the acceleration phase of the movement across the control and cerebellar block trials. They were then normalized by the maximum absolute torque impulse across all the targets. The depicted values are the means across all the sessions pooled from the data of all four monkeys. The 95% confidence interval of the means is indicated by the horizontal and vertical bars for the shoulder and elbow joints, respectively.
Figure 3

Effect of cerebellar block on coupling torques.
Movement-onset aligned shoulder (a) and elbow (b) coupling torque profiles during a sample control and cerebellar block trial performed by monkey C to target 2. Entry of the control cursor into the peripheral target marked the end of the trial. (c) Normalized coupling torque impulse at the shoulder vs. elbow per target during control and cerebellar block. For each session, we computed the target-wise median coupling torque impulse during the acceleration phase of the movement across the control and cerebellar block trials. They were then normalized by the maximum absolute torque impulse across all the targets. The depicted values are the means across all the sessions pooled from the data of all four monkeys. The 95% confidence interval of the means is indicated by the horizontal and vertical bars for the shoulder and elbow joints, respectively. (d) The effect of the cerebellar block on peak hand velocity (y-axis) is plotted against the total coupling torque experienced across both joints during control (x-axis) for the outward reaches (T1-4). The effect of the cerebellar block on peak hand velocity was measured by the target-wise change in the median peak hand velocity during the cerebellar block trials relative to that of control trials per session (negative percentage values indicate a stronger reduction due to the cerebellar block). This measure was then correlated to the target-wise median coupling torque during the control trials of the corresponding sessions. The median coupling torque was taken as the sum of the absolute coupling torque impulse at both the shoulder and elbow joints per trial. These values were then normalized by the median across all trials of all sessions per monkey (to yield percentage units like the y-axis). The depicted data contains all the sessions pooled from all four monkeys with individual points representing each of the four targets (color-coded) per session. The black line overlayed on the scatter indicates the least-squares linear regression fit to the data points. [T1-8: Targets 1–8].
Figure 4
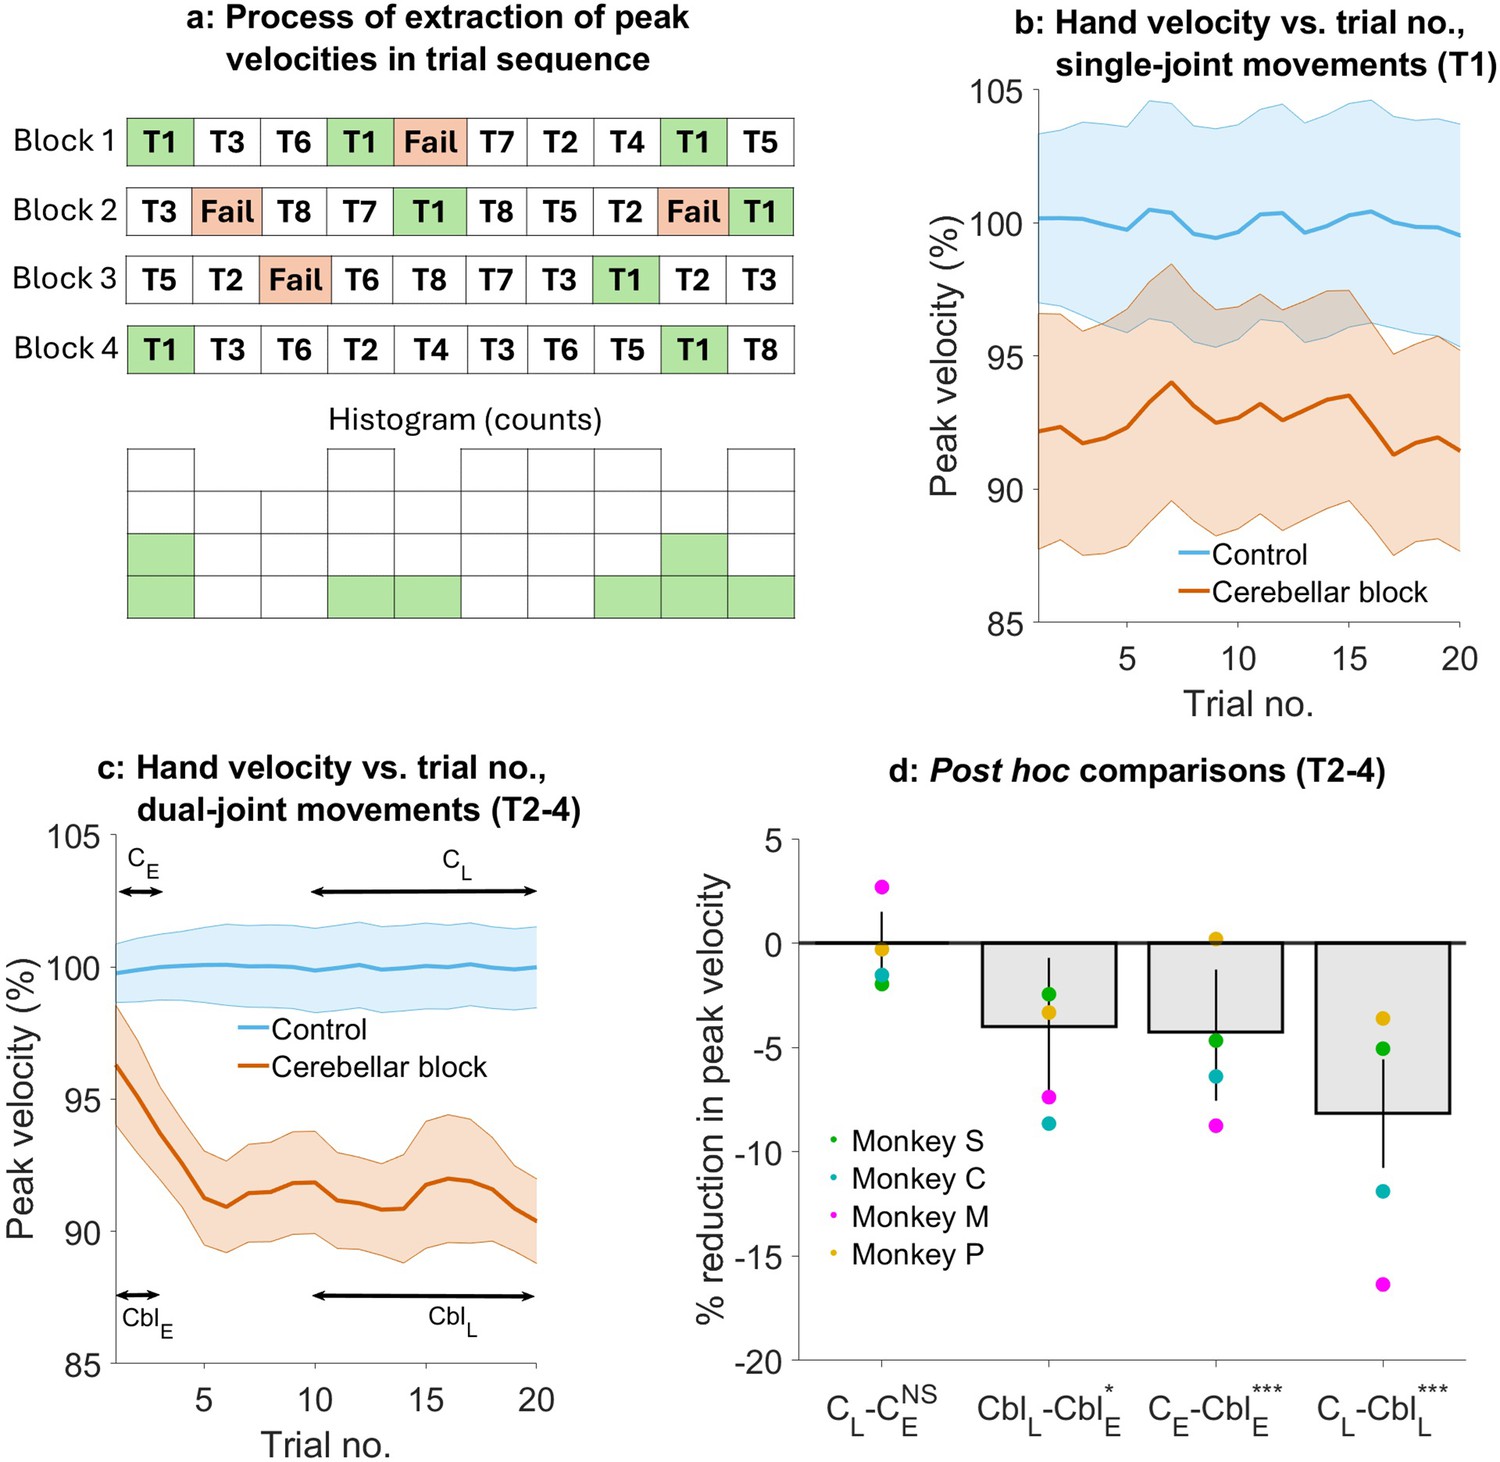
Effect of the cerebellar block on hand velocity across successive trials.
(a) Schematic of the process of extraction of peak hand velocity for movements to a particular target from blocks of control/cerebellar block trials while preserving the order in which the target was presented. For each block, the peak velocity for movements to a particular target (in this example, target 1) was extracted while retaining the trial numbers in which it was presented in the block. This enabled us to examine the evolution of the peak velocity across the sequence of presentation of the target during control vs. cerebellar block. (b) Mean ± 95% confidence intervals of the peak hand velocity for movements to target 1 across all the trial blocks pooled from all four monkeys. For each monkey, the peak hand velocities were normalized to the median peak velocity of the early trials 1–2 from all the control blocks. (c) Same as in (b) but for targets 2–4. (d) Post hoc comparisons between early trials 1–2 and late trials 11–20 during control and cerebellar block. Statistical significance is denoted as follows: p≥0.05 NS, p<0.05*, p<0.01**, p<0.001***. [E: Early, L: Late, C: Control, Cbl: Cerebellar block; T1-8: Targets 1–8].
Figure 5 with 3 supplements
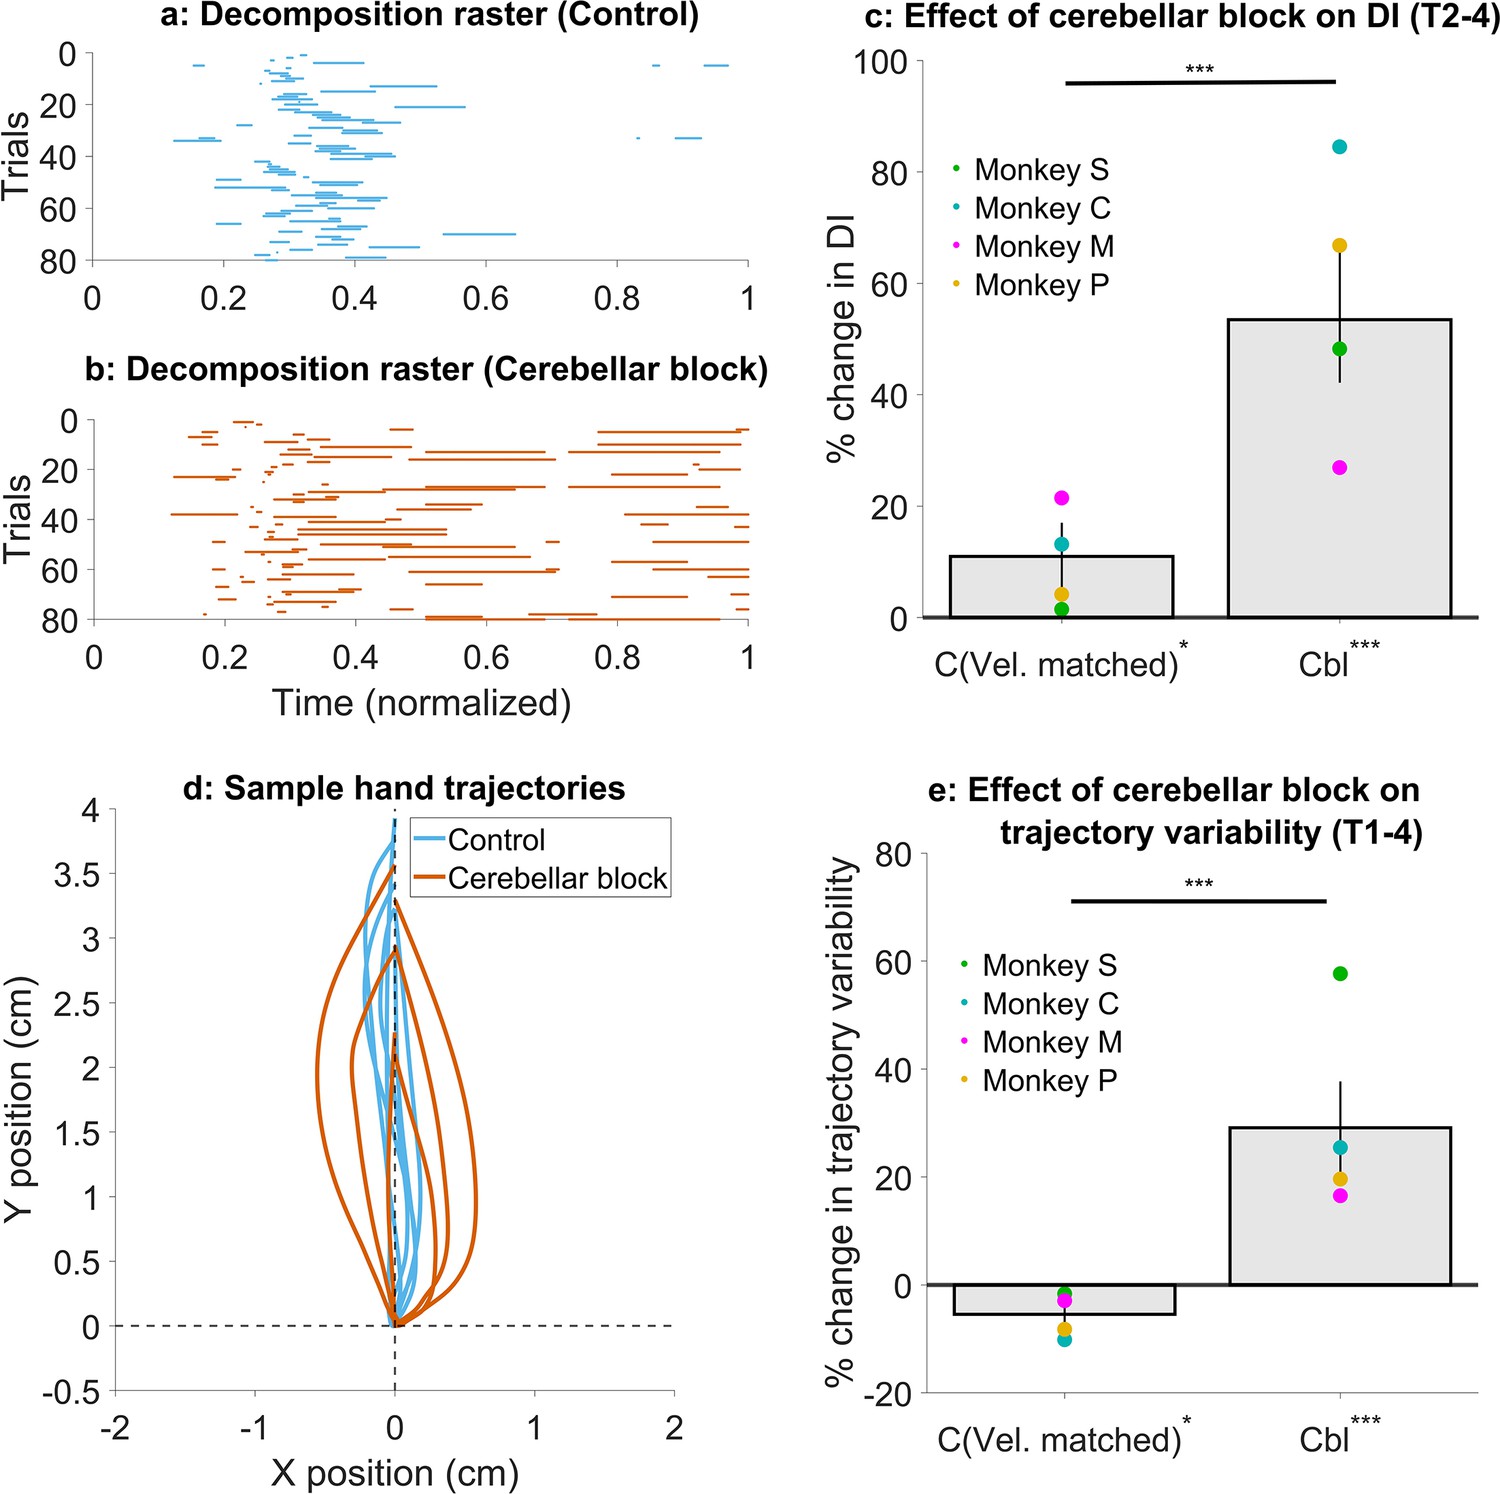
Effect of cerebellar block on movement decomposition and trial-to-trial trajectory variability.
(a–c) Effect of the cerebellar block on the decomposition of movements. (a) Binary decomposition raster of sample trials for movements made to target 2 by monkey C during control. The duration of each trial was normalized to 0–1 (bin width = 0.001) and then decomposition was computed for each bin based on whether either (but not both) of the shoulder or the elbow joint velocity was less than 20°/s. (b) Same as in (a) but for movements to target 2 by monkey C during cerebellar block. (c) Change in decomposition index (i.e. the proportion of the movement time during which the movement was decomposed, as defined above) for movements to targets 2–4 during velocity-matched control and cerebellar block trials relative to all control trials. The change in median decomposition was computed for each session. The depicted values are the mean ± 95% confidence intervals across all sessions pooled from all four monkeys. The individual means of each monkey are overlaid. (d-e) Effect of the cerebellar block on inter-trial trajectory variability. (d) Sample hand trajectories during control vs. cerebellar block trials for movements to target 2 by monkey C. The starting point of the trajectories was shifted to the origin and then they were rotated about the origin so that their endpoints lie on the positive Y-axis. (e) Change in inter-trial trajectory variability for movements to targets 2–4 during velocity-matched control and cerebellar block trials relative to all control trials. The trajectory variability was measured as the standard deviation of the maximum perpendicular distance of the trajectories from the Y-axis after transforming them as in (d). The change in trajectory variability for the cerebellar block trials was computed relative to the control trials for each session. The depicted values are the mean ± 95% confidence intervals across all sessions pooled from all four monkeys. The individual means of each monkey are overlaid. Statistical significance is denoted as follows: p≥0.05 NS, p<0.05*, p<0.01**, p<0.001***. [C: Control, Cbl: Cerebellar block; T1-8: Targets 1–8; DI: Decomposition index].
Figure 5—figure supplement 1
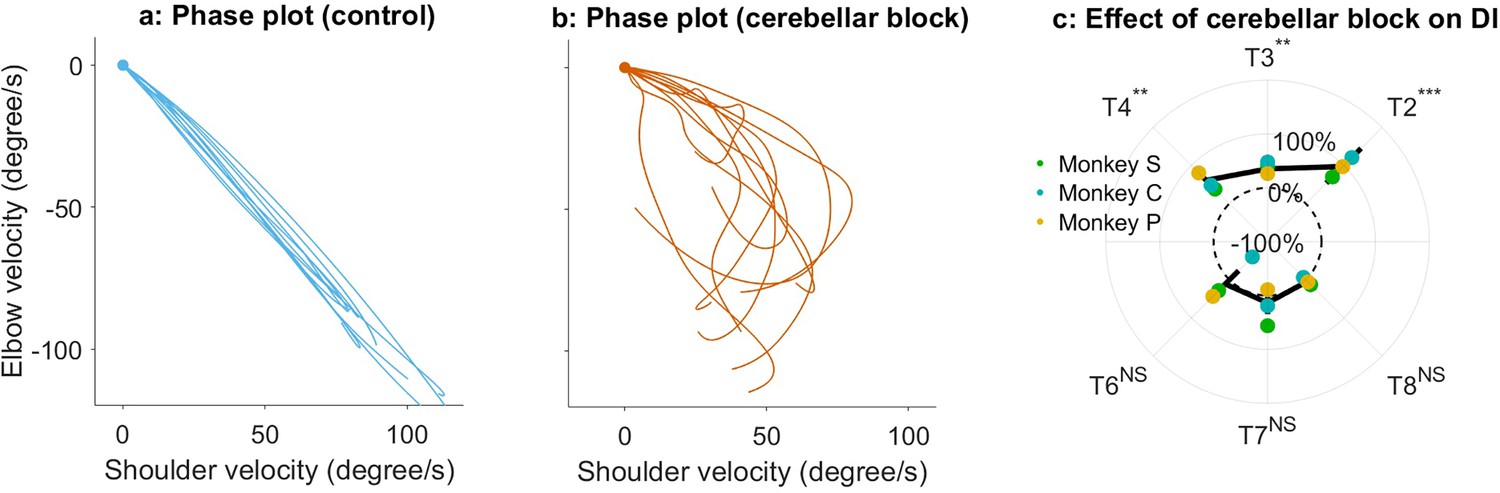
Effect of the cerebellar block on the decomposition of movements.
(a) Phase plot of elbow versus shoulder angular velocity for 10 representative zero-centered control trials (Monkey S, target 2). (b) Same as (a), but during cerebellar block. Contrasting the two plots reveals synchronous joint movements under control conditions versus asynchronous joint movements during the cerebellar block, indicating movement decomposition in the latter. (c) Change in decomposition index (i.e. the proportion of the movement time during which the movement was decomposed) for movements to each target during velocity-matched cerebellar block trials (The change in decomposition was computed per session per target as: [median decomposition index of velocity matched cerebellar block trials – median decomposition of velocity matched control trials]/median decomposition of all control trials x 100). The depicted values are the mean ± 95% confidence intervals across all sessions pooled from the individual monkeys. The individual means of each monkey are overlaid. We removed monkey M from this analysis to improve power for the statistical tests after correction for multi-comparisons since Monkey M exhibited overall low decomposition. Targets 1 and 5 were excluded from this analysis since the elbow joint is mostly stationary for movements to these targets (i.e. the net torque at the elbow is very low as shown in Figure 2—figure supplement 1). Statistical significance is denoted as follows: p≥0.05 NS, p<0.05*, p<0.01**, p<0.001*** [T1-8: Targets 1–8].
Figure 5—figure supplement 2
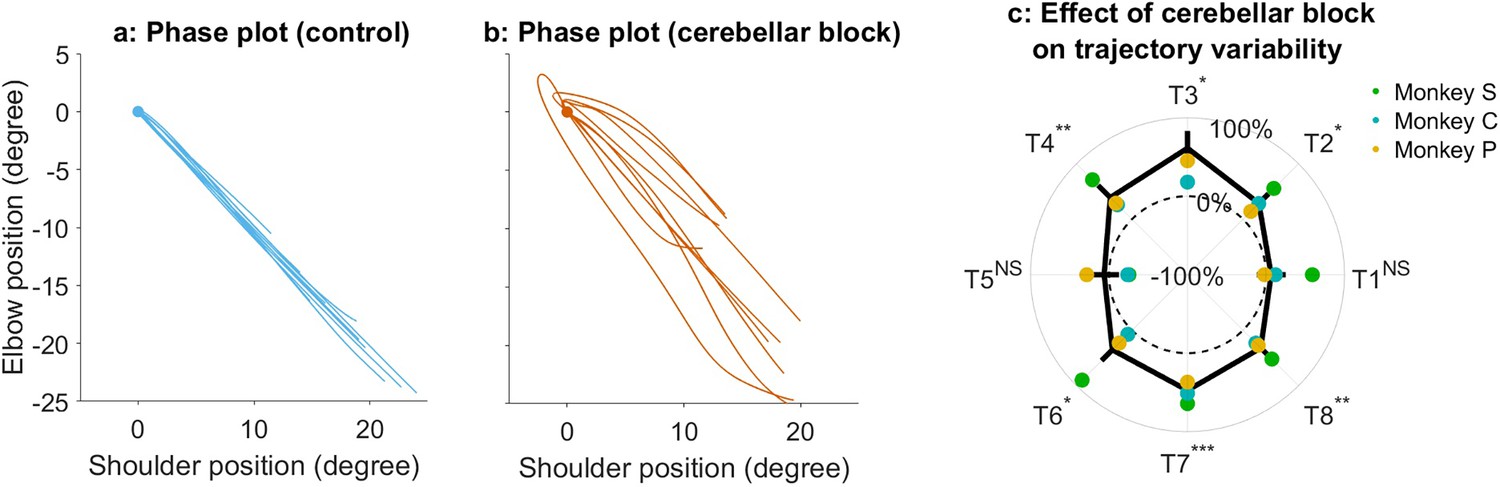
Effect of the cerebellar block on the trajectory variability.
(a) Phase plot of elbow versus shoulder angular position for 10 representative zero-centered control trials (Monkey S, target 2). (b) Same as (a), but during cerebellar block. The contrast of the two plots reveals the increased inter-trial variability in the shoulder-elbow coordination during cerebellar block relative to control which led to increased trajectory variability. (c) Change in inter-trial trajectory variability for movements to each target during velocity-matched cerebellar block trials. The trajectory variability was measured as the standard deviation of the maximum perpendicular distance of the trajectories from the Y-axis after transforming them as in Figure 5d of the main text. The change in trajectory variability for the cerebellar block trials was computed relative to the control trials per session per target. The depicted values are the mean ± 95% confidence intervals across all sessions pooled from the individual monkeys. The individual means of each monkey are overlaid. We removed monkey M from this analysis to improve power for the statistical tests after correction for multi-comparisons since Monkey M exhibited overall low trajectory variability. Statistical significance is denoted as follows: p≥0.05 NS, p<0.05*, p<0.01**, p<0.001*** [T1-8: Targets 1–8].
Figure 5—figure supplement 3
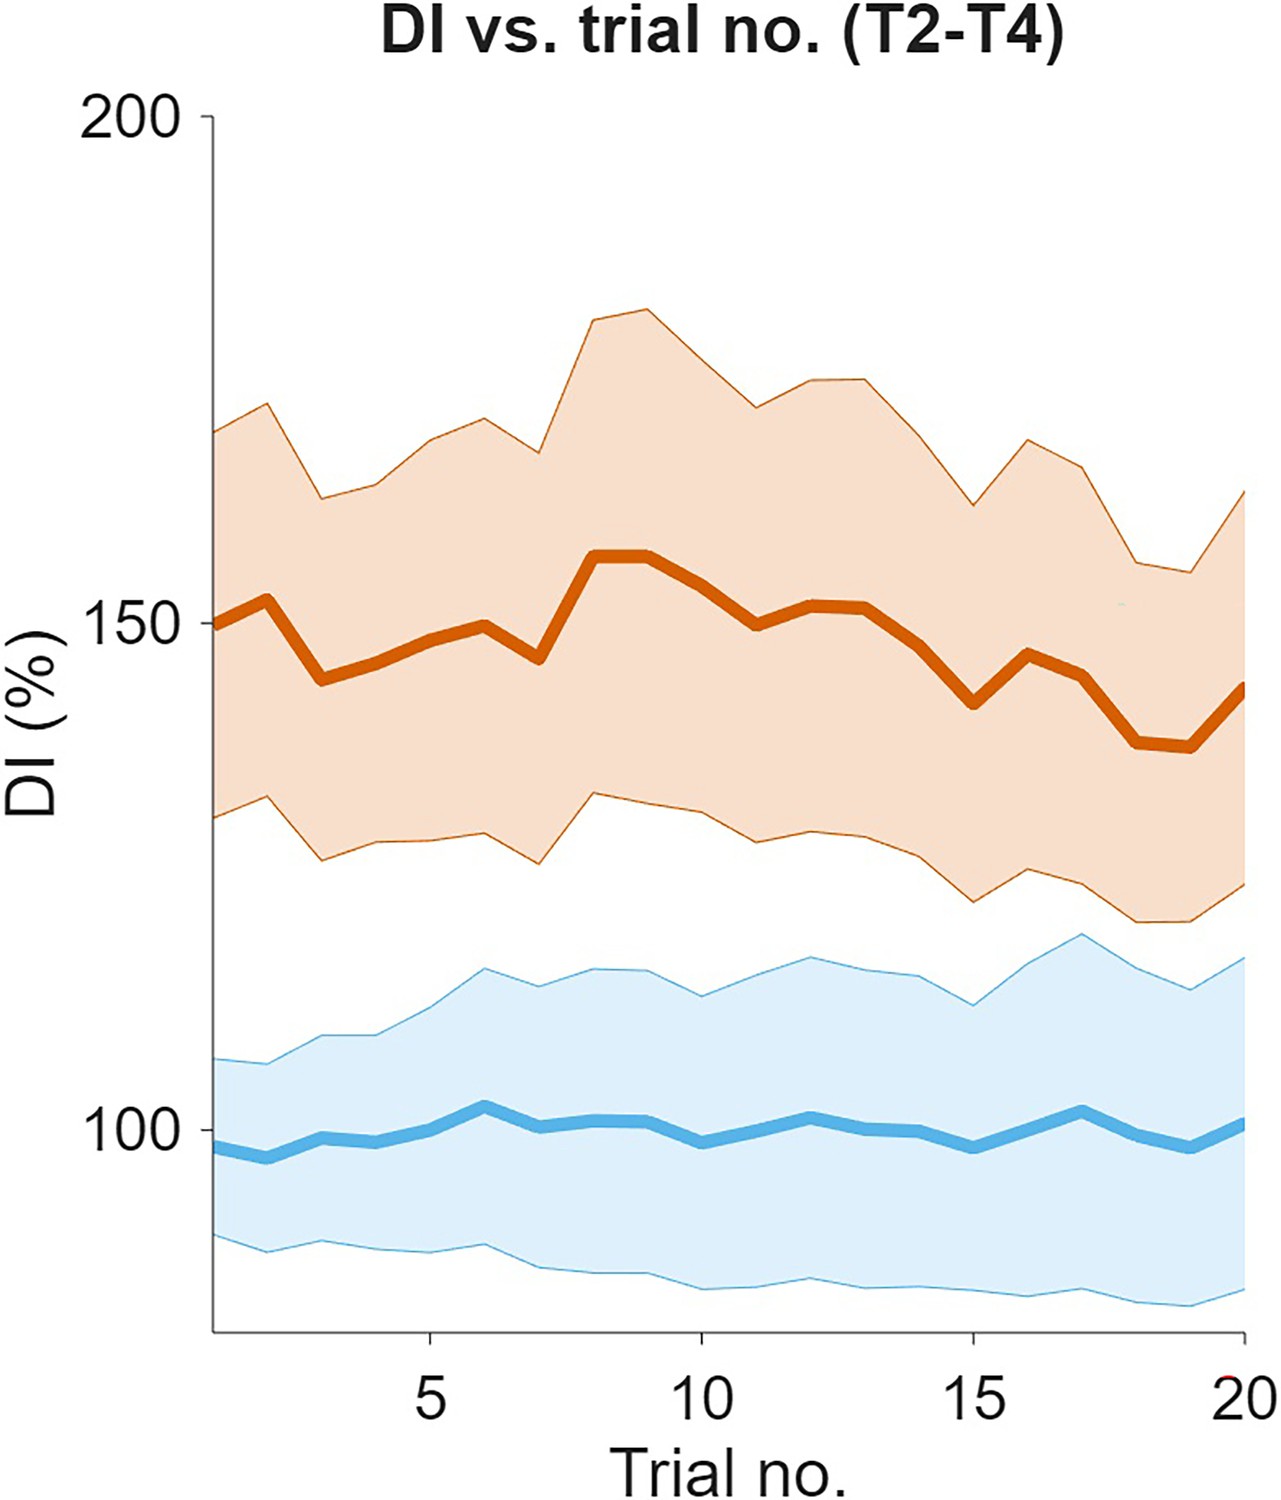
Effect of the cerebellar block on decomposition index across successive trials for movements to targets 2–4.
Decomposition index was computed as the fraction of time during a movement when either (but not both) of the shoulder or the elbow joint velocity was less than 20°/s. The decomposition indices for movements to a particular target were extracted from blocks of control/cerebellar block trials while preserving the order in which the target was presented. For each block of trials, decomposition indices for movements to a particular target were extracted while retaining the trial numbers in which it was presented in the block. This enabled us to examine the evolution of the decomposition index across the sequence of presentation of the target during control vs. cerebellar block. The figure depicts the mean ± 95% confidence intervals of the decomposition index for movements to targets 2–4 across all the trial blocks pooled from all four monkeys. For each monkey, the decomposition indices were normalized (%) to the median decomposition index of the early trials 1–2 from all the control blocks. [DI = Decomposition index, T2-4: Targets 2–4].
Additional files
-
Supplementary file 1
Mean success rate across sessions per monkey.
- https://cdn.elifesciences.org/articles/105152/elife-105152-supp1-v1.docx
-
Supplementary file 2
ANOVA marginal tests for the effect of target direction on the change in peak hand velocity due to cerebellar block relative to control (DF: degrees of freedom).
Movements exhibited a significant reduction in peak hand velocity during the cerebellar block in a target-dependent manner. The change in peak hand velocity was modeled using a linear mixed-effects model, with target as a fixed effect and random intercepts and slopes for target within each subject (i.e. monkey). For each session, the target-wise change in the median peak hand velocity during the cerebellar block trials was computed relative to that of control trials. The input to the model was the target-wise values computed from all sessions pooled across all four monkeys. The significant effect of target direction on the change in peak velocity can be interpreted as analogous to the interaction between cerebellar block and target direction on the actual peak velocities.
- https://cdn.elifesciences.org/articles/105152/elife-105152-supp2-v1.docx
-
Supplementary file 3
Comparison of peak hand velocities between outward and inward reaching movements during control conditions.
(a) ANOVA marginal tests for the effect of target group (targets 1–4 vs. targets 5–8) on peak hand velocity during control (DF: degrees of freedom). Movements exhibited no significant difference in peak hand velocity during the outward reaching (targets 1–4) vs. retrieval (targets 5–8) movements during the control condition. The peak hand velocity was modeled using a linear mixed-effects model, with the target group (T1-4 vs. T5-8) as a fixed effect and random intercepts and slopes for the target group within each subject (i.e. monkey). The median peak hand velocity during the control trials was computed for each session. The input to the model was the target group-wise values computed from all sessions pooled across all four monkeys. (b) Mean peak hand velocity for outward reaching (targets 1–4) vs. inward reaching (targets 5–8) movements during control across all sessions per monkey. For each session, the median peak hand velocity was computed across all the control trials per target group. Then, the mean and confidence intervals of the mean were computed from the per-session data for each monkey.
- https://cdn.elifesciences.org/articles/105152/elife-105152-supp3-v1.docx
-
Supplementary file 4
ANOVA marginal tests for the effect of target direction on the change in shoulder muscle torque impulse due to cerebellar block relative to control (DF: degrees of freedom).
Movements exhibited a significant reduction in shoulder muscle torque impulse during the cerebellar block in a target-dependent manner. The torque impulse was computed by integrating the torque profile during the positive acceleration phase of the movement. The change in muscle torque impulse was modeled using a linear mixed-effects model, with target as a fixed effect and random intercepts and slopes for target within each subject (i.e. monkey). For each session, the target-wise change in the median muscle torque impulse during the cerebellar block trials was computed relative to that of control trials. The input to the model was the target-wise values computed from all sessions pooled across all four monkeys. The significant effect of target direction on the change in muscle torque impulse can be interpreted as analogous to the interaction between cerebellar block and target direction on the actual peak velocities.
- https://cdn.elifesciences.org/articles/105152/elife-105152-supp4-v1.docx
-
Supplementary file 5
ANOVA marginal tests for the effect of target direction on the change in elbow muscle torque impulse due to cerebellar block relative to control (DF: degrees of freedom).
Movements exhibited a significant reduction in elbow muscle torque impulse during the cerebellar block in a target-dependent manner. The torque impulse was computed by integrating the torque profile during the positive acceleration phase of the movement. The change in muscle torque impulse was modeled using a linear mixed-effects model, with target as a fixed effect and random intercepts and slopes for target within each subject (i.e. monkey). For each session, the target-wise change in the median muscle torque impulse during the cerebellar block trials was computed relative to that of control trials. The input to the model was the target-wise values computed from all sessions pooled across all four monkeys.
- https://cdn.elifesciences.org/articles/105152/elife-105152-supp5-v1.docx
-
Supplementary file 6
ANOVA marginal tests for the effect of trial sequence and trial type (control/cerebellar block) on the peak hand velocity relative to first two trials in control for movements to target 1 (DF: degrees of freedom).
The evolution of peak hand velocities during control vs. cerebellar block was analyzed by preserving the order of presentation of the target in each block of trials (i.e. trial sequence). For each monkey, the peak hand velocities were normalized to the median peak velocity of the early trials 1–2 in the control blocks. The normalized peak velocities were then modeled using a linear mixed-effects model, with trial type (control/cerebellar block) and trial sequence (1-20) as fixed effects and random intercepts and slopes for trial type and trial sequence within each subject (i.e. monkey).
- https://cdn.elifesciences.org/articles/105152/elife-105152-supp6-v1.docx
-
Supplementary file 7
ANOVA marginal tests for the effect of trial sequence and trial type (control/cerebellar block) on the peak hand velocity relative to first two trials in control for movements to target 2–4 (DF: degrees of freedom).
The evolution of peak hand velocities during control vs. cerebellar block was analyzed by preserving the order of presentation of the target in each block of trials (i.e. trial sequence). For each monkey, the peak hand velocities were normalized to the median peak velocity of the early trials 1–2 in the control blocks. The normalized peak velocities were then modeled using a linear mixed-effects model, with trial type (control/cerebellar block) and trial sequence (1-20) as fixed effects and random intercepts and slopes for trial type and trial sequence within each subject (i.e. monkey).
- https://cdn.elifesciences.org/articles/105152/elife-105152-supp7-v1.docx
-
Supplementary file 8
ANOVA marginal tests for the effect of trial sequence and trial type (control/cerebellar block) on movement decomposition relative to first two trials in control for movements to targets 2–4 (DF: degrees of freedom).
The evolution of decomposition index (measured as the fraction of time during a movement when either, but not both, of the shoulder or the elbow joint velocity was less than 20°/s) during control vs. cerebellar block was analyzed by preserving the order of presentation of the target in each block of trials (i.e. trial sequence). For each monkey, the decomposition indices were normalized to the median decomposition index of the early trials 1–2 in the control blocks. The normalized decomposition indices were then modeled using a linear mixed-effects model, with trial type (control/cerebellar block) and trial sequence (1-20) as fixed effects and random intercepts and slopes for trial type and trial sequence within each subject (i.e. monkey).
- https://cdn.elifesciences.org/articles/105152/elife-105152-supp8-v1.docx
-
MDAR checklist
- https://cdn.elifesciences.org/articles/105152/elife-105152-mdarchecklist1-v1.docx
Download links
A two-part list of links to download the article, or parts of the article, in various formats.
Downloads (link to download the article as PDF)
Open citations (links to open the citations from this article in various online reference manager services)
Cite this article (links to download the citations from this article in formats compatible with various reference manager tools)
Disentangling acute motor deficits and adaptive responses evoked by the loss of cerebellar output
eLife 14:RP105152.
https://doi.org/10.7554/eLife.105152.4


