The representation of facial emotion expands from sensory to prefrontal cortex with development
- Baylor College of Medicine, United States
- Rice University, United States
Figures
Figure 1
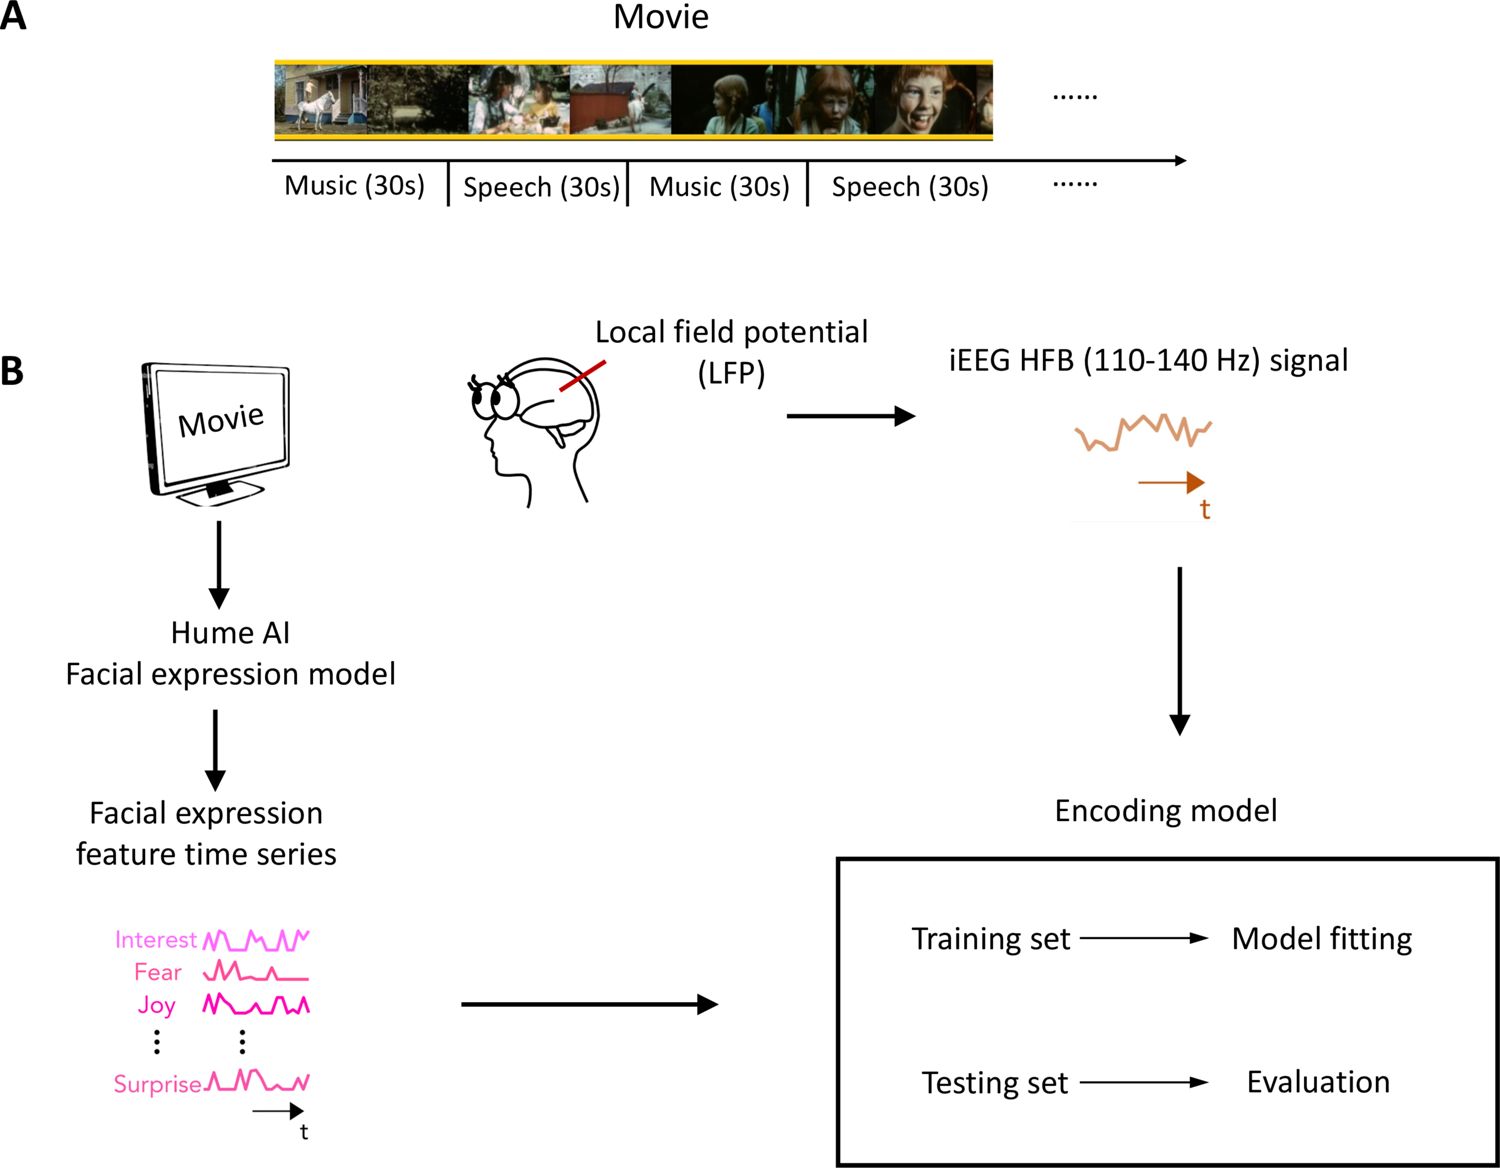
Task design and analysis methods.
(A) Movie structure. A 6.5 min short film was created by editing fragments from Pippi on the Run into a coherent narrative. The movie consisted of 13 interleaved blocks of videos accompanied by speech or music. (B) Data analysis schematic. Standard analysis pipeline for extracting emotion features from the movie and constructing an encoding model to predict intracranial EEG (iEEG) responses while participants watch the short film.
© 1970, Beta Film GmbH. All rights reserved. Screenshots in panel A are taken from 'Pippi on the Run' (1970). These are not covered by the CC-BY 4.0 license.
Figure 2
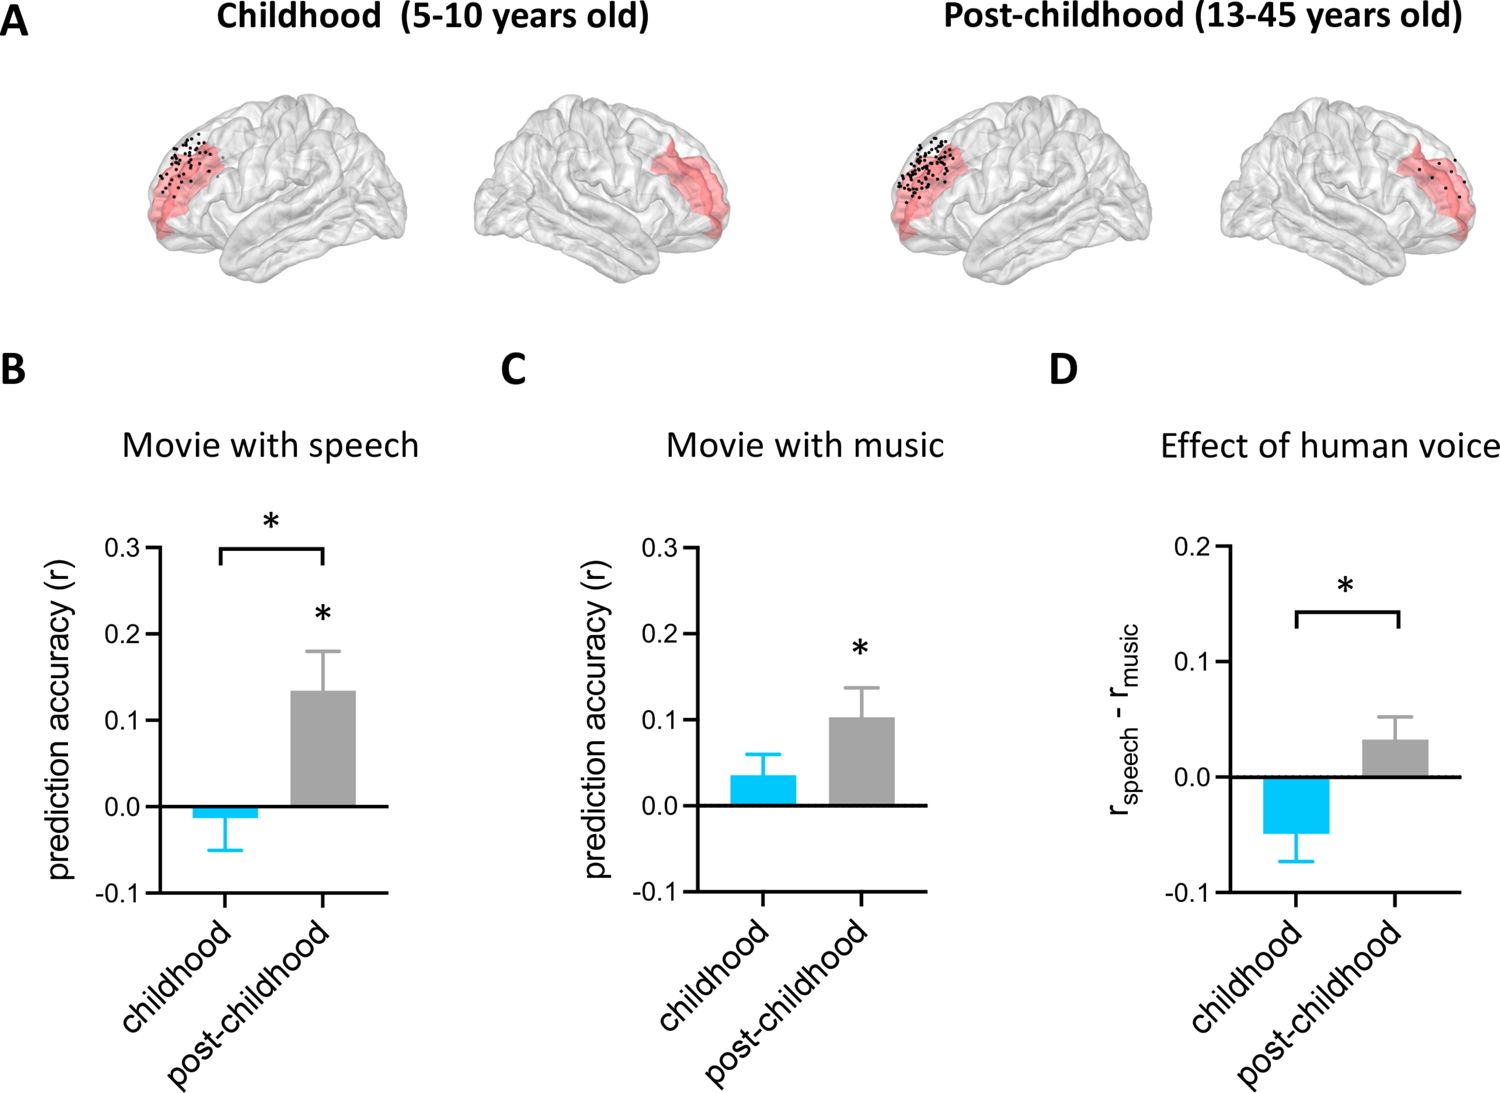
Prediction performance of encoding models in dorsolateral prefrontal cortex (DLPFC).
(A) Spatial distribution of electrodes in DLPFC. Electrodes in all participants from each group are projected onto the Montreal Neurological Institute (MNI) space and shown on the average brain. Red shaded areas indicate middle frontal cortex provided by the FreeSurfer Desikan-Killiany atlas (Desikan et al., 2006). Electrodes outside the DLPFC are not shown. (B) Averaged prediction accuracy across participants for speech condition. The performance of the encoding model is measured as Pearson correlation coefficient (r) between measured and predicted brain activities. (C) Averaged prediction accuracy across participants for music condition. (D) Prediction accuracy difference between speech condition and music condition for each group. Error bars are standard error of the mean. *p<0.05. (Nchildhood=8, Npost-childhood=13).
-
Figure 2—source data 1
Prediction performance of encoding models in dorsolateral prefrontal cortex (DLPFC).
- https://cdn.elifesciences.org/articles/107636/elife-107636-fig2-data1-v1.xlsx
Figure 3
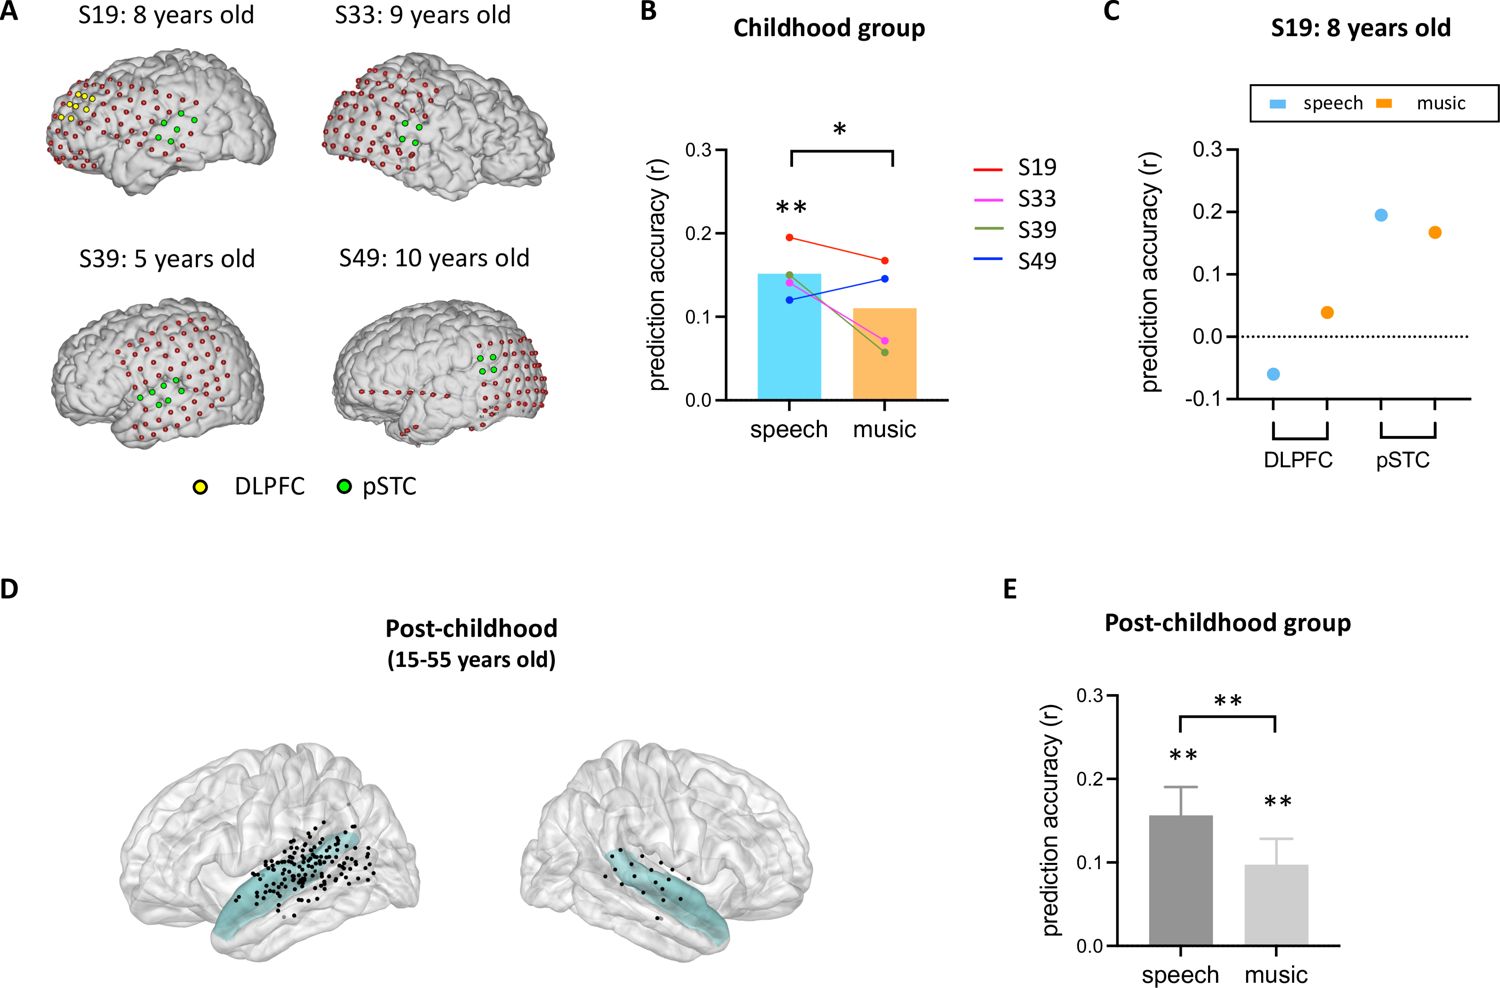
Prediction performance of encoding models in posterior superior temporal cortex (pSTC).
(A) The electrode distribution in the native brain space for the four children. Electrodes in pSTC are green, and electrodes in dorsolateral prefrontal cortex (DLPFC) are yellow. (B) Prediction accuracy of encoding models in children. Bars indicate mean prediction accuracy across participants and lines indicate individual data. (C) Prediction accuracy of encoding models for S19 in both DLPFC and pSTC. (D) Spatial distribution of recording contacts in post-childhood participants’ pSTC. The pSTC electrodes identified in individual space are projected onto Montreal Neurological Institute (MNI) space and shown on the average brain. Contacts other than pSTC are not shown. Blue shaded areas indicate superior temporal cortex provided by the FreeSurfer Desikan-Killiany atlas (Desikan et al., 2006). (E) Averaged prediction accuracy across post-childhood participants (N=25). Error bars are standard error of the mean. **p<0.01. *p<0.05.
-
Figure 3—source data 1
Prediction performance of encoding models in posterior superior temporal cortex (pSTC).
- https://cdn.elifesciences.org/articles/107636/elife-107636-fig3-data1-v1.xlsx
Figure 4
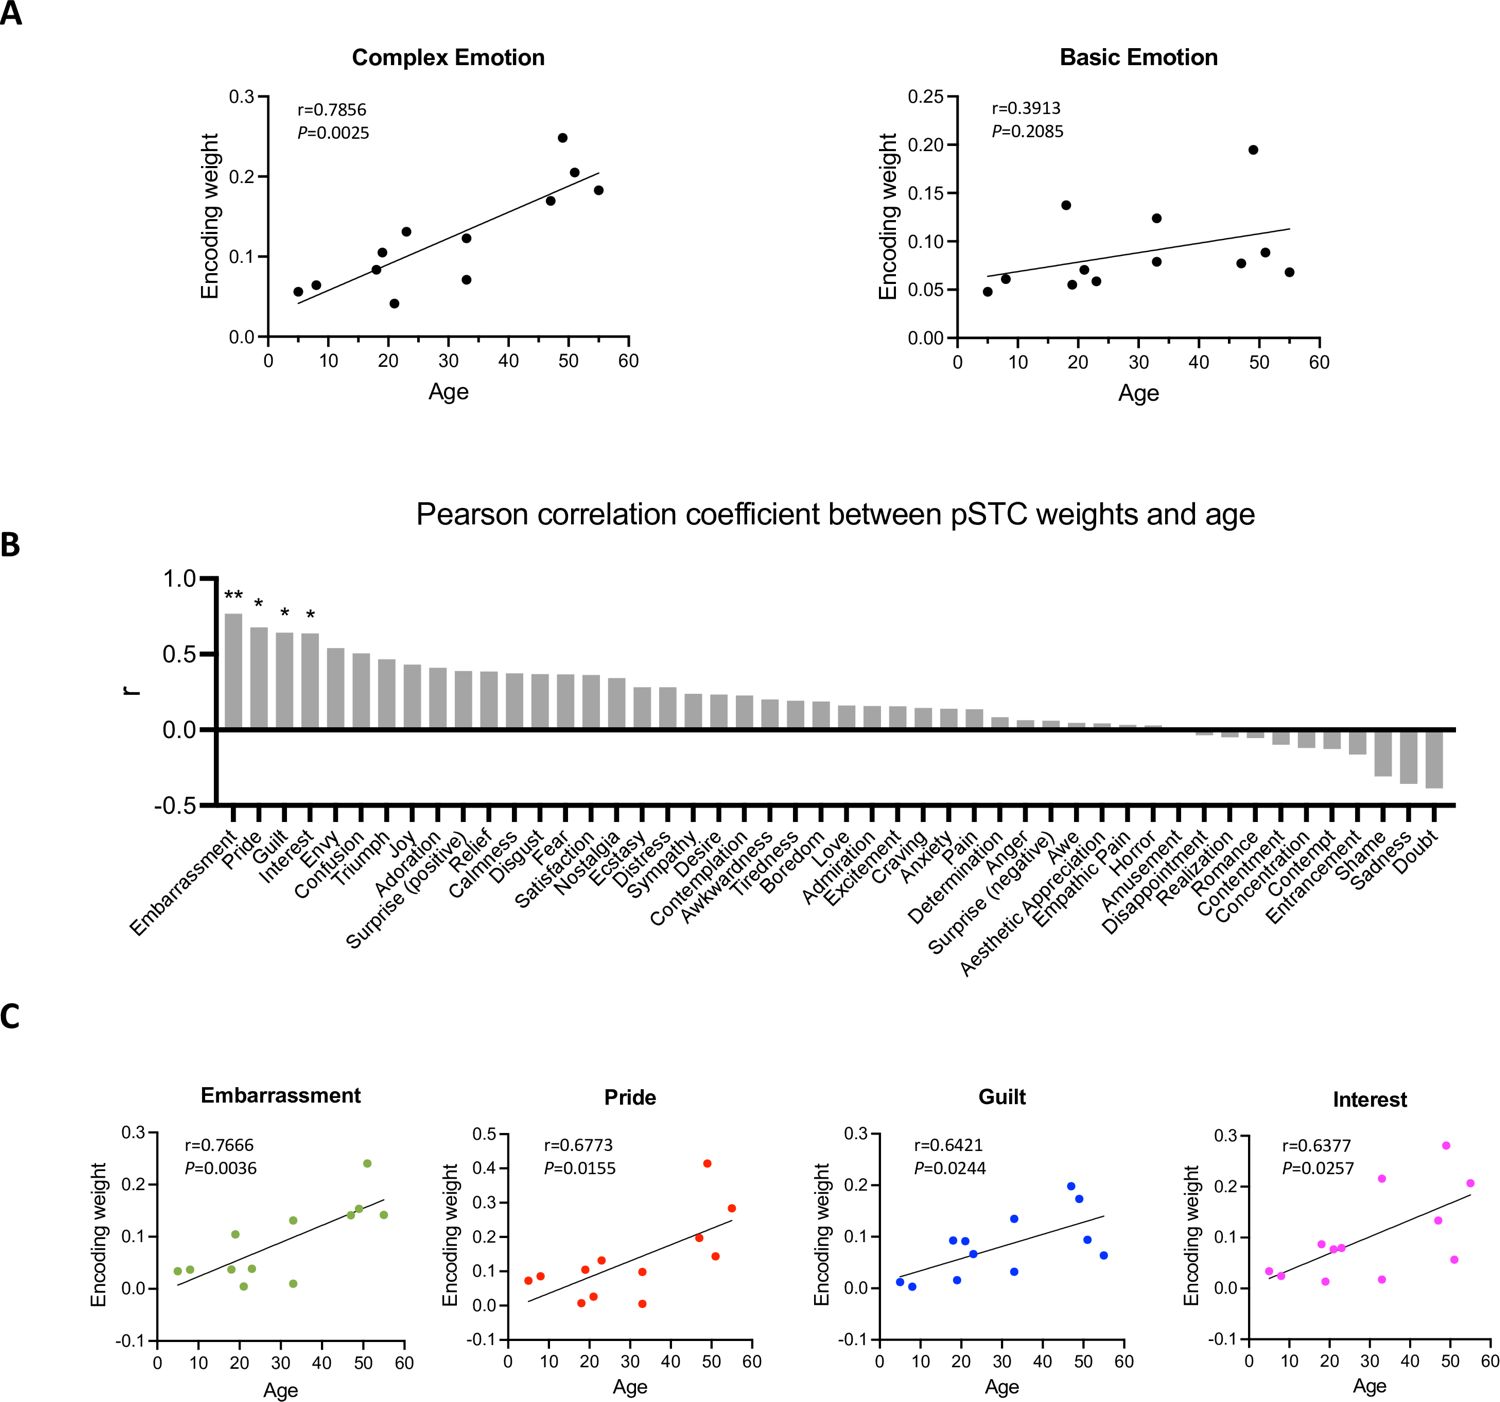
Correlation between encoding weights and age.
(A) Left: Correlation between averaged encoding weights of five complex emotions and age. Right: Correlation between averaged encoding weights of six basic emotions and age. (B) Pearson correlation coefficient between encoding weights of 48 facial expression features and age. The results are ranked from largest to smallest. Significant correlations noted with * (p<0.05, uncorrected) or ** (p<0.01, uncorrected). (C) Correlation between encoding weights of embarrassment, pride, guilt, interest and age (N=12).
-
Figure 4—source data 1
Encoding weight and age.
- https://cdn.elifesciences.org/articles/107636/elife-107636-fig4-data1-v1.xlsx
Author response image 1
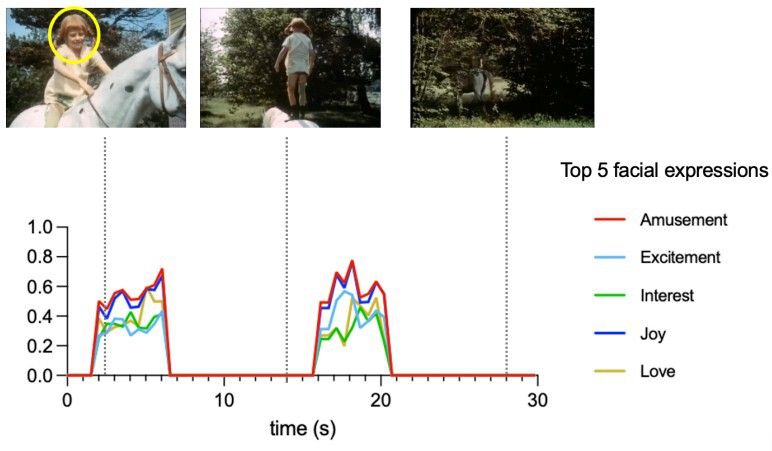
Time courses of Hume AI extracted facial expression features for the first block of music condition.
Only top 5 facial expressions were shown here to due to space limitation.
© 1970, Beta Film GmbH. All rights reserved. Screenshots in panel A are taken from 'Pippi on the Run' (1970). These are not covered by the CC-BY 4.0 license.
Author response image 2
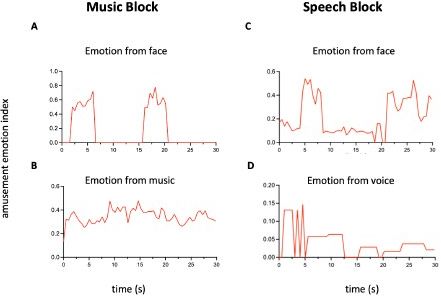
Time courses of the amusement.
(A) and (B) Amusement conveyed by face or music in a 30-s music block. Facial emotion features are extracted by Hume AI. For emotion from music, we approximated the amusement time course using a weighted combination of low-level acoustic features (RMS energy, spectral centroid, MFCCs), which capture intensity, brightness, and timbre cues linked to amusement. Notice that music continues when there are no faces presented. (C) and (D) Amusement conveyed by face or voice in a 30-s speech block. From 0 to 5 s, a girl is introducing her friend to a stranger. The camera focuses on the friend, who appears nervous, while the girl’s voice sounds cheerful. This mismatch explains why the shapes of the two time series differ at the beginning. Such situations occur frequently in naturalistic movies
Author response image 3
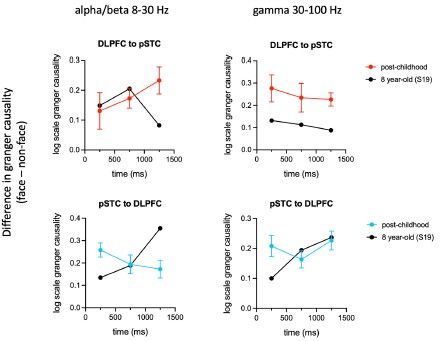
Difference of Granger causality indices (face – nonface) in alpha/beta and gamma band for both directions.
We identified a series of face onset in the movie that paticipant watched. Each trial was defined as -0.1 to 1.5 s relative to the onset. For the non-face control trials, we used houses, animals and scenes. Granger causality was calculated for 0-0.5 s, 0.5-1 s and 1-1.5 s time window. For the post-childhood group, GC indices were averaged across participants. Error bar is sem.
Tables
Key resources table
| Reagent type (species) or resource | Designation | Source or reference | Identifiers | Additional information |
|---|---|---|---|---|
| Software, algorithm | MNE-Python | MNE-Python | RRID:SCR_005972 | |
| Software, algorithm | Python | Python | RRID:SCR_008394 | |
| Software, algorithm | FreeSurfer | FreeSurfer | RRID:SCR_001847 | |
| Software, algorithm | Hume AI | Hume AI |
Table 1
Demographic information of childhood group.
| ID | Sex | Age | Number of recording contacts in left pSTC | Number of recording contacts in right pSTC | Number of recording contacts in left DLPFC | Number of recording contacts in right DLPFC |
|---|---|---|---|---|---|---|
| s02 | F | 9 | 0 | 0 | 9 | 0 |
| s10 | F | 8 | 0 | 0 | 8 | 0 |
| s19 | F | 8 | 6 | 0 | 8 | 0 |
| s32 | F | 6 | 0 | 0 | 5 | 0 |
| s33 | F | 9 | 0 | 4 | 0 | 0 |
| s37 | M | 5 | 0 | 0 | 4 | 0 |
| s39 | F | 5 | 7 | 0 | 0 | 0 |
| s41 | M | 7 | 0 | 0 | 4 | 0 |
| s49 | F | 10 | 4 | 0 | 0 | 0 |
| s50 | F | 9 | 0 | 0 | 6 | 0 |
| s63 | M | 5 | 0 | 0 | 9 | 0 |
Table 2
Demographic information of post-childhood group.
| ID | Sex | Age | Number of recording contacts in left pSTC | Number of recording contacts in right pSTC | Number of recording contacts in left DLPFC | Number of recording contacts in right DLPFC |
|---|---|---|---|---|---|---|
| s1 | M | 55 | 0 | 4 | 0 | 0 |
| s3 | F | 33 | 6 | 0 | 6 | 0 |
| s5 | F | 33 | 8 | 0 | 8 | 0 |
| s6 | F | 43 | 9 | 0 | 0 | 0 |
| s12 | M | 37 | 0 | 0 | 12 | 0 |
| s14 | F | 18 | 4 | 0 | 8 | 0 |
| s16 | M | 17 | 8 | 0 | 9 | 0 |
| s17 | M | 28 | 0 | 8 | 0 | 0 |
| s18 | F | 15 | 6 | 0 | 11 | 0 |
| s20 | F | 25 | 9 | 0 | 0 | 0 |
| s22 | M | 21 | 4 | 0 | 0 | 0 |
| s24 | F | 47 | 11 | 0 | 0 | 0 |
| s25 | M | 14 | 0 | 0 | 6 | 0 |
| s26 | F | 48 | 11 | 0 | 0 | 0 |
| s27 | M | 15 | 11 | 0 | 0 | 0 |
| s28 | M | 21 | 0 | 6 | 0 | 0 |
| s31 | F | 13 | 0 | 0 | 7 | 0 |
| s34 | F | 51 | 5 | 0 | 0 | 0 |
| s38 | F | 14 | 0 | 0 | 4 | 0 |
| s40 | M | 49 | 6 | 0 | 0 | 0 |
| s43 | M | 19 | 0 | 4 | 0 | 8 |
| s45 | M | 19 | 0 | 0 | 4 | 0 |
| s48 | F | 18 | 5 | 0 | 0 | 0 |
| s51 | M | 46 | 6 | 0 | 9 | 0 |
| s54 | F | 31 | 4 | 0 | 0 | 0 |
| s55 | F | 23 | 6 | 0 | 0 | 0 |
| s57 | F | 36 | 0 | 0 | 7 | 0 |
| s58 | F | 16 | 6 | 0 | 0 | 0 |
| s59 | F | 30 | 7 | 0 | 0 | 0 |
| s60 | M | 42 | 8 | 0 | 0 | 0 |
| s61 | F | 16 | 8 | 0 | 0 | 0 |
Additional files
Download links
A two-part list of links to download the article, or parts of the article, in various formats.
Downloads (link to download the article as PDF)
Open citations (links to open the citations from this article in various online reference manager services)
Cite this article (links to download the citations from this article in formats compatible with various reference manager tools)
The representation of facial emotion expands from sensory to prefrontal cortex with development
eLife 14:RP107636.
https://doi.org/10.7554/eLife.107636.3


