Verbal Episodic Processing in Newborns
- Department of Developmental Psychology and Socialisation; Padova Neuroscience Center, University of Padua, Italy
- Neonatal Intensive Care Unit, Department of Women’ and Children's Health, University Hospital of Padova, Italy
Figures
Figure 1

Experimental protocol.
(A) Illustrative 42-channel fNIRS Montage. S (red)=source, D (blue)=detector. Placement indicated using the 10–10 standard EEG system. Regions of interest are indicated in yellow = inferior frontal gyrus (IFG), in green = superior temporal gyrus (STG), and in pink = parietal lobes (PL). (B) Familiarization-interference-test paradigm. Each subject was tested in two sequences separated by 9 min of silence: in one sequence, newborns heard the same word during familiarization and test (same-word condition; X u X), and in the other sequence, a novel word was presented during the test phase (novel-word condition; Y w Z). The order of the conditions, the words, and the voices used in the different phases were counterbalanced across participants.
Figure 2

Standard recognition response with decreased activity for the familiar words and increased activity for the novel words in the test phase.
(A) Mean activity for HbO per block during the familiarization, interference, and test phases. Error bars represent the standard errors. The black continuous line depicts responses averaged across all participants and conditions. The same-word condition (green) and the novel-word condition (purple) are plotted in the test phase. The black asterisks during the familiarization and interference phases indicate that the response differed from zero. The red lines indicate a significant linear trend, as indicated by the red asterisks. Black asterisks during the test phase indicate significant differences between conditions. (B) HRFs for HbO during the second block of the test phase, when relevant differences were observed between conditions. Shaded areas represent the standard error.
Figure 3

Differences in the response across groups during the second test block.
Boxplots represent the mean HbO activity during the second block of the test phase, separated by condition (same = green, novel = purple), group (A or B), and sequence (first = full pattern or second = dotted pattern). Whiskers of the boxplot are defined based on 1.5 times the interquartile range, and data points outside these limits are plotted as circles. Asterisks indicated significant differences between conditions or groups. A significant effect of conditions was observed in the left IFG and the left and right STG, reflecting recognition in both groups. Instead, an interaction effect was present in the right IFG with higher activity in the novel-word condition for group A.
Appendix 1—figure 1

Grand HRF across all blocks.
Shaded areas represent the standard error across subjects. HbO is represented in red and HbR in blue.
Appendix 1—figure 2

Block activity for HbR during the learning, interference, and test phases.
Error bars represent the standard errors. The black continuous line depicts responses averaged across all participants and conditions. The same-word condition (green) and the novel-word condition (purple) are plotted in the test phase. The black asterisks during the learning and interference phases indicate that the response differed from zero. The red lines indicate a significant linear trend, as indicated by the red asterisks. No significant differences between conditions were observed (p>0.1).
Appendix 1—figure 3

Differences in habituation responses during the familiarization phase across sequences.
(A) Mean activity for HbO over blocks during the first (full-line) and second (dashed-line) familiarization phases. Error bars represent the standard errors. Asterisks indicate blocks showing significant differences between the first and second familiarization phases. The red lines indicate a significant linear trend, as indicated by the red asterisks. For the first familiarization, the LMM act ~ –1+ROI + ROI:blocknumber + (1|sub), with blocknumber ranging from 0 to 4 showed a significant increase in activity over blocks in the left and right STG (left: slope = 0.098, SE = 0.024, p=0.00005; right: slope = 0.048, SE = 0.024, p=0.045) and left PL (slope = 0.053, SE = 0.024, p=0.027). During the second familiarization, the activity was higher than zero in the first block and decreased with block number on the right STG (intercept = 0.196, SE = 0.071, p=0.0066; slope = −0.055, SE = 0.026, p=0.033), and left and right IFG (left: intercept = 0.225, SE = 0.071, p=0.0019; slope = −0.071, SE = 0.026, p=0.0056). (B) Mean activity for HbO during the first block of the familiarization phase over STG and IFG, where major differences between the first and second testing sequence were observed. First sequence: full box; second sequence: dotted box. The colors indicate whether the familiarization belongs to the same or novel word testing sequence.
Appendix 1—figure 4

Habituation responses during the interference phase across sequences.
Mean activity for HbO over blocks during the first (full-line) and second (dashed-line) interference phases. Error bars represent the standard errors. Asterisks indicate blocks showing significant differences between the first and second familiarization phases.
Tables
Appendix 1—table 1
Acoustic features across speakers.
Analysis of acoustic features across speakers (familiarization and test pseudowords: voice_female_1; voice_female_2; interference words: voice_male_1; voice_male_2). Intensity and duration were held constant for each word (70 dB and 700 ms, respectively), while pitch (F0) and timbre (F1 and F2 of vowels) were extracted to assess acoustic differences across speakers.
| mita | |
|---|---|
| voice_female_1 | voice_female_1 |
| pitch: 201.57 F1_mita_/i/: 376.65 F2_mita_/i/: 1249.95 F1_mita_/a/: 875.63 F2_mita_/a/: 1499.28 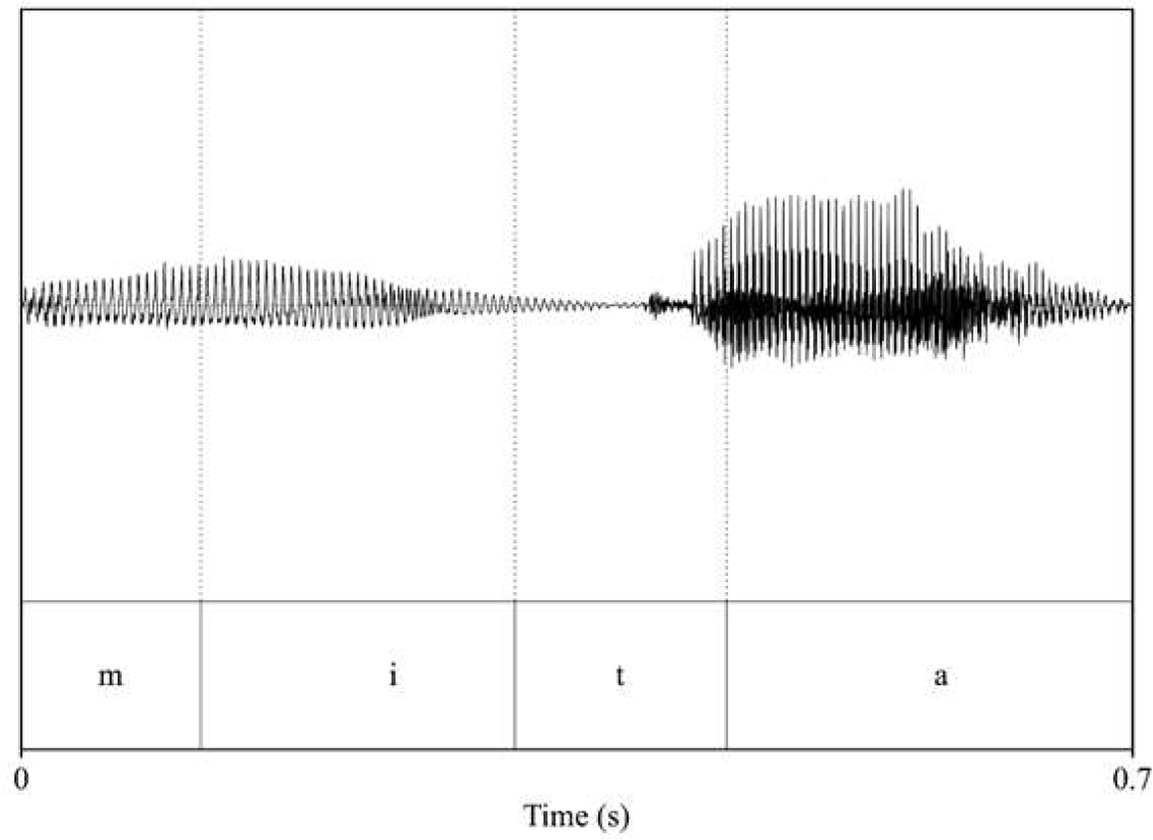 | pitch: 188.43 F1_mita_/i/: 360.56 F2_mita_/i/: 2732.94 F1_mita_/a/: 865.07 F2_mita_/a/: 1369.88 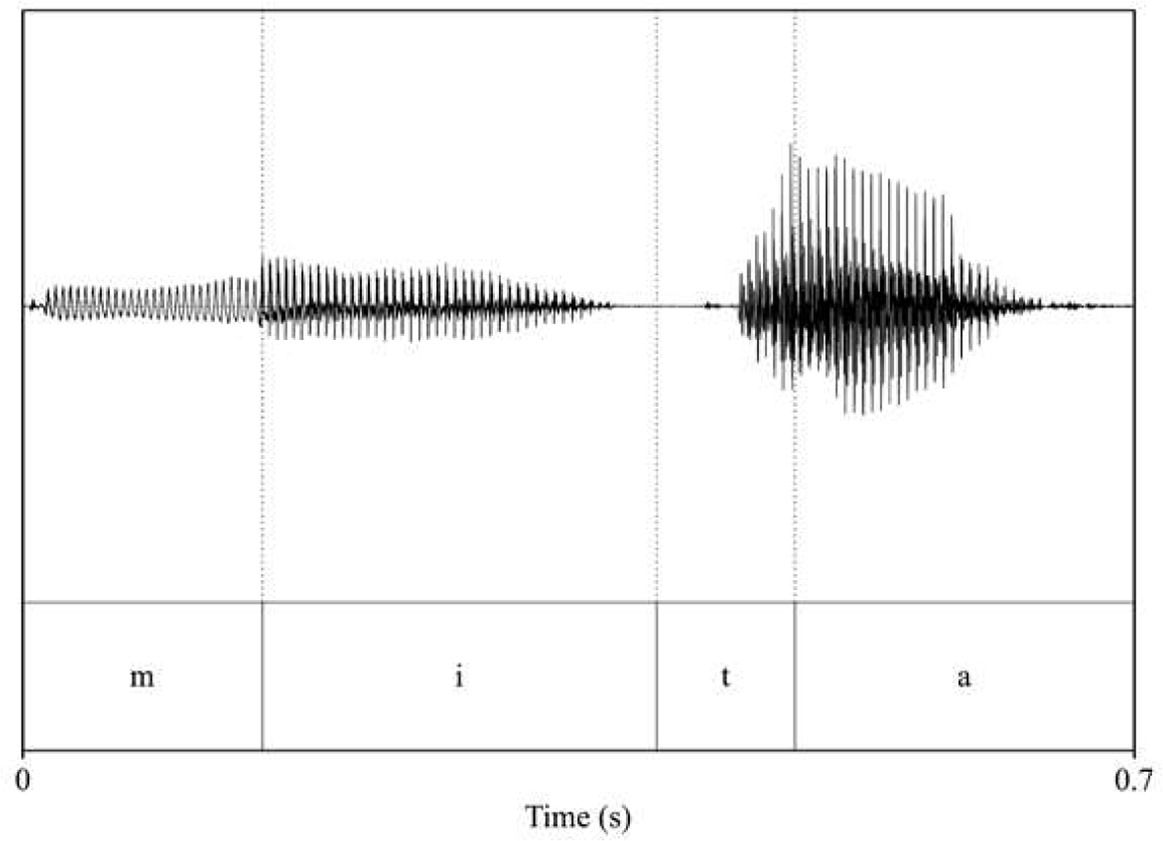 |
| pelu | |
| voice_female_1 | voice_female_2 |
| pitch: 171.44 F1_pelu_/e/: 413.5 F2_pelu_/e/: 2441.28 F1_pelu_/u/: 405.49 F2_pelu_/u/: 822.86 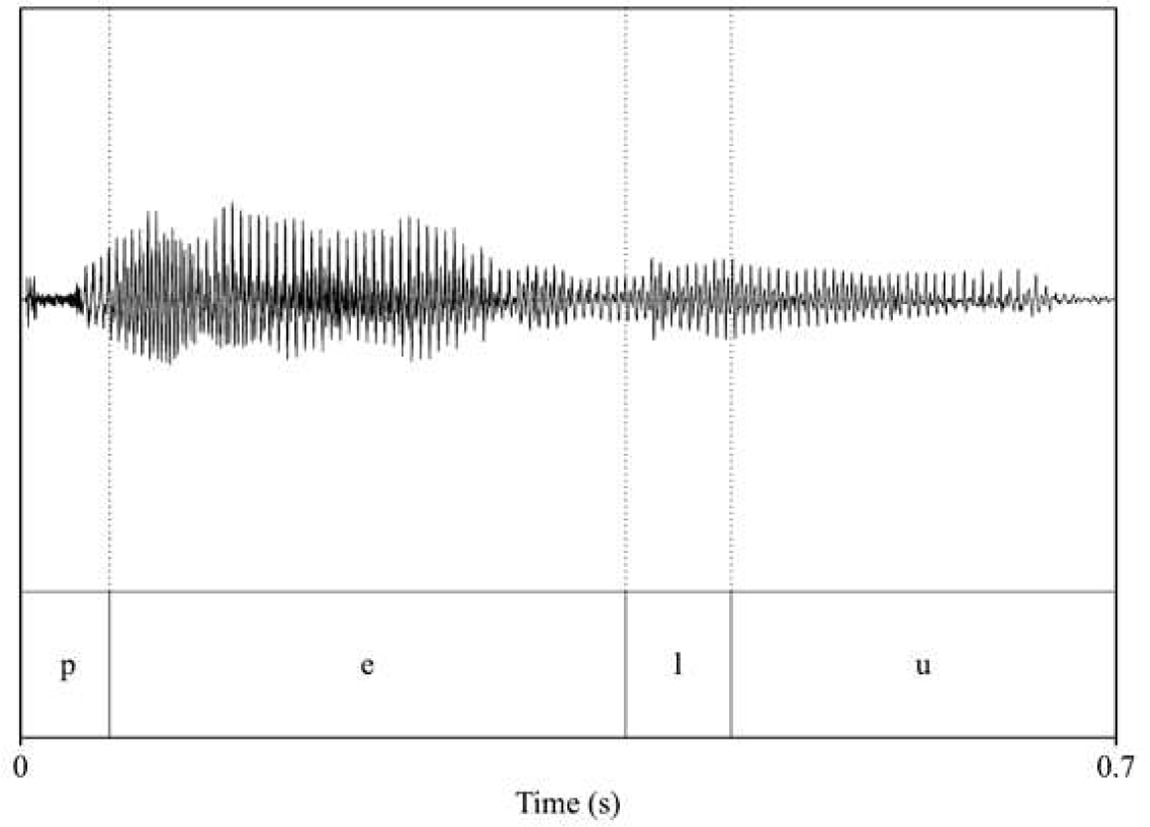 | pitch: 179.17 F1_pelu_/e/: 385.75 F2_pelu_/e/: 2480.84 F1_pelu_/u/: 376.49 F2_pelu_/u/: 837.6 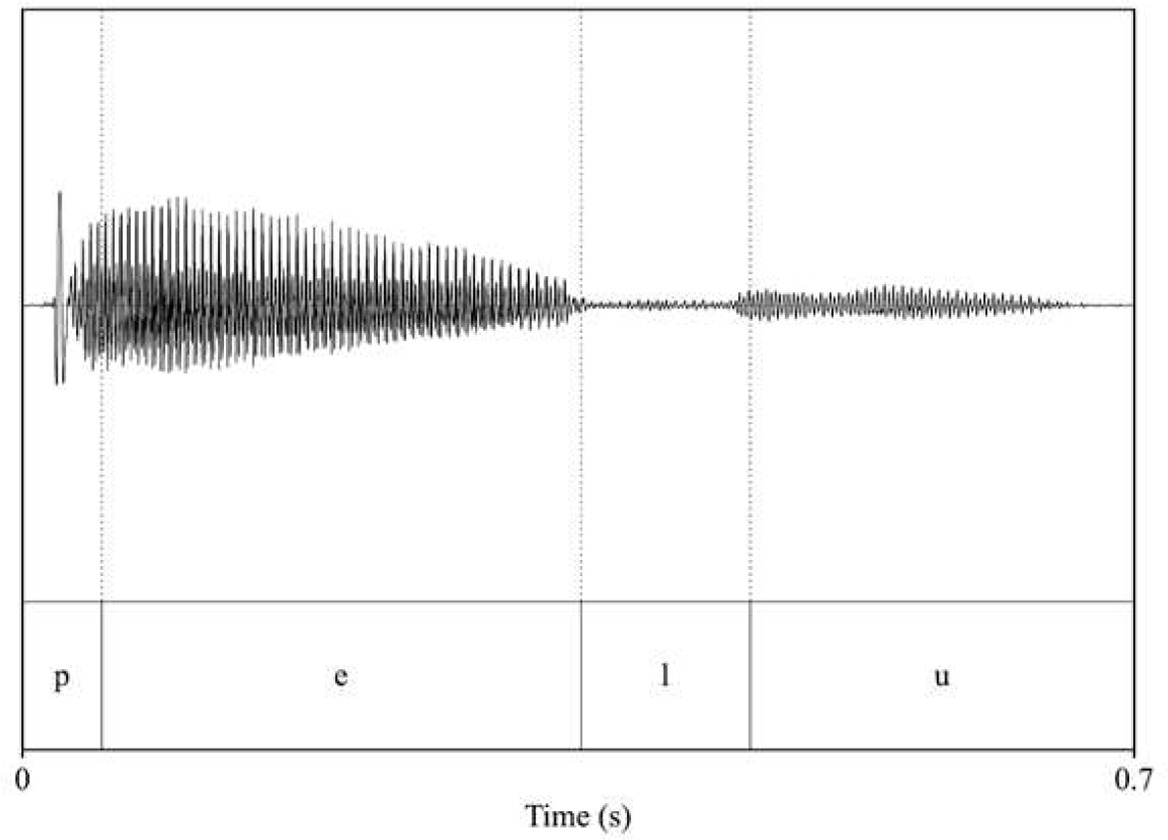 |
| voli | |
| voice_female_1 | voice_female_2 |
| pitch: 193.75 F1_voli_/o/: 457.55 F2_voli_/o/: 908.18 F1_voli_/i/: 372.43 F2_voli_/i/: 2521.58 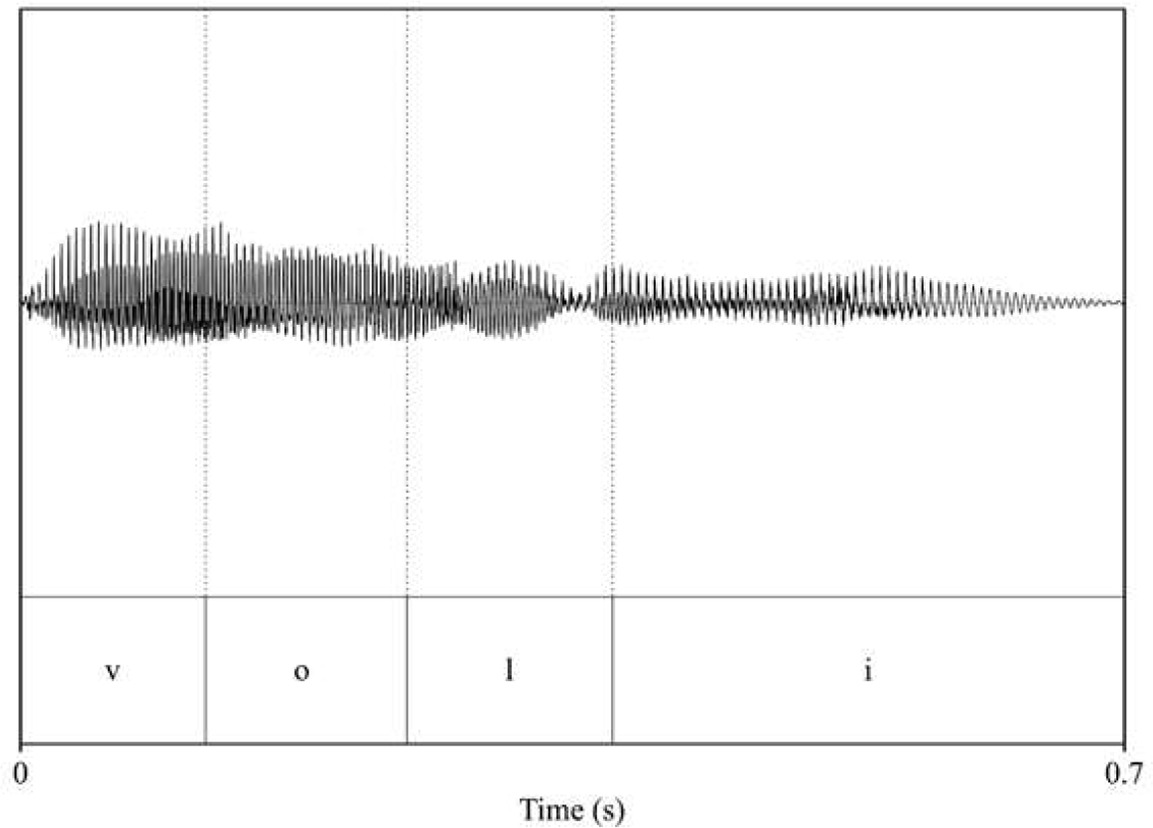 | pitch: 173.96 F1_voli_/o/: 433.28 F2_voli_/o/: 870.12 F1_voli_/i/: 349.75 F2_voli_/i/: 2691.6 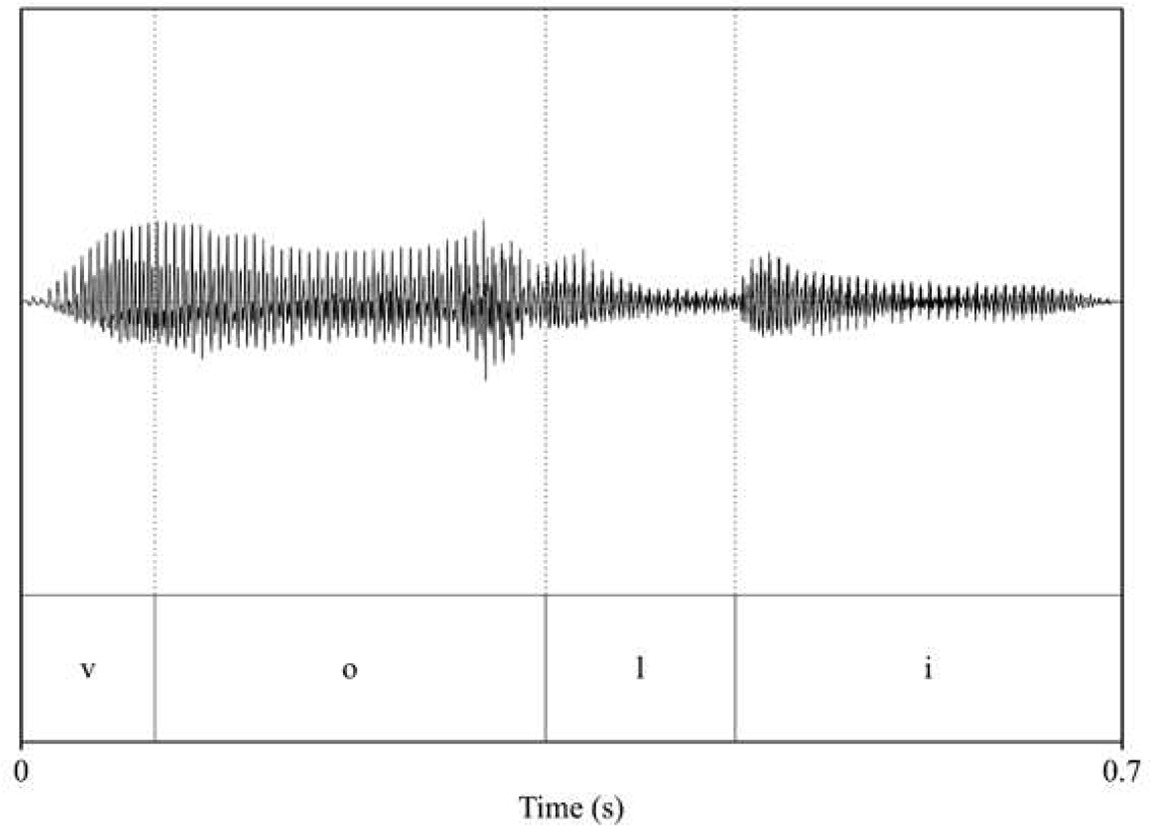 |
| dafo | |
| voice_male_1 | voice_male_2 |
| pitch: 84.89 F1_dafo_/a/: 807.9 F2_dafo_/a/: 1126.4 F1_dafo_/o/: 551.35 F2_dafo_/o/: 1339.42 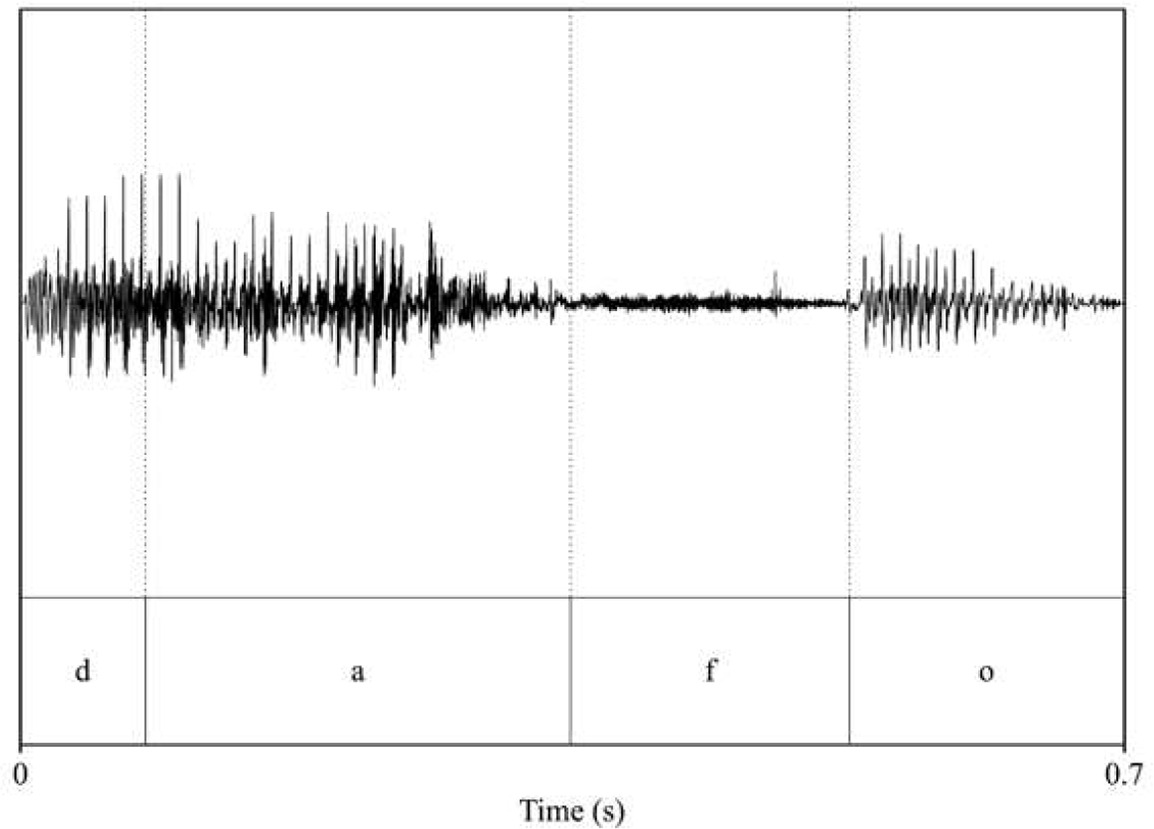 | pitch: 86.12 F1_dafo_/a/: 676.91 F2_dafo_/a/: 1268.19 F1_dafo_/o/: 502.94 F2_dafo_/o/: 774.73 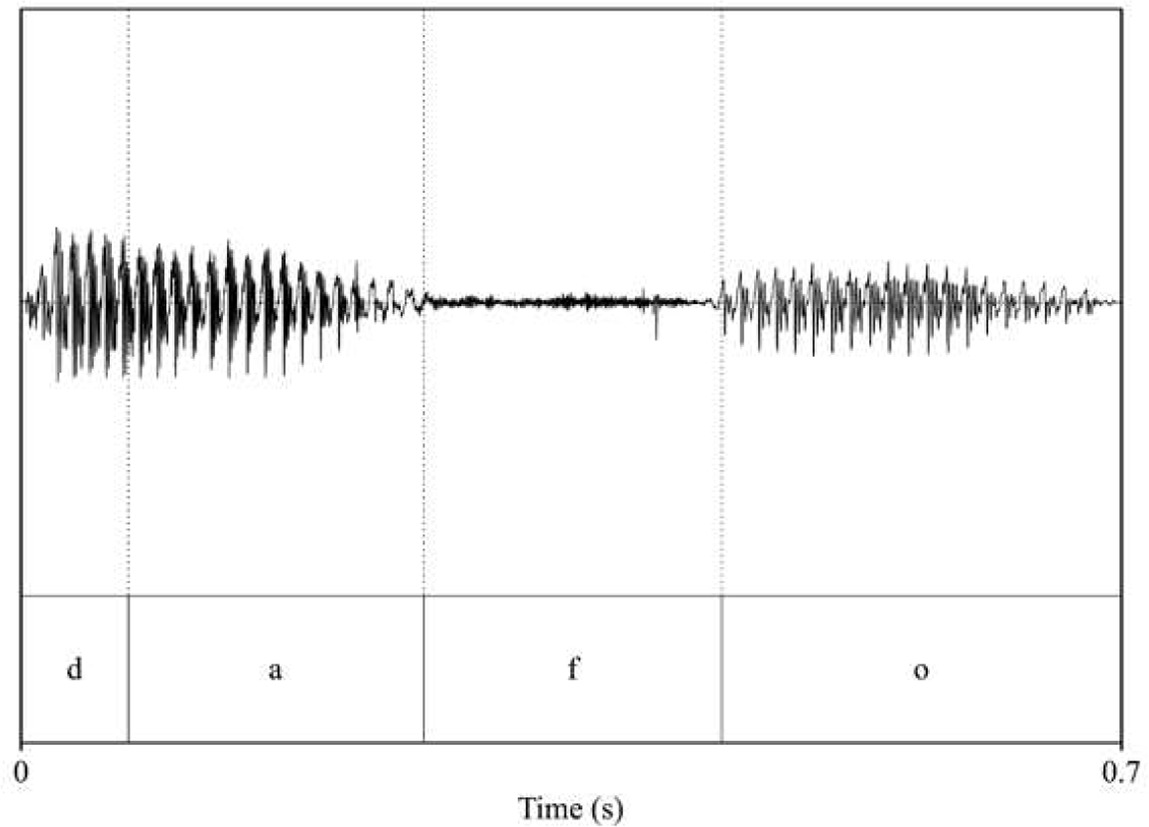 |
| noke | |
| voice_male_1 | voice_male_2 |
| pitch: 85.92 F1_noke_/o/: 604 F2_noke_/o/: 1017.2 F1_noke_/e/: 488.63 F2_noke_/e/: 1901.05 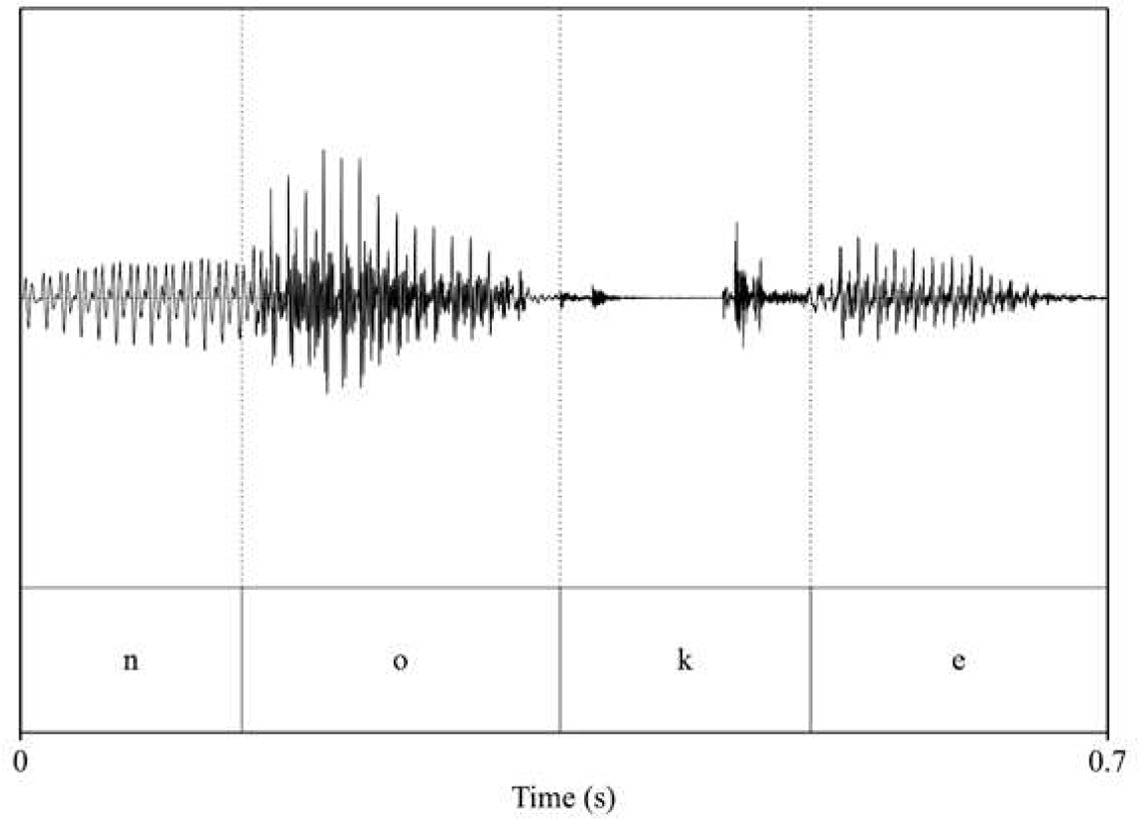 | pitch: 85.5 F1_noke_/o/: 593.86 F2_noke_/o/: 1018.64 F1_noke_/e/: 427.31 F2_noke_/e/: 1992.47 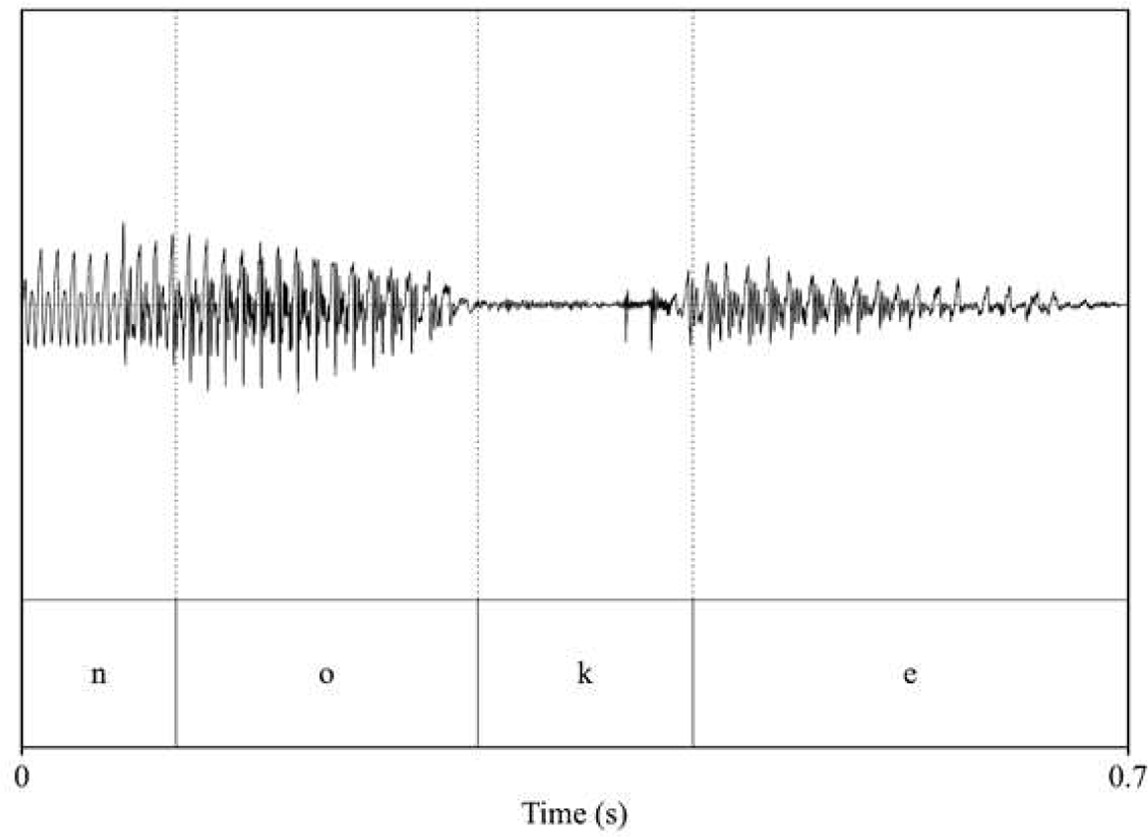 |
Appendix 1—table 2
Results for the analysis at the channel level, evaluating differences between conditions during the test phase.
LMM: act ~ –1 + block:channel + block:channel:condition + (1|sub). Only significant coefficients (p<0.05) for the contrast between conditions are shown.
| Estimate | Std. Error | df | t value | Pr(>|t|) | |
|---|---|---|---|---|---|
| block2:cha_S12_D12 | 0.409779 | 0.177042 | 7838.167 | 2.314586 | 0.020661 |
| block5:cha_S12_D12 | –0.55653 | 0.167365 | 7838.71 | –3.32523 | 0.000888 |
| block1:cha_S12_D13 | –0.50074 | 0.165594 | 7837.931 | –3.02393 | 0.002503 |
| block5:cha_S12_D13 | –0.36341 | 0.163359 | 7838.626 | –2.22462 | 0.026135 |
| block2:cha_S14_D12 | 0.500881 | 0.180004 | 7838.163 | 2.782615 | 0.005405 |
| block5:cha_S14_D12 | –0.43254 | 0.174754 | 7838.85 | –2.47513 | 0.01334 |
| block5:cha_S14_D13 | –0.32359 | 0.164814 | 7838.501 | –1.96335 | 0.049641 |
| block2:cha_S14_D14 | 0.470902 | 0.184399 | 7838.162 | 2.553705 | 0.010677 |
| block2:cha_S2_D1 | 0.431107 | 0.176339 | 7838.231 | 2.444757 | 0.014517 |
| block2:cha_S2_D2 | 0.354384 | 0.170551 | 7837.98 | 2.077884 | 0.037753 |
| block2:cha_S2_D3 | 0.382112 | 0.180017 | 7838.239 | 2.122645 | 0.033815 |
| block1:cha_S2_D4 | –0.34561 | 0.163692 | 7837.839 | –2.11136 | 0.034773 |
| block2:cha_S2_D4 | 0.50764 | 0.170551 | 7837.98 | 2.976476 | 0.002925 |
| block2:cha_S4_D4 | 0.460346 | 0.170551 | 7837.98 | 2.699176 | 0.006966 |
| block2:cha_S6_D4 | 0.536299 | 0.175077 | 7837.872 | 3.063223 | 0.002197 |
| block2:cha_S6_D5 | 0.590803 | 0.172379 | 7838.074 | 3.427358 | 0.000613 |
| block2:cha_S7_D5 | 0.420251 | 0.170551 | 7837.98 | 2.464085 | 0.013758 |
| block2:cha_S8_D6 | 0.404044 | 0.170551 | 7837.98 | 2.369059 | 0.017858 |
| block2:cha_S8_D7 | 0.360462 | 0.170551 | 7837.98 | 2.113519 | 0.034588 |
Additional files
Download links
A two-part list of links to download the article, or parts of the article, in various formats.
Downloads (link to download the article as PDF)
Open citations (links to open the citations from this article in various online reference manager services)
Cite this article (links to download the citations from this article in formats compatible with various reference manager tools)
Verbal Episodic Processing in Newborns
eLife 14:RP109096.
https://doi.org/10.7554/eLife.109096.3


