Translocation of interleukin-1β into a vesicle intermediate in autophagy-mediated secretion
- Howard Hughes Medical Institute, University of California, Berkeley, United States
- University of California, Berkeley, United States
Figures
Figure 1 with 1 supplement
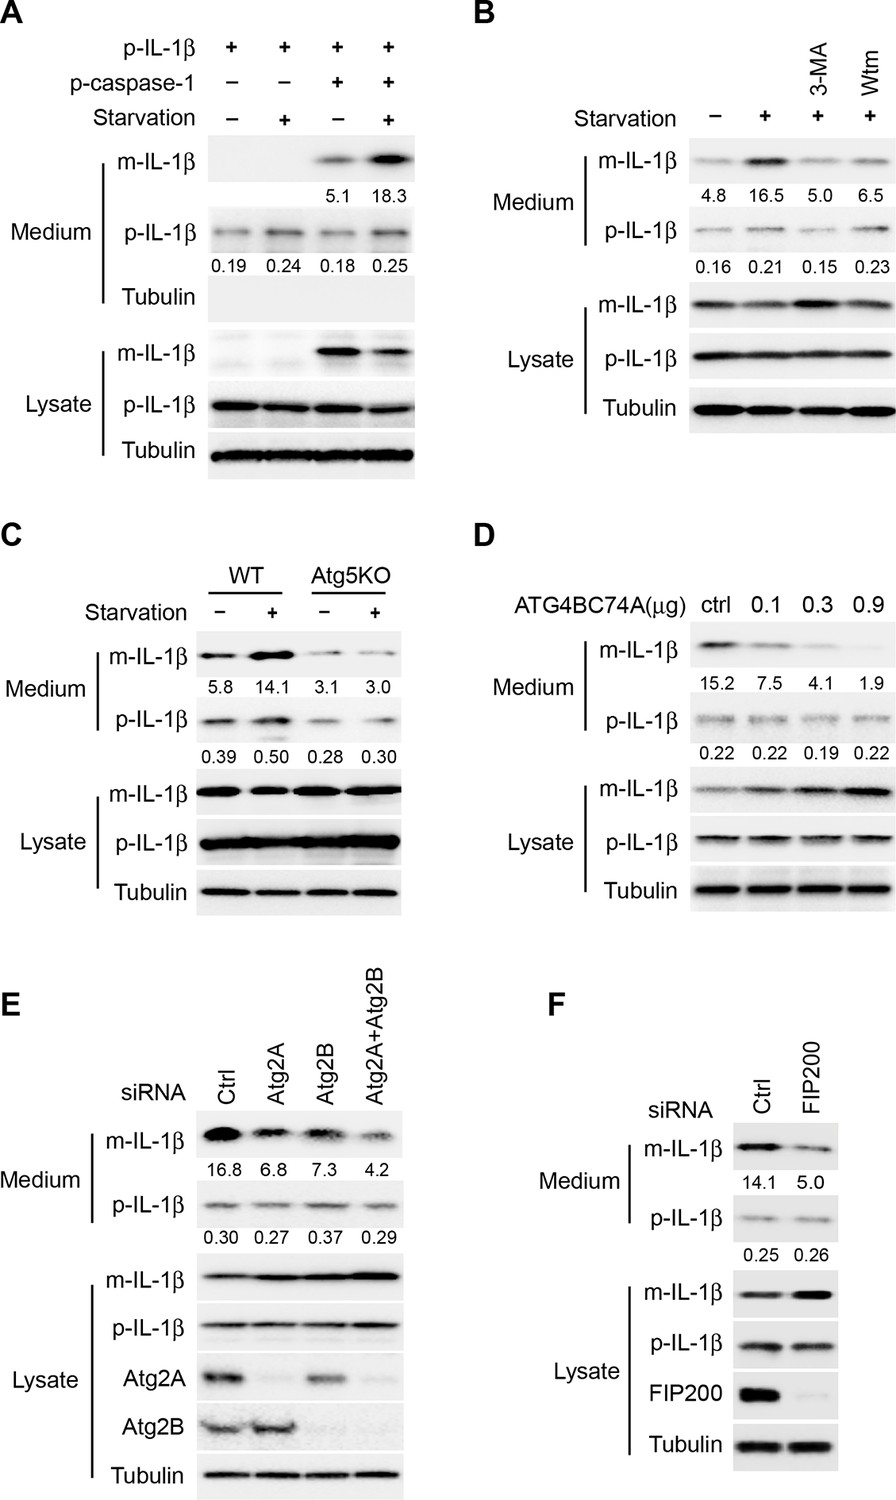
Reconstitution of autophagy-regulated IL-1β secretion in cultured cells.
(A) Reconstitution of starvation-induced IL-1β secretion in HEK293T cells. HEK293T cells were transfected with a single plasmid encoding p-IL-1β or together with the p-caspase-1 plasmid. After transfection (24 h), the cells were either treated in regular (DMEM) or starvation (EBSS) medium for 2 hr. The medium and cells were collected separately and immunoblot was performed to determine the level of indicated proteins. (B) PI3K inhibitors 3-methyladenine (3-MA) or wortmannin (Wtm) inhibit IL-1β secretion. HEK293T cells transfected with p-IL-1β and p-caspase-1 plasmids were cultured in DMEM, EBSS, or EBSS containing 10 mM 3-MA or 20 nM wortmannin for 2 hr. The medium and cells were collected separately and immunoblot was performed as shown in (A). (C) IL-1β secretion is blocked in Atg5 KO MEFs. Control WT or Atg5 KO MEFs were transfected with p-IL-1β and p-caspase-1 plasmids. After transfection (24 hr), the cells were either cultured in DMEM or EBSS for 2 hr followed by immunoblot as shown in (A). (D) IL-1β secretion is inhibited by the ATG4B mutant (C74A). HEK293T cells were transfected with plasmids encoding p-IL-1β, p-caspase-1 and different amounts of ATG4B (C74A) plasmid DNA as indicated. After transfection (24 hr), cells were starved in EBSS for 2 hr followed by immunoblot as shown in (A). (E) Knockdown of Atg2 reduces IL-1β secretion. HEK293T cells were transfected with control siRNA or siRNAs against Atg2A, Atg2B alone or both. After transfection (48 hr), the cells were transfected with p-IL-1β and p-caspase-1 plasmids. After another 24 hr, the cells were starved in EBSS for 2 h followed by immunoblot as shown in (A). (F) Knockdown of FIP200 reduces IL-1β secretion. HEK293T cells were transfected with control siRNA or FIP200 siRNA. IL-1β secretion under starvation conditions was determined as shown in (E). Quantification of IL-1β secretion was calculated as the ratio between the amount of IL-1β in the medium and the total amount (the sum of IL-1β in both medium and lysate).
Figure 1—figure supplement 1
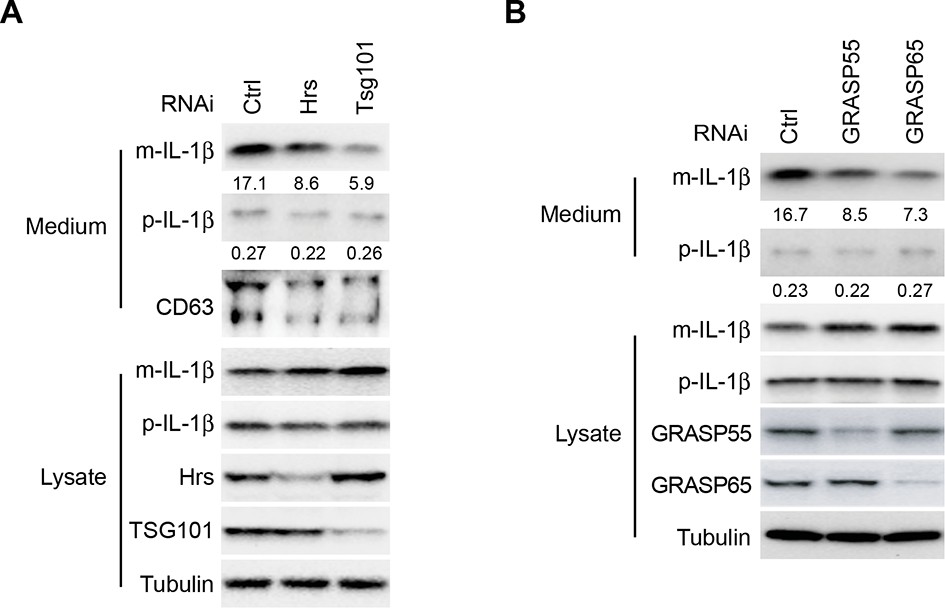
Depletion of ESCRT or GRASPs affects IL-1β secretion.
HEK293T cells were transfected with indicated siRNAs (Hrs (ESCRT-0) (A), Tsg101 (ESCRT-I) (A), GRASP55 (B) or GRASP65 (B)). After transfection (48 hr), the cells were transfected with p-IL-1β and p-caspase-1 plasmids. After another 24 hr, the cells were starved in EBSS for 2 hr followed by immunoblot as shown in Figure 1A. Quantification of IL-1β secretion was calculated as the ratio between the amount of IL-1β in the medium and the total amount (the sum of IL-1β in both medium and lysate).
Figure 2
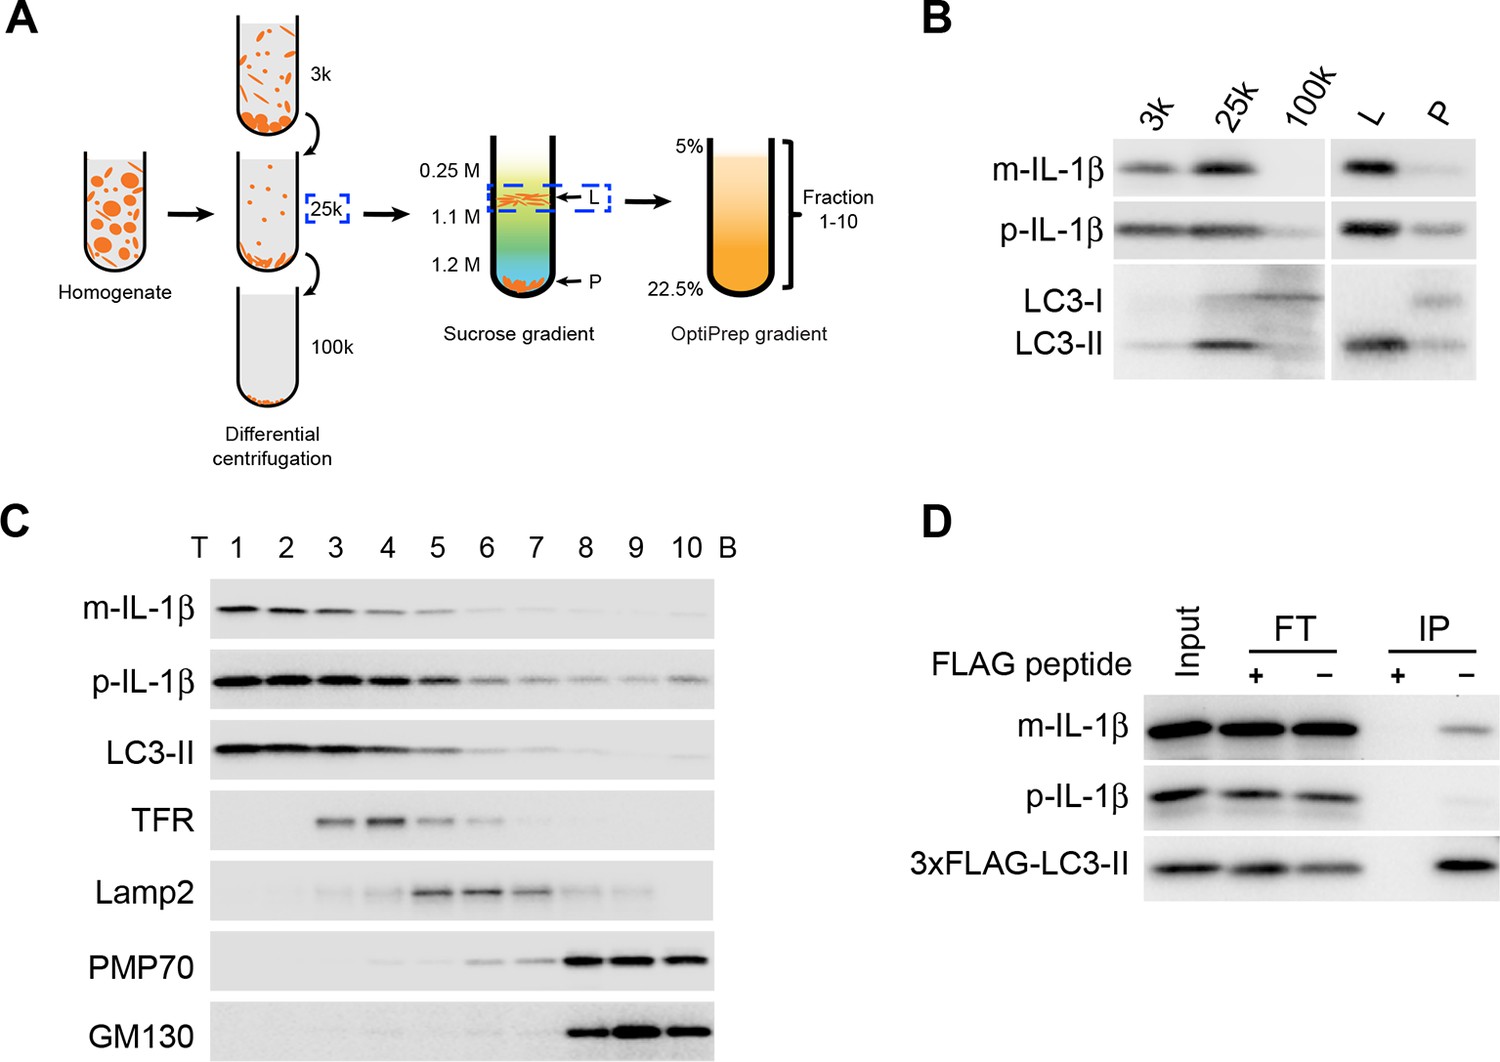
IL-1β vesicles co-fractionate with LC3 vesicles.
(A) Membrane fractionation scheme. Briefly, HEK293T cells transfected with p-IL-1β and p-caspase-1 plasmids were starved in EBSS for 2 hr, collected and homogenized. Cell lysates were subjected to differential centrifugations at 3000×g (3k), 25,000×g (25k) and 100,000×g (100k). The level of IL-1β in each membrane fraction was determined by immunoblot. The 25k pellet, in which IL-1β was mainly enriched, was selected and a sucrose gradient ultracentrifugation was performed to separate membranes in the 25k pellet to the L (light) and P (pellet) fractions. The L fraction, which contained the majority of IL-1β, was further resolved on an OptiPrep gradient after which ten fractions from the top were collected. (B,C) Immunoblot was performed to examine the distribution of IL-1β, LC3 as well as the indicated membrane markers in the indicated membrane fractions. T, top; B, bottom (D) HEK293T cells transfected with p-IL-1β, p-caspase-1 and FLAG-tagged LC3-I plasmids were starved in EBSS for 2 hr. LC3 positive membranes were immunoisolated with anti-FLAG agarose from the 25 k pellet and the presence of IL-1β was determined by immunoblot analysis. FT, flowthrough
Figure 3
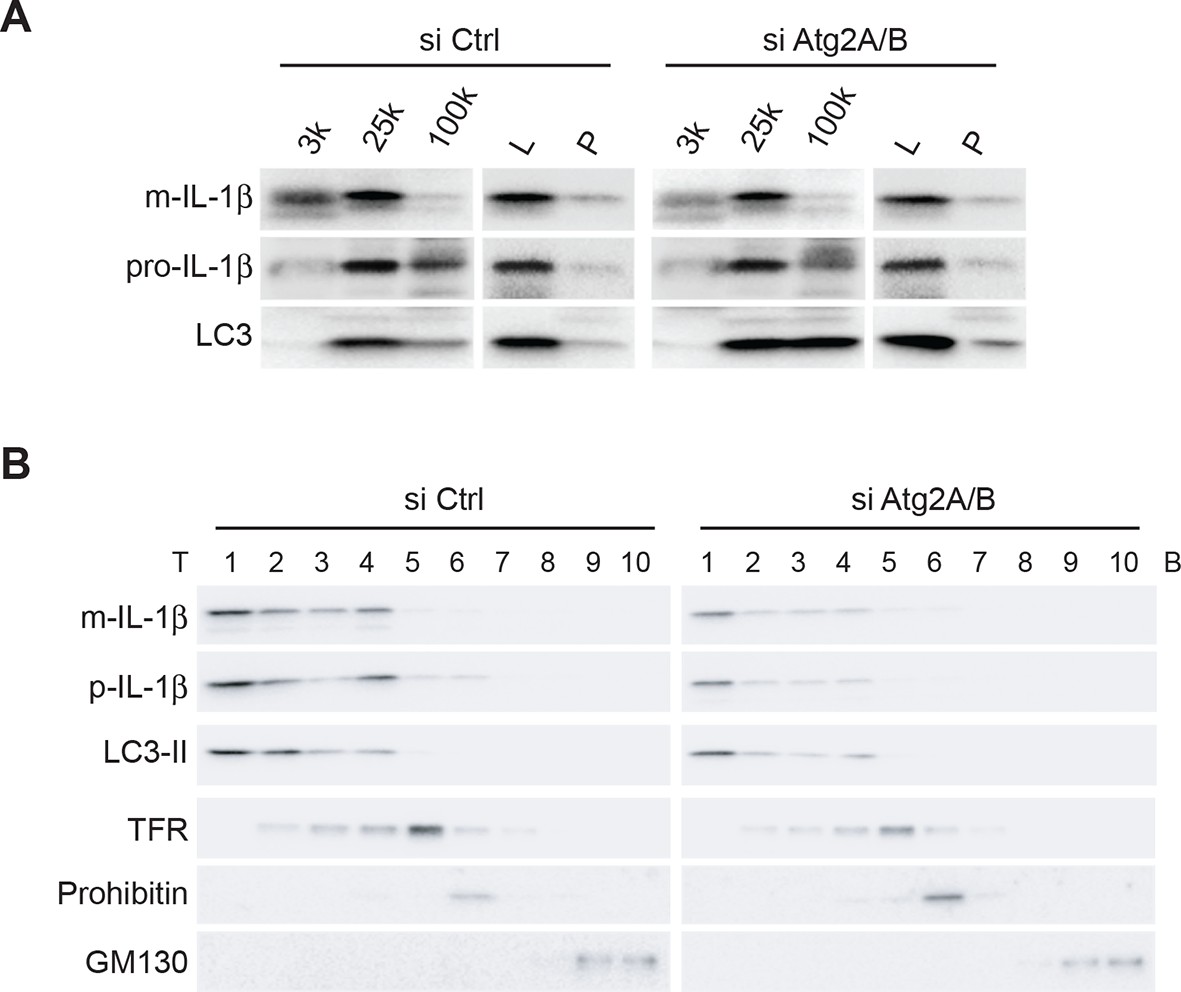
IL-1β co-distributes with LC3 in Atg2-depleted cells.
(A) HEK293T cells were transfected with siRNAs against Atg2A and Atg2B followed with p-IL-1β and p-caspase-1 plasmids as shown in Figure 1E. The cells were starved in EBSS for 2 hr. Membrane fractions (3k, 25k, 100k (×g), L and P) were separated from the post-nuclear supernatant as depicted in Figure 2B. (B) Ten membrane fractions were collected from the OptiPrep gradient ultracentrifugation as depicted in Figure 2C. Immunoblot was performed to examine the distribution of IL-1β, LC3 as well as the indicated membrane markers. T, top; B, bottom.
Figure 4
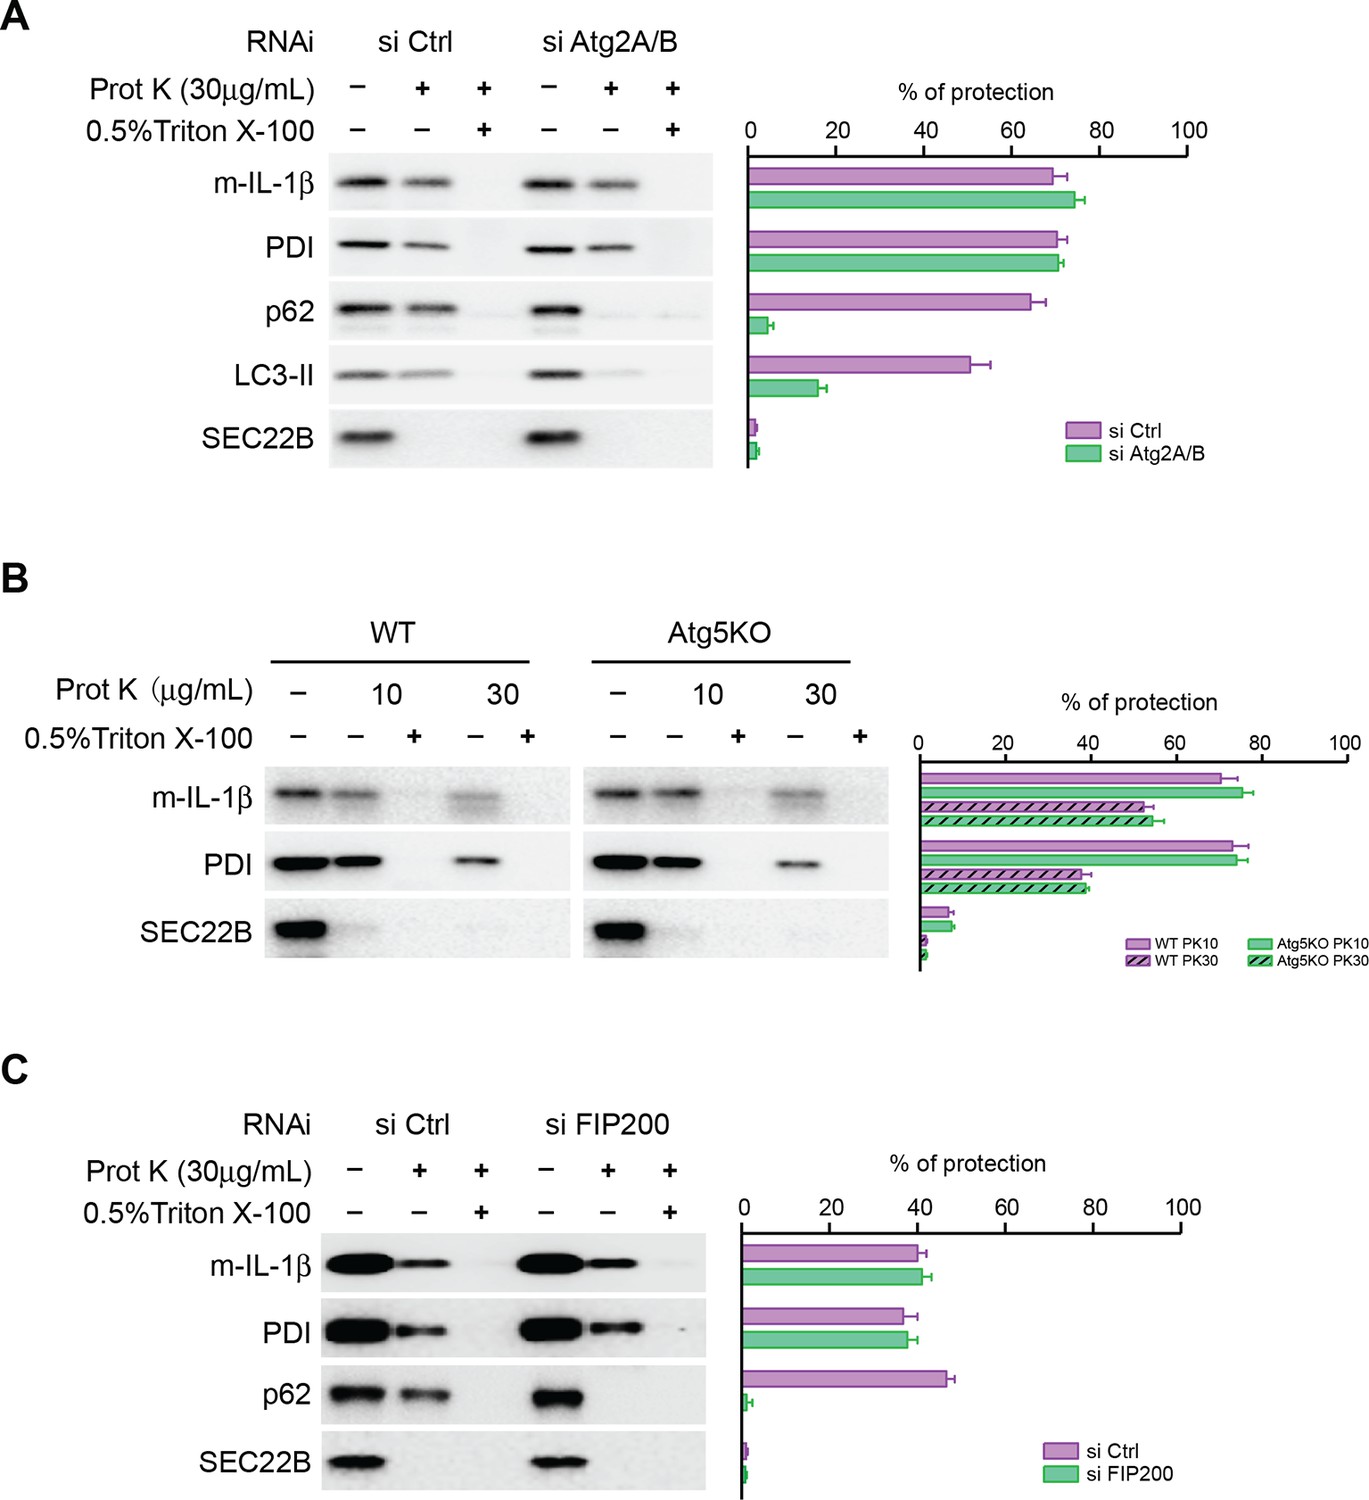
Closure of the autophagosome is not required for the entry of IL-1β into vesicles.
(A) HEK293T cells were transfected with siRNAs against Atg2A and Atg2B followed by transfection with p-IL-1β and p-caspase-1 plasmids as shown in Figure 1E. The cells were starved in EBSS for 2 hr and proteinase K digestion was performed with the 25k membrane fractions. (B) Atg5 WT, KO MEFs were transfected with p-IL-1β and p-caspase-1 plasmids as shown in Figure 1B. The cells were starved in EBSS for 2 hr followed by proteinase K digestion as shown in (A). (C) HEK293T cells were transfected with siRNA against FIP200 followed by analysis of membrane entry of IL-1β as shown in (A). The level of proteinase K protection was calculated as the percentage of the total protein. Error bars represent standard deviations of at least three experiments.
Figure 5 with 1 supplement
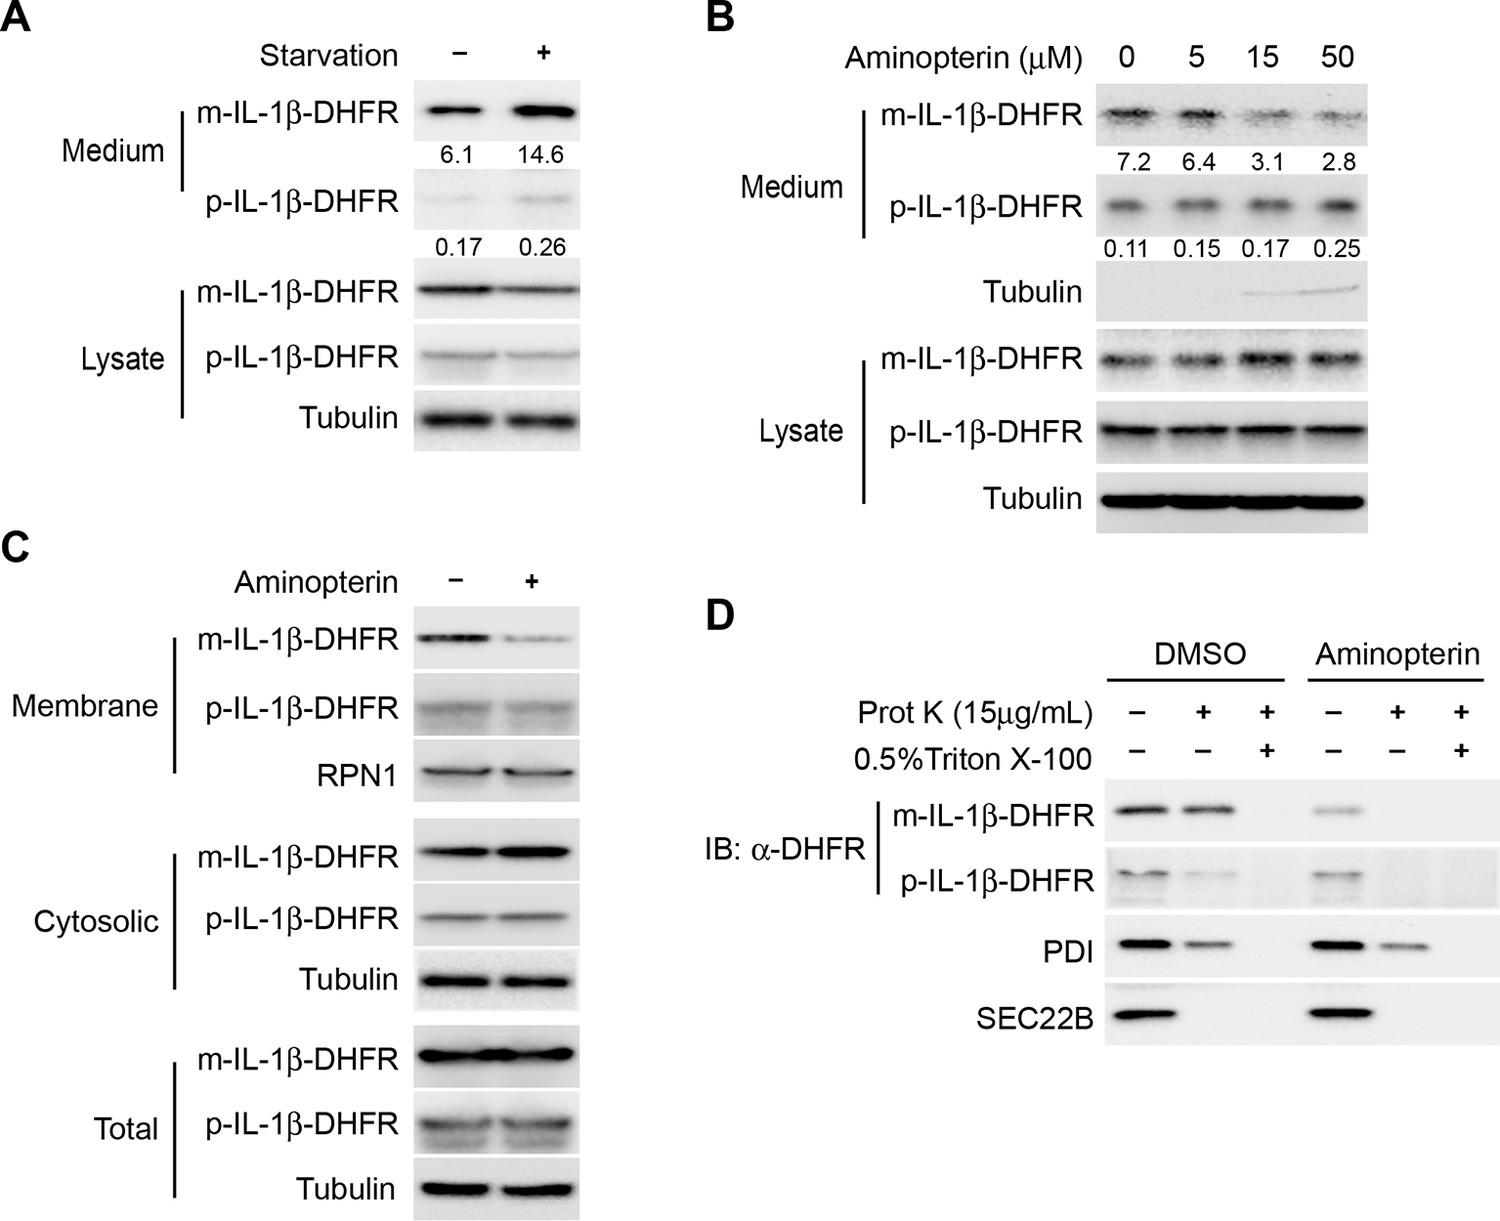
Protein unfolding is required for the entry of IL-1β into vesicles.
(A) Secretion of DHFR-tagged IL-1β. HEK293T cells were transfected with p-IL-1β-DHFR and p-caspase-1 plasmids. After transfection (24 hr), the cells were treated with DMEM or EBSS for 2 hr. Release of IL-1β was determined as shown in Figure 1. (B) Secretion of IL-1β-DHFR was inhibited by aminopterin. HEK293T cells were transfected with p-IL-1β-DHFR and p-caspase-1 plasmids. After transfection (24 hr), the cells were treated with EBSS, or EBSS containing different concentrations of aminopterin as indicated for 15 min followed by determination of IL-1β secretion as shown in (A). Quantification of IL-1β secretion was calculated as the ratio between the amount of IL-1β in the medium and the total amount (the sum of IL-1β in both medium and lysate). (C) Less IL-1β enters into membrane in the presence of aminopterin. HEK293T cells were transfected with p-IL-1β-DHFR and p-caspase-1 plasmids. After transfection (24 hr), the cells were either untreated or treated with 5 μM aminopterin in EBSS for 2 hr. The membrane fraction was collected from the top fractions of a Nycodenz density gradient resolved from membranes in a 25k pellet as described in Material and Methods. The cytosolic fraction was collected as the supernatant after 100k×g centrifugation. All fractions were analyzed by immunoblotting using indicated antibodies. (D) IL-1β-DHFR is not protected from proteinase K in the presence of aminopterin. Nycodenz -floated membrane fraction collected as shown in (C) was subjected to proteinase K digestion and then analyzed by immunoblotting using indicated antibodies.
Figure 5—figure supplement 1
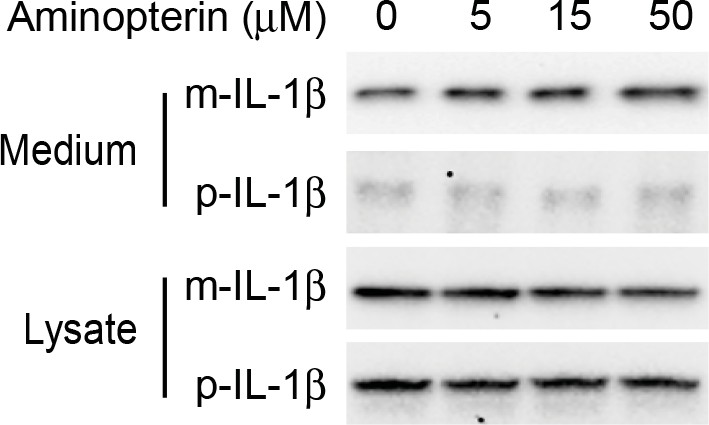
Secretion of IL-1β is not affected by aminopterin.
HEK293T cells were transfected with p-IL-1β and p-caspase-1 plasmids. After transfection (24 hr), the cells were treated with EBSS, or EBSS containing different concentrations of aminopterin as indicated for 15 min followed by determination of IL-1β secretion as shown in Figure 1 (A).
Figure 6 with 5 supplements
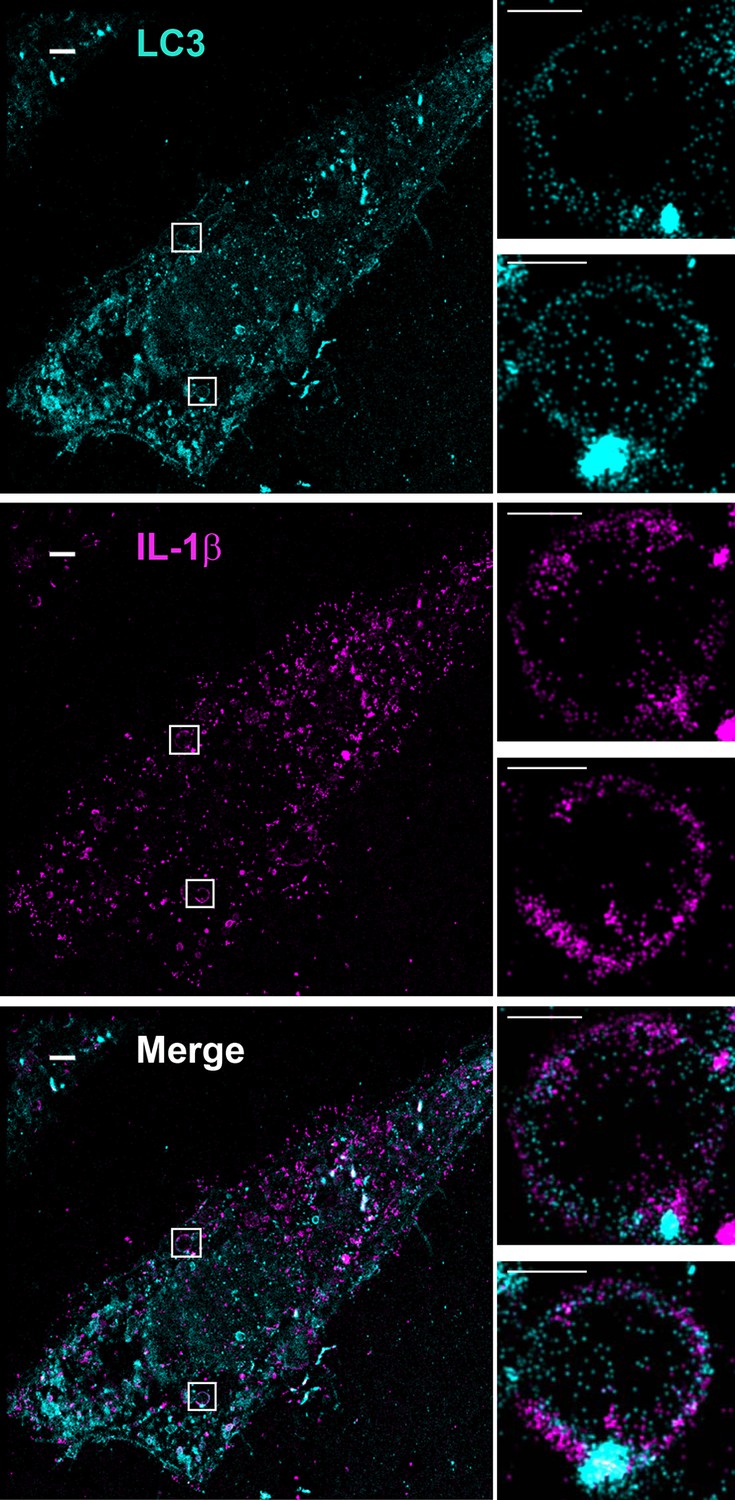
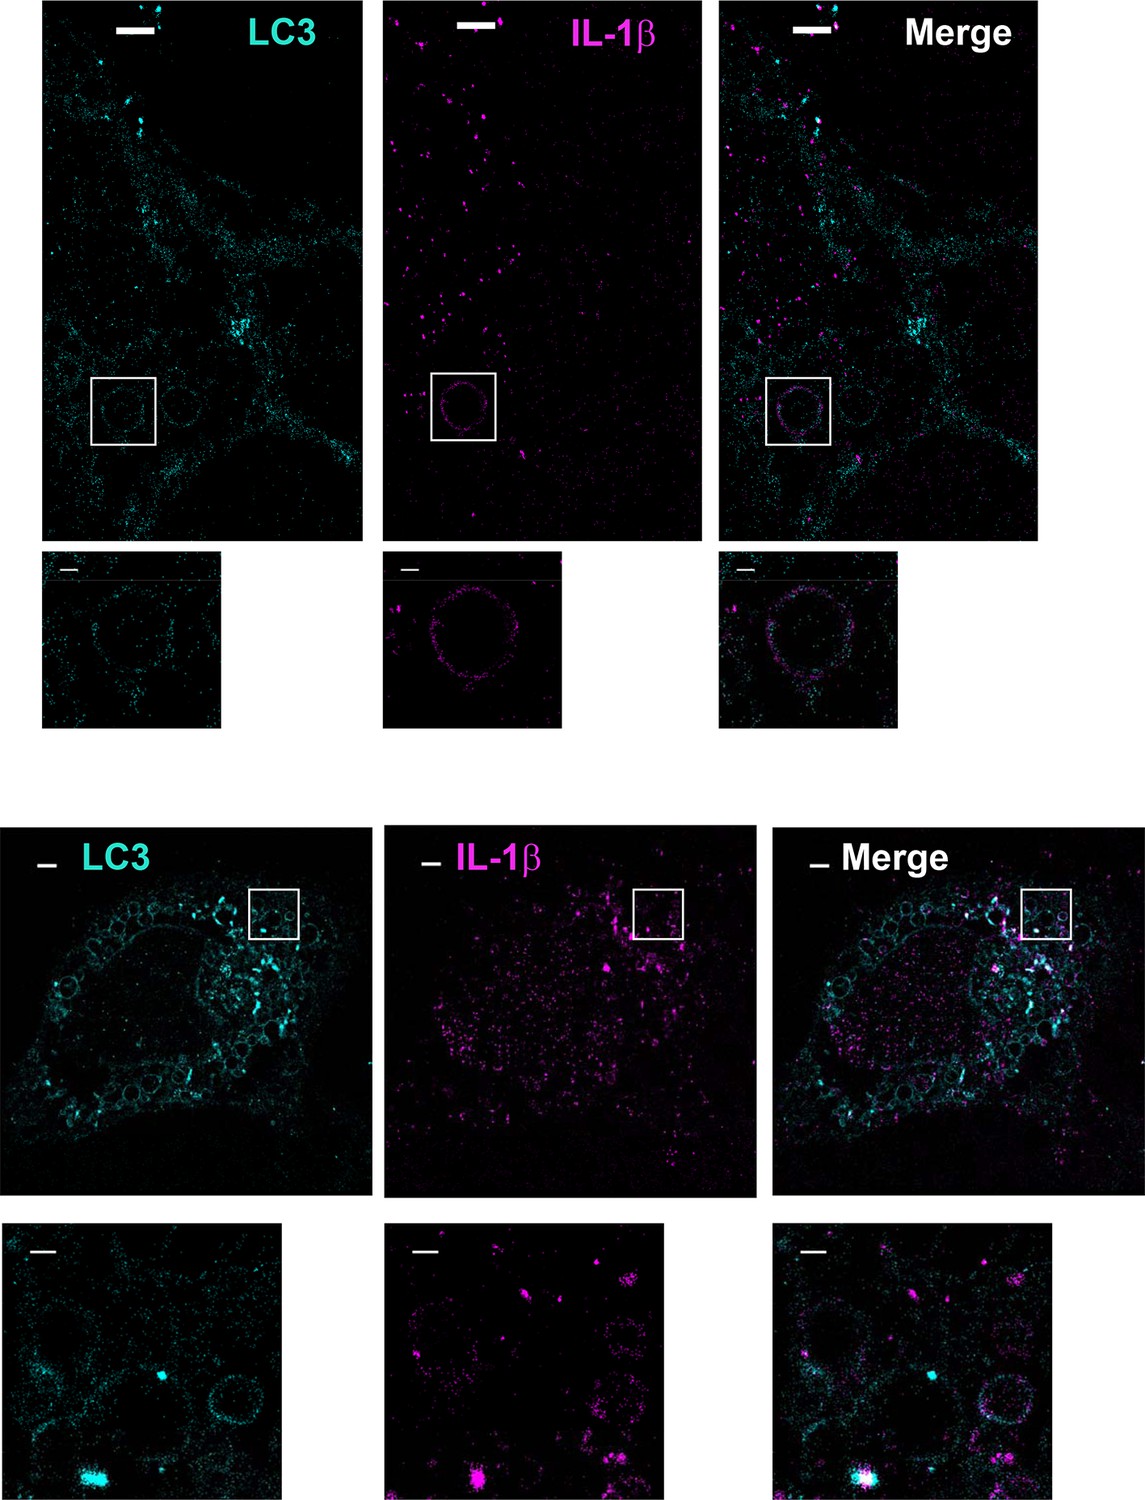
Topological localization of IL-1β in the autophagosomal carrier determined by STORM.
U2OS cells were transfected with a plasmid containing the expression cassette of FLAG-tagged mature IL-1β (m-IL-1β-FLAG). After transfection (24 hr), the cells were starved in EBSS for 1 hr followed by immunofluorescence labeling with mouse monoclonal anti-LC3 and rabbit polyclonal anti-FLAG antibodies. STORM analysis imaging and data analysis were performed as described in Materials and methods. Cyan, LC3; Magenta, IL-1β; Bars: 2 μm (original image) and 500 nm (magnified inset)
Figure 6—figure supplement 1
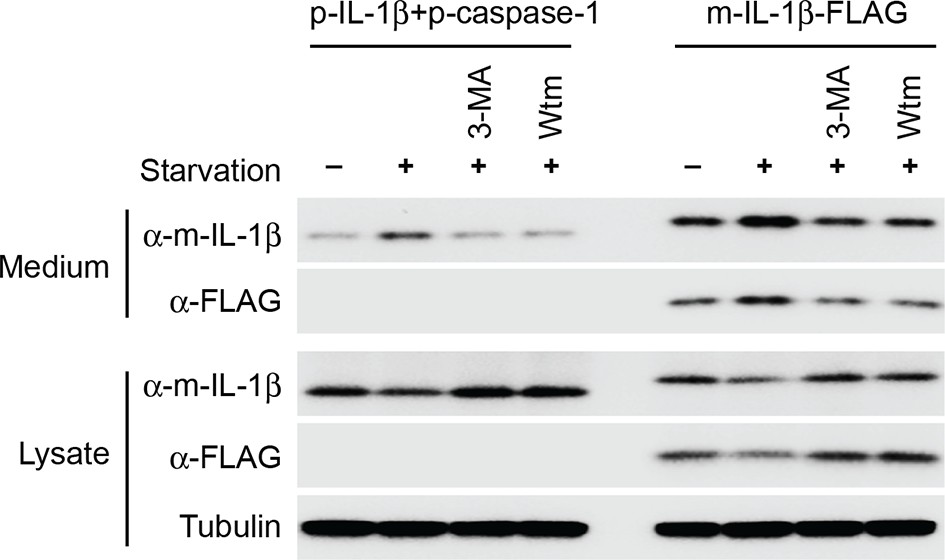
Secretion of IL-1β in U2OS cells.
U2OS cells were transfected with plasmids encoding the p-IL-1β and p-caspase-1 (first 4 lanes) or m-IL-1β-FLAG (last 4 lanes). After transfection (24 hr), the cells were untreated or starved in the absence or presence of indicated PI3K inhibitors (3-MA or wortmannin [Wtm]) followed by measurement of secretion as indicated in Figure 1 (A) and (B). α-m-IL-1β, IL-1b antibody; α-FLAG, FLAG antibody.
Figure 6—figure supplement 2
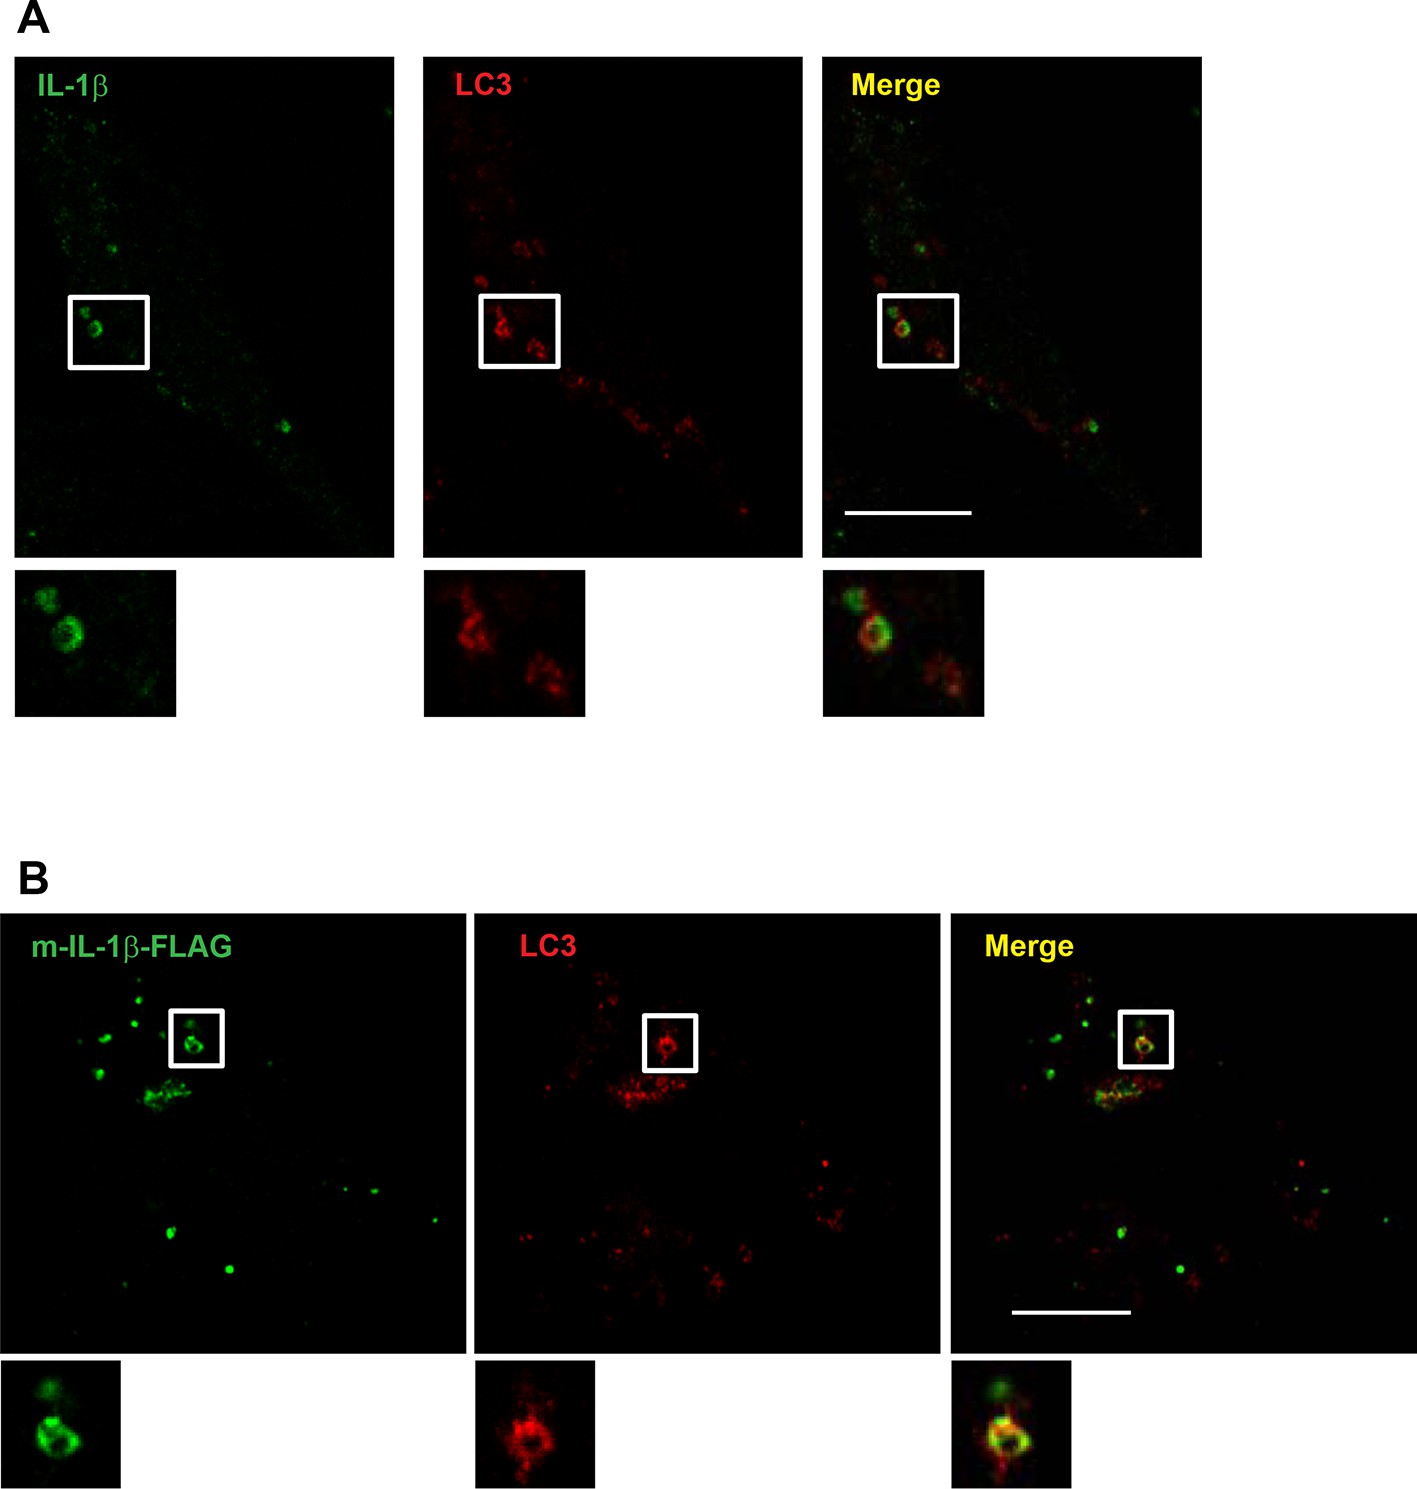
Localization of IL-1β determined by confocal microscopy.
U2OS cells were transfected with plasmids encoding the p-IL-1β and p-caspase-1 (A) or m-IL-1β-FLAG (B). After transfection (24 hr), the cells were starved for 1 hr followed by immunofluorescence labeling and confocal microscopy analysis. Bar: 10 μm
Figure 6—figure supplement 3
Extra images for Figure 6.
Bars: 2 μm (original image) and 500 nm (magnified inset).
Figure 6—figure supplement 4
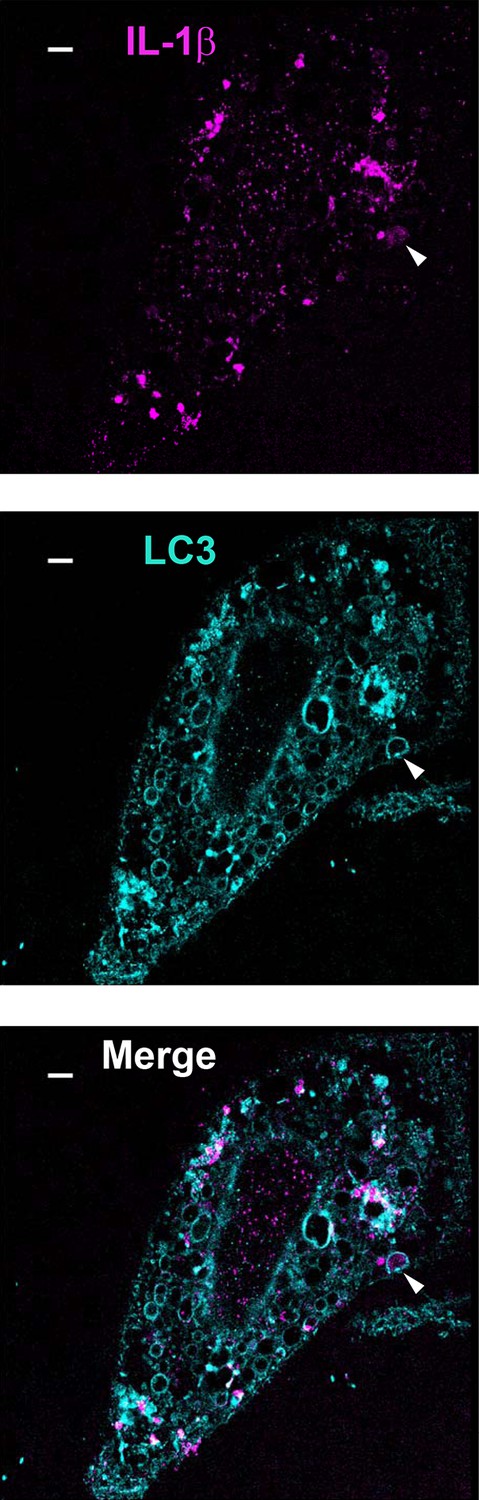
A minority of IL-1β engulfed by autophagosome.
U2OS cells were transfected and treated followed by STORM analysis as shown in Figure 6. Arrow head points to the autophagosome with engulfed IL-1β. Bar: 2 μm
Figure 6—figure supplement 5
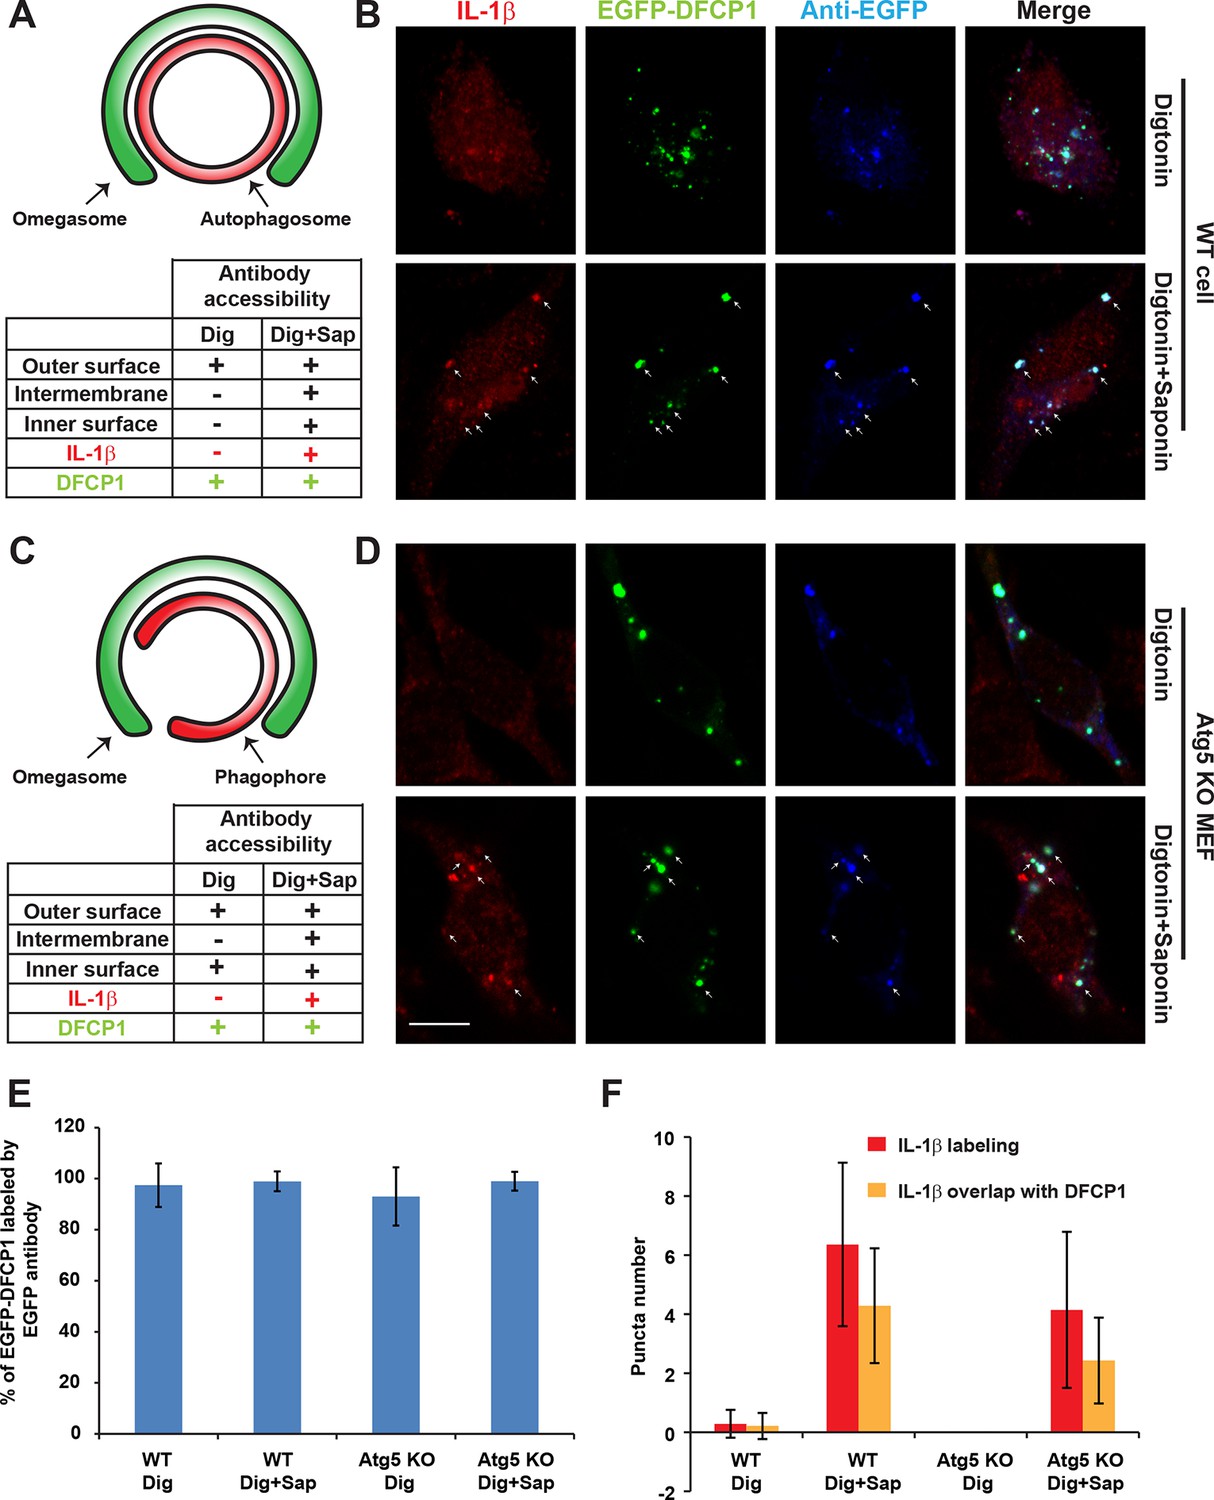
Determination of the topological localization of IL-1β in the autophagosome and phagophore.
(A,C) Diagrams of autophagosome (A)/phagophore (B) and omegasome, antibody accessibility for each possible situation of IL-1β localization, and summaries of the antibody accessibility of m-IL-1β-FLAG (red) and EGFP-DFCP1 (green) are illustrated. (B,D) U2OS cells (B) and Atg5 KO MEFs (D) were transfected with plasmids encoding the m-IL-1β-FLAG and EGFP-DFCP1. After transfection (24 hr), the cells were starved in EBSS for 1 hr followed by digitonin treatment and fixation (see Materials and methods). The cells were either labeled with anti-FLAG (to label IL-1β) and anti-EGFP (to label EGFP-DFCP1) antibodies (Digitonin) or further treated with Saponin followed by antibody labeling (Digitonin + Saponin). Images were acquired by confocal microscopy. Bar: 10 μm (E) Quantification of the percentage of EGFP-DFCP1 labeled by EGFP antibody. Percentage was counted by the ratio of puncta numbers of antibody labeled EGFP-DFCP1 and EGFP-DFCP1 according to the EGFP signal. Error bars are standard deviations of more than 50 cells in two independent experiments. (F) Quantification of the puncta number for m-IL-1β-FLAG puncta (red) and those colocalized with DFCP1 (yellow). Error bars are standard deviations of more than 50 cells in two independent experiments.
Figure 7
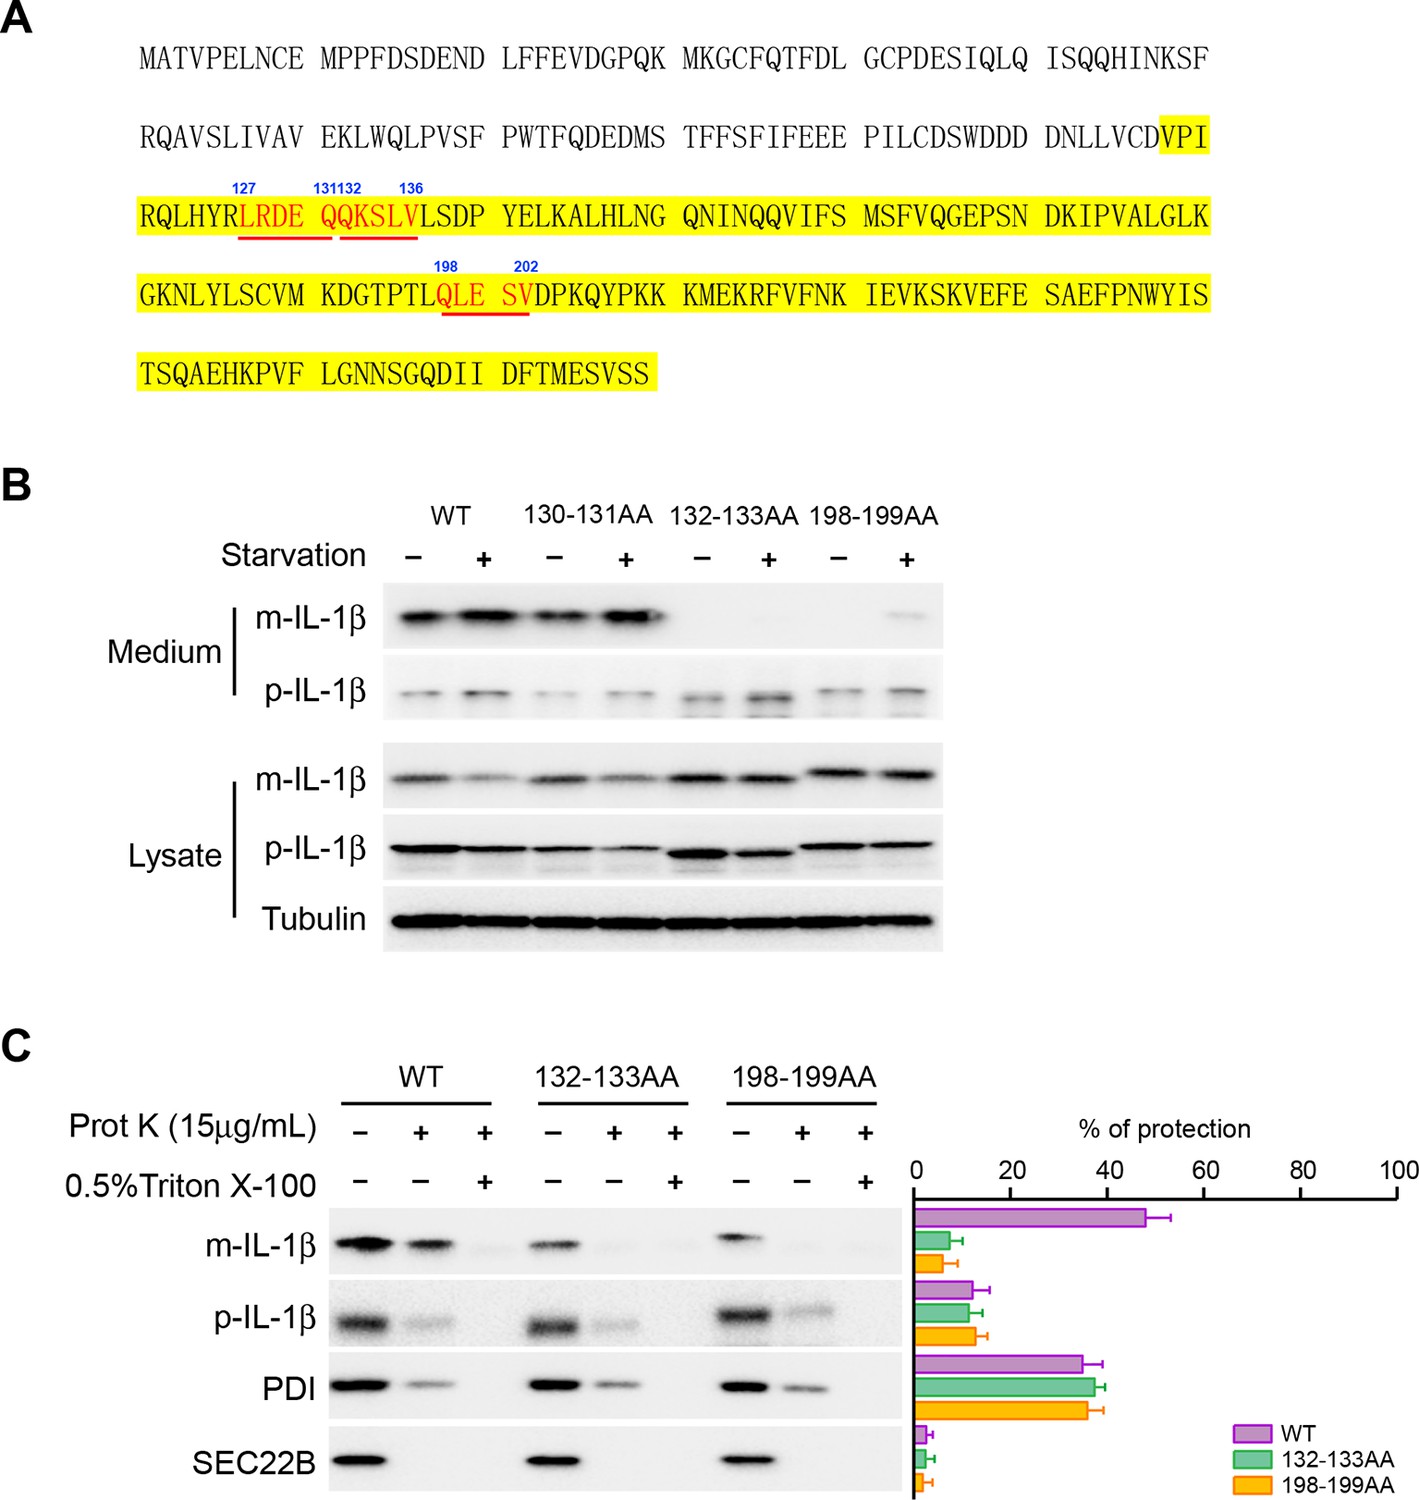
Mutation of the KFERQ-like motif affects IL-1β secretion and entry into vesicles.
(A) Protein sequence of IL-1β. The yellow region indicates mature IL-1β. Three KFERQ-like motifs (aa127-131, aa132-136 and aa198-202) are highlighted in red underlined bold. (B) Secretion of IL-1β mutants. HEK293T cells were transfected with p-IL-1β-DHFR and p-caspase-1 plasmids. After transfection (24 hr), the cells were either treated with DMEM or EBSS for 2 hr. Secretion of IL-1β mutant proteins was detected by immunoblot. (C) IL-1β mutant 132-133AA or 198-199AA is accessible to proteinase K digestion. HEK293T cells were transfected with plasmids encoding p-caspase-1 and IL-1β mutant 132-133AA or 198-199AA. After transfection (24 hr), the cells were treated with EBSS for 2 hr. The 25k membrane fraction was collected and subjected to proteinase K digestion assay and then analyzed by immunoblot using indicated antibodies. The level of proteinase K protection was calculated as the percentage of the total protein. Error bars represent standard deviations of at least three experiments.
Figure 8 with 1 supplement
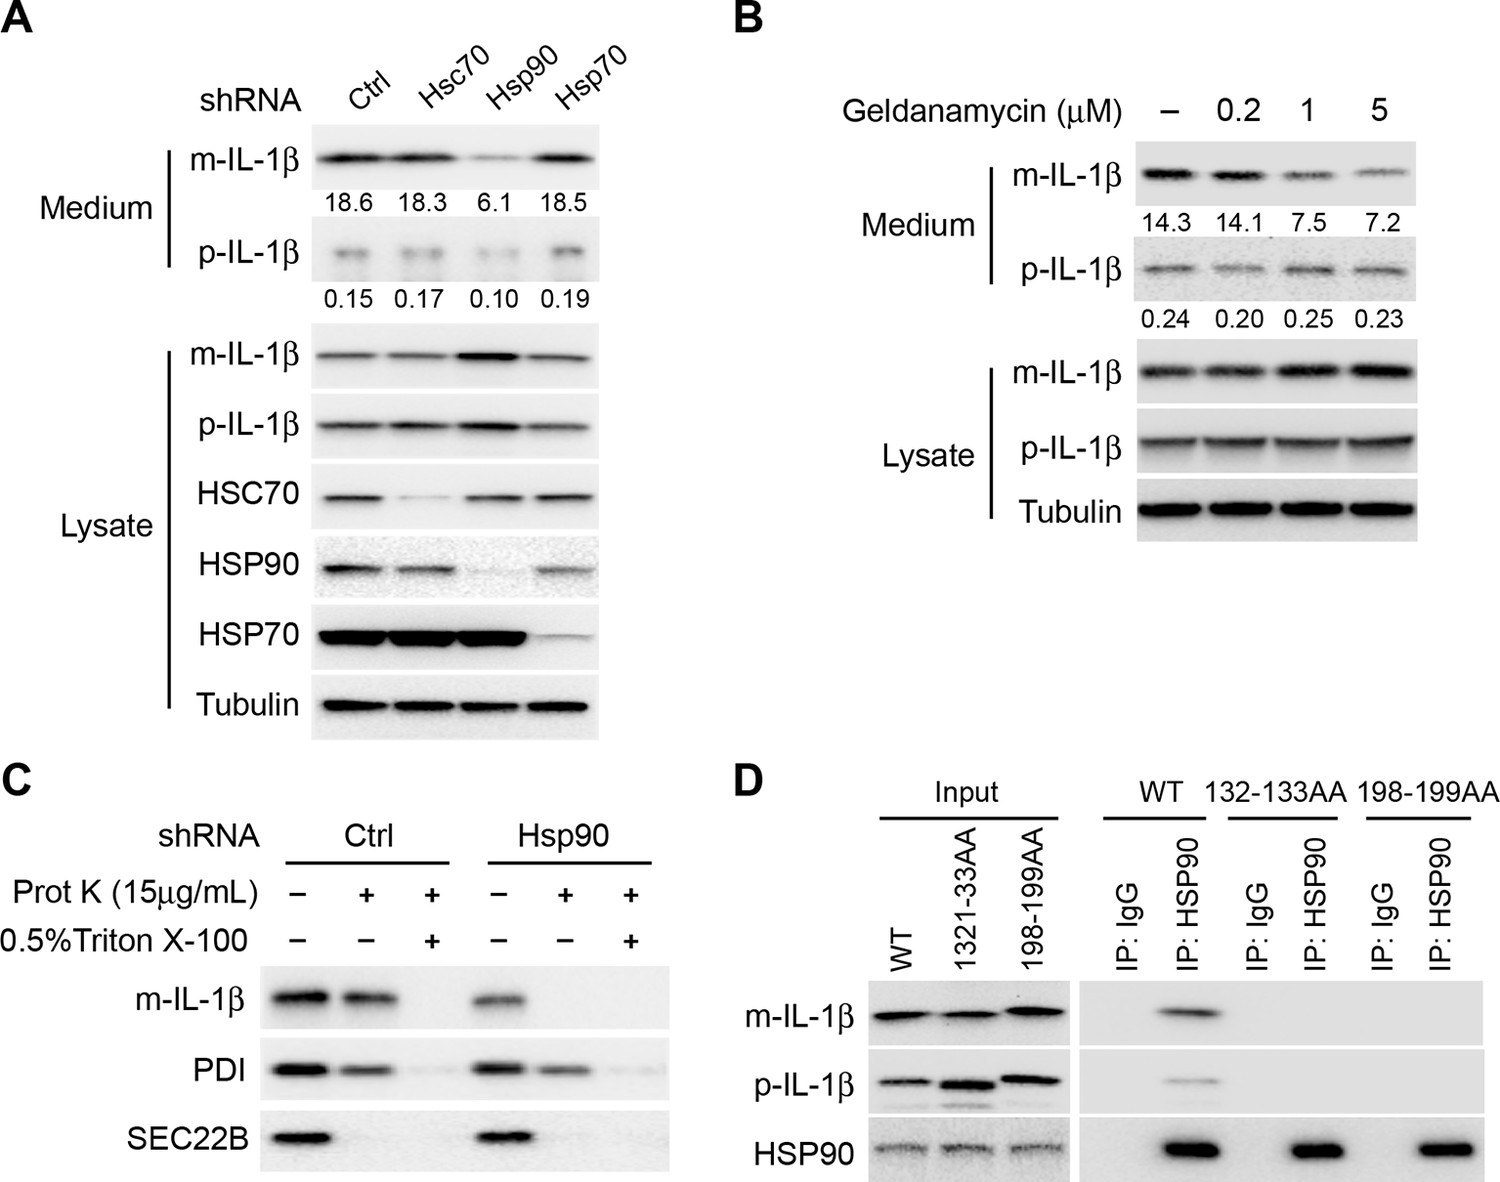
HSP90 is involved in the entry of IL-1β into vesicles.
(A) Knockdown of Hsp90 inhibits IL-1β secretion. HEK293T cells were transduced with lentivirus carrying control (Ctrl) shRNA or shRNA against Hsc70, Hsp90 or Hsp70. Then the cells were transfected with p-IL-1β and p-caspase-1 plasmids. After transfection (24 hr), the cells were cultured in EBSS for 2 hr followed by determination of IL-1β secretion by immunoblot. (B) IL-1β secretion is reduced in the presence of HSP90 inhibitor geldanamycin. HEK293T cells were transfected with p-IL-1β and p-caspase-1 plasmids. After transfection (24 hr), the cells were treated with EBSS containing different concentrations of geldanamycin as indicated. Immunoblot was performed as shown in Figure 1. Quantification of IL-1β secretion was calculated as the ratio between the amount of IL-1β in the medium and the total amount (the sum of IL-1β in both medium and lysate). (C) IL-1β remains accessible to proteinase K in Hsp90 knockdown cells. HEK293T cells were transduced with lentivirus carrying control (Ctrl) shRNA or shRNA against Hsp90. Then the cells were transfected with p-IL-1β and p-caspase-1 plasmids. After transfection (24 hr), the cells were cultured in EBSS for 2 hr. The 25k membrane fraction was collected and digested with proteinase K and then analyzed by immunoblotting using indicated antibodies. (D) Association of HSP90 with IL-1β WT and mutants. HEK293T cells transfected with p-caspase-1 and IL-1β mutant 132-133AA or 198-199AA were starved in EBSS for 2 hr. Immunoprecipitation (IP) with anti-HSP90 antibody coupled to protein G-agarose was performed, followed by an immunoblot with anti-IL-1β and anti-HSP90 antibodies.
Figure 8—figure supplement 1
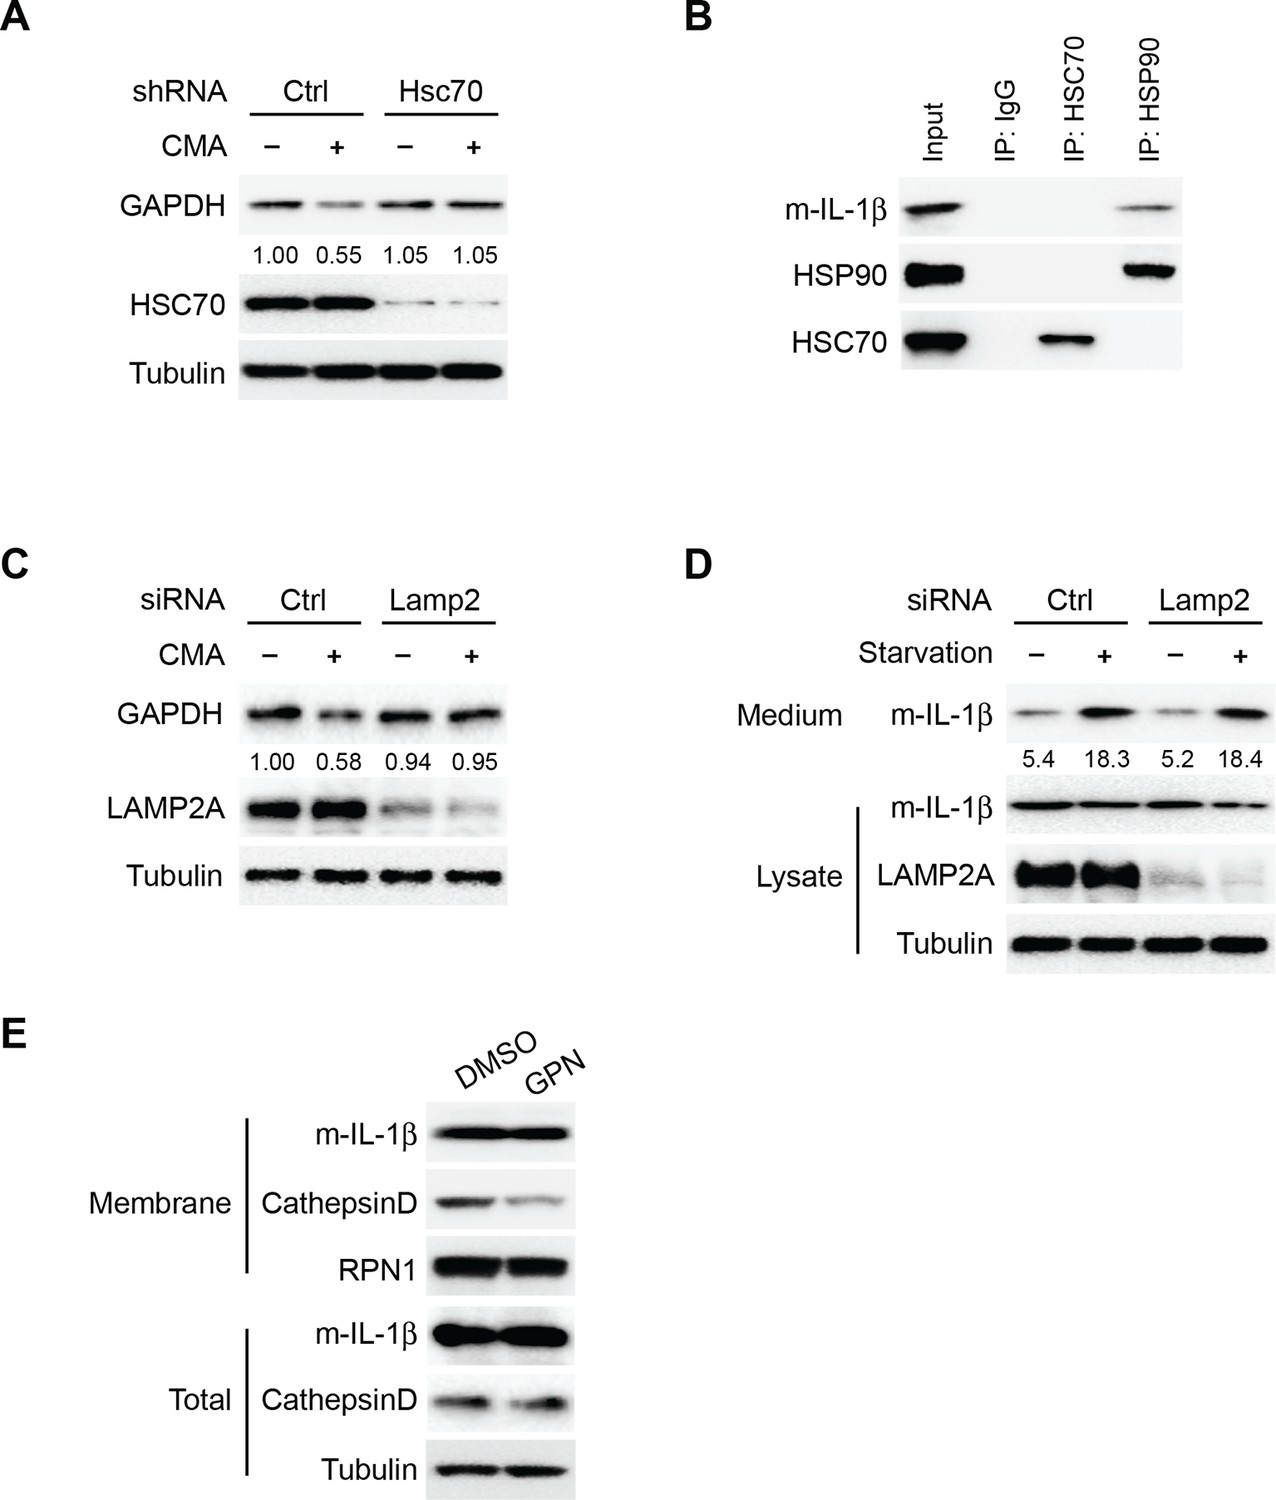
Translocation of IL-1β is mechanistically different from CMA.
(A) Knockdown of Hsc70 reduces CMA. HEK293T cells transduced with lentivirus carrying control (Ctrl) shRNA or shRNA against Hsc70 were incubated with regular medium (-CMA) or DMEM (+CMA) in the presence of 20 μg/ml cycloheximide for 24 hr. The cells were lysed and analyzed by immunoblotting using indicated antibodies. For quantification, the ratio of GAPDH and tubulin was calculated and normalized by that in control (-CMA) treatment which was set as one. (B) Co-immunoprecipitation of HSC70 or HSP90 with IL-1β. HEK293T cells transfected with m-IL-1β-FLAG were starved in EBSS for 2 hr. Immunoprecipitation (IP) with anti-HSC70 or anti-HSP90 antibody coupled to protein A/G-agarose was performed, followed by an immunoblot with indicated antibodies. (C) Knockdown of Lamp2 blocks CMA. HEK293T cells were transfected with control or LAMP2 siRNA. After transfection (48 hr), the cells were trypsinized and plated. After 24 hr, siRNA transfection was repeated. After another 48 hr, the cells were trypsinized and plated. After 24 hr, the cells were incubated with regular medium (-CMA) or DMEM (+CMA) in the presence of 20 μg/ml cycloheximide for 24 hr. The cells were lysed and analyzed by immunoblotting using indicated antibodies. For quantification, the ratio of GAPDH and Tubulin was calculated and normalized by that in control (-CMA) treatment which was set as one. (D) Knockdown of LAMP2 does not affect IL-1β secretion. HEK293T cells were transfected with control or LAMP2 siRNA as show in (C). After the second siRNA transfection (24 hr), the cells were transfected with m-IL-1β-FLAG plasmid. After transfection (24 h), the cells were either cultured in DMEM or EBSS for 2 hr followed by determination of IL-1β secretion by immunoblot as shown in Figure 1A. Quantification of IL-1β secretion was calculated as the ratio between the amount of IL-1β in the medium and the total amount (the sum of IL-1β in both medium and lysate). (E) Level of IL-1β in the membrane fraction was not affected by lysosome disruption. HEK293T cells transfected with m-IL-1β were cultured in EBSS for 2 hr and then treated with DMSO or 0.5 mM glycyl-L-phenylalanine-2-naphthylamide (GPN) for 10 min. The membrane fraction was collected from the top fractions of a Nycodenz density gradient resolved from membranes in a 25k pellet as described in Material and Methods. Both membrane fraction and cell lysis were analyzed by immunoblotting using indicated antibodies.
Figure 9
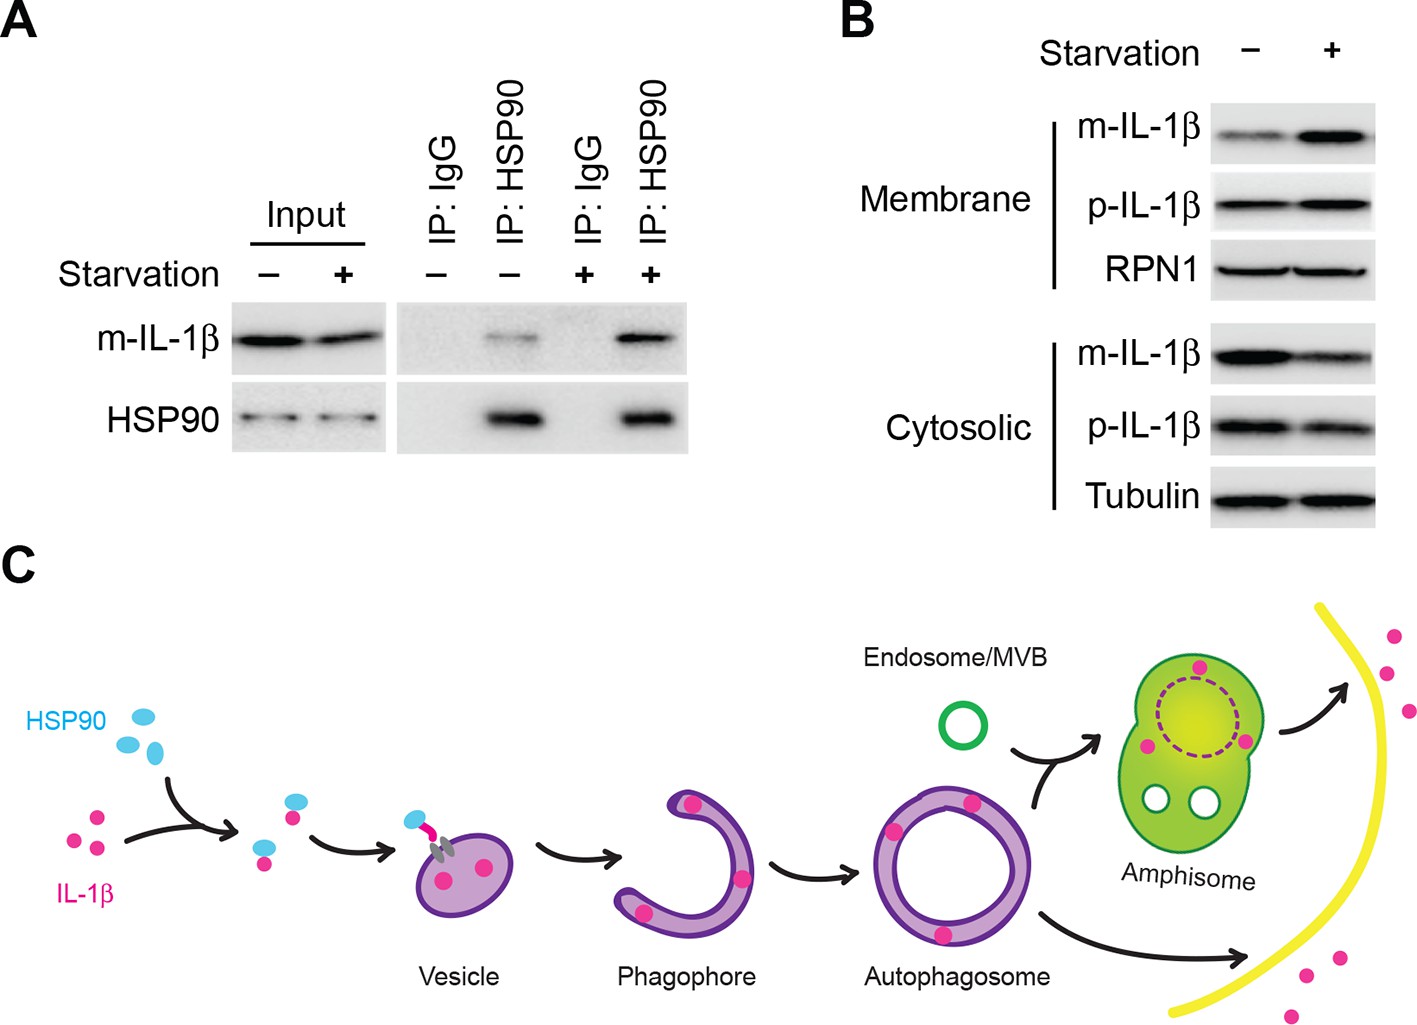
Induction of autophagy enhances the membrane incorporation of IL-1β.
(A) Starvation enhances the association of IL-1β with HSP90. HEK293T cells transfected with p-IL-1β and p-caspase-1 were cultured in DMEM or EBSS for 2 hr. Immunoprecipitation with anti-HSP90 antibody was performed followed by an immunoblot with anti-IL-1β and anti-HSP90 antibodies. (B) Starvation promotes the entry of IL-1β into the membrane fraction. HEK293T cells transfected with p-IL-1β and p-caspase-1 were cultured in DMEM or EBSS for 2 hr. The membrane fraction was collected from the top fractions of a Nycodenz density gradient resolved from membranes in a 25k pellet as described in Material and Methods. The cytosolic fraction was collected as the supernatant after 100k×g centrifugation. Immunoblot was performed to determine the levels of IL-1β in both fractions. (C) A proposed model for autophagy-mediated IL-1β secretion. Cytosolic IL-1β associates with HSP90 which facilitates the translocation of IL-1β into the lumen of a vesicle carrier which later either turns into a phagophore and an autophagosome or fuses with them. IL-1β localizes between the outer and inner membrane after the double membrane autophagosome forms. The topological distribution ensures the secretion of IL-1β in a soluble form. The IL-1β-containing autophagosome may directly fuse with the plasma membrane or further fuse with a MVB followed by fusion with the plasma membrane.
Videos
Video 1
3D section of the magnified structure in Figure 6 (upper one).
The virtual Z-section thickness is 150 nm, and the step size is 50 nm. Cyan, LC3; Magenta, IL-1β; Bar 500 nm
Video 2
3D section of the magnified structure in Figure 6 (lower one).
The virtual Z-section thickness is 150 nm, and the step size is 50 nm. Cyan, LC3; Magenta, IL-1β; Bar 500 nm
Download links
A two-part list of links to download the article, or parts of the article, in various formats.
Downloads (link to download the article as PDF)
Open citations (links to open the citations from this article in various online reference manager services)
Cite this article (links to download the citations from this article in formats compatible with various reference manager tools)
Translocation of interleukin-1β into a vesicle intermediate in autophagy-mediated secretion
eLife 4:e11205.
https://doi.org/10.7554/eLife.11205


