Mechanism of B-box 2 domain-mediated higher-order assembly of the retroviral restriction factor TRIM5α
- University of Virginia, United States
- University of Utah, United States
- Ben-Gurion University of the Negev, Israel
Figures
Figure 1 with 1 supplement
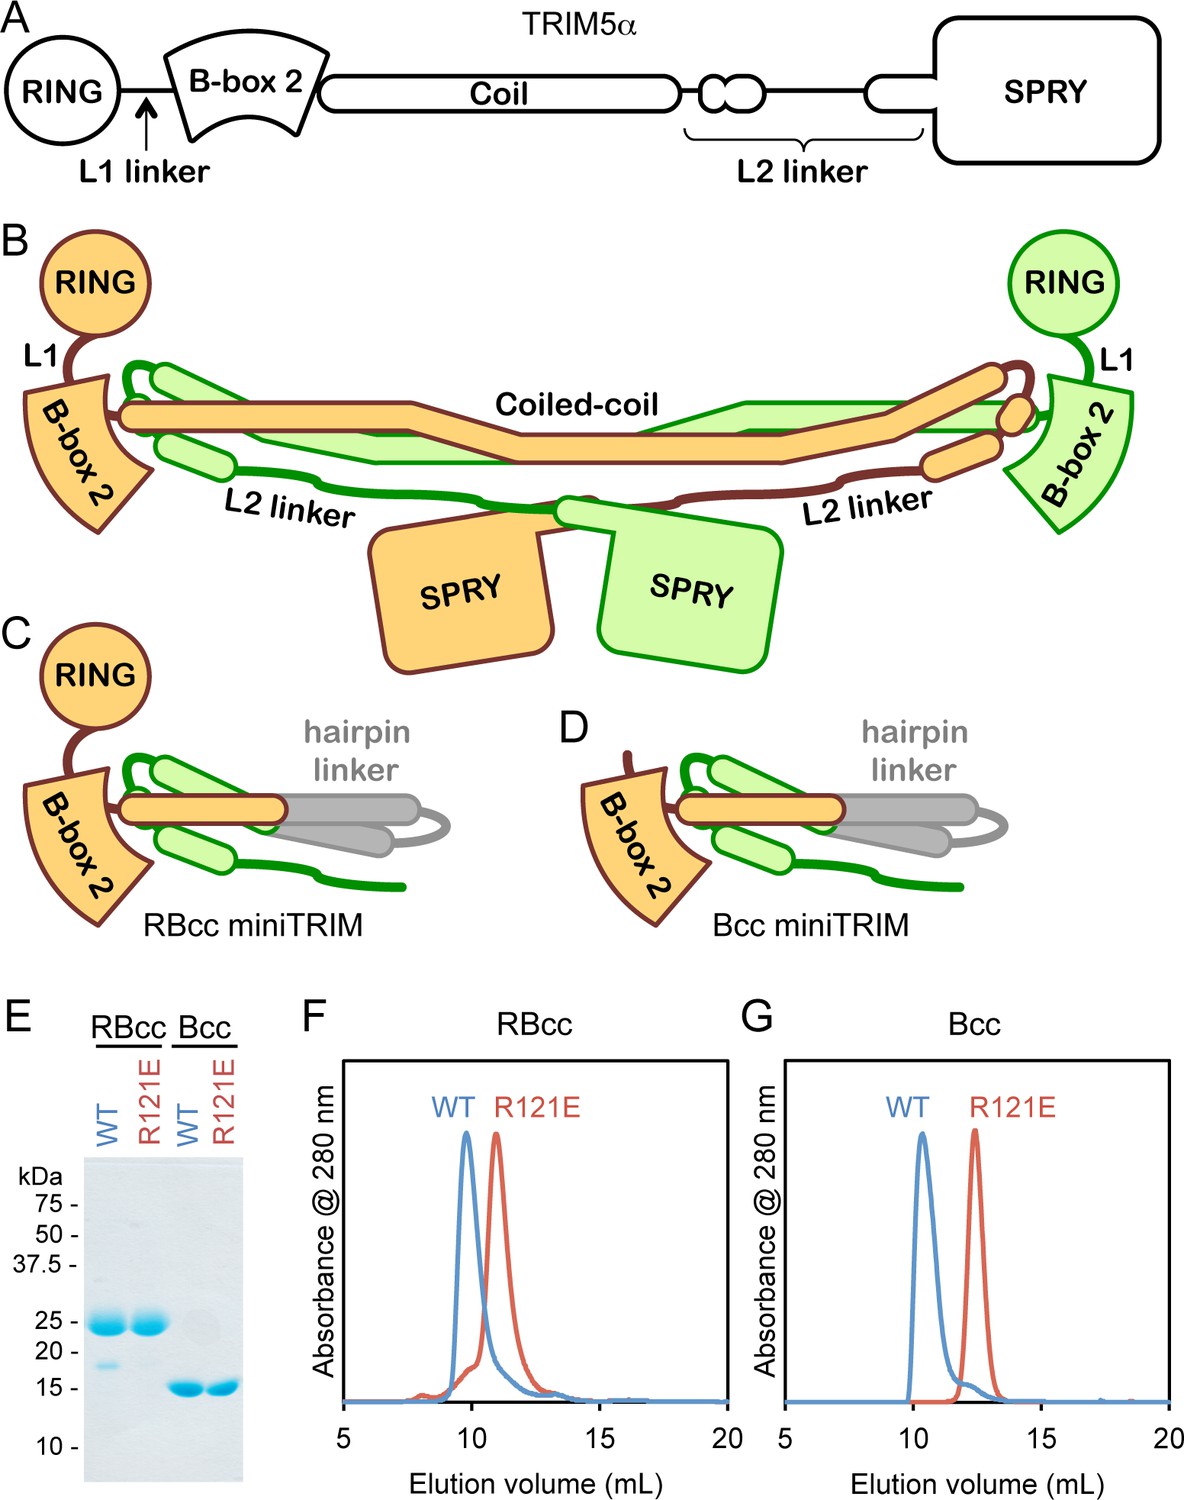
Design and oligomeric behavior of miniTRIM proteins.
(A) Schematic of the TRIM5α primary sequence. (B) Schematic of the antiparallel full-length dimer. (C–D) Schematic of the (C) RBcc miniTRIM and (D) Bcc miniTRIM. (E) SDS-PAGE profiles of purified miniTRIMs. (F–G) Size exclusion elution profiles of (F) RBcc and (G) Bcc miniTRIMs. Wildtype (WT) constructs eluted early (blue traces), whereas R121E mutants eluted late (red traces).
Figure 1—figure supplement 1
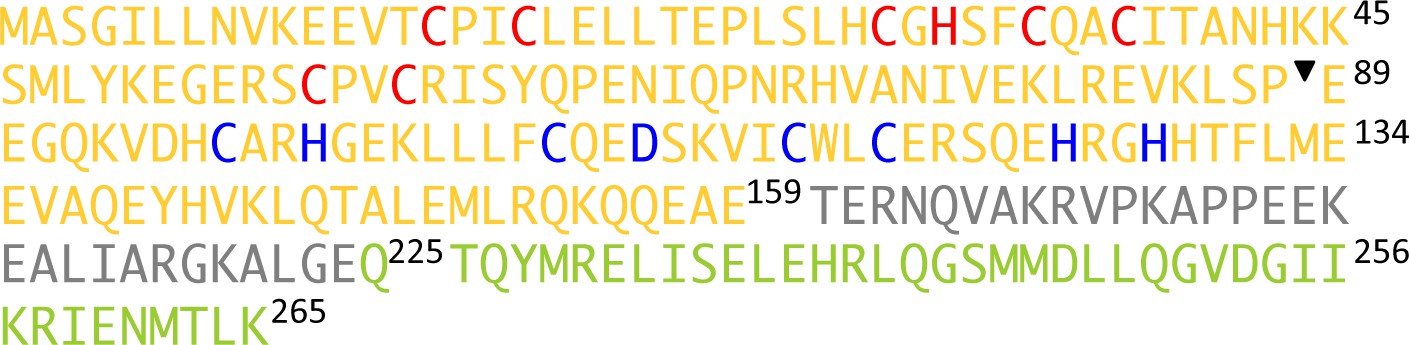
Primary sequence of the miniTRIMs.
Residues are color-coded as in Figure 1B–D. Zinc-coordinating residues in the RING and B-box 2 domains are colored in red and blue for reference. The inverted triangle indicates the start position of Bcc miniTRIM.
Figure 2 with 1 supplement
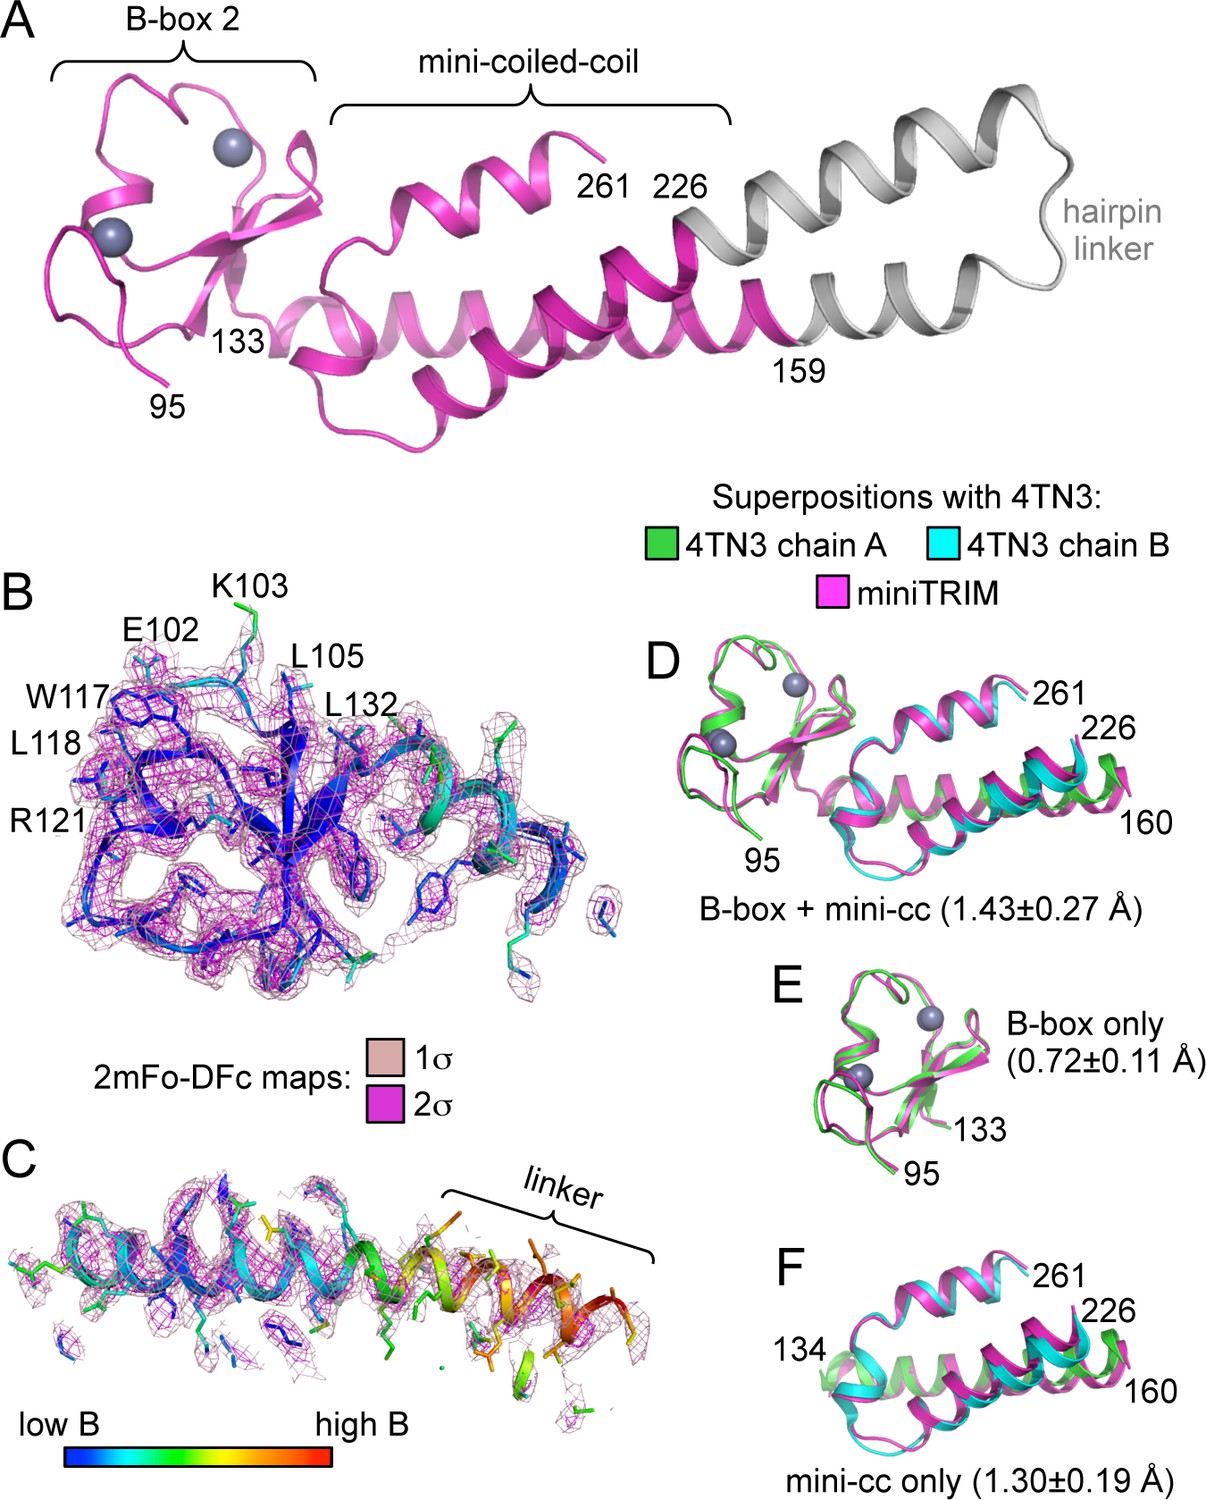
Structure of the Bcc miniTRIM.
(A) Complete structure of the Bcc miniTRIM, from a dimer subunit. Residues derived from TRIM5α are colored in magenta, and the artificial hairpin linker is in gray. Charcoal gray spheres indicate zinc atoms. Residue numbers are indicated. (B–C) Electron density maps at two contour levels for (B) the B-box 2 domain and (C) the coiled-coil region of a trimeric Bcc subunit. The model is colored according to B-factor, which indicates that the B-box and proximal coiled-coil regions are well defined. B-box 2 sidechains within oligomerization interfaces are labeled to illustrate that these residues are well defined by the density. (D–F) Superposition of Bcc miniTRIM (magenta) with the corresponding B-box 2 and coiled-coil regions in the crystal structure of the rhesus TRIM5α B-box/coiled-coil fragment (PDB 4TN3) (Goldstone et al., 2014): (D) B-box and coiled-coil regions, (E) B-box alone, (F) coiled-coil alone. Residue ranges used in the superposition are indicated, as are the average mean square deviations ± s.d. from pair-wise superpositions of each of the 12 monomer structures. Deviations from each individual superposition are in Supplementary file 1B.
Figure 2—figure supplement 1
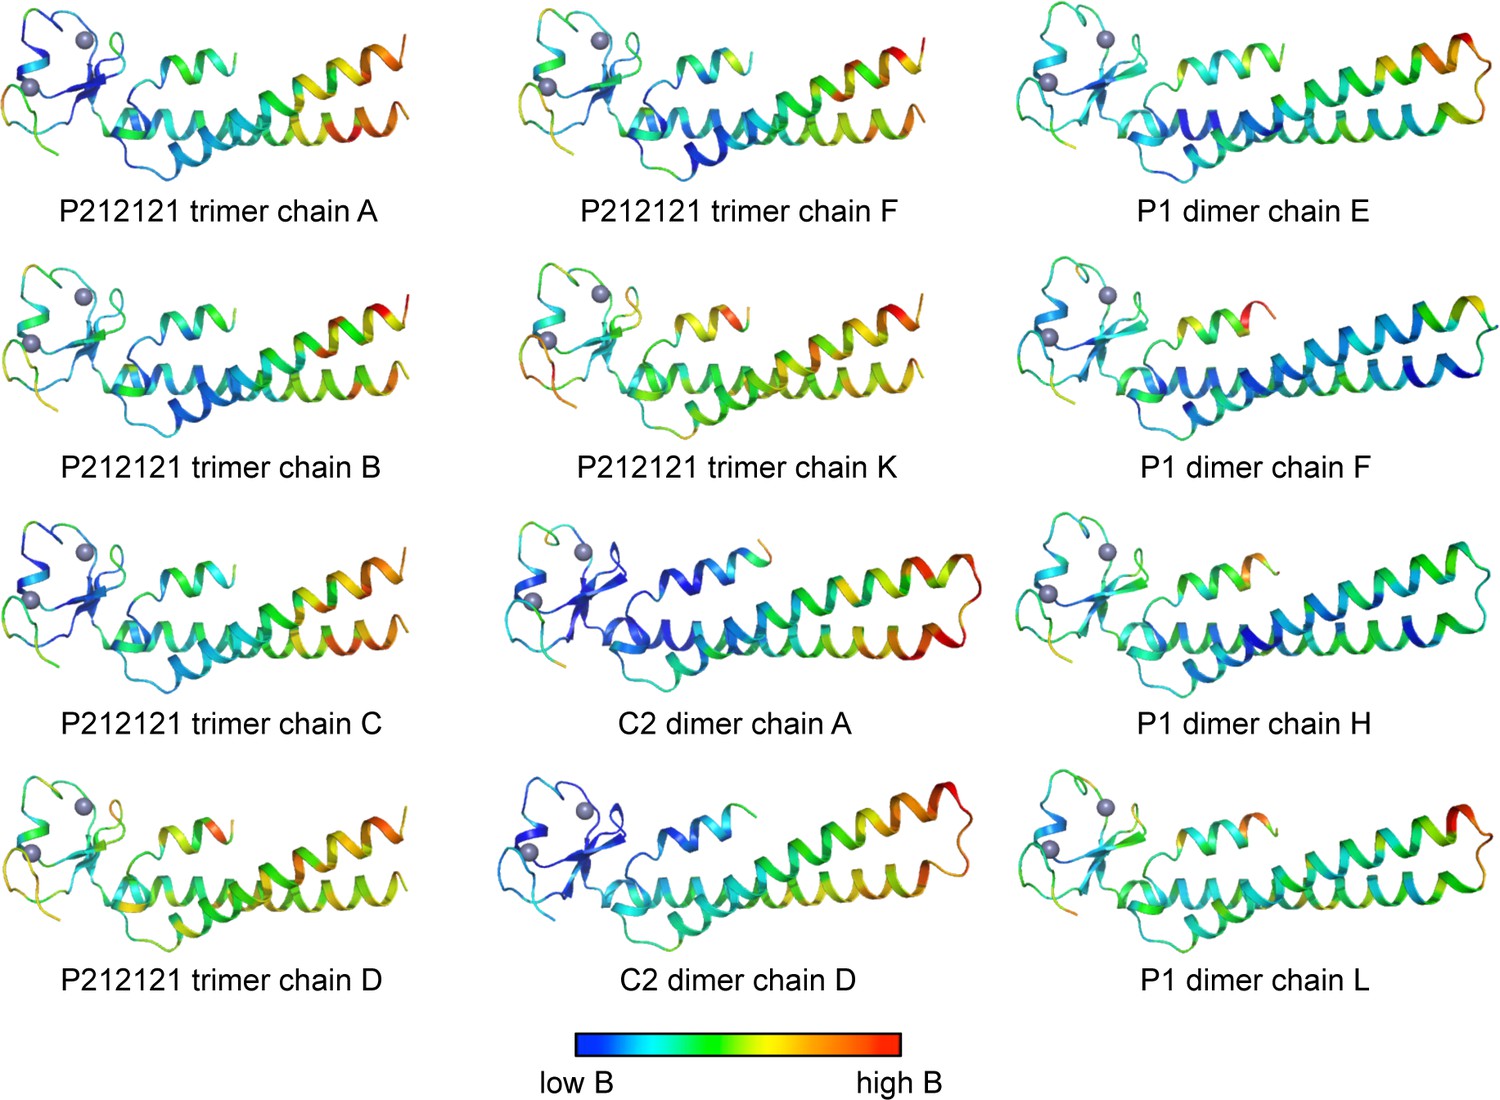
Ribbon representations of the 12 crystallographically independent Bcc miniTRIM structures solved in this study.
Residues are colored according to B-factor.
Figure 3 with 5 supplements
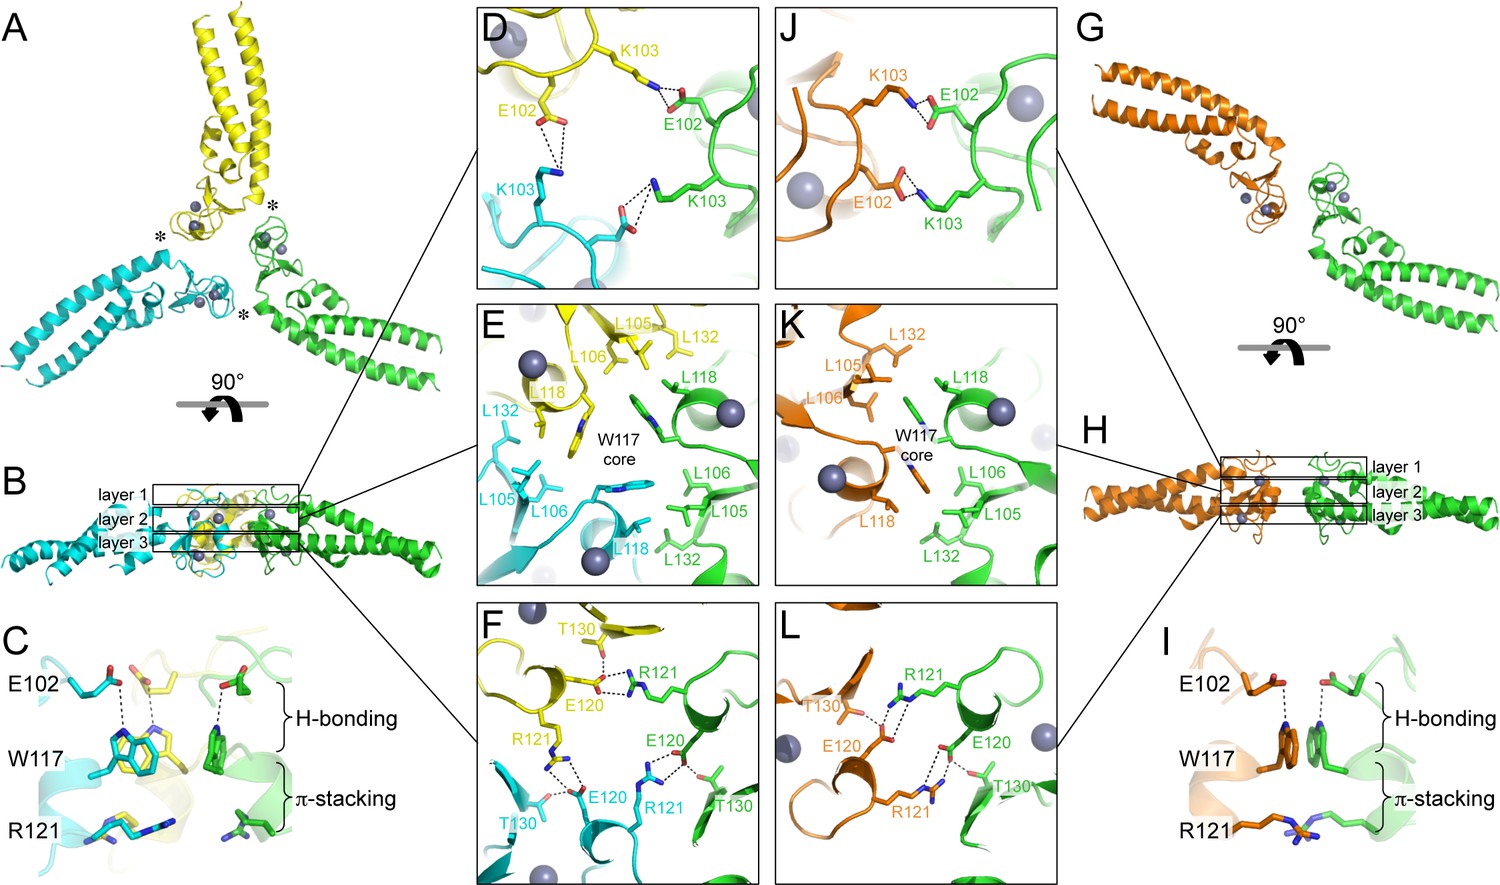
Oligomeric structures of Bcc miniTRIM.
(A) Trimer crystal structure and (G) dimer crystal structure, viewed from the 'top' (closest to the N-termini). (B,H) Side views. Three layers of interactions are boxed and expanded in the central panels. Asterisks in A indicate a site of close packing between the B-box and the N-terminal end of the coiled-coil helix. (C,I) Interactions between layers. (D–F,J–L) Expanded views of three layers of interactions, in the same orientations as A and G. Relevant sidechains are shown as sticks and labeled. Hydrogen bonds and salt bridges are indicated by black dashed lines. Zinc atoms are shown as gray spheres.
Figure 3—figure supplement 1
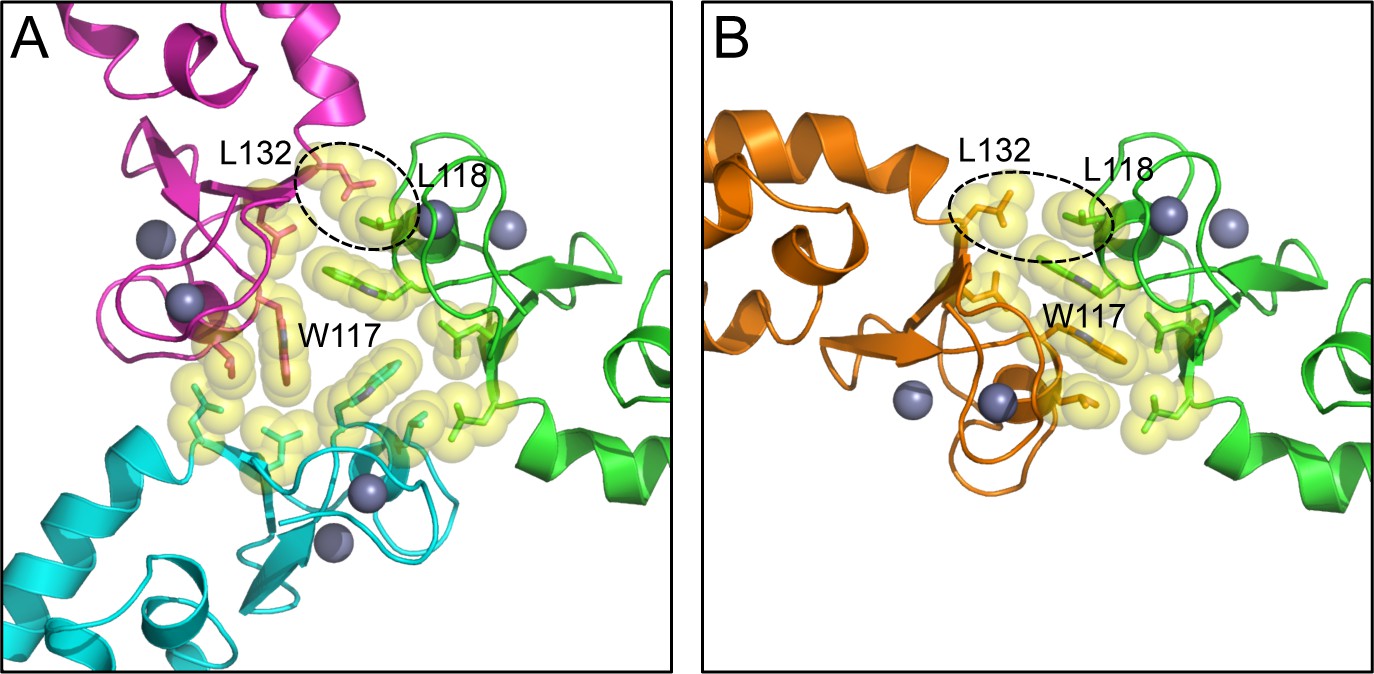
Comparison of the B-box trimer (A) and dimer (B).
Hydrophobic residues discussed in the text are shown as spheres. Dashed circles highlight Leu118 and Leu132, which are more close-packed in the trimer (asterisks in Figure 3A) compared to the dimer.
Figure 3—figure supplement 2
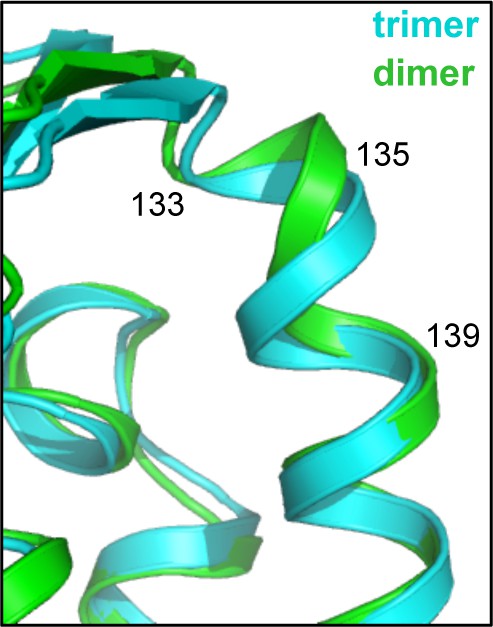
Superposition of representative subunits from the trimer (cyan) and dimer (green) indicate local bending of the coiled-coil helix spanning residues 133–139.
https://doi.org/10.7554/eLife.16309.010
Figure 3—figure supplement 3
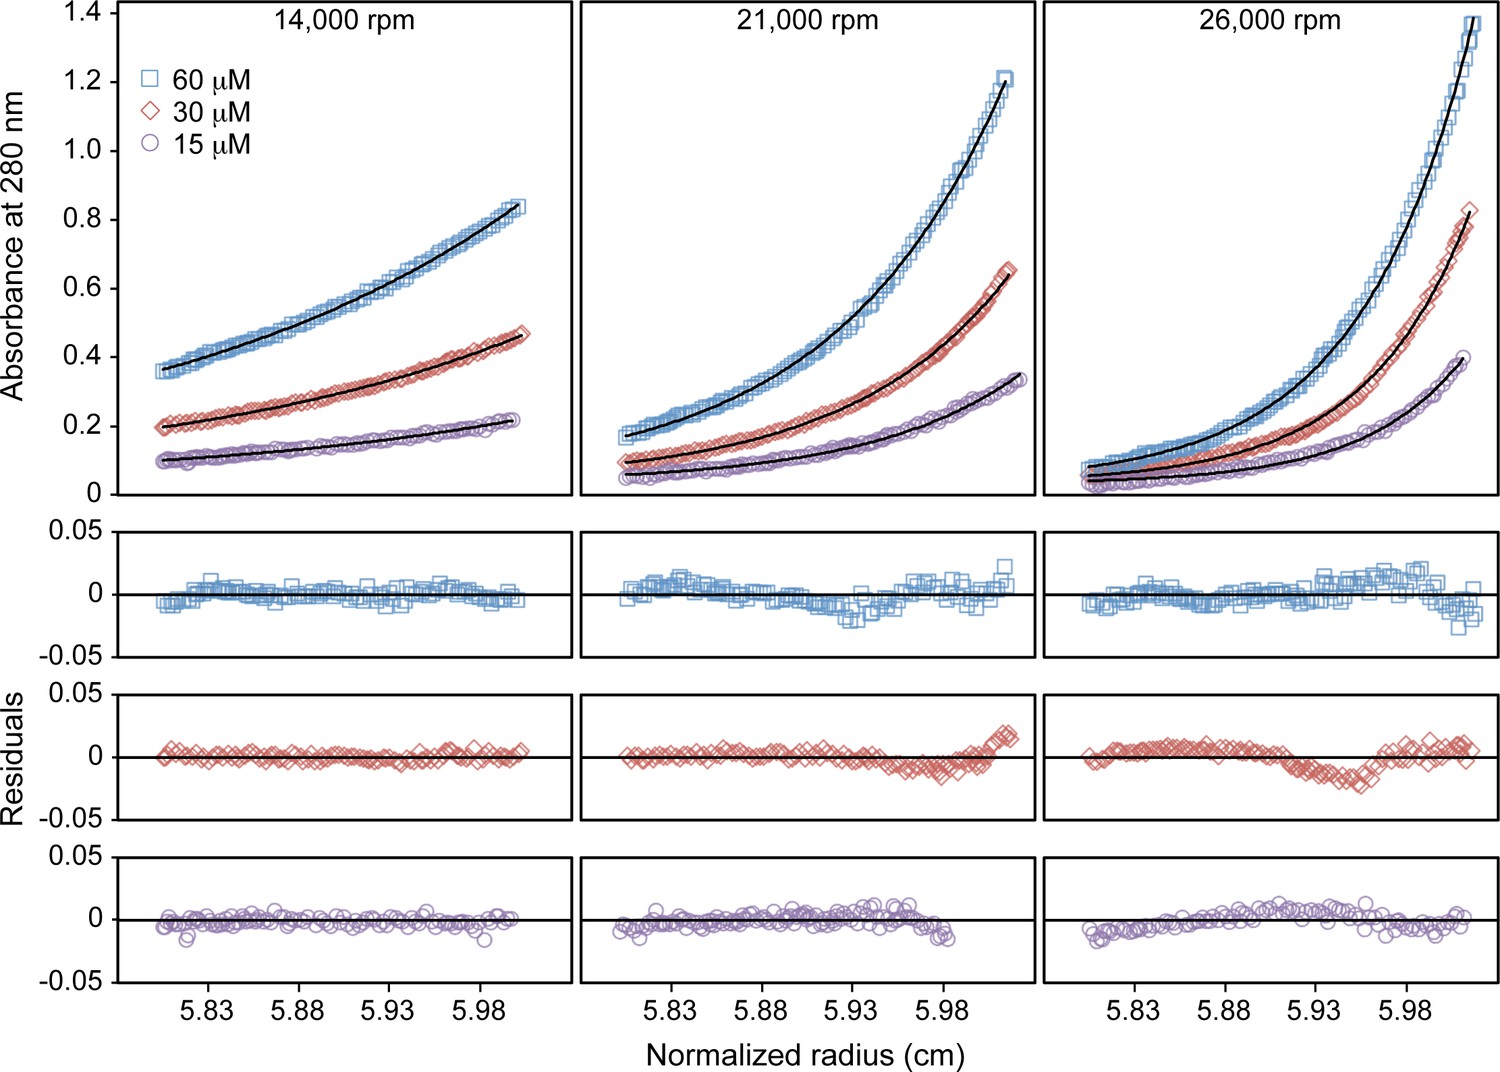
Sedimentation equilibrium analytical ultracentrifugation profiles of Bcc miniTRIM.
Upper panels show absorbance measurements at 280 nm (symbols) and best-fit curves (solid lines). Lower panels show residual differences. Measurements were made at the indicated centrifugation speeds and loading protein concentrations. All nine distributions were globally fit to an ideal monomer-dimer equilibrium model. Fixing the molecular weight to the theoretical value for a monomer (16.4 kDa) returned a dissociation constant of 0.94 μM.
Figure 3—figure supplement 4
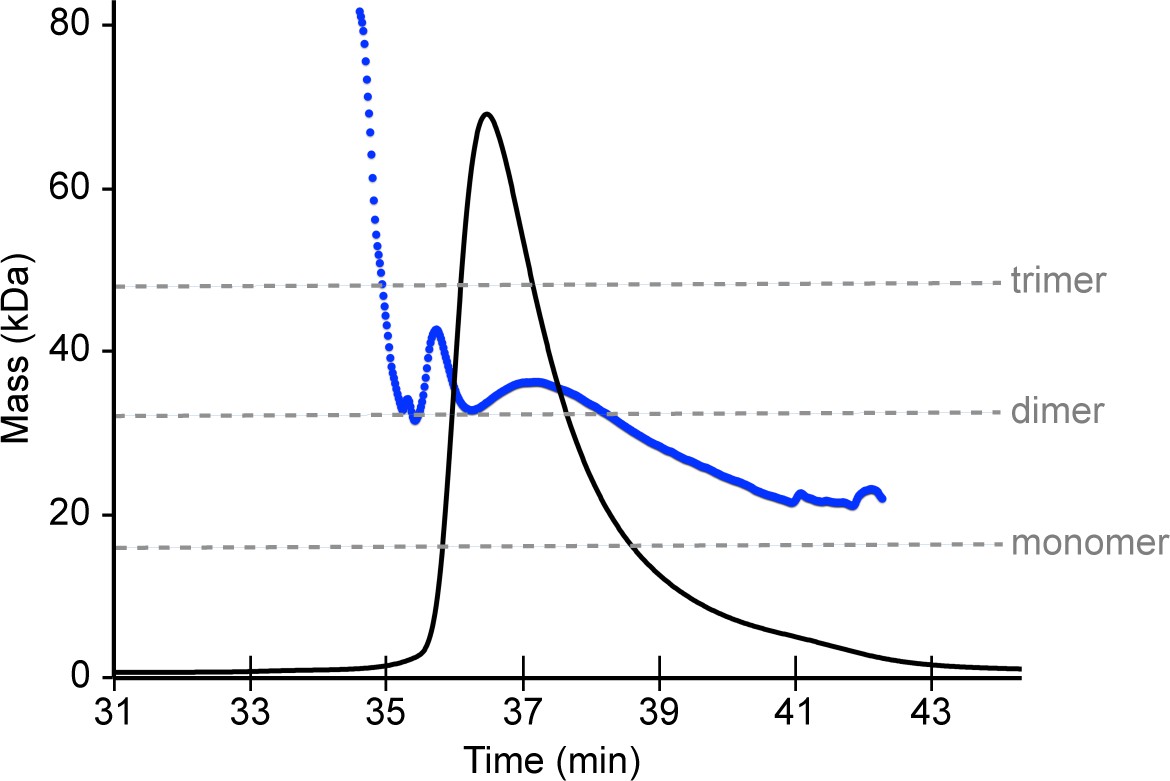
SEC-MALS analysis of Bcc miniTRIM.
Protein concentrations were monitored using absorbance (not shown) and refractive index (black trace). The masses of eluting species (blue trace) indicate that the injected sample (0.9 mM) is polydisperse and consists primarily of dimers.
Figure 3—figure supplement 5
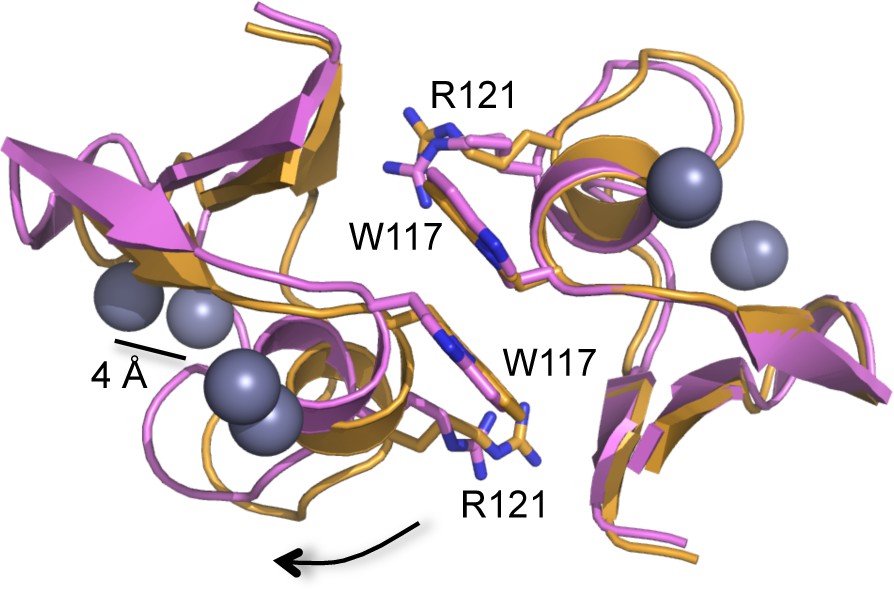
Slight clam shell-like opening of the B-box dimer interface.
Ribbon representations of two dimer structures, superimposed on the right subunits (C2 form, orange; P1 form, pink). Equivalent atoms on the left subunits move by up to 4 Å (indicated for one of the zinc atoms, gray spheres). Sidechains for Trp117 and Arg121 are shown for reference. Arrow indicates direction of movement for the subunit on the left.
Figure 4
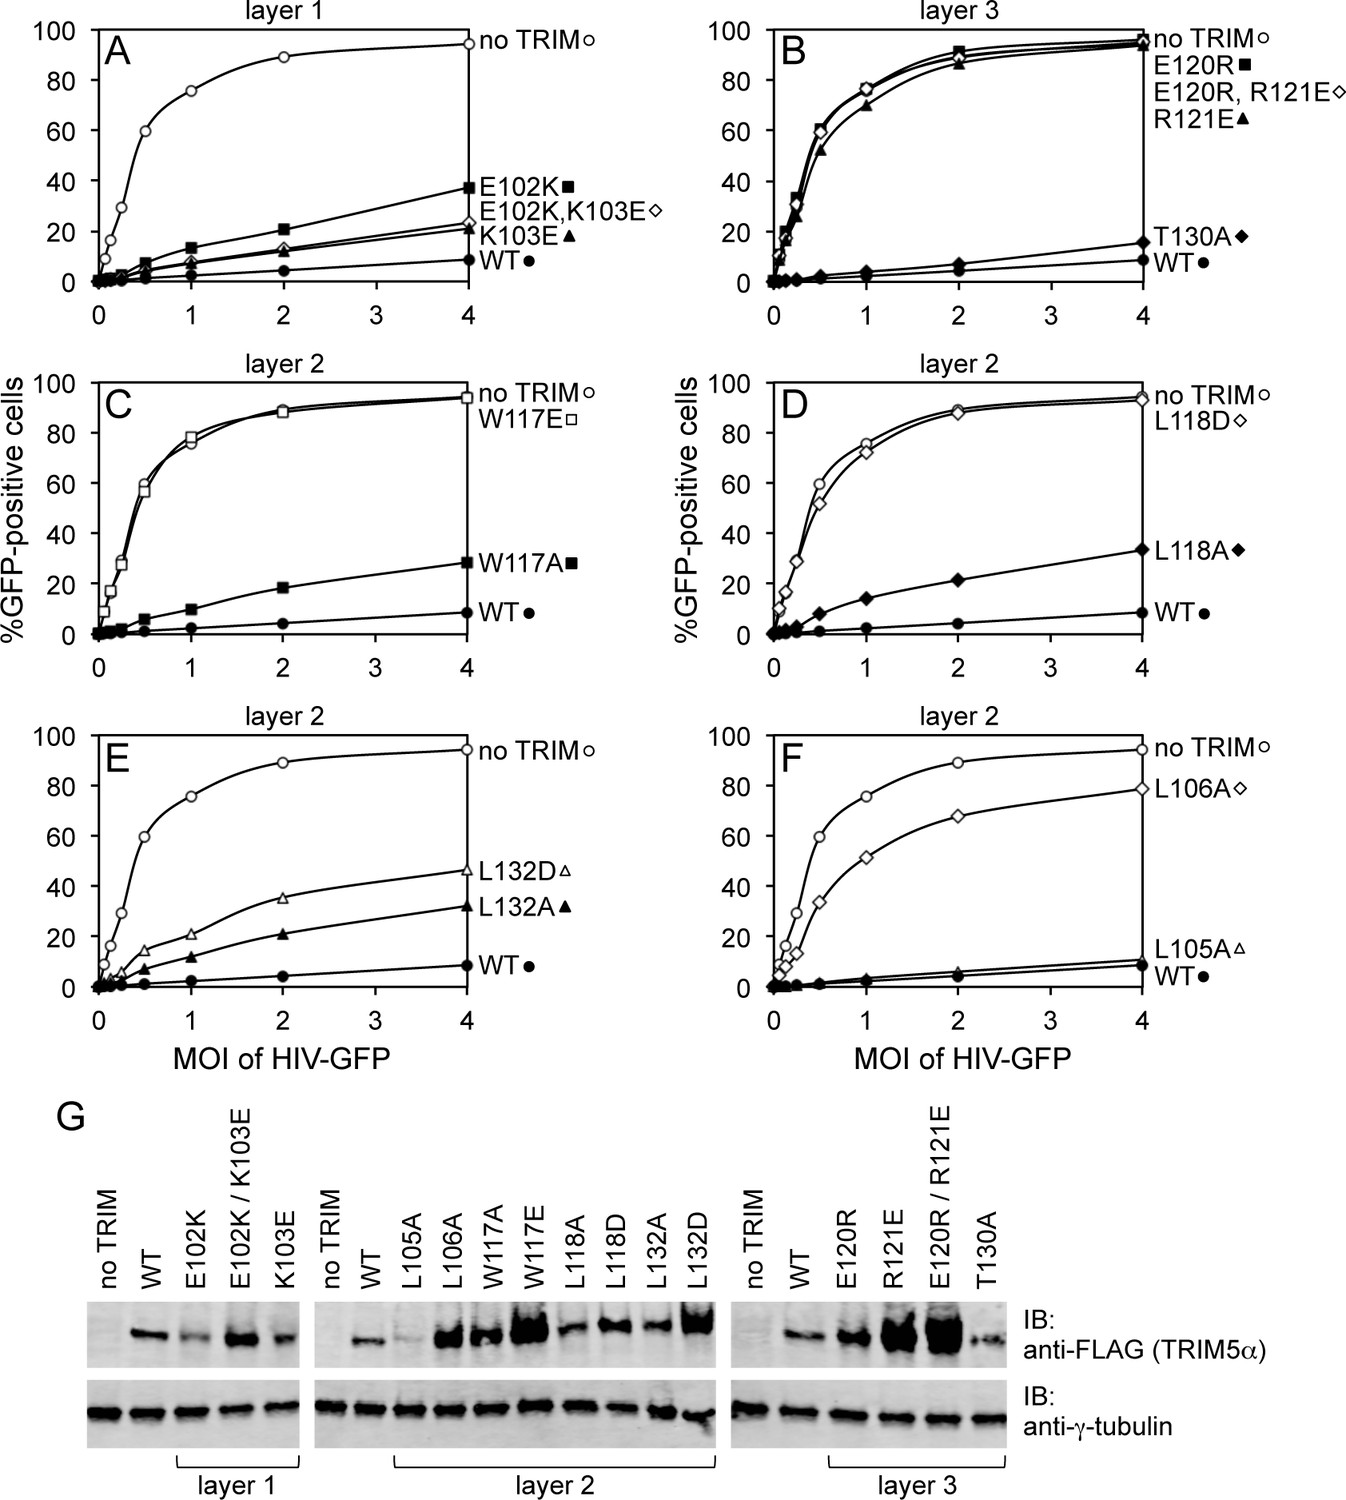
Restriction activities of rhesus TRIM5α containing structure-based B-box 2 domain mutations. For clarity, the data are presented in multiple panels.
(A–F) GFP-labeled HIV-1 efficiently transduced HeLa cells that did not express exogenous TRIM5α (no TRIM, open spheres). Transduction was significantly inhibited in cells that expressed WT TRIM5α (WT, filled spheres). The same results were obtained in two independent experiments. (G) Immunoblots (IB) of whole cell lysates with anti-FLAG antibody to determine expression levels of rhesus TRIM5α mutants (upper). Anti-tubulin blots indicate that equivalent samples were loaded into each lane (lower).
Figure 5
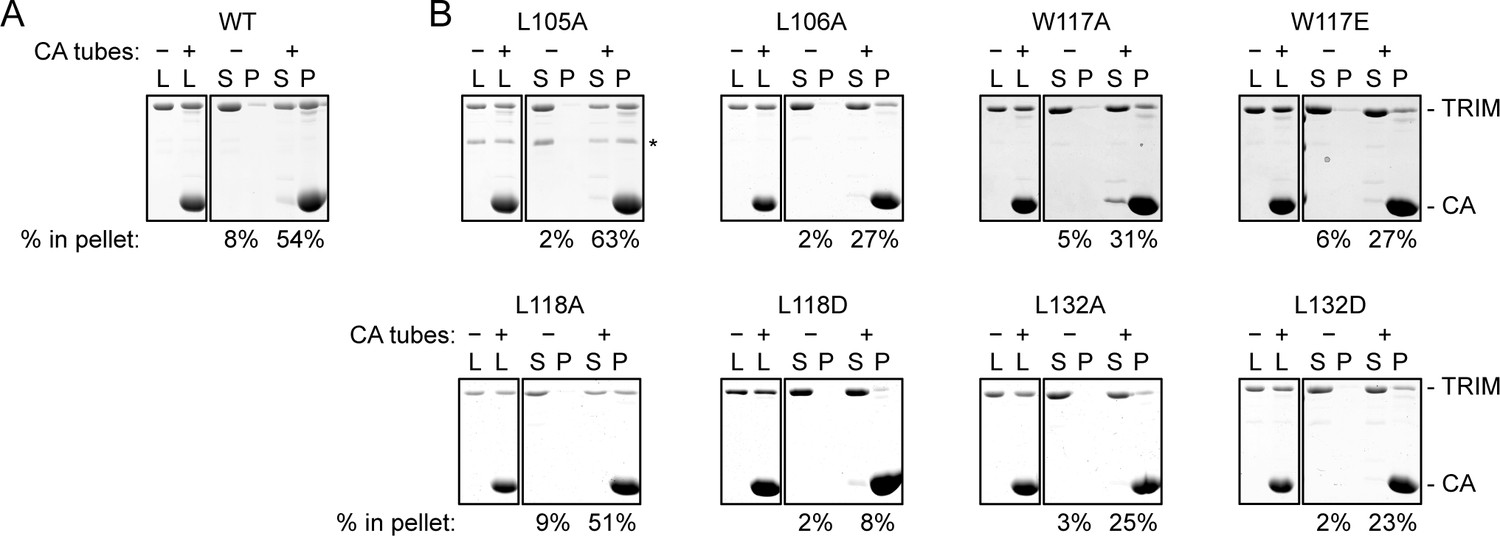
CA tube pull-down assay.
(A) WT control. (B) Indicated mutants. Purified TRIM5-21R proteins were incubated with disulfide-stabilized CA tubes and pelleted in a microcentrifuge. Bound (pellet) and unbound (supernatant) proteins were visualized by SDS-PAGE with Coomassie staining and quantified. Percentage values indicate the fraction of protein in the pellet. Results are representative of at least two experiments per mutant, each done with an independent protein preparation. L, load; S, supernatant; P, pellet. CA and TRIM bands are indicated. The asterisk indicates an apparent proteolytic fragment of TRIM5-21R.
Figure 6
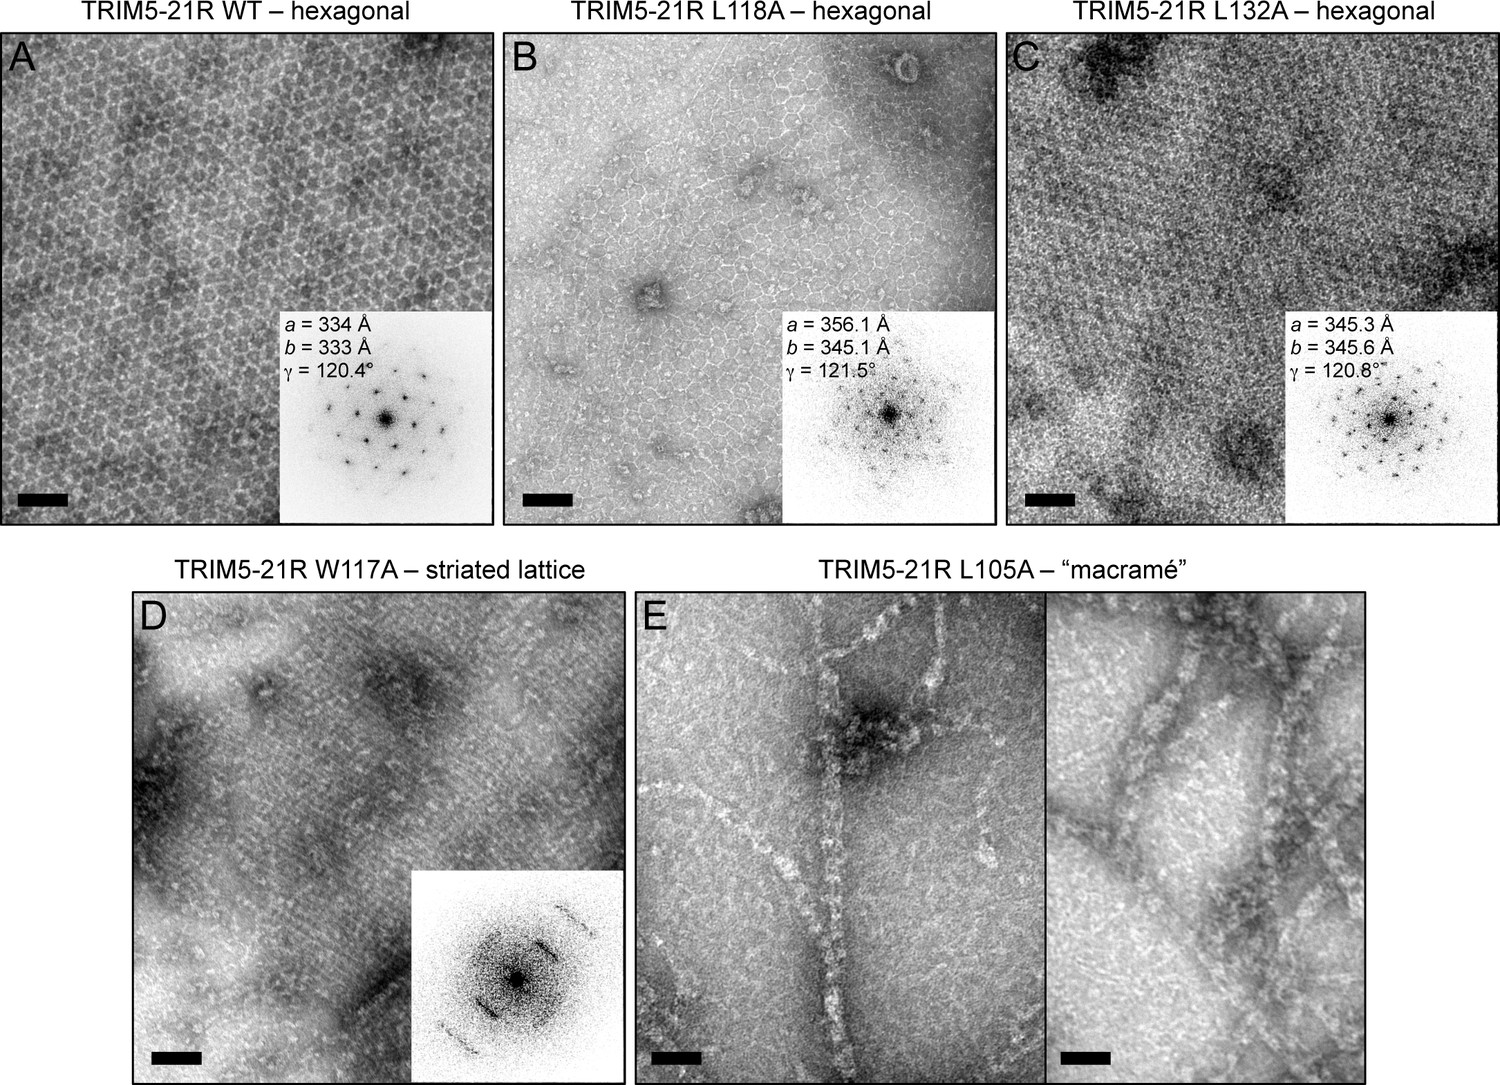
Spontaneous assembly of TRIM5-21R.
(A) WT TRIM5-21R spontaneously assembled into hexagonal arrays at a concentration of 1 mg/mL in 25 mM Tris, pH 8, 25 mM NaCl, 1 mM TCEP (standard conditions) (Ganser-Pornillos et al., 2011). Main panel shows a representative negatively stained image of the arrays; inset shows a Fourier transform of the image. The unit cell spacing (symmetry unimposed) calculated from the diffraction pattern is indicated. (B) L118A and (C) L132A, which gave intermediate restriction phenotypes in context of rhesus TRIM5α, also assembled into hexagonal nets, but at higher protein concentrations (2 and 9 mg/mL, respectively). (D) W117A aggregated under standard conditions but at >5 mg/mL and 250 mM NaCl assembled into a striated array. (E) L105A, which was fully restriction competent, assembled spontaneously under standard conditions into networks that were neither hexagonal not striated. Results are representative of two or three experiments per construct, each done with an independent protein preparation. Scale bars = 100 nm.
Figure 7
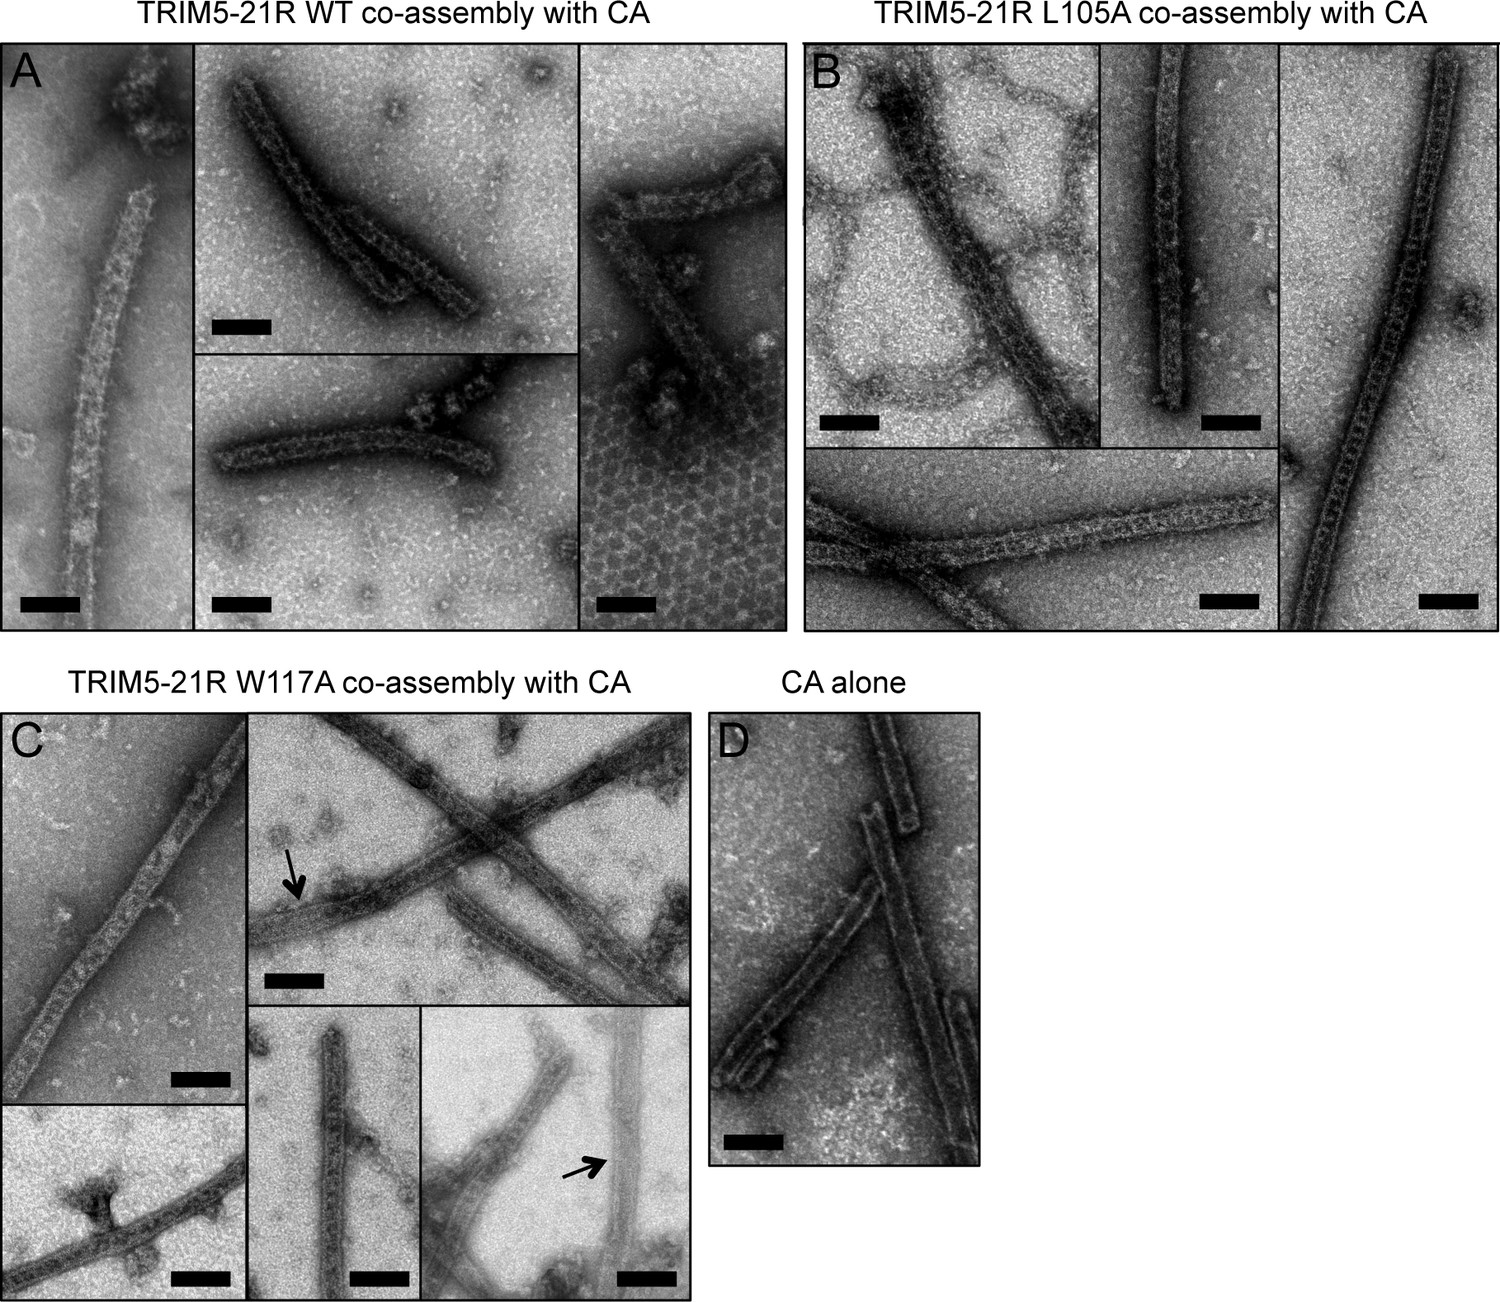
Co-assembly of TRIM5-21R with HIV-1 CA.
(A) Incubation of WT TRIM5-21R with soluble HIV-1 CA protein induced assembly of TRIM-coated capsid tubes. A similar phenotype was observed when co-assembly is performed with African green monkey TRIM5α (Li et al., 2016). (B) TRIM5-21R with the L105A mutation made similar decorated tubes as WT in this assay. (C) W117A also made similar decorations, but to a more limited extent. Partially decorated and undecorated tubes were more prevalent (arrows). Results are representative of two or three experiments per construct, each done with an independent protein preparation. (D) Undecorated CA tubes shown for comparison. Scale bars = 100 nm.
Figure 8
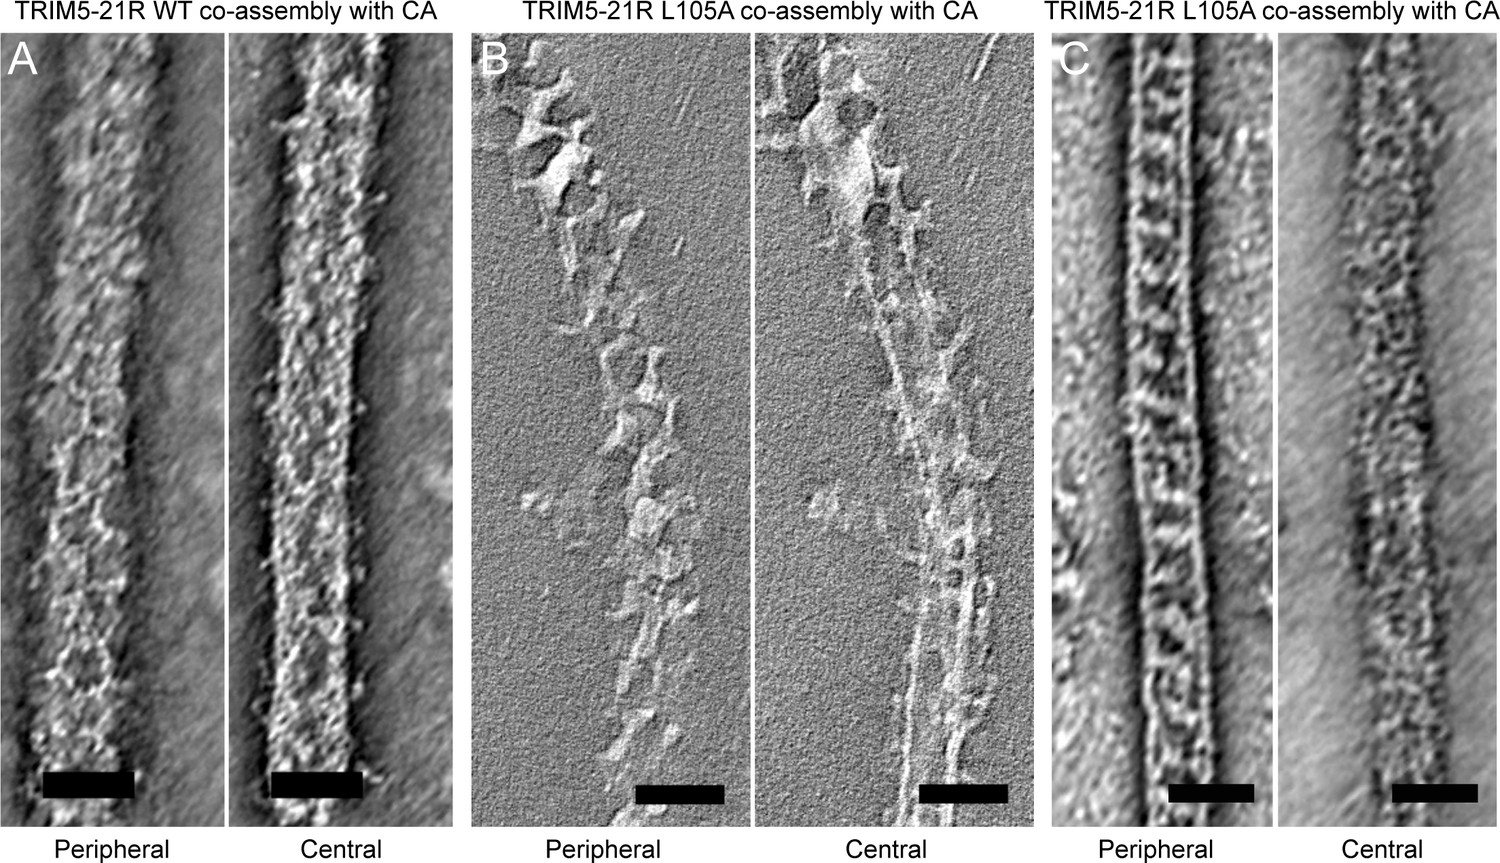
Slices of tomographic reconstructions of (A) WT and (B) L105A TRIM5-21R coated CA tubes.
Left panels show peripheral slices, and right panels show central slices of the same tube. (C) Some of the L105A-coated tubes had ladder-like TRIM overlays that do not seem hexagonal. These could be due to overlapping lattices or an alternative arrangement of TRIM dimers. Scale bars = 50 nm.
Figure 9
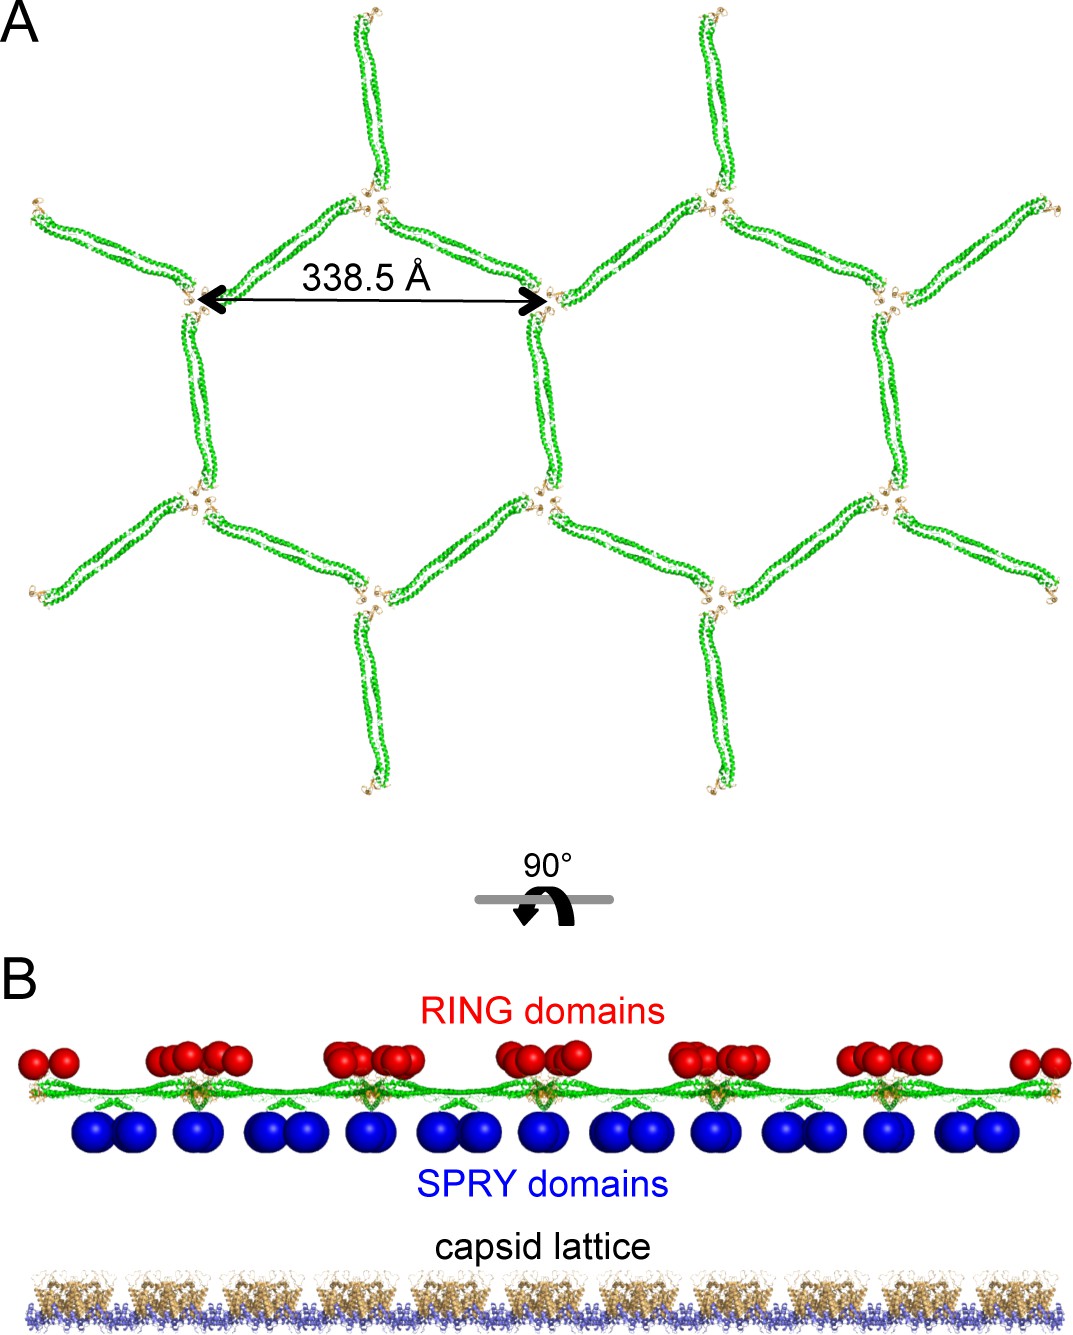
Molecular model of a flat TRIM5α hexagonal lattice.
(A) Top view, with the B-box 2 domains colored in orange and the coiled-coil domains in green. (B) Side view, with the expected positions of the SPRY domains (blue) and RING domains (red) indicated by spheres. The flat capsid lattice is shown for reference.
Figure 10
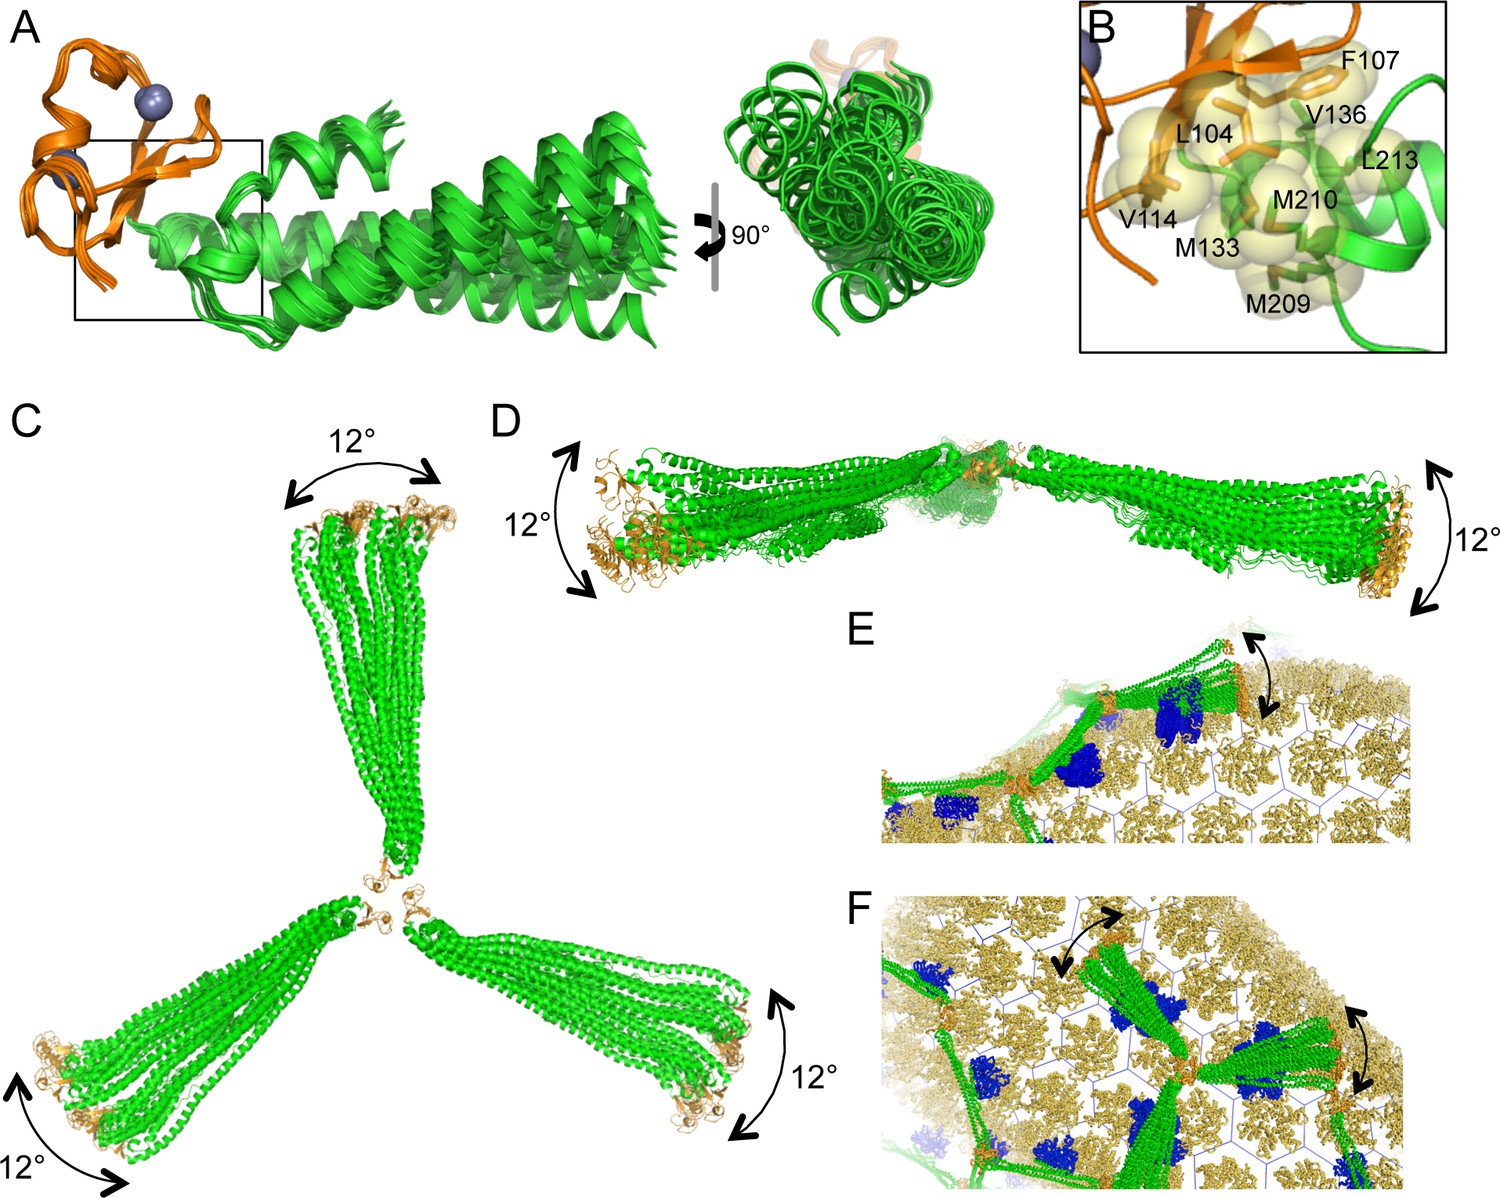
Flexible architecture of the miniTRIMs.
(A) Orthogonal views of 12 crystallographically independent structures of Bcc miniTRIM. Superpositions of the structures on the B-box 2 domains (orange) reveals rigid body movements of the coiled-coil domains (green). (B) Close-up view of the B-box/coiled-coil interface boxed in A. Relevant sidechains are shown explicitly and labeled. (C,D) Superpositions of multiple full-length triskelion models on the B-boxes illustrate that the coiled-coil arms can swing flexibly relative to the B-box trimer vertex. (E,F) Speculative illustrations of how flexible triskelion arms can simultaneously allow the assembling TRIM lattice (green – coiled-coil; orange – B-box) to follow the curvature of the capsid (yellow orange) while scanning for optimal binding positions of the SPRY domains (blue).
Figure 11

Models of RING domain configurations in context of the B-box trimer.
(A) RING domains were modeled as monomers attached to their respective B-boxes by a flexible 23- residue linker. Left panel shows three representative configurations of the RING monomer relative to the trimer plane; above, within, and below. Right panel shows 500 of the 10,000 models calculated. (B) RING domains were modeled as dimers with a shorter, 12- residue linker. This resulted in only 13 configurations that were sterochemically plausible. (C) Computational model of a self-ubiquitination complex. Domains and proteins are color-coded as follows: RING, red; L1 linker, red (N-term) and white (C-term); B-box 2, orange; coiled-coil, green; E2, dark blue; ubiquitin, cyan. Positions of the thioester (yellow) and Lys51 amine (blue) are indicated by spheres, and are about 7 Å apart in this model.
Tables
Table 1
Crystallographic statistics.
| Dimer | Dimer | Trimer | |
|---|---|---|---|
| Diffraction Data | |||
| Beamline | APS 22ID | APS 22ID | APS 22ID |
| Wavelength (Å) | 1.0 | 1.0 | 1.0 |
| Processing program | HKL2000 | HKL2000 | HKL2000 |
| Space group | C2 | P1 | P212121 |
| Cell dimensions | a = 72.7 Å | a = 45.8 Å | a = 71.2 Å |
| b = 41.5 Å | b = 52.3 Å | b = 71.5 Å | |
| c = 111.3 Å | c = 69.7 Å | c = 213.8 Å | |
| α = 90°, β = 110°, γ = 90° | α = 94.8°, β = 105.5°, γ = 103° | α = 90°, β = 90°, γ = 90° | |
| Resolution range, Å | 50-1.90 (1.97-1.90) | 50-2.30 (2.38-2.30) | 50-3.25 (3.37-3.25) |
| Rsym/Rmeas /Rpim | 0.18(0.43)/0.12(0.90)/0.06(0.50) | 0.07(0.16)/0.10(0.23)/0.07(0.16) | 0.08(1.0)/0.05(1.0)/0.08(1.0) |
| Mean I/σ<I> | 14.0 (1.2) | 9.4 (4.0) | 26.8 (1.6) |
| Completeness,% | 98.6 (90.4) | 93.9 (80.0) | 100 (100) |
| Average redundancy | 3.5 (2.7) | 1.9 (1.7) | 13.6 (9.4) |
| Wilson B-factor, Å2 | 40.5 | 36.0 | 35.1 |
| Refinement Statistics | |||
| Refinement program | PHENIX | PHENIX | PHENIX |
| Resolution range | 32.5-1.91 (1.98-1.91) | 35.05-2.29 (2.38-2.29) | 36.70-3.26 (3.37-3.26) |
| No. of unique reflections | 25,300 (2,301) | 25,156 (2,171) | 14,789 (181) |
| Reflections in free set | 1254 (117) | 1301 (113) | 1431 (30) |
| Rwork | 0.18 (0.30) | 0.22 (0.26) | 0.26 (0.30) |
| Rfree | 0.22 (0.31) | 0.26 (0.31) | 0.30 (0.39) |
| NCS copies | 2 | 4 | 6 |
| No. of nonhydrogen atoms | |||
| protein and zinc | 2,240 | 4,349 | 5,052 |
| solvent | 112 | 52 | 0 |
| Average B-factor (Å2) | |||
| protein and zinc | 63 | 58.9 | 72.77 |
| solvent | 53 | 53.1 | |
| Coordinate deviations | |||
| bond lengths, Å | 0.019 | 0.004 | 0.005 |
| bond angles,° | 1.644 | 0.724 | 0.375 |
| Validation and Deposition | |||
| Ramachandran plot | |||
| favored,% | 99 | 99 | 97.4 |
| outliers,% | 0 | 0 | 0 |
| MolProbity clashscore | 3.73 | 2.00 | 2.31 |
| PDB ID | 5EIU | 5F7T | 5IEA |
-
Values in parenthesis are for the highest resolution shell.
Table 2
Summary of structure-based mutagenesis.
| Mutation | Structure context | Restriction activity | Capsid binding | Spontaneous assembly | Co-assembly | Templated assembly |
|---|---|---|---|---|---|---|
| None (WT) | ++ | ++ | hexagonal1 | ++ | ++ | |
| E102A | top layer | + | n.d. | n.d. | n.d. | n.d. |
| K103A | top layer | + | n.d. | n.d. | n.d. | n.d. |
| E102A,K103A | top layer | + | n.d. | n.d. | n.d. | n.d. |
| L105A | middle layer | ++ | ++ | macramé1 | ++ | – |
| L106A | middle layer | – | + | –1,2 | – | n.d. |
| W117A | middle layer | + | + | –1,2, striated3 | + | – |
| W117E | middle layer | – | + | –1,2 | – | n.d. |
| L118A | middle layer | + | ++ | –1, hexagonal2 | n.d. | n.d. |
| L118D | middle layer | – | – | –1,2 | – | n.d. |
| L132A | middle layer | + | + | –1, hexagonal2 | n.d. | n.d. |
| L132D | middle layer | +/– | + | –1,2 | – | n.d. |
| E120R | bottom layer | – | n.d. | n.d. | n.d. | n.d. |
| R121E | bottom layer | – | +* | n.d. | n.d. | n.d. |
| E120R,R121E | bottom layer | – | n.d. | n.d. | n.d. | n.d. |
| T130A | bottom layer | ++ | n.d. | n.d. | n.d. | n.d. |
-
1At 1 mg/mL in standard low salt buffer
-
2At >5 mg/mL in standard low salt buffer
-
3At >5 mg/mL in high salt buffer
-
*from previous study (Ganser-Pornillos et al., 2011)
-
n.d. – not determined
Additional files
-
Supplementary file 1
(A) Crystallization conditions for Bcc miniTRIM. (B) Average root mean square deviations over equivalent Cα atoms from superpositions of the miniTRIM monomer structures with 4TN3 (Goldstone et al., 2014).
- https://doi.org/10.7554/eLife.16309.023
Download links
A two-part list of links to download the article, or parts of the article, in various formats.
Downloads (link to download the article as PDF)
Open citations (links to open the citations from this article in various online reference manager services)
Cite this article (links to download the citations from this article in formats compatible with various reference manager tools)
Mechanism of B-box 2 domain-mediated higher-order assembly of the retroviral restriction factor TRIM5α
eLife 5:e16309.
https://doi.org/10.7554/eLife.16309


