Critical roles of mTOR Complex 1 and 2 for T follicular helper cell differentiation and germinal center responses
- Duke University Medical Center, United States
- Wenzhou Medical University, China
- University of Iowa, United States
- Duke Cancer Institute, Duke University Medical Center, United States
Figures
Figure 1

Critical role of mTOR for constitutive Tfh and GC responses.
We collected sera, mLNs, and PPs from 2–3-month-old Mtorf/fand Mtorf/f-Cd4Cre for analysis. (a) Representative dot-plots of CXCR5 and PD1 staining in gated CD4+TCRβ+ T-cells from mLNs and PPs. (b) Scatter plots represent mean ± SEM of Tfh percentages (left panel) and numbers (right panel). (c) Representative dot-plots show GL7 and Fas staining in gated CD93-B220+IgM-IgD- B cells from mLNs and PPs. (d) Scatter plots represent mean ± SEM of GC-B cell percentages (left panel) and numbers (right panel). (e) Relative serum IgM, IgG, and IgG subtypes (n ≥ 5) and fecal IgA (n = 19) levels measured by ELISA. Data represent or are calculated from at least five experiments (a–d) or two experiments (e). *p<0.05; **p<0.01; ***p<0.001 determined by unpaired two-tailed Student t-test.
Figure 2 with 1 supplement
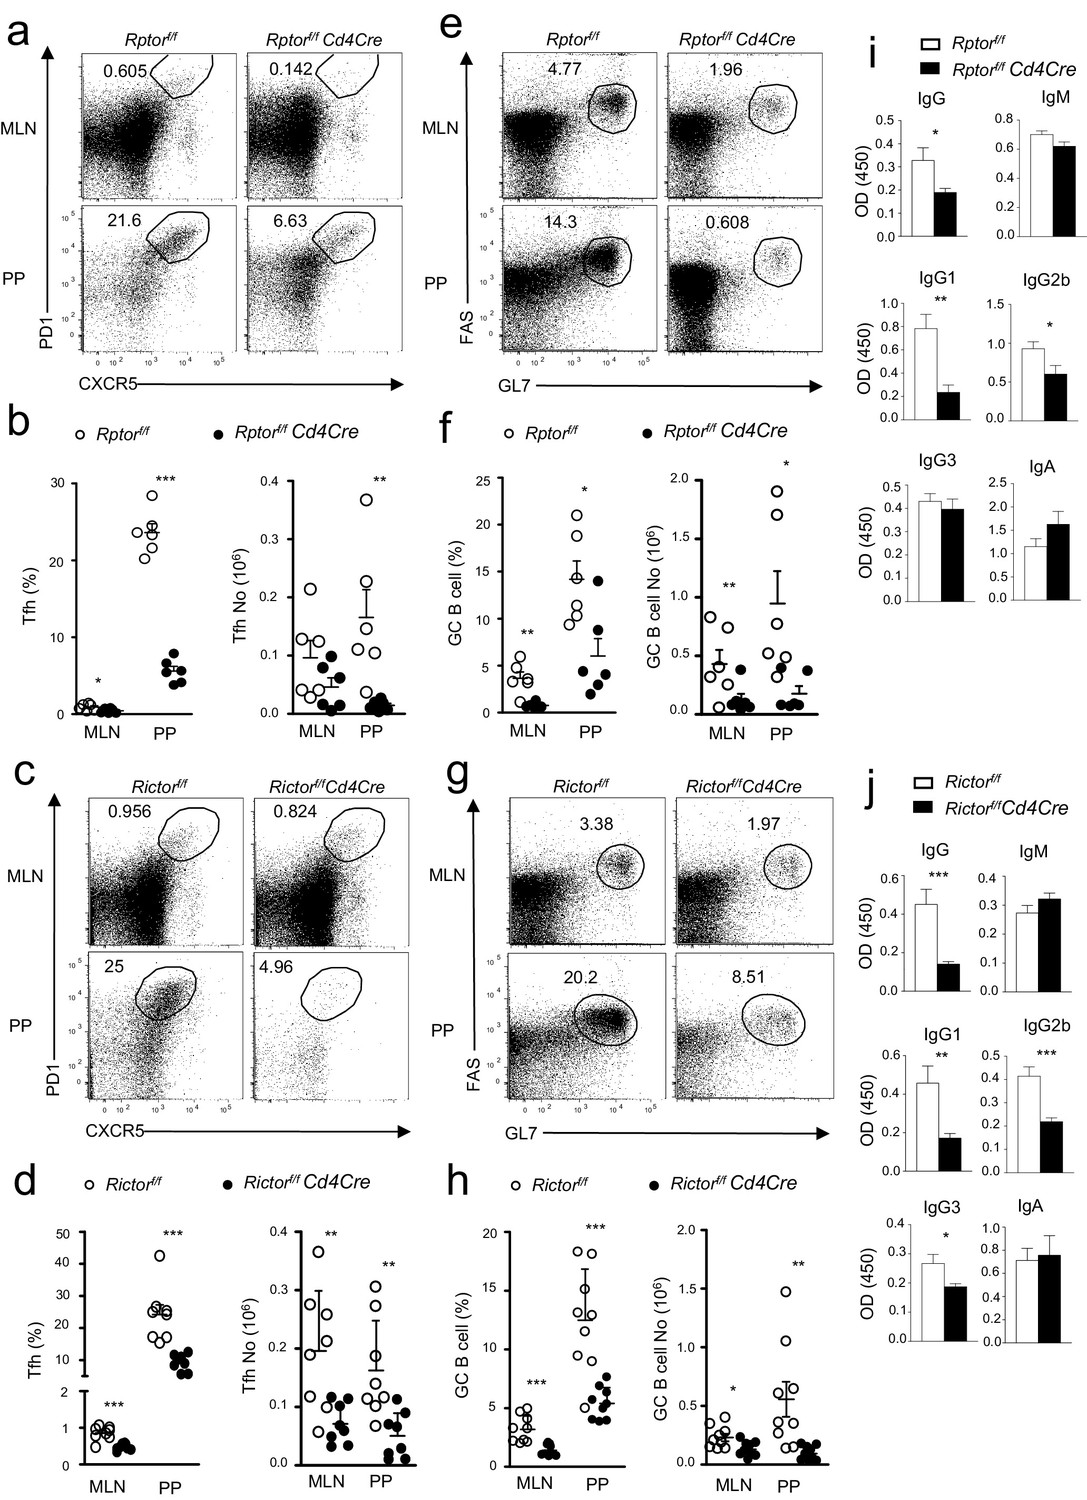
Contribution of mTORC1 and mTORC2 to the constitutive Tfh and GC B cell responses.
We assessed Rptorf/f-Cd4Cre, Rictorf/f-Cd4Cre, and their littermates control mice using the procedure in Figure 1. (a, c) Representative dot-plots showing frequencies of Tfh cells in gated mLN and PP CD4+TCRβ+ T-cells from Rptorf/f-Cd4Cre (a), Rictorf/f-Cd4Cre (c) and their control mice. (b, d) Scatter plots representing mean ± SEM of mLN and PP Tfh percentages (left panel) and numbers (right panel) in Rptorf/f-Cd4Cre (b), Rictorf/f-Cd4Cre (d) and their control mice. (e, g) Representative dot-plots showing frequencies of GC B-cells population in gated CD93-B220+IgM-IgD- B cells from mLNs and PPs of Rptorf/f-Cd4Cre (e), Rictorf/f-Cd4Cre (g) and their control mice. (f, h) Scatter plots representing mean ± SEM of GC-B cell percentages (left panel) and numbers (right panel) of Rptorf/f-Cd4Cre (f), Rictorf/f-Cd4Cre, (h) and their control mice. (i, j) Serum IgM, IgG, IgG subtypes, and fecal IgA levels from Rptorf/f-Cd4Cre (i, n = 7), Rictorf/f-Cd4Cre (j, n = 8), and their control mice measured by ELISA. Data shown represent or are calculated from at least five experiments (a–h) or two experiments (i, j). *p<0.05; **p<0.01; ***p<0.001 determined by two-tailed Student t-test.
Figure 2—figure supplement 1
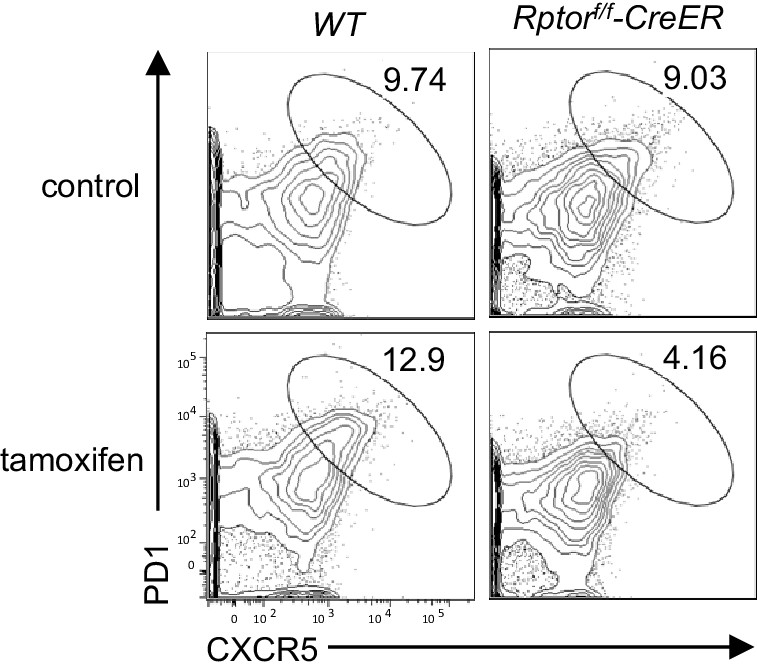
Deletion of Raptor in naïve CD4 T cells impaired constitutive Tfh differentiation.
Purified CD45.1+ WT or Rptorf/f-Rosa26CreER naïve CD4+ T cells without tamoxifen treatment were mixed with equal numbers and injected into Rag2-/- mice. Recipients were injected with tamoxifen on days 7, 8 and 11, and then were examined on day 14 after reconstitution. Representative contour plots show CXCR5 and PD1 expression on CD45.1+ WT and CD45.2+Rptorf/f-Rosa26CreER donor CD4 T cells in mLN of recipients that were either untreated or treated with tamoxifen. The data shown represent two experiments.
Figure 3
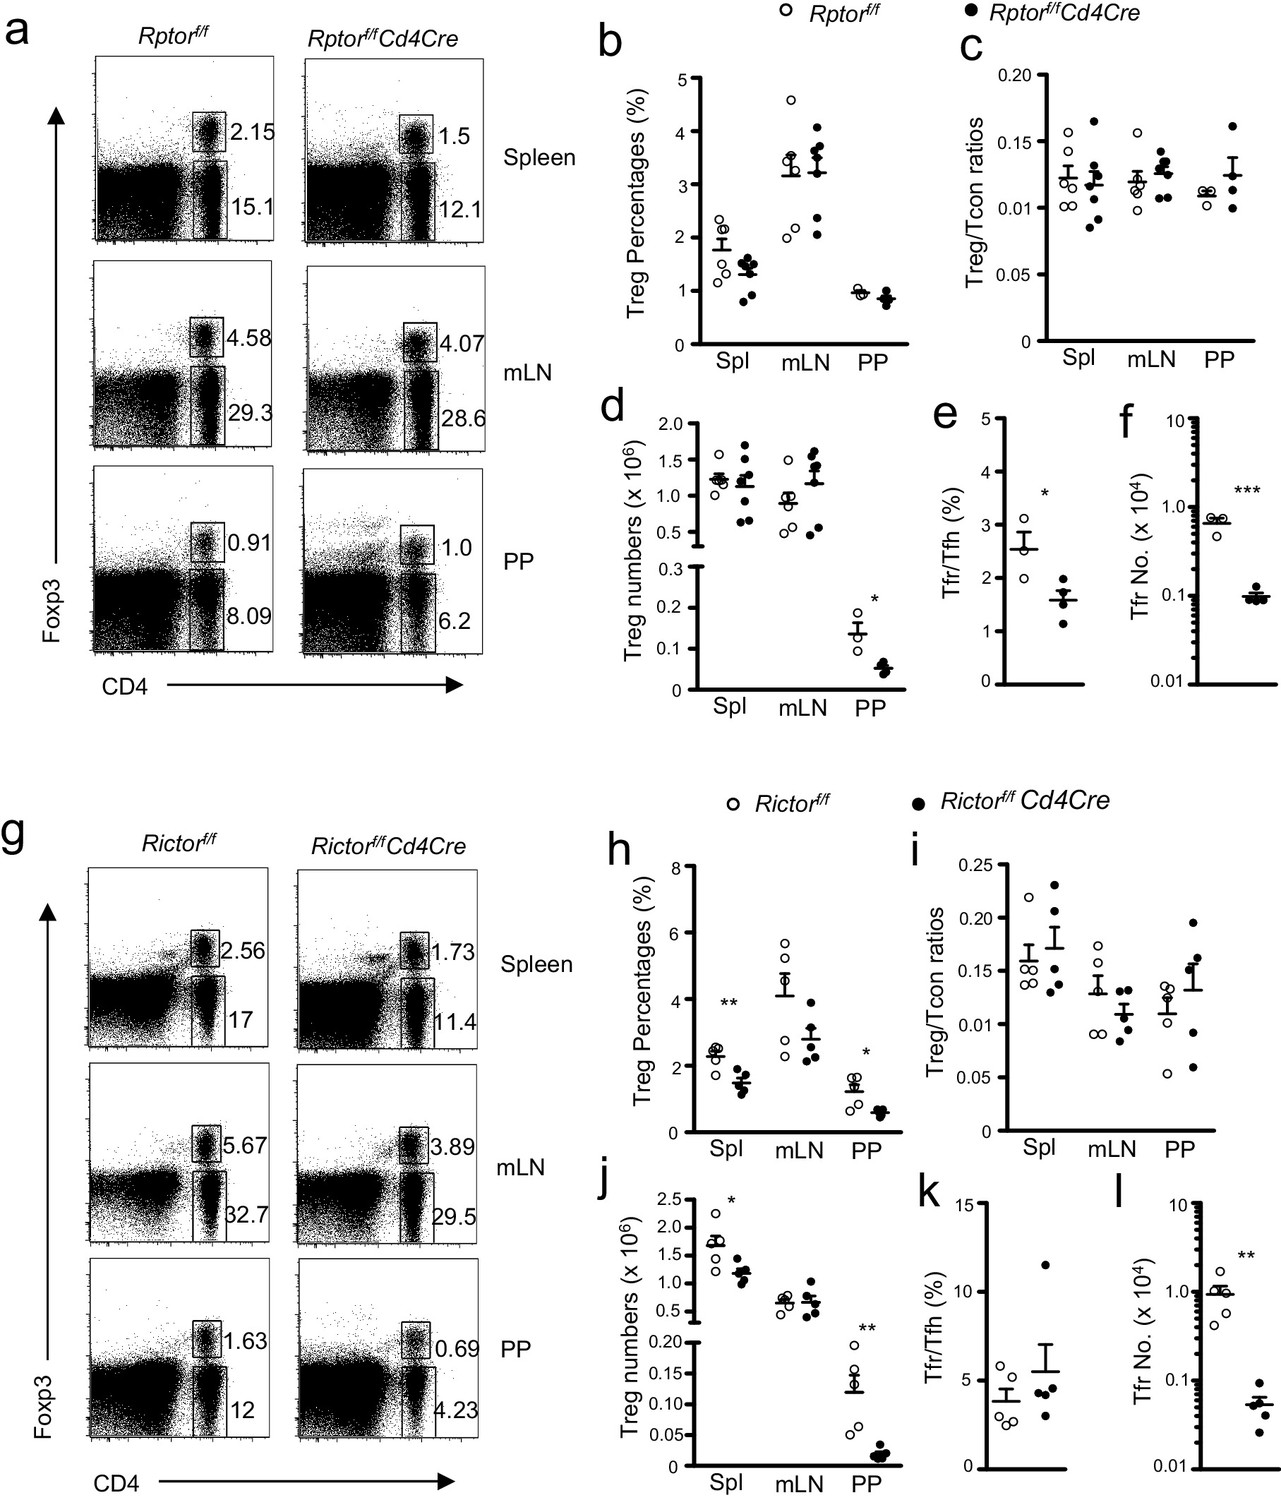
Effects of mTORC1 and mTORC2 deficiency on Tregs.
We assessed Rptorf/f-Cd4Cre (a–f), Rictorf/f-Cd4Cre (g–l), and their littermate control mice using the procedure in Figure 1 with the addition of intracellular Foxp3 staining. (a, g) Representative dot-plots showing Foxp3 and CD4 expression in lived gated splenocytes, mLN cells, and CD45+ PP cells from Rptorf/f-Cd4Cre (a), Rictorf/f-Cd4Cre (g) and their control mice. (b, h) Scatter plots representing mean ± SEM of Treg percentages in Rptorf/f-Cd4Cre (b), Rictorf/f-Cd4Cre (h) and their control mice. (c, i) Scatter plots representing mean ± SEM of Treg/Tcon ratios in Rptorf/f-Cd4Cre (c), Rictorf/f-Cd4Cre (i) and their control mice. (d, j) Scatter plots representing mean ± SEM of Treg numbers in Rptorf/f-Cd4Cre (d), Rictorf/f-Cd4Cre (j) and their control mice. (e, k) Scatter plots representing mean ± SEM of Foxp3+ Tfr percentages within total Tregs in PPs in Rptorf/f-Cd4Cre (e), Rictorf/f-Cd4Cre (k) and their control mice. (f, l) Scatter plots representing mean ± SEM of Foxp3+ Tfr numbers within total Tregs in PPs in Rptorf/f-Cd4Cre (f), Rictorf/f-Cd4Cre (l) and their control mice. Data shown represent or are calculated from at least three experiments. *p<0.05; **p<0.01; ***p<0.001 determined by two-tailed Student t-test.
Figure 4
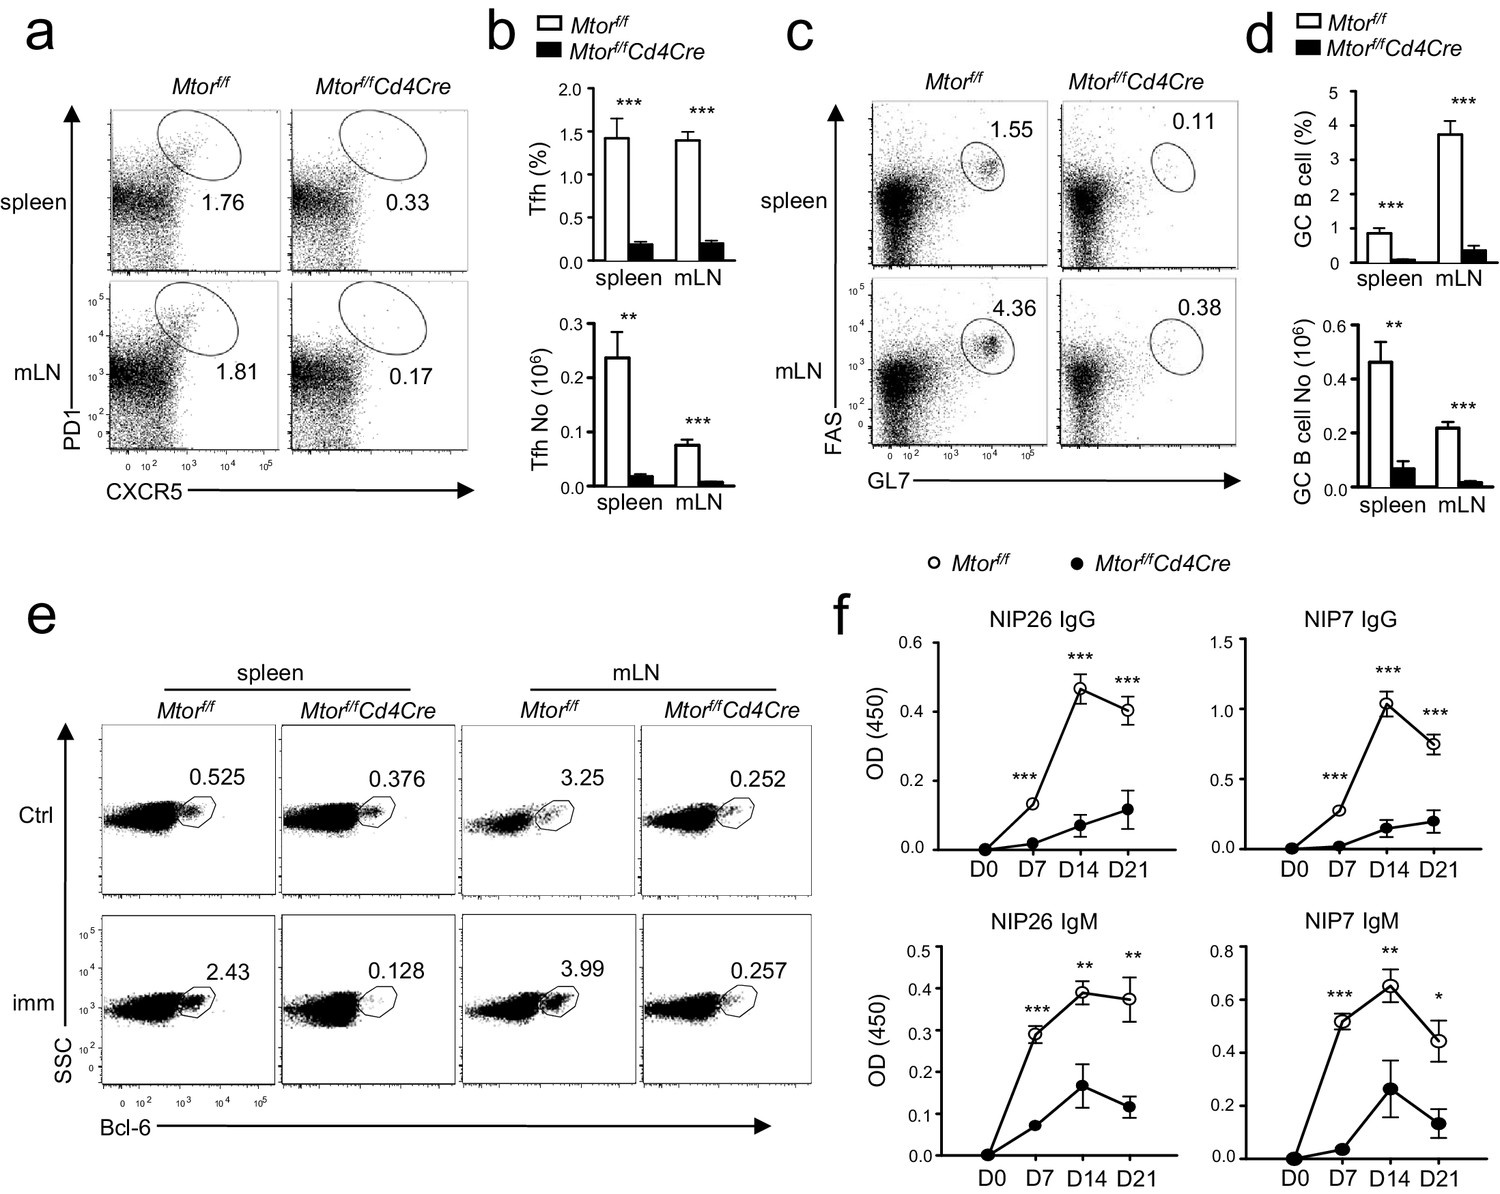
Deficiency of mTOR impaired inducible Tfh and GC B-cell responses following immunization.
We injected Mtorf/fand Mtorf/f-Cd4Cre mice intraperitoneally (i.p.) with NP17-CGG absorbed to alum. We collected sera the day before immunization and 7, 14, and 21 days after immunization, harvesting spleens and mLNs for analysis on day 21 after immunization. (a) Representative dot-plots showing CXCR5 and PD1 staining in gated splenic and mLN CD4+TCRβ+ T cells. (b) Bar graphs show mean ± SEM of Tfh percentages (top panel) and absolute numbers (bottom panel; WT, n = 9; KO, n = 7). (c) Representative dot-plots showing Fas and GL7 staining in gated B220+CD93-IgM-IgD- B cells. (d) Bar graphs represent mean ± SEM of GC-B cell percentages (top panel) and absolute numbers (bottom panel; WT, n = 9; KO, n = 7). (e) Dot-plots show Bcl-6 expression in gated B220+CD93-IgM-IgD- B cells from unimmunized mice or mice 21 days after immunization. (f) Serum NIP-specific IgG and IgM levels on indicated days after immunization detected by ELISA with NIP7- or NIP26-BSA coated plates (WT, n = 7; KO, n = 4). Data shown represent three (f) or are calculated from three (a–e) experiments. *p<0.05; **p<0.01; ***p<0.001 determined by two-tailed unpaired Student t-test.
Figure 5

Contribution of mTORC1 and mTORC2 to inducible Tfh and GC B-cell responses.
As in Figure 4, we immunized and examined Rptorf/f-Cd4Cre, Rictorf/f-Cd4Cre and their control mice with NP17-CGG absorbed to alum. (a, c) Representative dot-plots showing PD1 and CXCR5 staining in gated splenic CD4+ TCRβ+ T cells from Rptorf/f-Cd4Cre (a), Rictorf/f-Cd4Cre (c) and their control mice. (b, d) Percentages and absolute numbers of splenic Tfh cells in Rptorf/f-Cd4Cre (b), Rictorf/f-Cd4Cre (d) and their control mice 21 days after immunization. (e, g) Representative dot-plots showing GL7 and Fas staining in gated splenic B220+CD93-IgM-IgD- B cells from Rptorf/f-Cd4Cre (e), Rictorf/f-Cd4Cre (g), and their control mice. (f, h) Percentages and absolute numbers of splenic GC B cells in Rptorf/f-Cd4Cre (f), Rictorf/f-Cd4Cre (h), and their control mice 21 days after immunization. (i, j) Relative serum NIP-specific IgG and IgM levels from Rptorf/f-Cd4Cre (i; n = 6) and Rictorf/f-Cd4Cre (j; n = 9) indicated days after immunization detected by ELISA with NIP7- or NIP26-BSA coated plates. (k, l) Impaired GC formation in Rictor-deficient mice. 14 days after immunization, we stained spleen thin sections from Rictorf/f-Cd4Cre and Rictorf/f mice with PNA, B220, and Thy1.2. Representative immunofluorescence images are shown (k; 50x and 200 x). Scatter plots depict mean ± SEM of GC numbers per view (l. left; 8 total views for WT and 10 views for KO) and sizes of the PNC+Thy1.2- GCs (l. right). Data shown represent or are calculated from three experiments. *p<0.05; **p<0.01; ***p<0.001 determined by two-tailed unpaired Student t-test.
Figure 6 with 1 supplement
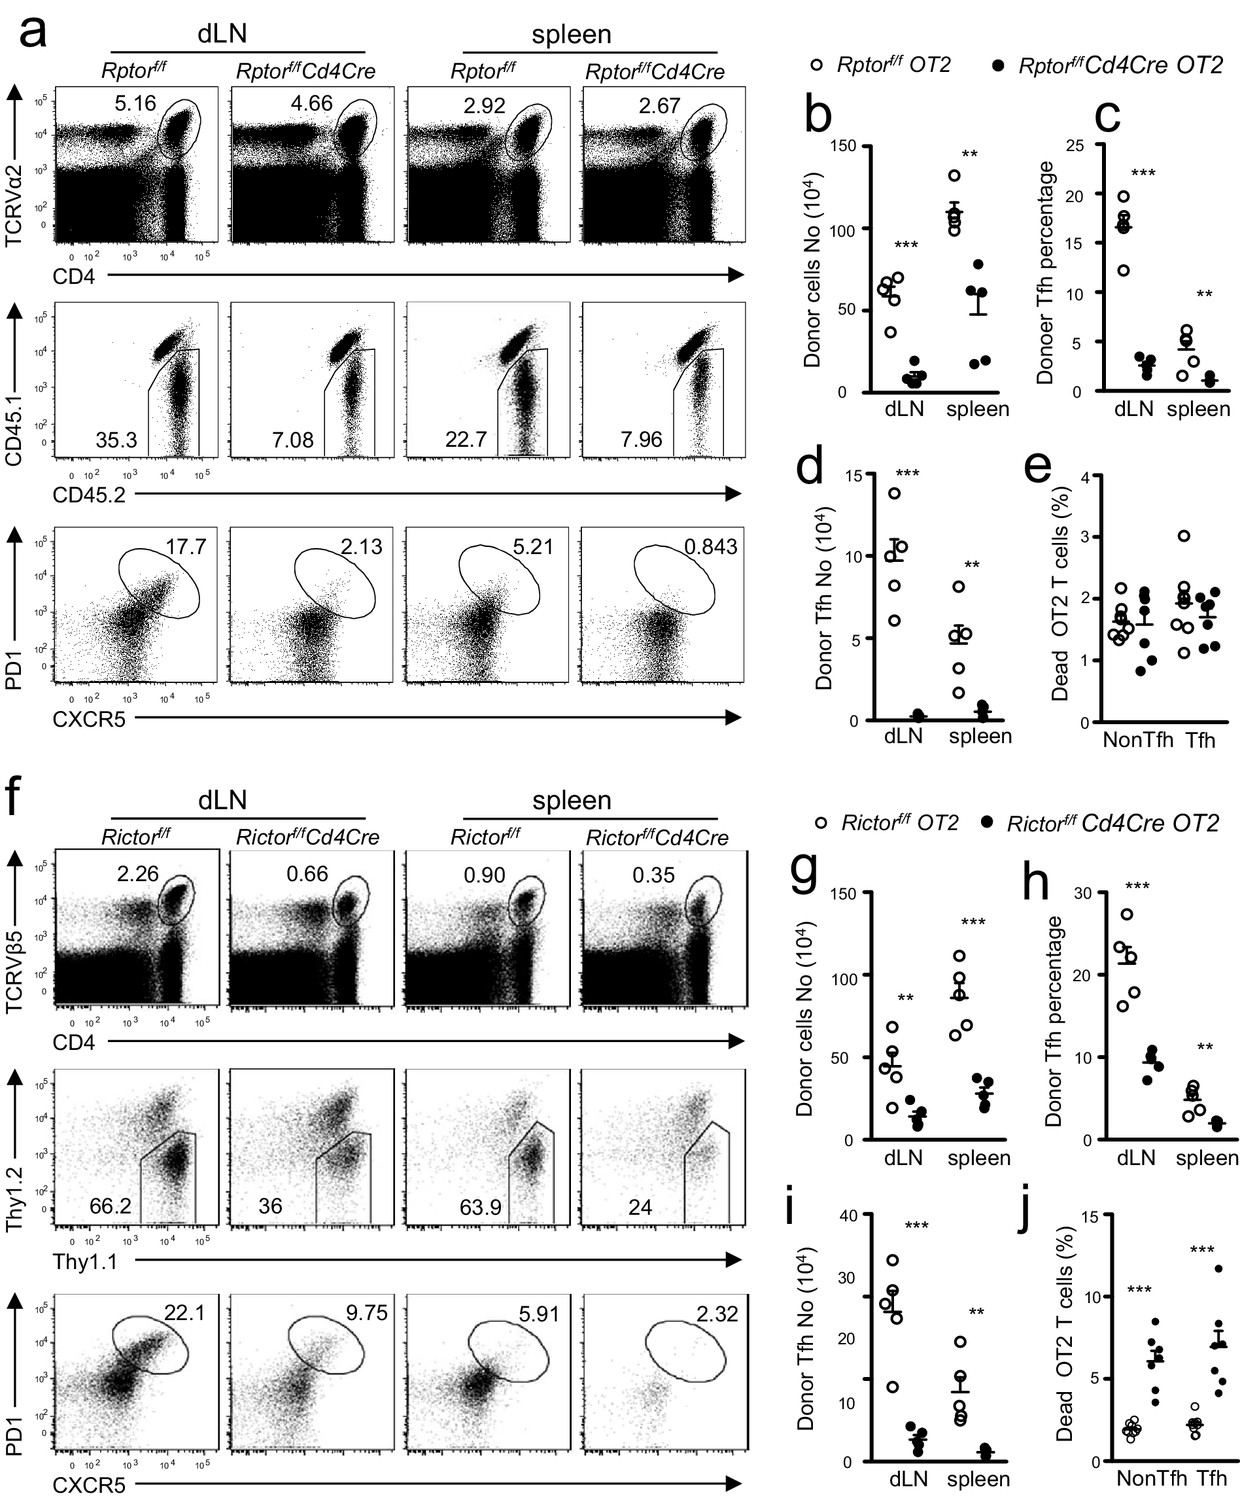
T cell intrinsic control of Tfh differentiation by mTORC1 and mTORC2.
We injected CD45.1+CD45.2+ congenic mice iv with 1.5 × 10⁶ CD45.2+CD4+TCRVα2+ naïve OT2 T cells from Rptorf/f-Cd4Cre-OT2 (a–e) or Rictorf/f-Cd4Cre-OT2 (f–j) and control mice on day -1 and immunized them with OVA323-339 peptide in CFA on day 0. We harvested dLNs and spleens on day 7 post immunization. (a, f) Representative dot plots of dLN cells and splenocytes. Top panels: CD4 and TCRVα2 staining. Middle panels: donor-derived CD45.1-CD45.2+ OT2 cells in the gated CD4+TCRVα2+ population. Bottom panels: donor-derived Tfh cells in gated donor OT2 cells. (b, g) Scatter plot shows absolute number of donor-derived Rptorf/f-Cd4Cre OT2 cells (b) and Rictorf/f-Cd4Cre OT2 cells (g). (c, h) Scatter plot shows Tfh percentages within donor-derived Rptorf/f-Cd4Cre OT2 cells (c) and Rictorf/f-Cd4Cre OT2 cells (h). (d, i) Scatter plot shows total Tfh cell numbers derived from Rptorf/f-Cd4Cre OT2 (d) and Rictorf/f-Cd4Cre OT2 cells (i). (e, j) Scatter plot shows death rates of donor-derived OT2 T cells. Cell death was determined by staining with Live/Dead fixable violet dead cell stain. Data shown represent or are calculated from two experiments. **p<0.01; ***p<0.001 determined by two-tailed unpaired Student t-test.
Figure 6—figure supplement 1
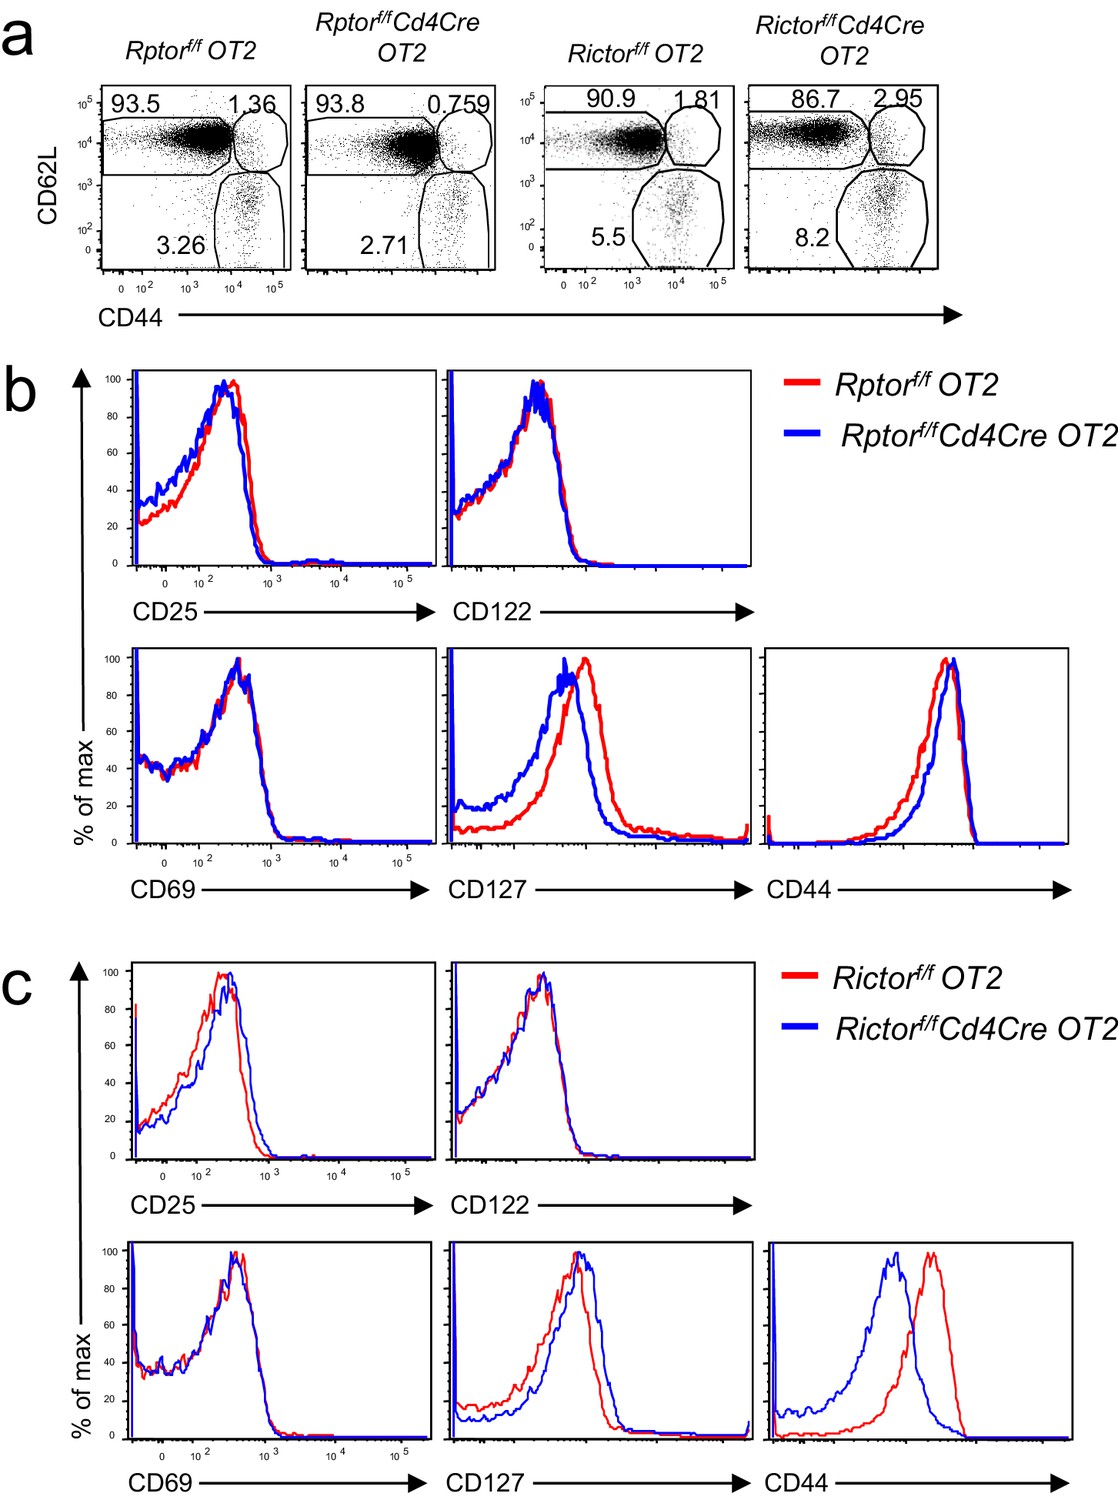
Phenotypic analysis of Rptorf/f- or Rictorf/f-Cd4Cre OT2 T cells.
(a) CD44/CD62L staining of gated CD4+TCRVα2+ cells from Rptorf/f-Cd4Cre-OT2 mice or Rictorf/f- Cd4Cre-OT2, and their control mice. (b, c) Expression of indicated molecules in gated naïve CD44−CD62L+CD4+TCRVα2+ OT2 cells from Rptorf/f-Cd4Cre OT2 mice (b) or Rictorf/f- CD4Cre OT2 mice (c). Data shown represent two experiments.
Figure 7 with 1 supplement
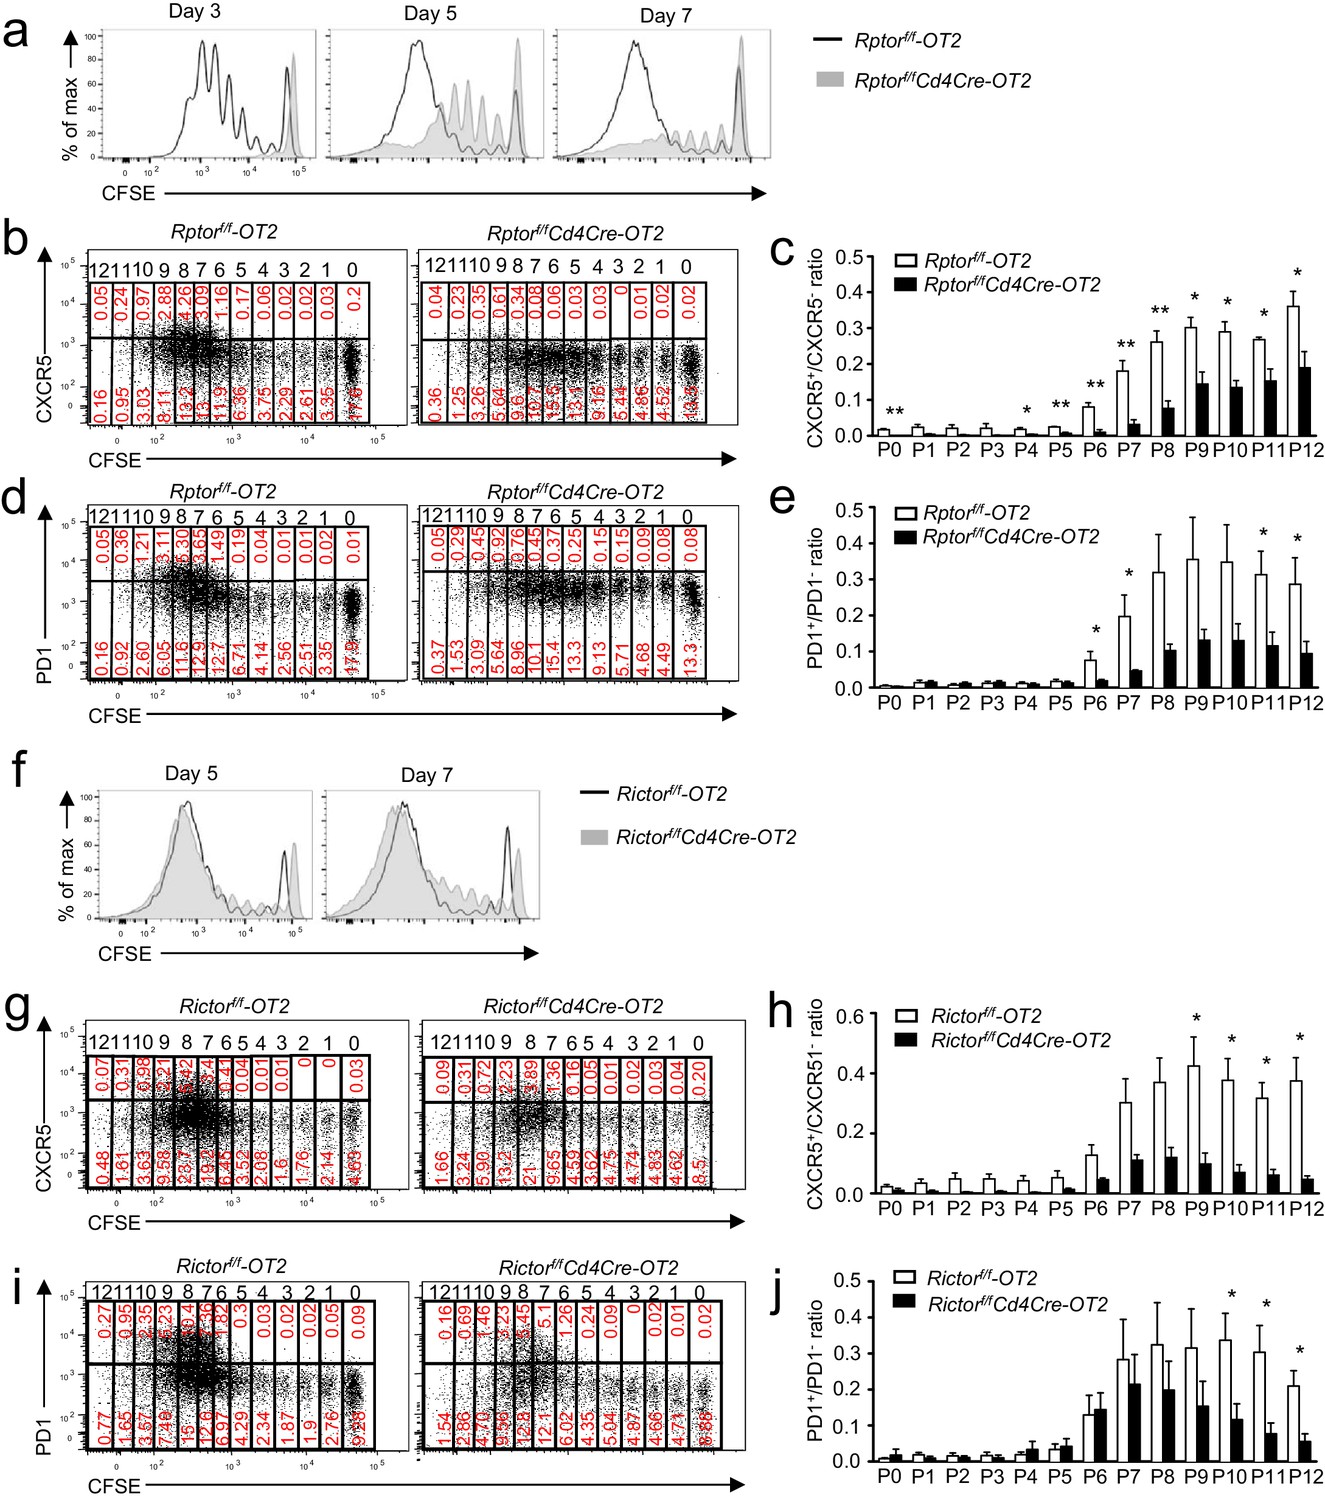
Effects of mTORC1 and mTORC2 deficiency on proliferation-associated Tfh differentiation.
We injected CD45.1+CD45.2+ congenic mice iv with 1.5 × 10⁶ CD45.2+Vα2+CD4+ WT, Rptorf/f-Cd4Cre (a–e), or Rictorf/f-Cd4Cre (f–j) naïve OT2 T cells on day -1 and immunized them with OVA323-339 peptide in CFA on day 0, harvesting dLNs on indicated days after immunization. (a) Overlaid histograms showing CFSE intensity in CD45.1-CD45.2+CD4+TCRVα2+ donor-derived WT and Rptor-deficient OT2 T cells 3, 5, and 7 days after immunization. (b, d) Representative dot plots of CXCR5 (b) and PD1 (d) staining and CFSE intensity in donor-derived WT and Rptor-deficient OT2 cells from dLNs on day 7 after immunization. (c, e) Bar graphs represent mean ± SEM of CXCR5+/CXCR5- ratios (c, WT, n = 3; KO, n = 3) and PD1+/PD1- ratios (e, WT, n = 4; KO, n = 4) in individual cell divisions of donor-derived WT and Rptor-deficient OT2 T cells. (f) Overlaid histograms showing CFSE intensity in CD45.1-CD45.2+CD4+TCRVα2+ donor-derived WT and Rictor-deficient OT2 T cells 5 and 7 days after immunization. (g, i) Representative dot plots of CXCR5 (g) and PD1 (i) staining and CFSE intensity in donor-derived WT and Rictor-deficient OT2 cells from dLNs on day 7 after immunization. (h, j) Bar graphs represent mean ± SEM of CXCR5+/CXCR5- ratios (h, WT, n = 4; KO, n = 3) and PD1+/PD1- ratios (j, WT, n = 5; KO, n = 4) in individual cell divisions of donor-derived WT and Rictor-deficient OT2 T cells. Data shown represent or are calculated from three independent experiments. *p<0.05; **p<0.01 (Student’s t test).
Figure 7—figure supplement 1
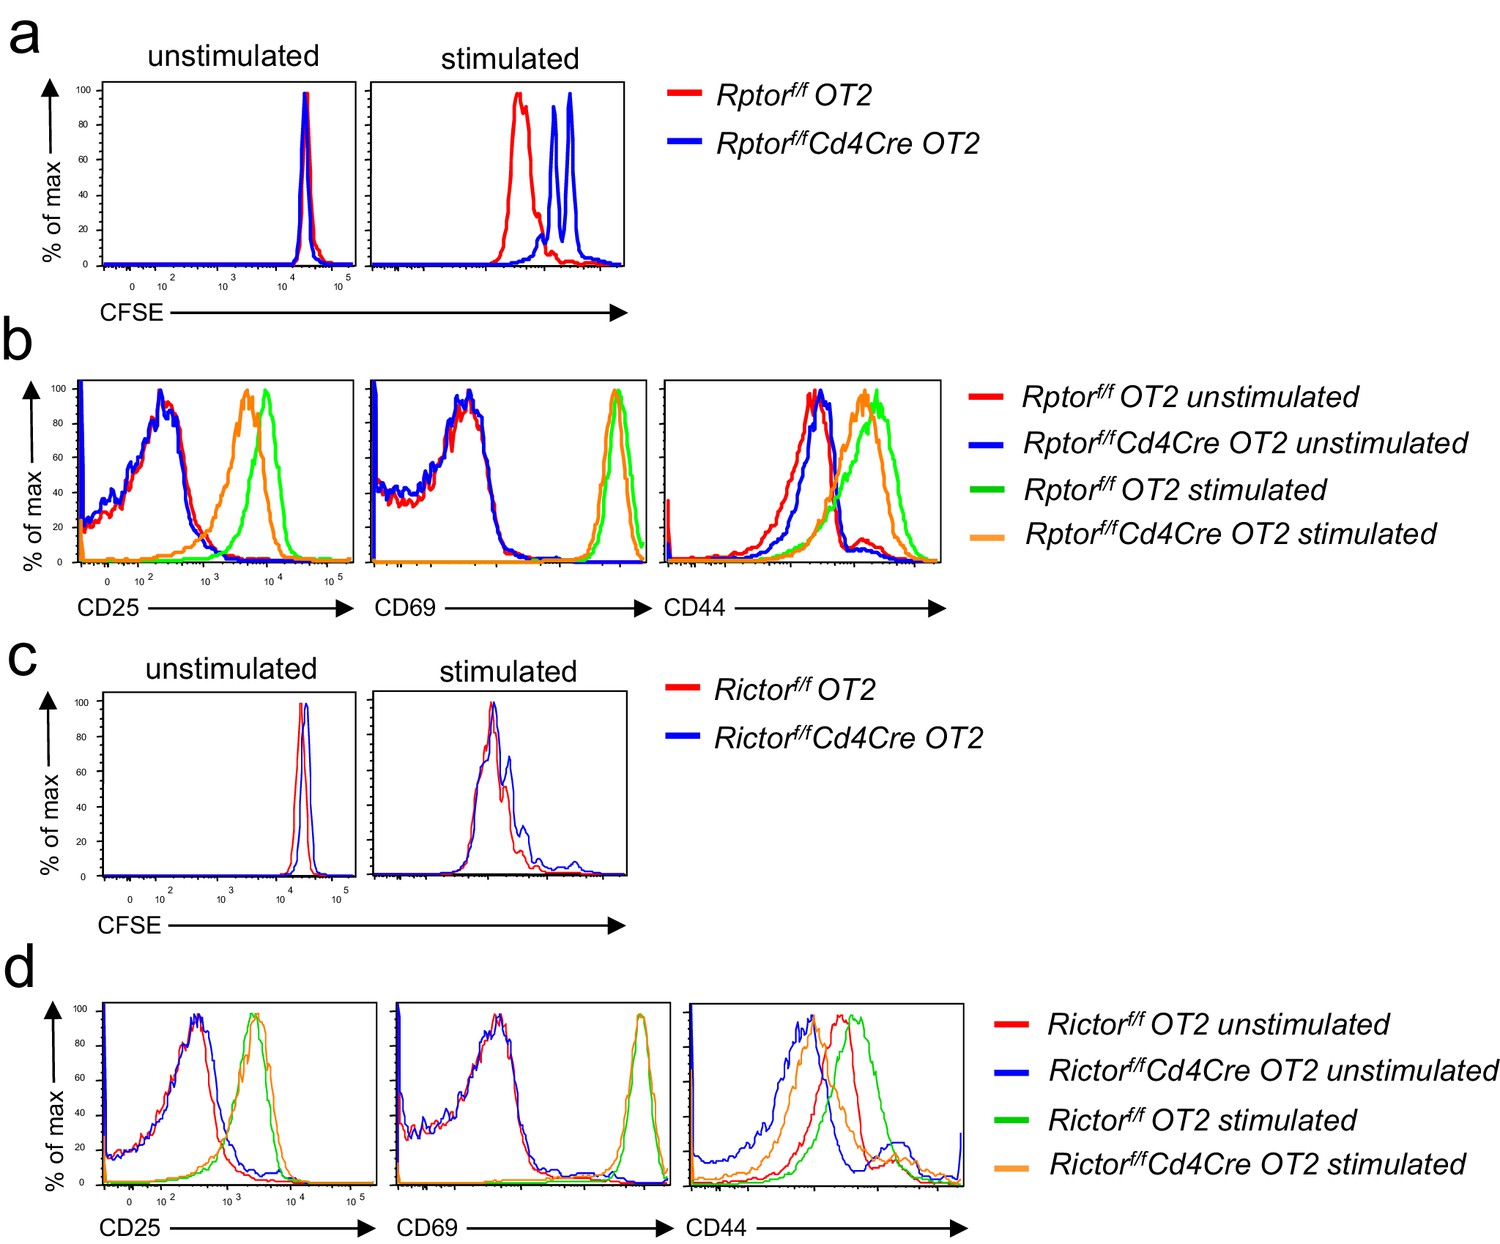
Effects of mTORC1 and mTORC2 deficiency on antigen-induced T cell activation in vitro.
Splenocytes from Rptorf/f-Cd4Cre-OT2, Rictorf/f- Cd4Cre-OT2, and their respective control mice were either labeled (a, c) or not labeled (b, d) with CFSE. They were left unstimulated or stimulated with OVA323-339 peptide for 3 days (CFSE-labeled cells) or overnight (unlabeled cells). (a, c) Overlaid histograms showing CFSE dilution of gated Rptor-deficient (a) or Rictor-deficient (c) CD4+TCRVα2+ cells. (b, d) Overlaid histograms showing CD25, CD69, and CD44 expression in gated Rptor-deficient (b) or Rictor-deficient (d) CD4+TCRVα2+ OT2 T cells after overnight incubation. Data shown represent three experiments.
Figure 8 with 1 supplement
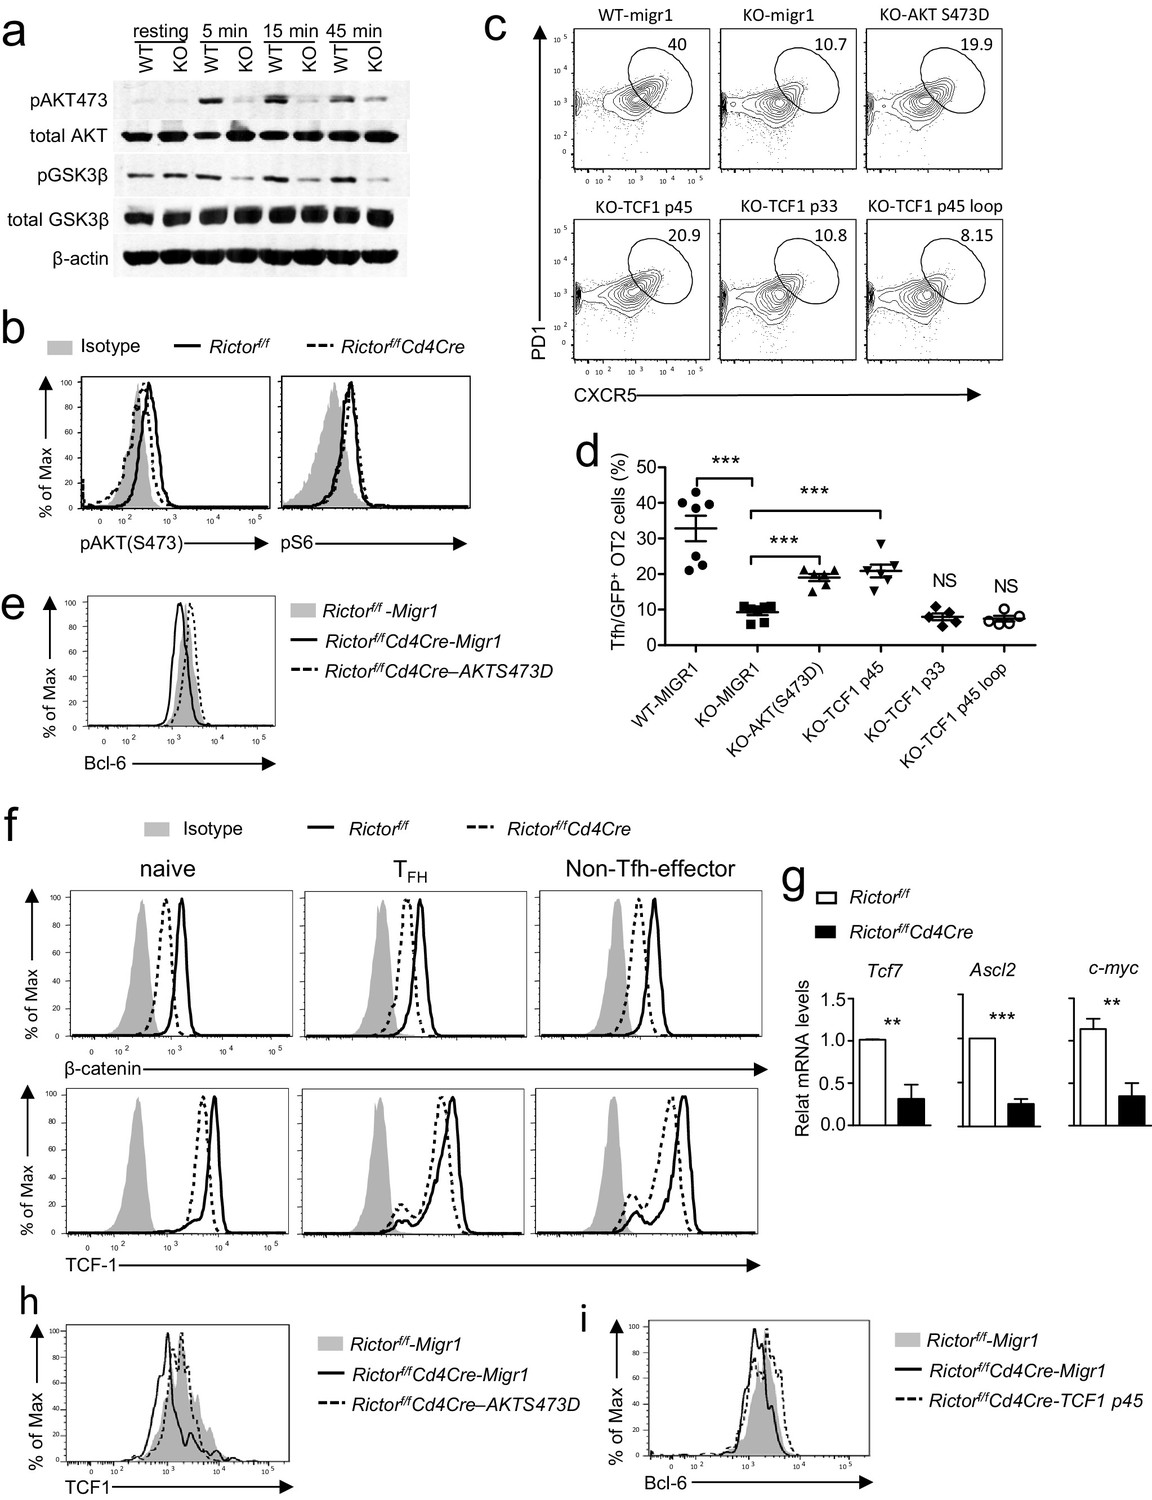
mTORC2 controls AKT and TCF1 to promote Tfh differentiation.
(a) We rested WT and Rictorf/f-Cd4Cre CD4 T cells in PBS for 30 min, then simulated them with an anti-CD3ε antibody (500 A2) for the indicated times. We subjected cell lysates to immunoblotting analysis with the indicated antibodies. (b) We stimulated WT and Rictorf/f-Cd4Cre naive CD4+ T cells with plate-bound anti-CD3 and anti-CD28 for 24 hr. We used intracellular staining and FACS analysis to determine Akt S473 and S6 phosphorylatio. (c–e). WT or Rictorf/f-Cd4Cre OT2 T cells were transduced with retrovirus expressing AKT S473D, TCF1p45, TCF1p33, and TCF1p45Loop34 plus GFP or GFP alone (Migr1) 48 hr after stimulating them with anti-CD3 and anti-CD28. Twenty-four hours after transduction, we intravenously injected cells injected into congenic C57B6/J mice immunized with OVA323-339 peptide in CFA about 18 hr after transfer and analyzed them 7 days after immunization. (c) Representative contour plots showing CXCR5 and PD1 expression in live-gated GFP+CD4+CD8-TCRVα2+Vβ5+B220-CD11b-Gr1- donor-derived OT2 T cells. (d) Scatter plots representing mean ± SEM of CXCR5+PD1+ cells within GFP+ donor OT2 cells. (e) Overlaid histograms showing Bcl-6 levels in GFP+OT2 T cells 48 hr after transduction. (f) Overlaid histograms showing intracellular β-catenin and TCF1 staining in gated Tfh (CD4+CXCR5+PD1+), naïve (CD4+CD44-), and non-Tfh effector (CD4+CD44+CXCR5-PD1-) from mLNs in WT and Rictorf/f-Cd4Cre mice. (g) Relative mRNA levels of indicated molecules in Tfh cells sorted from PPs and mLNs from WT and Rictorf/f-Cd4Cre mice. (h) Overlaid histograms showing TCF1 levels in GFP+OT2 T cells 48 hr after transduction with retrovirus expressing AKT S473D or GFP. (i) Overlaid histograms showing Bcl6 levels in GFP+OT2 T cells 48 hr after transduction with retrovirus expressing TCF1 p45 or GFP. Data shown are representative of three (a–f, h, i) or calculated from five (g) independent experiments. **p<0.01; ***p<0.001 (Student’s t test).
Figure 8—figure supplement 1
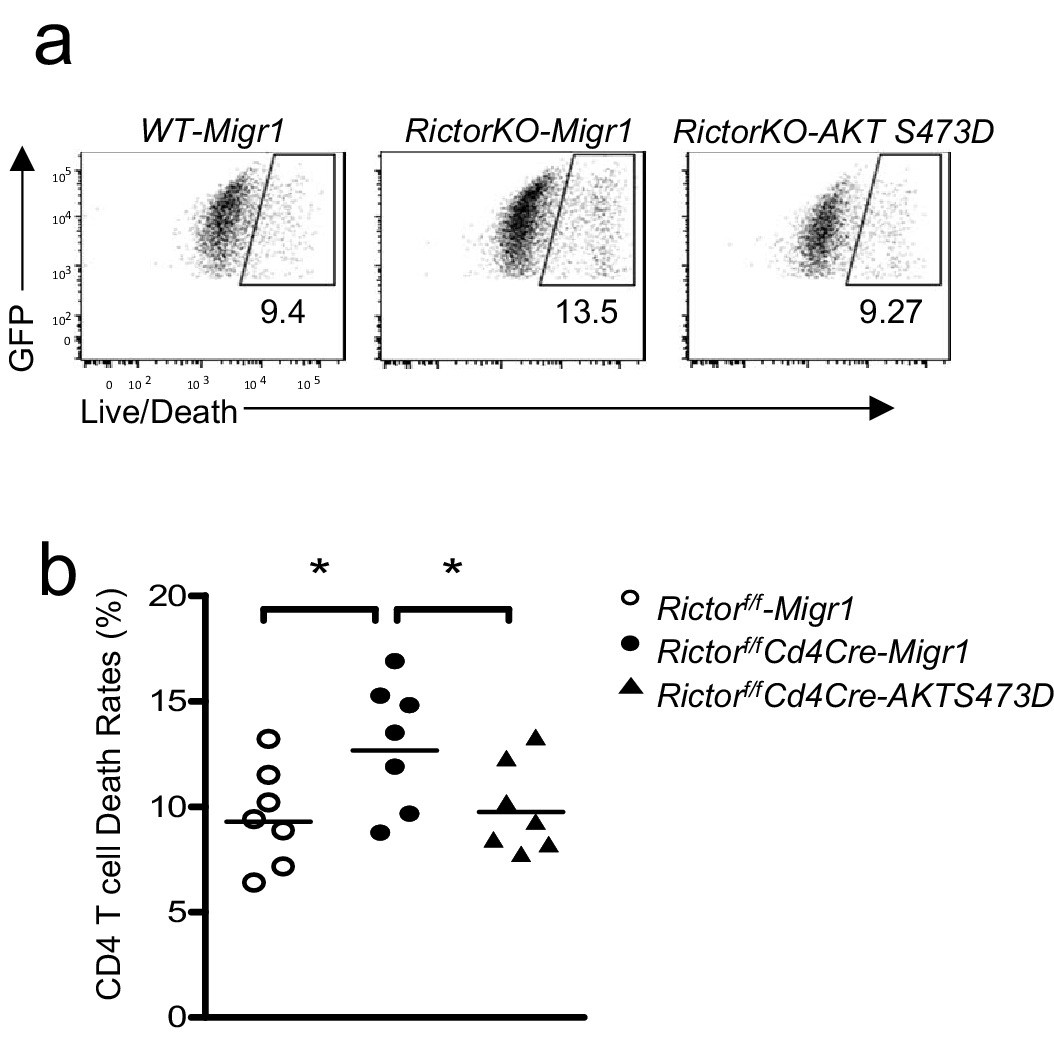
Expression of Akt S473D improved survival of Rictor deficient CD4 T cells.
WT or Rictorf/f-Cd4Cre T cells were transduced with retrovirus expressing AKT S473D plus GFP or GFP alone (Migr1) 36–48 hr after stimulated with an anti-CD3 and anti-CD28 antibodies. Then, 48 hr after transduction, cells were stained and examined for survival. (a) Representative dot plots show Live/Death staining of gated GFP+ CD4+ T cells. (b) Scatter plot represents mean ± SEM of death rates of GFP+CD4+ T cells. Data shown represent or are calculated from four experiments. *p<0.05 (Student’s t test).
Download links
A two-part list of links to download the article, or parts of the article, in various formats.
Downloads (link to download the article as PDF)
Open citations (links to open the citations from this article in various online reference manager services)
Cite this article (links to download the citations from this article in formats compatible with various reference manager tools)
Critical roles of mTOR Complex 1 and 2 for T follicular helper cell differentiation and germinal center responses
eLife 5:e17936.
https://doi.org/10.7554/eLife.17936


