Nuclear pore assembly proceeds by an inside-out extrusion of the nuclear envelope
- European Molecular Biology Laboratory, Germany
Figures
Figure 1 with 3 supplements

Interphase assembly intermediates of nuclear pore complexes (NPCs).
(A) Correlative live-cell imaging with electron microscopy (EM). Cell-cycle progression of HeLa cells was monitored by confocal microscopy and the same cell was subjected to electron tomography. Tomograms were collected from different regions of the nuclear envelope (NE). Inferred non-core, inner-core and outer-core regions are indicated in light blue, light green and dark green, respectively. C, cytoplasm; N, nucleoplasm. Scale bar, 1 µm. (B) An electron tomographic slice of the NE. An assembly intermediate and a mature pore are indicated by a red arrow and a blue arrowhead, respectively. Insets show enlarged images in which membranes are traced by white dotted lines. ONM, outer nuclear membrane; INM, inner nuclear membrane. Scale bars, 100 nm. (C,D) Immuno-EM with mAb414 antibody and 10 nm-gold particles. (C) The profile of the NE and the positions of gold particles are denoted in the bottom panel. A mature pore and an intermediate are indicated as in (B). Scale bar, 100 nm. (D) The number of gold particles per assembly intermediate (‘observed’) and the one calculated assuming a random distribution of the particles (‘if random’). 31 particles were found on 13 intermediates, whereas the random distribution estimated 1.6 particles to be on 13 intermediates. The p-value (probability that the distribution is due to chance alone) <10–100; a chi-square goodness of fit test. (E) Cryo-EM tomographic slices of isolated NEs of HeLa cells. A mature pore and an intermediate are indicated as in (B). Other examples of intermediates are also indicated. Scale bars, 100 nm.
Figure 1—figure supplement 1
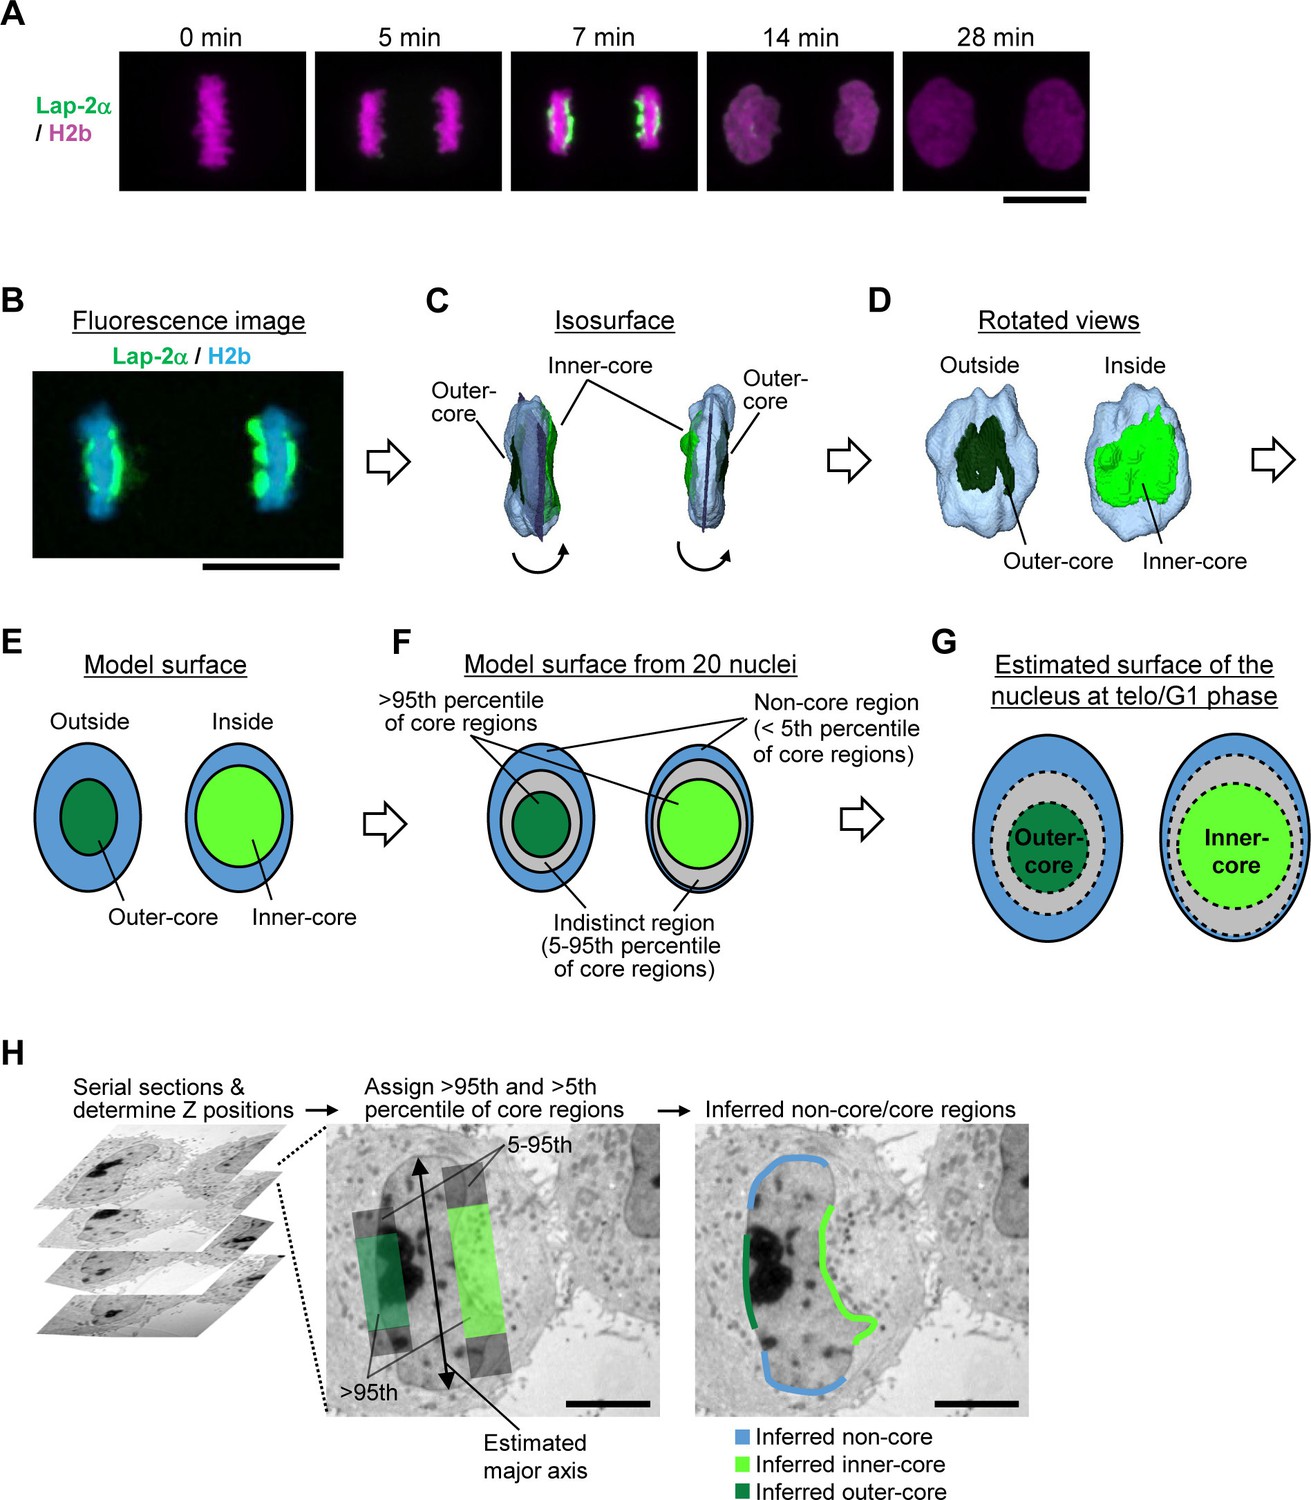
Estimation of core regions.
(A,B) Time-lapse three-dimensional (3D) imaging of dividing HeLa cells which express Lap-2α-YFP and histone-H2b-mCherry by confocal microscopy. Scale bars, 10 µm. (A) Maximum intensity projection images. Time after anaphase onset is indicated. Lap-2α localizes in core regions only at late anaphase. (B) A single confocal section of another dividing cell at late anaphase. (C–G) A pipeline for estimating core regions after late anaphase. (C) The entire surface of the chromosomes was segmented and the areas where Lap-2α localizes are marked in dark and light green. (D) The segmented chromosomes were rotated as indicated by arrows in (C). (E) The nuclei and core regions were approximated by the ellipsoid. (F) The area of core regions was measured in 20 different nuclei. The regions above the 95th, between the 5th and 95th, and below the 5th percentile of being core regions are inferred to be core (dark and light green), indistinct (gray), and non-core regions (light blue), respectively. (G) The nucleus and core regions were estimated to grow isometrically after late anaphase. (H) Assignment of core regions in the electron microscopy (EM) image. Serial sections of plastic-embedded HeLa cells were cut and the Z position was determined for each section. The major axis of the nucleus was estimated and core and non-core regions were assigned based on the criteria defined in (B–G). Scale bars, 5 µm.
Figure 1—figure supplement 2

Live-cell and EM images of cells analyzed by EM tomography.
Cells cultured on carbon-patterned sapphire disks were imaged by confocal microscopy (upper panels). After high-pressure freezing, plastic-embedding, and serial sectioning, the same cells were observed in EM. EM images of one of the sections are shown (lower panels). Time after anaphase onset is indicated. The contrast of some of the live-cell images are enhanced by average intensity projection of a series of several images for presentation purposes. The sizes of live-cell and EM images are 58 × 58 µm and 20 × 20 µm, respectively.
Figure 1—figure supplement 3

Galleries of interphase NPC assembly intermediates.
(A) Other images of immuno-EM in Figure 1C. Assembly intermediates are indicated by white arrows. The profile of the nuclear envelope (NE) and the positions of gold particles in one EM image are denoted in a box. C, cytoplasm; N, nucleoplasm; ONM, outer nuclear membrane; INM, inner nuclear membrane. Scale bars, 100 nm. (B) Electron tomographic slices of mature pores and assembly intermediates of U2OS (upper panels) and NRK (lower panels) cells. Assembly intermediates are indicated by white arrows. The intermediates were found in both G1 staged and fully grown nuclei. Scale bars, 100 nm.
Figure 2

Quantitative structural comparison of assembly intermediates.
(A) Electron tomographic slices of assembly intermediates in cells captured at 53, 28, and 19 min after anaphase onset (AO) and ONM/INM fusion events. Profiles of ONM (gray) and INM (blue) in black and white boxes on EM images are depicted in the right panels. For the fusion, ONM is also depicted in blue. The image marked with a white asterisk was acquired on a differently embedded sample for enhancing membrane contrast (see Materials and methods). Scale bar, 100 nm. (B) Membrane profiles of all the fusion events and intermediates at selected time points (53, 28, and 19 min). The bold lines indicate the averaged profiles. (C–F) Quantification of the evagination depth of INM (C,E) and the diameter of intermediates (D,F) as indicated by red bidirectional arrows in the left panels. (C,D) The plots are from 47, 44, and 39 intermediates at 19, 28, and 53 min, respectively, 5 ONM/INM fusions, and 45 mature pores. The ONM/INM distance was quantified near mature pores (C). The median is depicted as a horizontal line and the whiskers show the 25th and 75th percentiles. *p<0.02, **p<0.001; unpaired t-tests. (E,F) The depth and the diameter of intermediates in non-core, inner-core, and outer-core regions were indicated in light blue, light green and dark green, respectively. The median is depicted as a horizontal line. No statistical difference of the intermediate shape was observed between different regions of the NE at each time point (p>0.1; unpaired t-tests).
-
Figure 2—source data 1
Depth and diameter values used for Figure 2C–F.
- https://doi.org/10.7554/eLife.19071.010
Figure 3 with 2 supplements
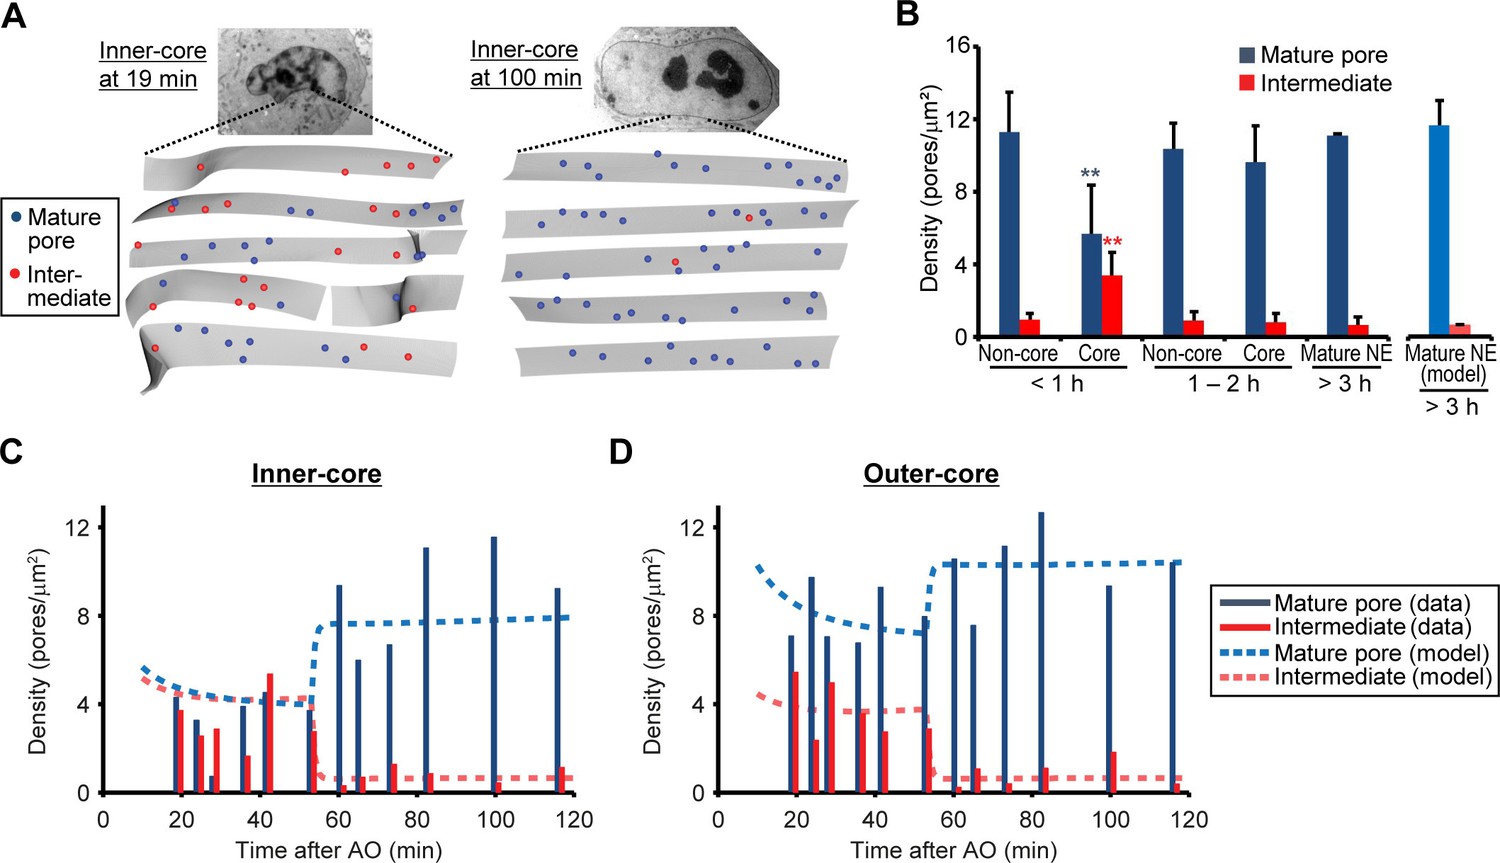
Abundance of mature pores and assembly intermediates at different cell-cycle stages.
(A) Measurement of nuclear pore density. Gray sheets are the NEs segmented from EM tomograms. Blue and red dots indicate the positions of mature pores and intermediates, respectively. Inner-core regions of cells at 19 and 100 min post anaphase are shown as examples. (B) Density of mature pores (dark blue) and intermediates (red) in non-core and core (inner- plus outer-core) regions of cells at different times. Error bars represent the s.d. from 6, 6, and 2 cells at <1, 1–2, and >3 hr post anaphase, respectively. **p<0.001; unpaired t-tests of the density difference of mature pores (blue) and intermediates (red) between core regions at <1 hr and the others. The modeled density of mature pores (light blue) and intermediates (light red) at >3 hr is also indicated (see Figure 3—figure supplement 1 and Materials and methods for details). (C,D) Density of mature pores and intermediates in inner- (C) and outer-core (D) regions of cells at different time points. 3–7 tomograms were obtained in each region at each time point (data are summarized in Table 1). Dashed lines indicate the modeled density of mature pores and intermediates.
-
Figure 3—source data 1
Density values used for Figure 3B–D.
- https://doi.org/10.7554/eLife.19071.012
-
Figure 3—figure supplement 2—source data 1
Surface area values used for Figure 3— figure supplement 2C.
- https://doi.org/10.7554/eLife.19071.013
Figure 3—figure supplement 1
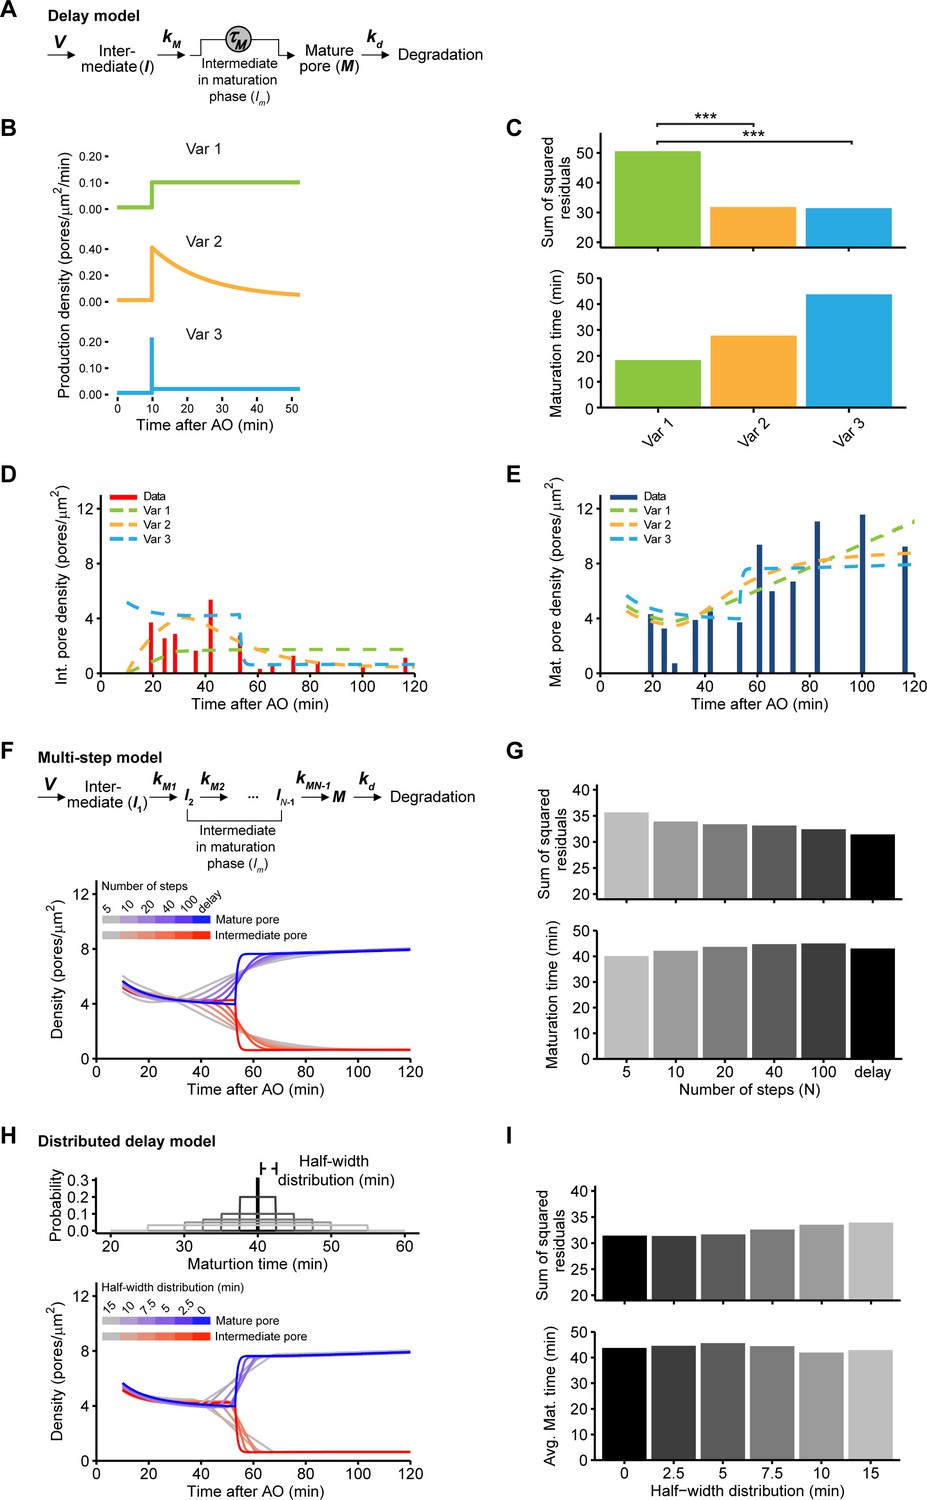
Modeling the density of nuclear pores.
(A) Reaction scheme of the delay equation model (Equations 1‒3). V, production rate; , maturation initiation rate constant; , maturation delay; , degradation rate constant. The details are described in Materials and methods. (B) Variants for NPC initiation (Equation 7). All mature NPCs coming from the interphase assembly process are assumed to be initiated 10 min after anaphase onset when the NE is sealed (Dultz et al., 2008; Otsuka et al., 2014). Variant 1: Pores are continuously initiated with a constant rate; Variant 2: NPCs are initiated with a time dependent rate that decreases with time to a basal rate; Variant 3: The majority of NPCs intermediates are initiated at 10 min after anaphase onset. (C) The discrepancy of simulations and intermediate/mature pore data which is given as the sum of squared residuals (upper panel, Equation 8). A log-likelihood ratio test indicates that models where the majority of NPC are initiated within 25 min after anaphase onset (Variant 2 with = 0.0641/min or Variant 3) significantly (***p<0.001) better fit the data than the model with a constant intermediate production (Variant 1). Variant 3 showed the best quality of the fit. Lower panel gives the maturation time (Equation 5) in the different variants. (D,E) Simulations (Variant 1‒3, dashed lines) and data for intermediate (D) and mature pore (E) densities in the inner core region. (F,G) Nuclear pore maturation modeled as a multi-step process (Equations 9‒11). (F) Reaction scheme of the multi-step model (upper panel). Simulated density for mature pores (blue lines) and assembly intermediates (red lines) in the inner-core region is shown (lower panel). Simulations are shown for as no significant improvement in fits was observed for non-equal rate constant. (G) Sum of squared residuals (upper panel) and modeled maturation time as function of the number of steps (lower panel, computed from Equation 12). Although the quality of the fit increases with the number of steps, the maturation time is consistently around 40 min. (H, I) Modeling with various maturation time (Equations 13‒15). (H) Different distributions of maturation times were allowed in the modeling (upper panel). The modeled density for mature pores (blue lines) and assembly intermediates (red lines) in the inner-core region is shown in the lower panel. (I) Sum of squared residuals (upper panel) and average maturation time as function of the width w of the maturation time distribution (lower panel). The data were reproduced for rather narrow maturation time distributions (43 ± 5 min) as also indicated by the confidence interval for TM and Variant 3 (see Materials and methods).
Figure 3—figure supplement 2
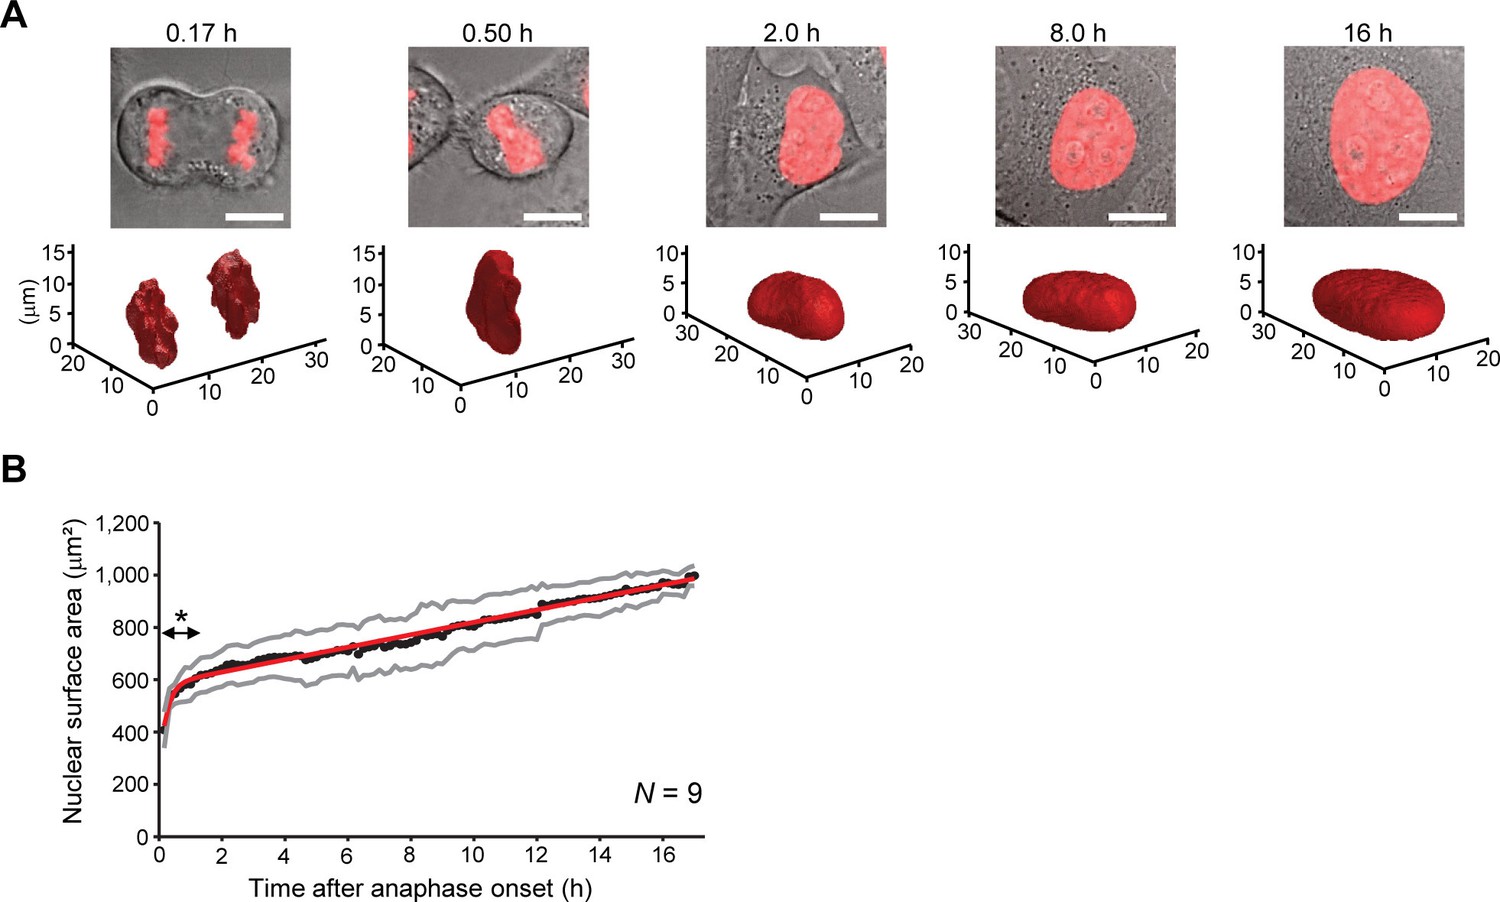
Nuclear surface area measurement for the modeling.
(A) Time-lapse 3D imaging of dividing HeLa cells which express histone-H2b-mCherry (indicated in red). Images show single confocal sections (upper) and the segmented nuclei (lower) at indicated time points. Scale bars, 10 µm. (B) Quantification of nuclear surface area. Black and gray lines represent the average and s.d. of measurements from 9 cells, respectively. All cells undergo a second mitosis after 17–22 hr post anaphase. The data were cut after 17 hr and fitted with Equation 6 in Materials and methods (red line). As indicated by an asterisk, G1 nuclear expansion during the first hour is non-linear.
Figure 4 with 1 supplement

Live imaging of nuclear pore assembly in core regions.
(A) Time-lapse three-dimensional (3D) imaging of GFP-Nup107 and GFP-Nup358 genome-edited cells. DNA was stained with silicon–rhodamine (SiR) Hoechst (Lukinavicius et al., 2015). Single confocal sections of SiR and GFP channels are shown in the top and bottom panels, respectively. Segmented chromosomes (light blue) and inferred inner-core regions (green) are shown in the middle panels. Time after anaphase onset is indicated. Scale bars, 20 µm. (B,C) Quantification of Nup107 (left) and Nup358 (right) assembly in inner-core (B) and non-core (C) regions. The population of postmitotic and interphase NPC assembly measured in Figure 3A‒C is indicated in the left panels. Total intensities of Nup107 (left) and Nup358 (right) were quantified, normalized, and fitted with a sequential model of NPC assembly that allows for different rate constants for postmitotic and interphase assembly, respectively (Equations 16‒18 in Materials and methods). Dots and shaded areas represent the average and s.d. of measurements from 30 cells for Nup107 and 25 cells for Nup358, respectively. Black dashed and solid lines indicate the postmitotic and interphase assembly kinetics and gray solid lines show the combined kinetics. (D) Normalized densities of interphase Nup107 (brown) and Nup358 (orange) assembly. The density was measured by dividing the intensity obtained in (B) by the nuclear surface area.
-
Figure 4—source data 1
Intensity values used for Figure 4B,C.
- https://doi.org/10.7554/eLife.19071.017
Figure 4—figure supplement 1
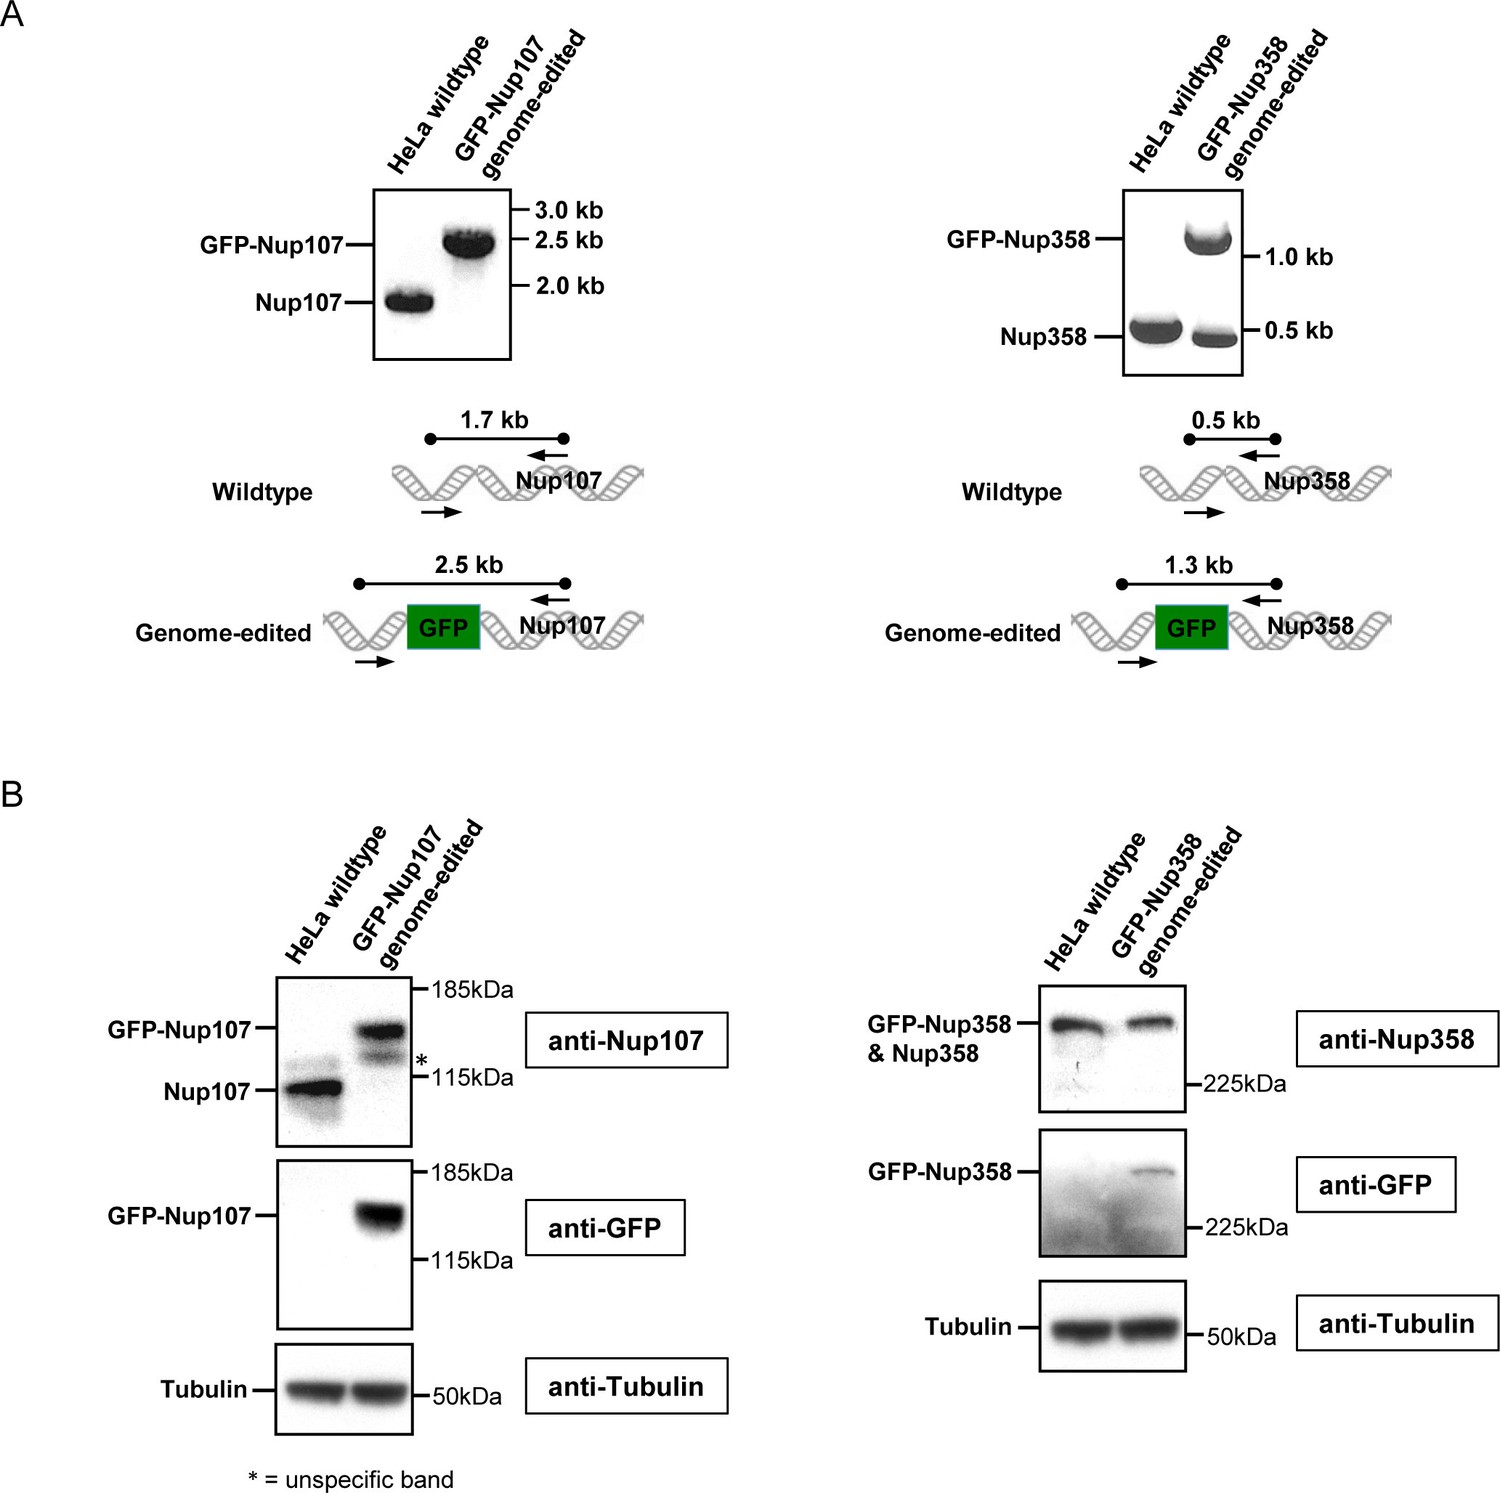
Characterization of genome-edited cell lines expressing GFP-Nup107 and GFP-Nup358.
(A) Junction PCR of GFP-Nup107 (left) and GFP-Nup358 (right) cells with forward primers annealing the upstream of Nups and reverse primers annealing inside of Nups as indicated by black arrows in the bottom panels. Nup107 is homozygously tagged with GFP, whereas Nup358 is heterozygously tagged with GFP. (B) Immunoblot analysis of GFP-Nup107 (left) and GFP-Nup358 (right) cells using antibodies against Nup107, Nup358, GFP, and tubulin. An asterisk indicates unspecific bands.
Figure 5
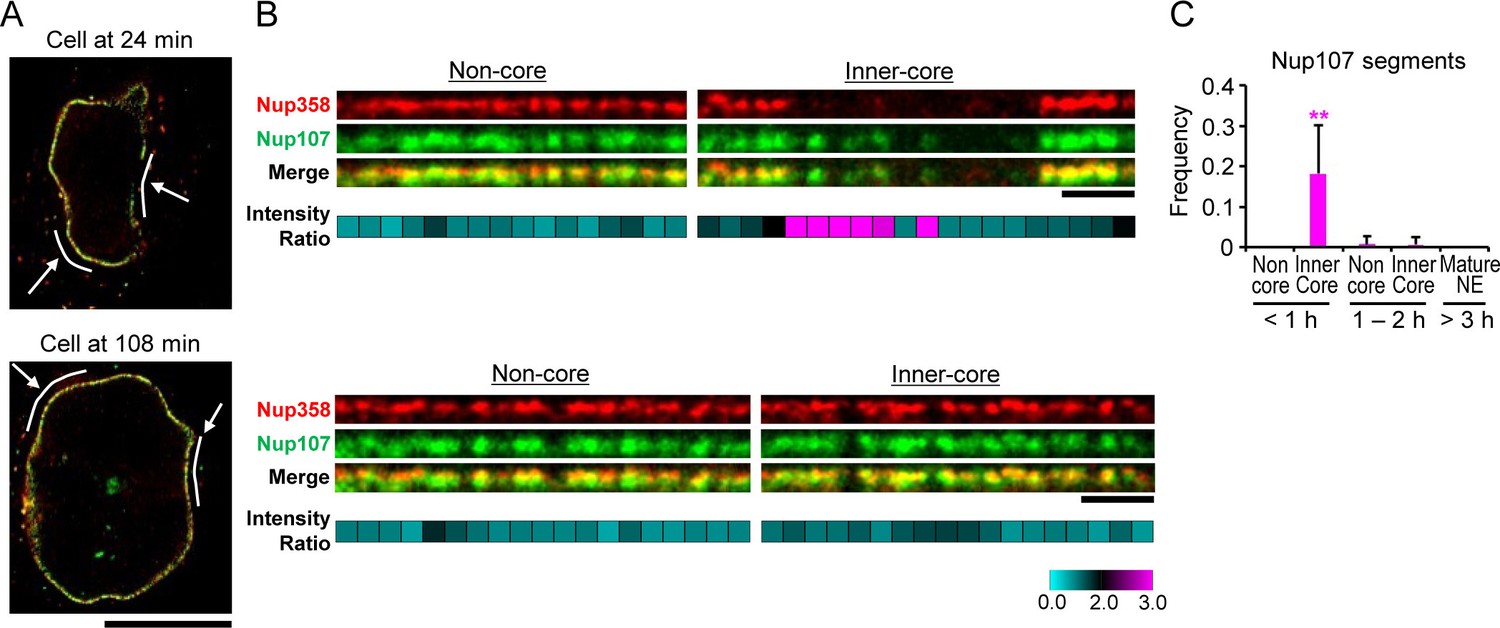
Stimulated emission depletion (STED) imaging of assembly intermediates.
GFP-Nup107 genome-edited cells were stained with anti-GFP and anti-Nup358 antibodies. (A) STED images of cells at 24 and 108 min after anaphase onset. Scale bar, 10 µm. (B) Flattened and enlarged images of the inferred non-core and inner-core regions indicated by white lines and arrows in (A). The intensity ratios of Nup107 to Nup358 were quantified in every 300 nm segments along the NE and are shown in cyan-black-pink heat maps in the bottom panels. Scale bars, 1 µm. (C) The frequency of the segments with the Nup107/Nup358 ratio of >2.0 in non-core and inner-core regions at different times. The data are from 14 cells at <1 hr, 6 cells at 1–2 hr, and 4 cells at >3 hr after anaphase onset. Error bars represent the s.d.. **p<0.001; unpaired t-tests of the frequency difference between the inner-core region at < 1 hr and the others.
-
Figure 5—source data 1
Frequency values used for Figure 5C.
- https://doi.org/10.7554/eLife.19071.020
Figure 6 with 1 supplement
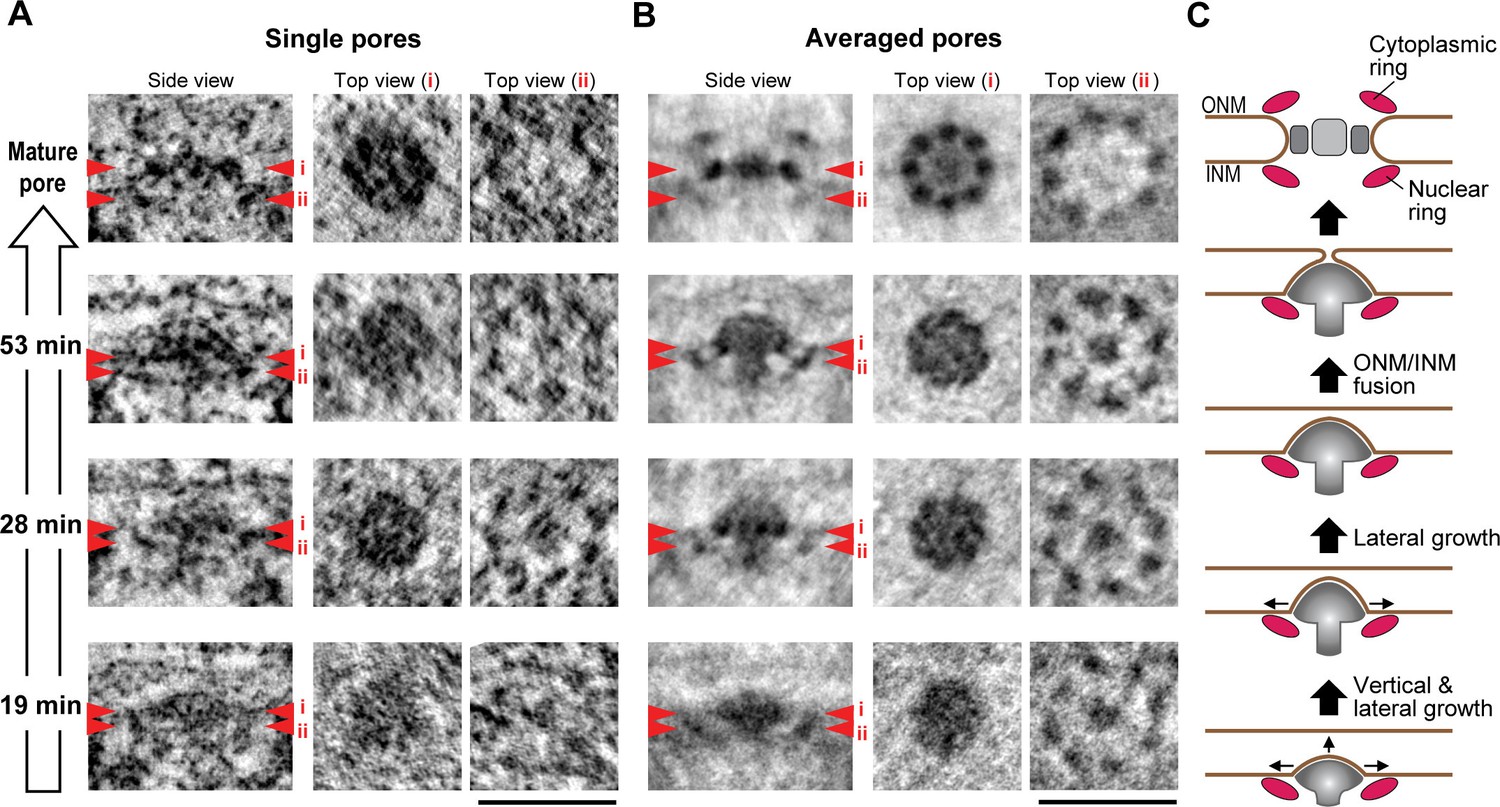
3D structural comparison of assembly intermediates.
(A,B) Electron tomographic slices of single (A) and averaged (B) mature pores and intermediates at selected time points (53, 28, and 19 min). The averaged images are from 36 mature pores and 14, 11, and 24 intermediates picked by similarity of their membrane profile depth and diameter at 53, 28, and 19 min, respectively. Red arrowheads i and ii on side-view images indicate the locations of the planes which are inclined at 90° in top views i and ii. The 8-fold symmetric rings observed in top views i and ii of the averaged mature pore are the spoke ring and the nuclear ring complexes, respectively (Bui et al., 2013; Maimon et al., 2012). Scale bars, 100 nm. (C) A schematic model of interphase nuclear pore assembly. The assembly intermediate is comprised of the nuclear ring and the central mushroom-shaped density. The assembly of the mushroom drives the INM deformation and it grows progressively inside-out. Once the ONM and INM fuse, it undergoes rapid and drastic structural rearrangements and finally becomes a mature pore.
Figure 6—figure supplement 1
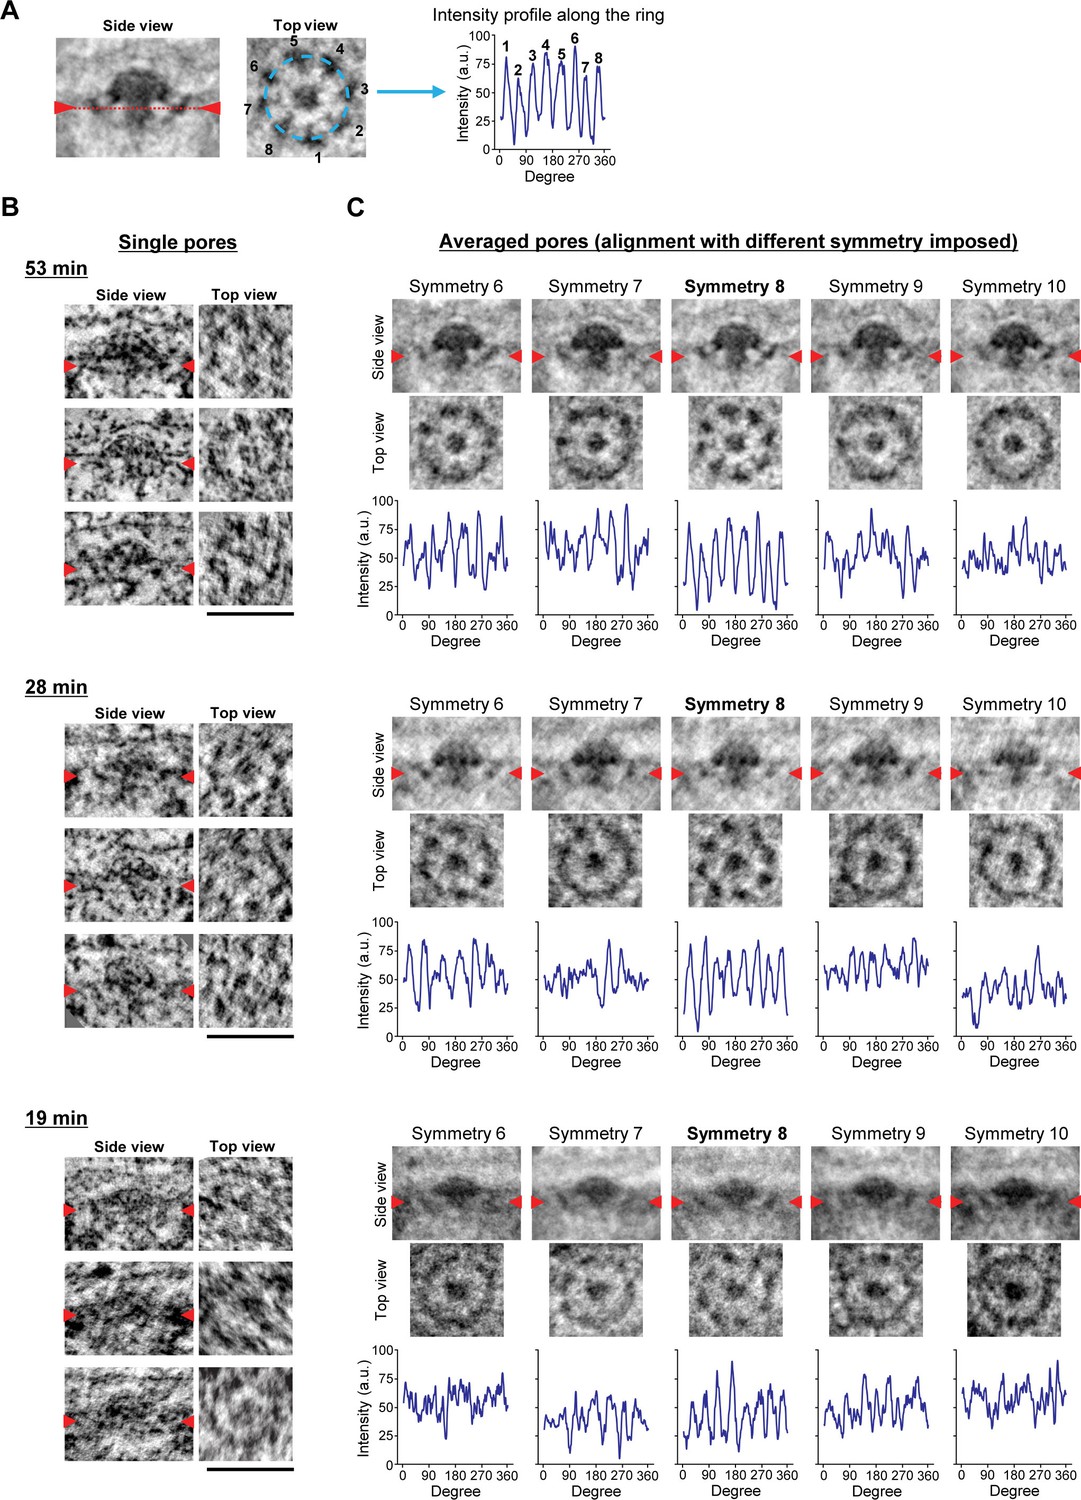
Stability of the subtomogram averaging.
(A) Illustration of the intensity profile analysis. Images of the averaged assembly intermediate at 53 min post anaphase are shown as an example. Red arrowheads and a dotted line in the side view image indicate the location of the plane which is inclined at 90° in the top view. The intensity along the outer ring (light blue dashed line) in the top view image was measured and plotted. The peaks in the plot and the corresponding densities in the top view image are indicated by number. (B,C) Electron tomographic slices of single (B) and averaged (C) intermediates at selected time points (53, 28, and 19 min). Red arrowheads indicate the locations of the planes which are inclined at 90° in the top views. (B) Three examples of intermediates are shown at each time. (C) Different symmetry was imposed for the alignment of the particles for subtomogram averaging. The intensity along the outer ring was measured and plotted as described in (A). As shown in the plot, the alignment with 8-fold symmetry gives highest intensity difference at regular intervals. Although not all the structures showed the clear 8-fold symmetry due to the noise of the images, this systematic symmetry analysis showed that the structures contain 8-fold symmetry. Scale bars, 100 nm.
Videos
Video 1
EM tomographic slices of the nuclear envelope of a cell at 53 min post anaphase.
One of the mature pores and an assembly intermediate are indicated by blue and red arrows, respectively. Scale bar, 100 nm.
Tables
Table 1
Summary of EM tomography. A data table shows the surface area of the NE analyzed by EM tomography and the number of mature pores, assembly intermediates, and the outer and inner nuclear membrane (ONM and INM) fusion events found in each cell at a different time point after anaphase onset. The data obtained in non-core, inner- and outer-core regions are indicated separately. In total, 154 µm2 NE surface area was analyzed, and 279 intermediates and 1322 mature pores were found.
| Time after anaphase onset (min) | 19.2 | 24.4 | 28.4 | 36.3 | 42.0 | 53.2 | 61.0 | 65.6 | 73.6 | 82.9 | 100 | 116 | >180 | >180 | |
|---|---|---|---|---|---|---|---|---|---|---|---|---|---|---|---|
| Non-core | Analyzed surface area (µm2) | 5.29 | 4.04 | 5.06 | 3.99 | 5.17 | 5.54 | 4.04 | 3.72 | 3.06 | 3.73 | 3.32 | 3.17 | 4.03 | 2.80 |
| Number of mature pores | 82 | 45 | 48 | 42 | 62 | 51 | 53 | 33 | 33 | 39 | 33 | 31 | 45 | 31 | |
| Number of intermediates | 2 | 4 | 6 | 3 | 5 | 8 | 3 | 3 | 2 | 1 | 5 | 5 | 4 | 1 | |
| Number of ONM/INM fusion | |||||||||||||||
| Inner-core | Analyzed surface area (µm2) | 5.77 | 5.06 | 4.16 | 4.74 | 6.75 | 4.33 | 3.61 | 4.57 | 4.07 | 3.53 | 4.61 | 3.46 | ||
| Number of mature pores | 24 | 16 | 3 | 18 | 30 | 16 | 34 | 27 | 27 | 39 | 53 | 32 | |||
| Number of intermediates | 21 | 13 | 12 | 8 | 35 | 12 | 1 | 3 | 4 | 3 | 2 | 3 | |||
| Number of ONM/INM fusion | 2 | 1 | |||||||||||||
| Outer-core | Analyzed surface area (µm2) | 4.22 | 4.15 | 3.83 | 2.55 | 4.78 | 4.41 | 3.59 | 3.68 | 2.71 | 2.67 | 2.77 | 2.68 | ||
| Number of mature pores | 29 | 40 | 27 | 17 | 44 | 35 | 38 | 28 | 30 | 34 | 25 | 28 | |||
| Number of intermediates | 23 | 10 | 19 | 9 | 13 | 11 | 1 | 4 | 1 | 3 | 5 | 1 | |||
| Number of ONM/INM fusion | 2 |
Download links
A two-part list of links to download the article, or parts of the article, in various formats.
Downloads (link to download the article as PDF)
Open citations (links to open the citations from this article in various online reference manager services)
Cite this article (links to download the citations from this article in formats compatible with various reference manager tools)
Nuclear pore assembly proceeds by an inside-out extrusion of the nuclear envelope
eLife 5:e19071.
https://doi.org/10.7554/eLife.19071


