Two subunits of human ORC are dispensable for DNA replication and proliferation
- University of Virginia School of Medicine, United States
Figures
Figure 1
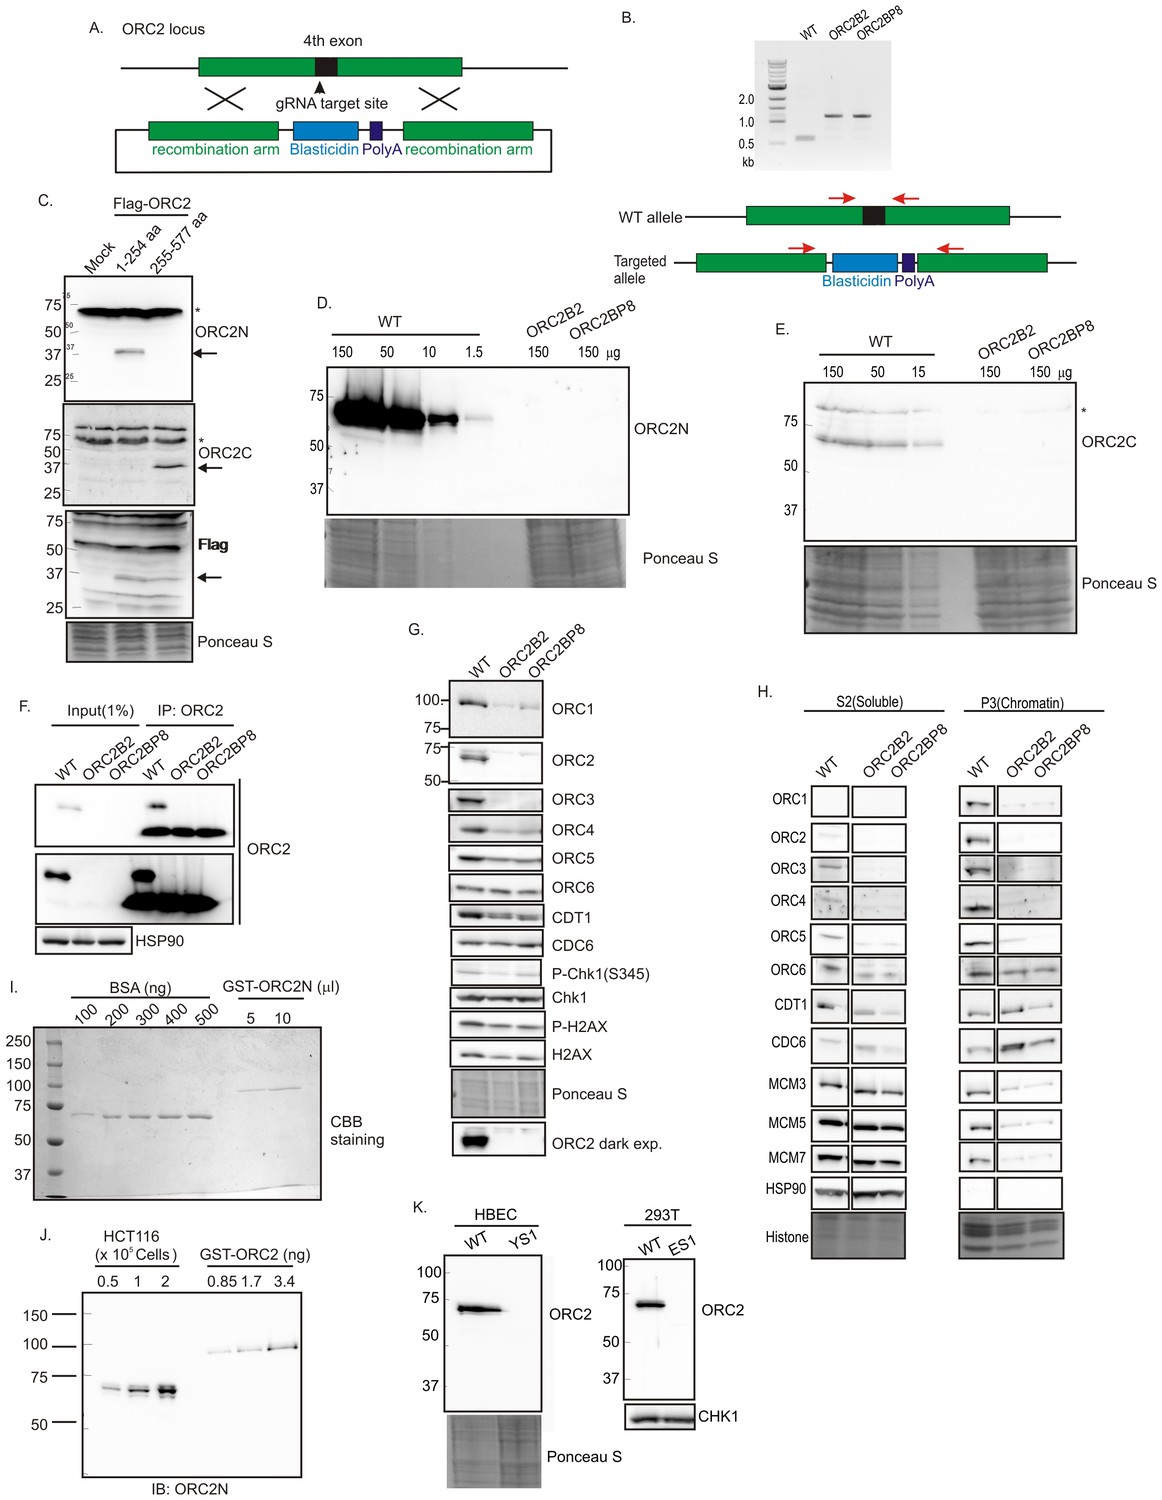
Knockout of ORC2 in HCT116 p53-/- cells.
(A) Strategy for insertion of a blasticidin gene and poly A site in the fourth exon of ORC2 at aa 40 of ORC2. (B) PCR on genomic DNA of indicated clones. WT: HCT116 p53-/- and ORC2+/+. ORC2 Knockout clones, B2 and BP8 have an insert on both alleles of ORC2 as indicated by the absence of 0.6 kb PCR product. (C) Verification of antibodies recognizing N-terminal or C-terminal parts of ORC2. Recombinant ORC2 protein halves with Flag epitope tags were expressed and blotted with indicated antibodies. Ponceau S staining of total protein shows equal loading of lanes.* indicates full length endogenous ORC2 protein. Arrow indicates recombinant protein. (D) Quantitative Western blot for ORC2 with an antibody recognizing the N-terminal half of ORC2. Indicated amount of lysate loaded in each lane. (E) Western blot with antibody recognizing C-terminal half of ORC2. * Non specific band (F) Input cell lysate and immunoprecipitates of ORC2 immunoblotted for ORC2. Darker exposure of the top blots is shown in the middle. HSP90 in the cell lysate or the IgG band in the immunoprecipitate serves as loading control. (G) Western blot for indicated proteins in clones indicated on the top. Darker exposure of the ORC2 blots is shown at the bottom. Ponceau S stains all proteins on the blot and also indicates equal loading of lanes. (H) Immunoblot of soluble and chromatin-associated proteins in the clones indicated at the top. Ponceau S staining of histones serves as loading control for chromatin fractions. For each panel, all the lanes are from the same blot and exposure. (I) Comparison of Coomassie Brilliant Blue signal of pure BSA and recombinant purified GST-ORC2 to show that the top-most band in the ORC2 lane is at 170 ng/ 10 μl. (J) Immunoblot with different amounts of cell lysate with the GST-ORC2 to show that 1×10e5 cells give an ORC2 signal equal to 2.54 ng (1.4 fold of 1.67 ng) of GST-ORC2, which corresponds to 153×10e8 molecules of GST-ORC2. (K) Western blot of ORC2 in HBEC and 293T cell lines. Ponceau S staining of total protein or immunoblot of Chk1 show equal loading of the pairs of lanes.
Figure 2

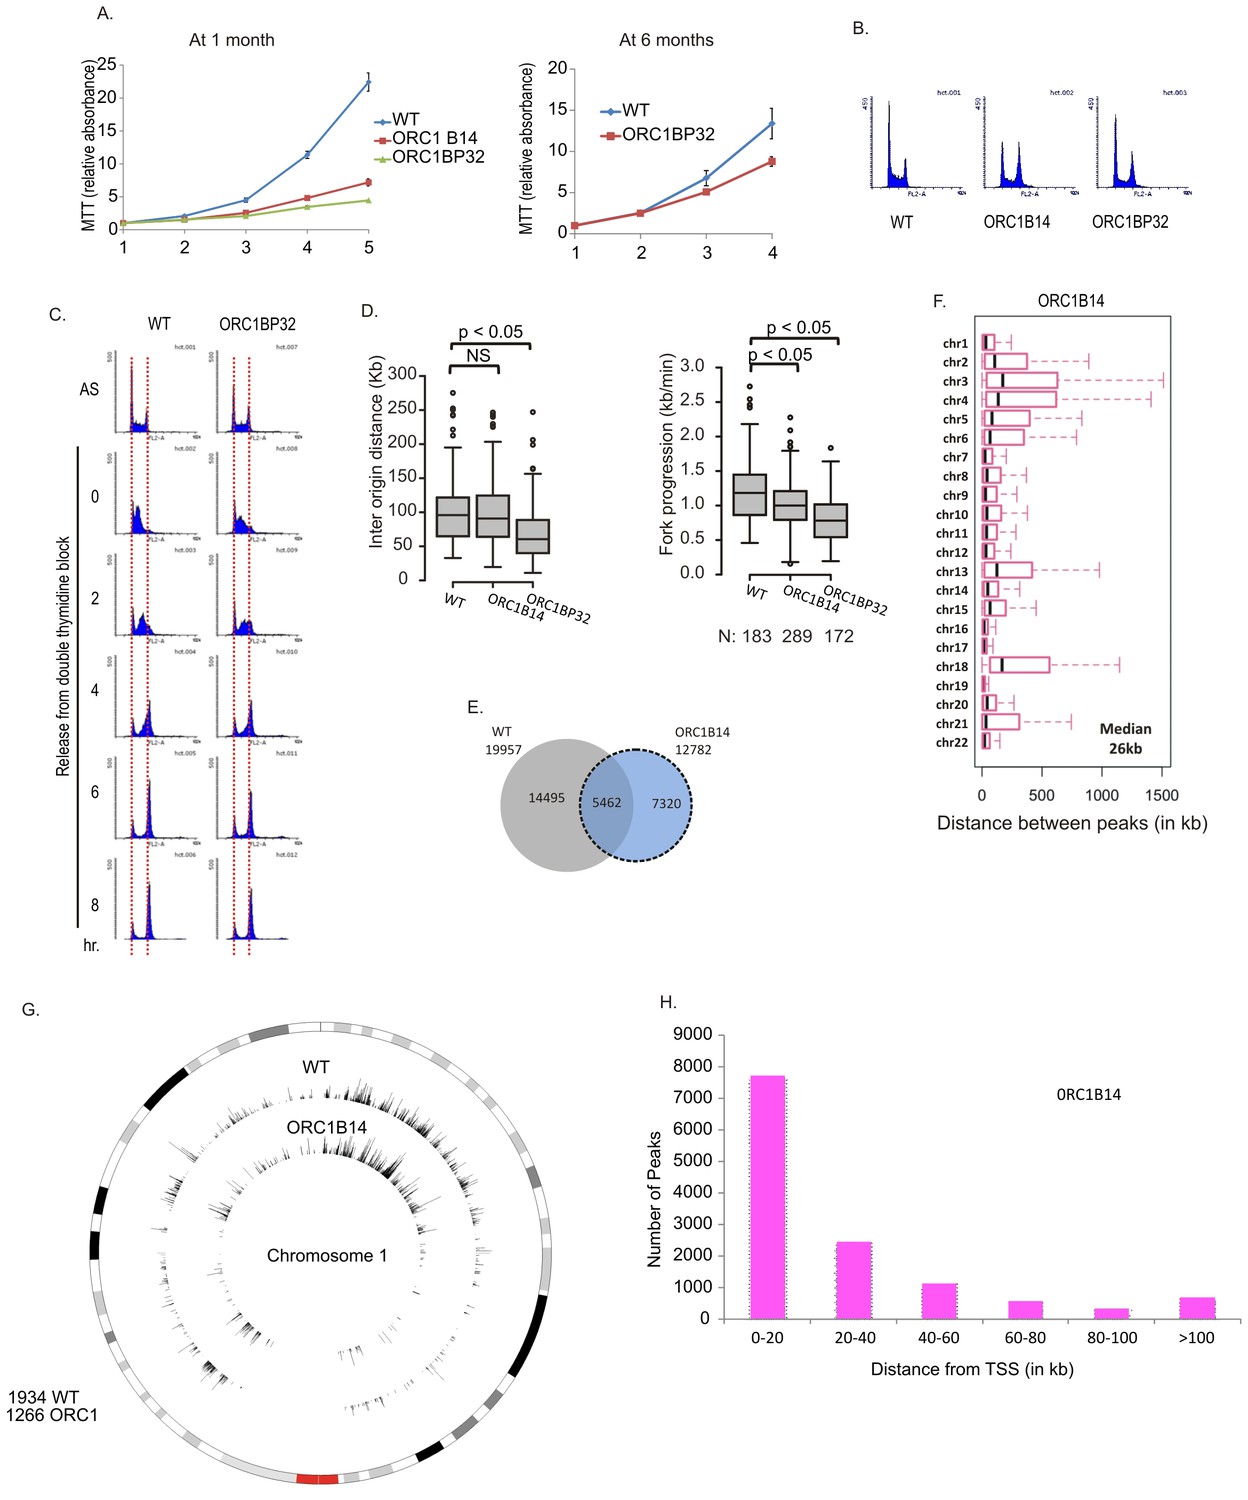
Cell proliferation and DNA replication in the ORC2-/- cell lines.
(A) Growth curves of indicated clones of cells over five days, expressed as MTT absorbance relative to the level at day 1. (Mean ± S.D.; n = 4 biological replicates. Cells after passage for three months). (B) FACS profile of propidium-iodide stained cell-cycle asynchronous cells from indicated clones. (C) Cells arrested in double-thymidine block released into nocodazole containing medium and harvested at indicated times after release to measure rate of progression through S phase. AS: asynchronous cells. The red dotted lines indicate cells with G1 and G2 DNA content. (D) Cell-cycle asynchronous cells labeled with BrdU for 30 min. % of BrdU labeled cells evaluated by two color FACS. (Two-sided t-test for two samples, Mean ± S.D.; n = 4 biological replicates). (E) Molecular combing of chromosomal DNA after a pulse of CldU for 30 min chased with a pulse of IdU for 30 min. Top: Schematic shows distances that were measured to estimate fork progression rate and inter-origin distance. Middle: Representative image of the combed DNA stained for CldU (green) and IdU (red) shown below the schematic. Bottom: Box and whiskers plot for fork progression rate and inter-origin distance of indicated clones of cells. (P value < 0.01, two-sided Wilcoxon rank sum test for two samples; N = number of tracks counted. P: Statistical significance of any difference between WT and ORC2-/- cells. (F) Overlap of the BrIP-seq peaks between WT and ORC2-/- cells. (G) Box and whiskers plot for inter-origin distances (measured by BrIP-seq) for each chromosome in WT and ORC2-/- cells. The median inter-origin distance for all chromosomes together indicated at bottom right. (H) Circos plot of Origins mapped by BrIP-seq for chromosome 1. Outer circle: the chromosome with the karytotyping bands. Inner two circles: the locations of BrIPseq peaks in the WT and ORC2-/- cell lines. (I) Distribution of BrIP-seq mapped origins relative to distance from Transcription Start Sites (TSS). In WT and ORC2-/- cells.
Figure 3

Knockout of ORC1 in HCT116 p53-/- cells.
(A) Strategy for insertion of a blasticidin gene and poly A site after first methionine of ORC1 in the second exon. (B) PCR on genomic DNA of indicated clones. WT: HCT116 p53-/- and ORC1+/+. ORC1 Knockout clones, B14, B48 and BP32 have an insert on both alleles of ORC1 as indicated by the absence of 0.6 kb PCR product. (C) Western blot for indicated proteins in clones indicated on the top. Darker exposure of the ORC1 blots is shown at the bottom. Ponceau S stains all proteins on the blot and also indicates equal loading of lanes. (D) Immunoblot of soluble and chromatin-associated proteins in the clones indicated at the top. For each panel, all the lanes are from the same blot and exposure. (E) Input cell lysate and immunoprecipitates of ORC1 immunoblotted for ORC1. Darker exposure of the top blots is shown in the middle. Tubulin in the cell lysate or the IgG band in the immunoprecipitate serves as loading control.
Figure 4
Cell proliferation and DNA replication changes in the ORC1-/- cell lines.
(A) Growth curves of indicated clones of cells over four days, expressed as MTT absorbance relative to the level at day 1. (Mean ± S.D.; n = 4 biological replicates) Cells after passage for 1 month or six months. (B) FACS profile of propidium-iodide stained cell-cycle asynchronous cells from indicated clones. (C) Cells arrested in double-thymidine block released into nocodazole containing medium and harvested at indicated times after release to measure rate of progression through S phase. AS: asynchronous cells. The red dotted lines indicate cells with G1 and G2 DNA content. (D) Molecular combing of chromosomal DNA after a pulse of CldU for 30 min chased with a pulse of IdU for 30 min. Box and whiskers plot for fork progression rate and inter-origin distance of indicated clones of cells. (P value < 4.6e-06, two-sided Wilcoxon rank sum test for two samples N = number of tracks counted) (Inter origin disntance N = 91(WT), 131(ORC1B14), 174(ORC1BP32) p: Statistical significance of any difference between WT and ORC1-/- cells. (E) Overlap of the BrIP-seq peaks between WT and ORC1-/- cells. (F) Box and whiskers plot for inter-origin distances (measured by BrIP-seq) for each chromosome in WT and ORC1-/- cells. The median inter-origin distance for all chromosomes together indicated at bottom right. (G) Circos plot of Origins mapped by BrIP-seq for chromosome 1. Outer circle: the chromosome with the karytotyping bands. Inner two circles: the locations of BrIPseq peaks in the WT and ORC1-/- cell lines. (H) Distribution of BrIP-seq mapped origins in ORC1-/- cells relative to distance from Transcription Start Sites (TSS).
Figure 5
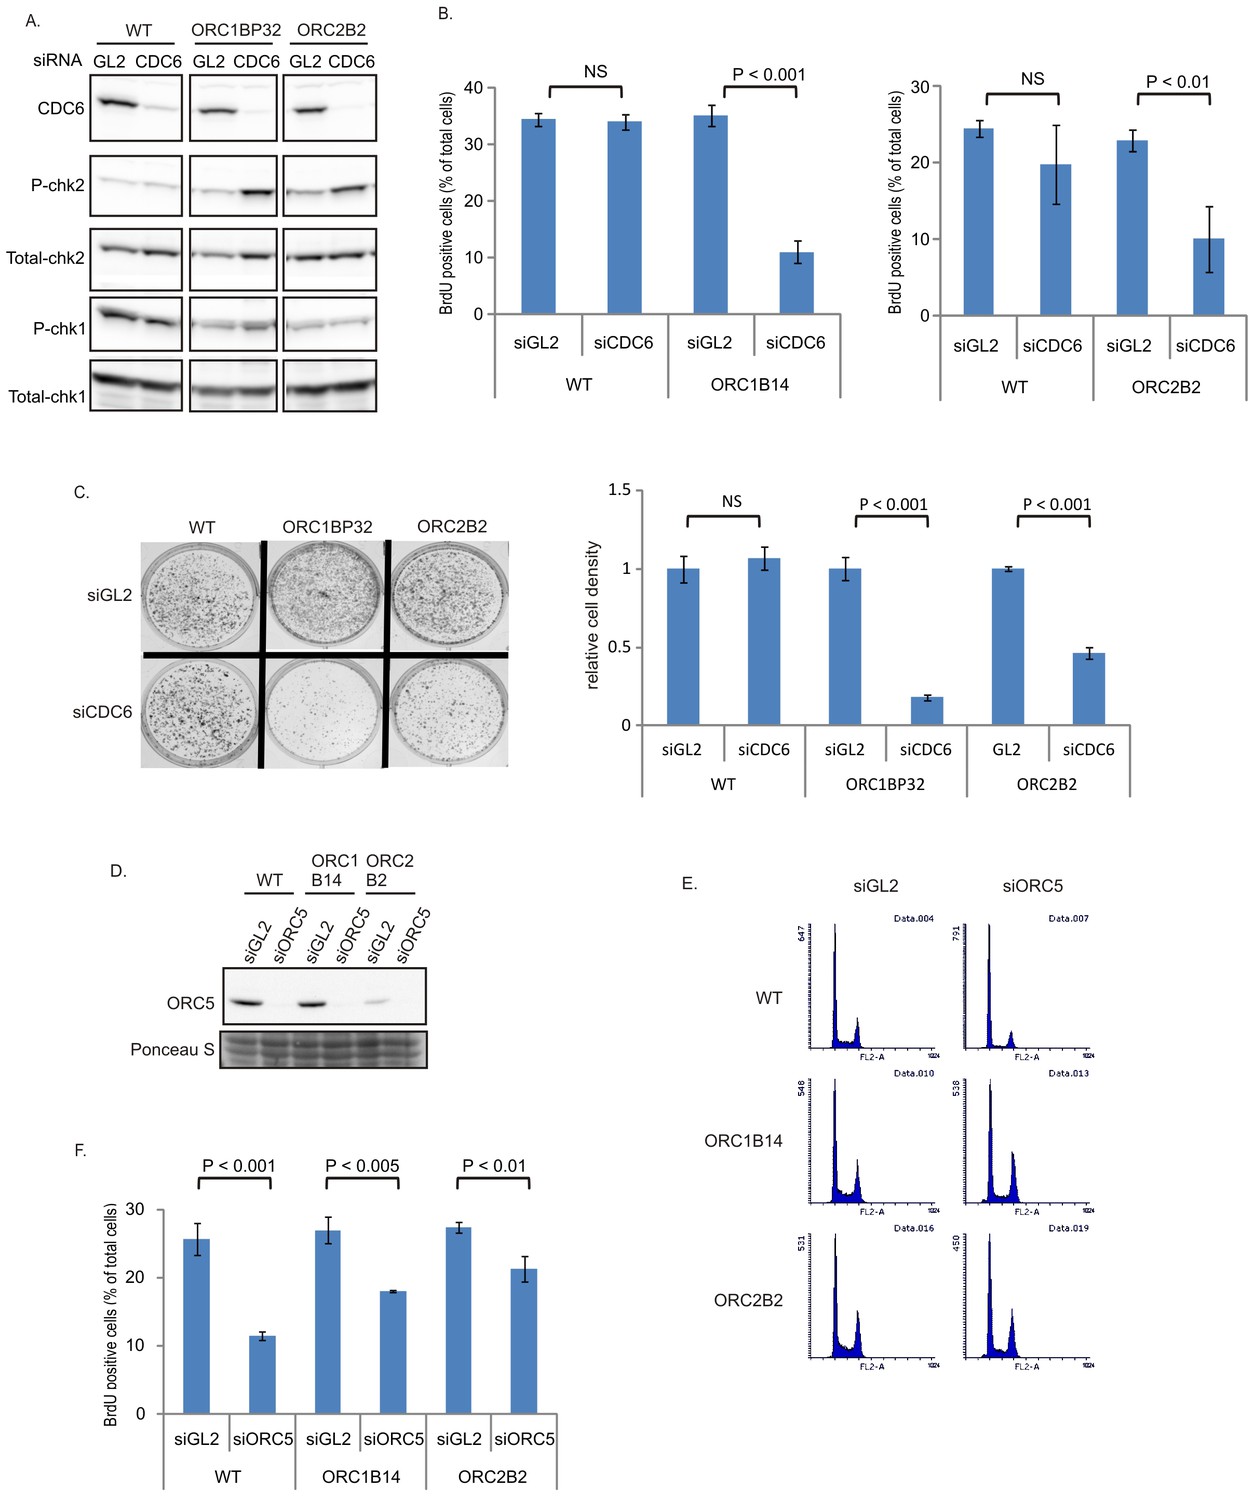
CDC6 is more essential for replication and colony formation in the ORC mutant cells.
(A) Immunoblots of extracts from indicated cell lines following transfection of siGL2 (negative control siRNA against luciferase) or siCDC6. (B) % of BrdU+ cells after transfection of indicated siRNAs. Data from two color FACS. (P value < 0.01, two-sided t-test for two samples, Mean ± S.D. n = 4 or 3 biological replicates) (C) Top: 72 hr after transfection of indicated siRNAs, 2000 cells were plated per plate for colony formation detected by Crystal violet staining after seven days. Bottom: Crystal violet stained colony density were measured. Data presented for each cell line normalized to the density of the siGL2 transfected cells. (P value < 0.001, two-sided t-test for two samples, Mean ± S.D. n = 3 biological replicates). (D) Immuno blots of ORC5 (E) FACS profile of propidium-iodide stained cells for cell-cycle determination at three days after transfection of indicated siRNA. (F) % of BrdU+ cells after transfection of indicated siRNAs. Data from two color FACS. (Two-sided t-test for two samples, Mean ± S.D. n = 3 biological replicates).
Download links
A two-part list of links to download the article, or parts of the article, in various formats.
Downloads (link to download the article as PDF)
Open citations (links to open the citations from this article in various online reference manager services)
Cite this article (links to download the citations from this article in formats compatible with various reference manager tools)
Two subunits of human ORC are dispensable for DNA replication and proliferation
eLife 5:e19084.
https://doi.org/10.7554/eLife.19084


