The MBD7 complex promotes expression of methylated transgenes without significantly altering their methylation status
- Institute of Integrative Genome Biology, University of California, United States
- Lanzhou University, China
- Hebei Collaboration Innovation Center for Cell Signaling, Center for Agricultural Resources Research, Institute of Genetics and Developmental Biology, Chinese Academy of Sciences, China
- Salk Institute for Biological Studies, United States
- Guangdong Provincial Key Laboratory for Plant Epigenetics, Shenzhen University, China
- College of Life Sciences, Peking University, China
- David Geffen School of Medicine at UCLA, United States
- Laboratory of the Ministry of Education, Department of Biological Sciences and Biotechnology, Tsinghua University, China
- Howard Hughes Medical Institute, University of California, United States
Figures
Figure 1 with 3 supplements
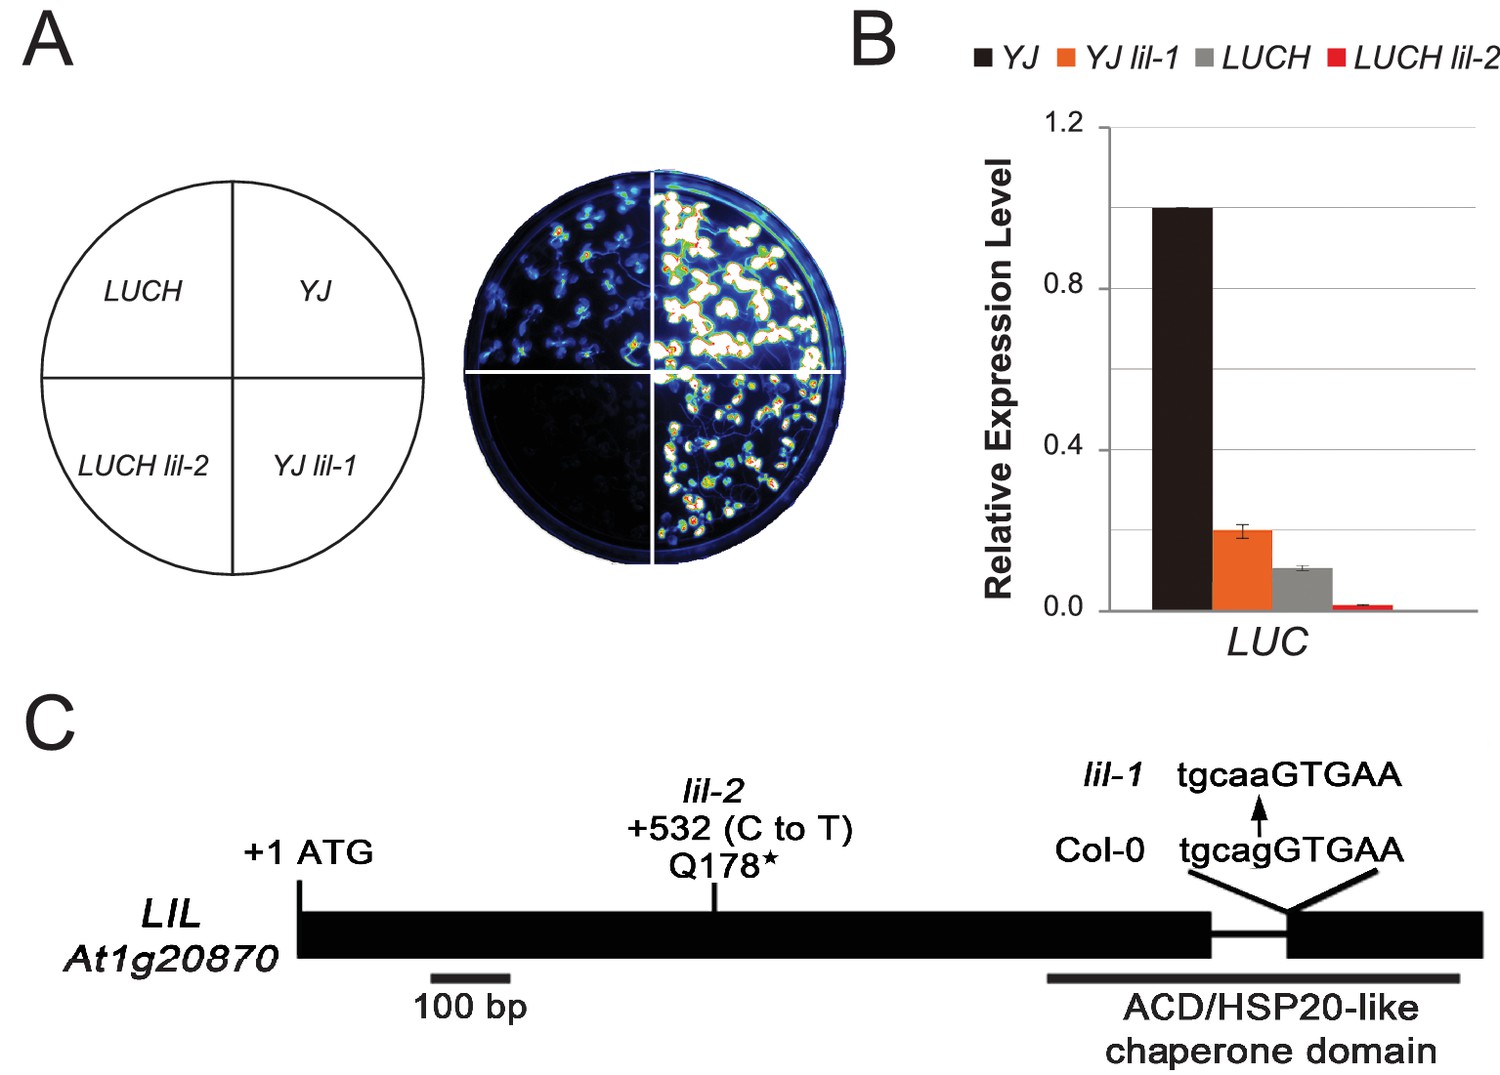
LIL promotes expression of methylated LUC reporters.
(A) Luciferase (LUC) luminescence in YJ, YJ lil-1, LUCH and LUCH lil-2 seedlings as diagramed on the left. (B) Quantification of LUC transcript levels by RT-qPCR. Transcript levels were normalized to UBIQUITIN5 with the expression level of LUC in the YJ control set to one. Error bars indicate the standard deviation from two biological replicates. (C) LIL gene structure showing the positions of the two isolated mutations relative to the exons (black bars) and a single intron (black line). Lower and upper case letters represent intron and exon sequences, respectively. The region encoding the conserved ACD or HSP20-like chaperone domain is indicated below.
-
Figure 1—source data 1
Alignment of the YJ and LUCH transgenes.
Clustal alignment numbered relative to YJ. Perfectly matched residues are marked with an asterisk (*) below the alignment.
- https://doi.org/10.7554/eLife.19893.003
Figure 1—figure supplement 1
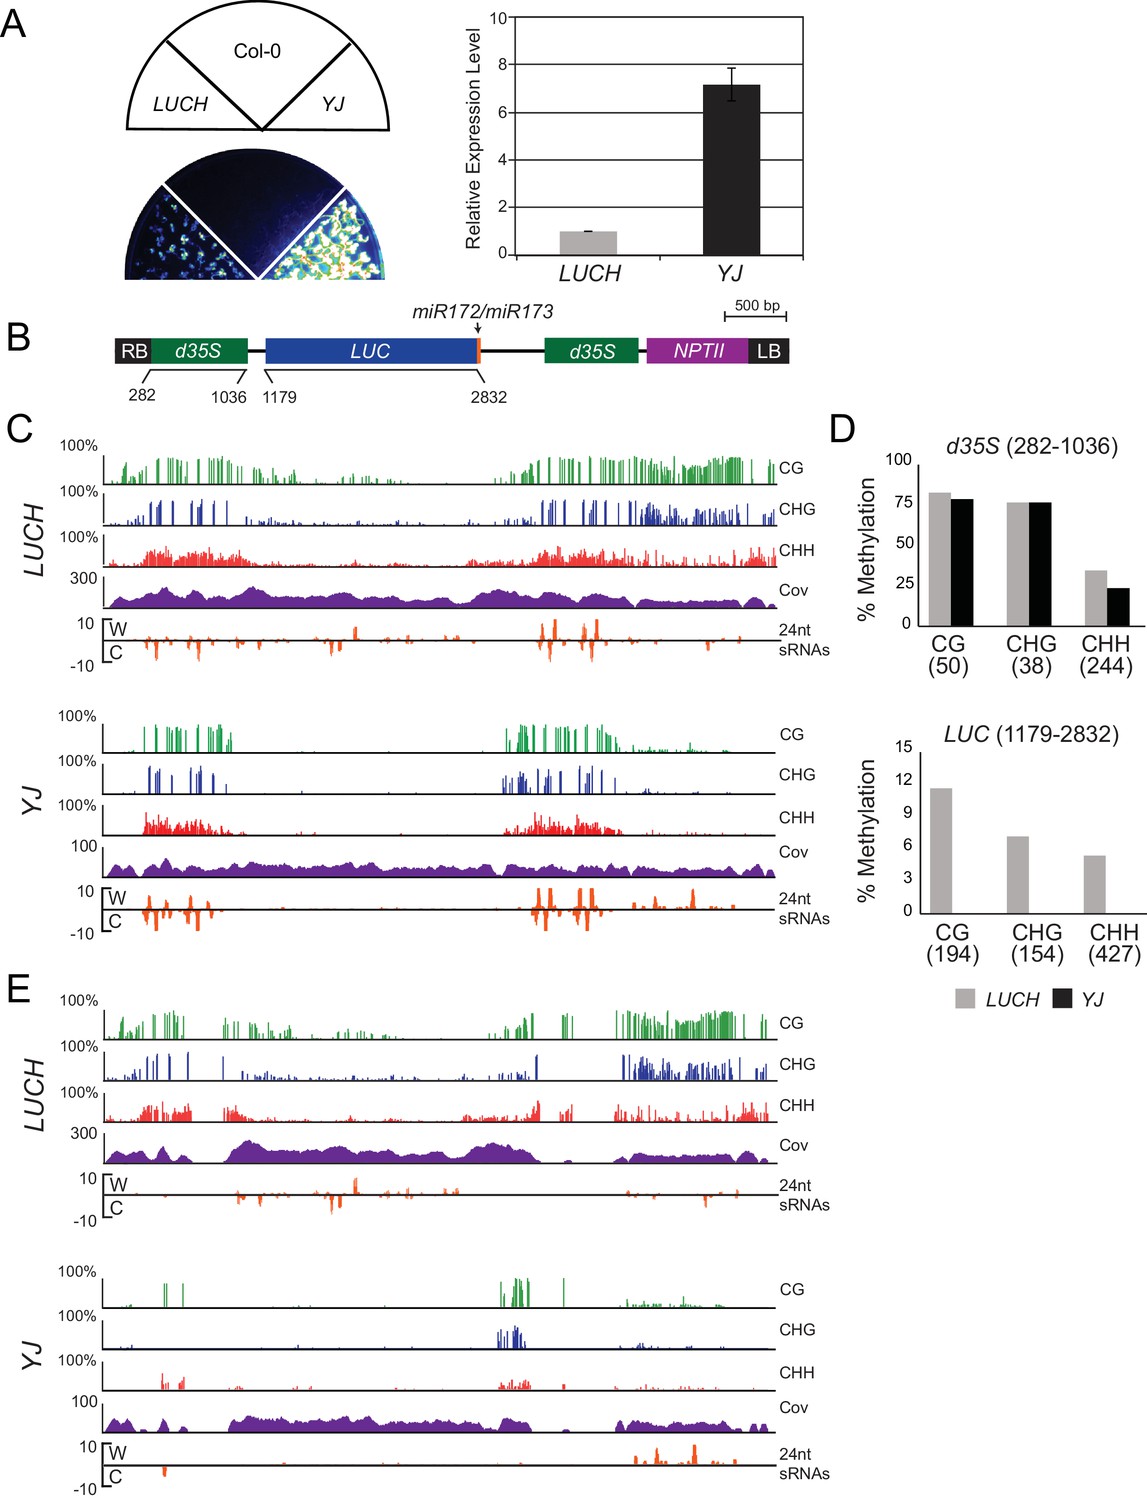
Characterization of the LUCH and YJ luciferase (LUC) reporter lines.
(A) LUC luminescence in LUCH and YJ backgrounds as diagrammed on top. (B) Quantification of LUC transcript levels by RT-qPCR. LUC transcript levels were normalized to UBIQUITIN5 and LUCH expression was set to one. Error bars indicate the standard deviation from two biological replicates. (B) A diagram of the LUC transgenes present in the LUCH and YJ reporter lines, drawn to scale relative to the browser tracks shown in (C). The LUC gene and the selectable marker NPTII are each driven by a dual 35S promoter (d35S). The right and left borders of the T-DNA are labeled as RB and LB, respectively. The LUCH and YJ transgenes differ only at the 3’ end of the LUC gene, with LUCH containing a miR172 binding site (Won et al., 2012) and YJ containing a miR173 site (Li et al., 2016). (C) Epigenetic features of the LUCH and YJ transgenes. DNA methylation tracks show the percent DNA methylation (0–100%) in the CG (green), CHG (blue) and CHH (red) sequence contexts at cytosines covered by at least five reads (H = A, T or C). Coverage tracks (purple) show the number of reads per cytosine mapped to the transgene. Small RNA tracks (orange) show 24-nt siRNAs (transcripts per thousand (K)) mapped to the transgene on the Watson (W) or Crick (C) strands. Note that the d35S promoters driving LUC and NPTII expression are 94% identical in sequence, thus the DNA methylation, siRNA and coverage data for these tracks include both multi-mapping and unique reads. (D) Quantification of the average percent methylation across the d35S promoter (282–1036) or the LUC coding region (1179–2832) in the LUCH and YJ transgenes presented in (C). For each sequence context, the number of cytosines in the quantified regions is indicated in parentheses. (E) DNA methylation tracks as in (C) but only allowing uniquely mapping reads.
Figure 1—figure supplement 2
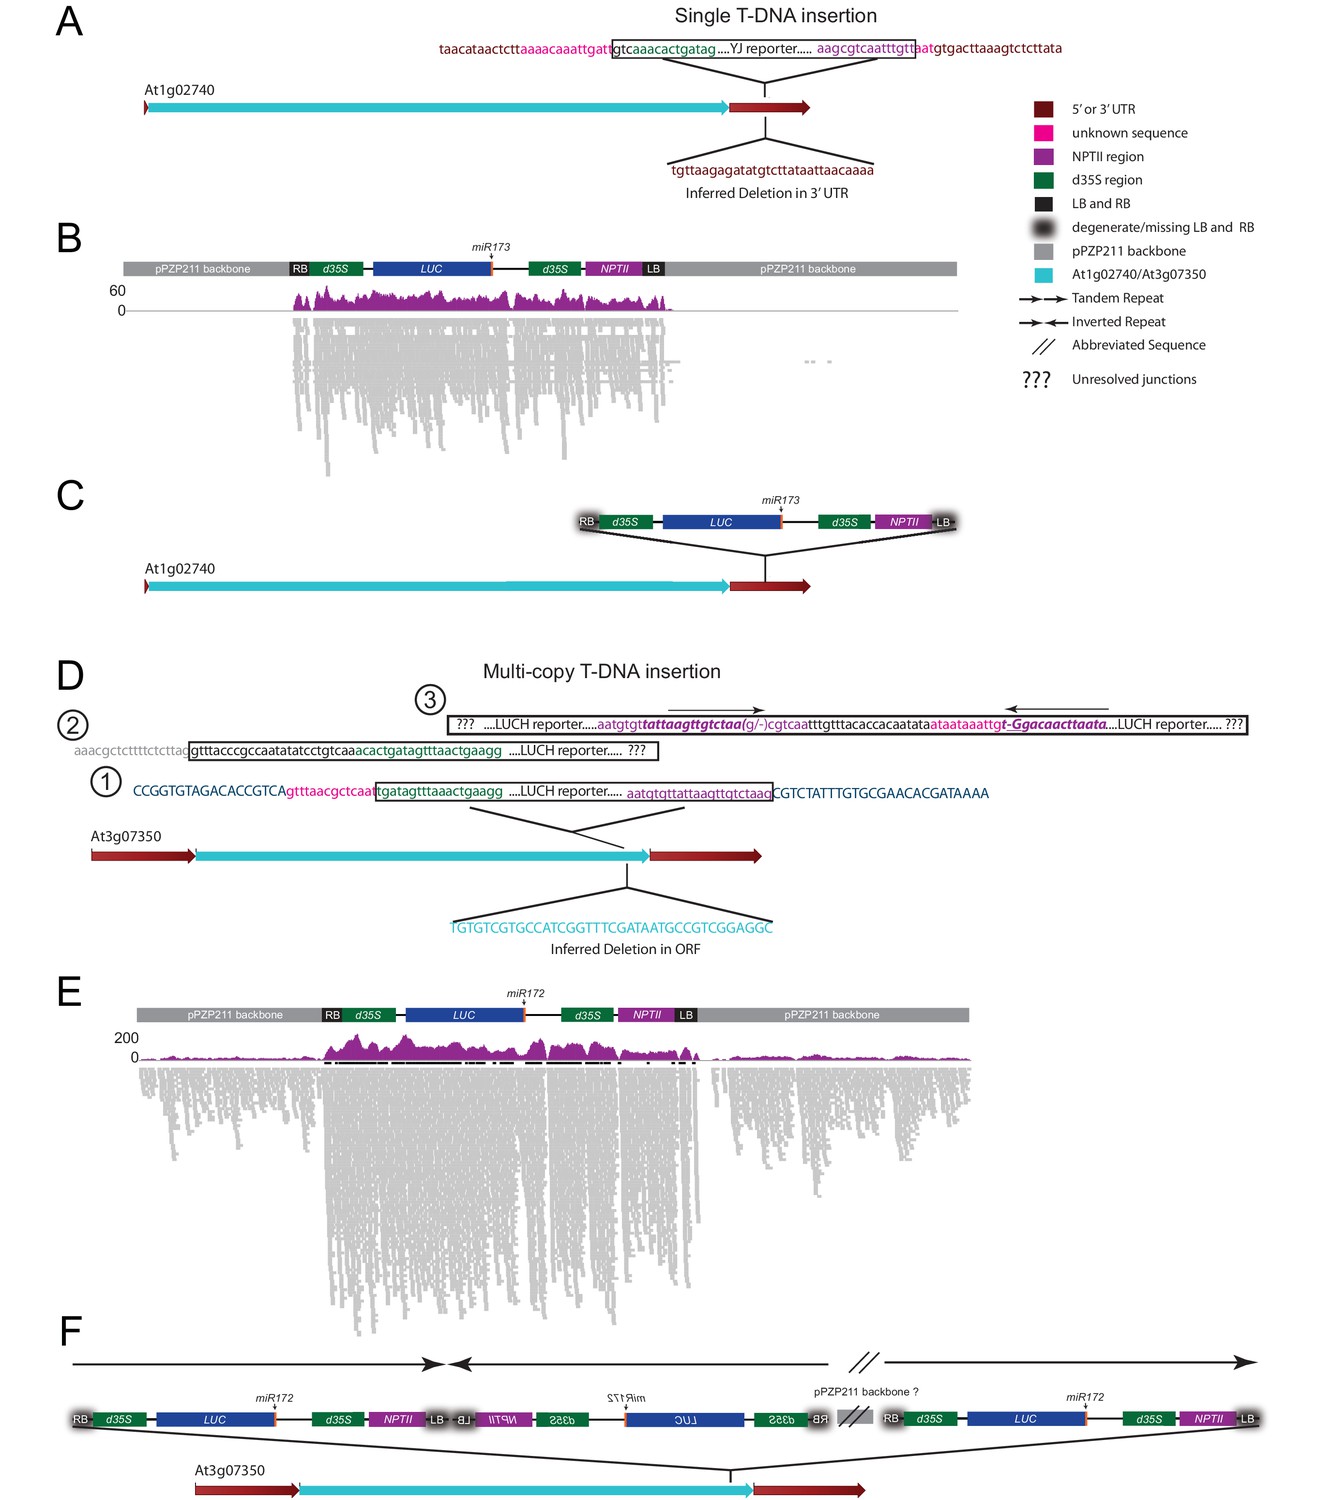
Investigation of transgene copy number.
(A) Diagram of the At1g02740 gene showing the location of the YJ reporter insertion site based on the MethylC-seq reads. Chimeric reads between the YJ reporter, in the vicinity of the RB and LB elements, mapped exclusively to the At1g02740 3’UTR and are shown above the At1g02740 gene. A deletion in the At1g02740 3’UTR inferred from these same sequences is shown below the At1g02740 gene. (B) Genome browser view showing the results from mapping the MethylC-seq data to the entire binary vector used for the generation of the YJ reporter line. The individual reads are shown in grey (lower track) and the total read coverage in purple (upper track). Negligible reads were identified mapping to the plasmid backbone. (C) Model showing a single copy insertion of the YJ reporter into the At1g02740 3’UTR. (D) Diagram of the At3g07350 gene showing the location of the LUCH reporter insertion site based on the MethylC-seq reads. Chimeric reads between the LUCH reporter, in the vicinity of the RB and LB elements, mapped to several genetic elements. (1) Chimeric reads corresponding to the outermost regions of the insert mapped to the coding sequence of the At3g07350 gene and are shown above the gene model. A deletion in the At3g07350 coding sequence inferred from the MethylC-seq data is shown below the At3g07350 gene. (2) Reads mapping to the LUCH reporter that extend beyond the RB into the plasmid backbone were also identified. (3) Finally, chimeric reads consistent with the presence of an LUCH inverted repeat, were also present. (E) Genome browser view showing the coverage results from mapping the MethylC-seq data to the binary vector used for the generation of the LUCH reporter line. Reads spanning nearly the entire plasmid backbone were identified suggesting a non-canonical insertion profile. (F) Model of one possible configuration of the LUCH reporter that is consistent with the junctions identified in panel (D), the presence of the entire binary vector as identified in panel (E), and published Southern blot data (Won et al., 2012). The colors of the sequences and elements are as indicated. Sequences in capital or lower case represent coding and non-coding sequences, respectively. The bold, italic purple sequence in panel (D) demarcates the inverted repeat in the vicinity of the LUCH LB. In panel (E), the read numbers are capped at 50 and regions with >50 reads are indicated by the presence of a thick black bar above the reads.
Figure 1—figure supplement 3
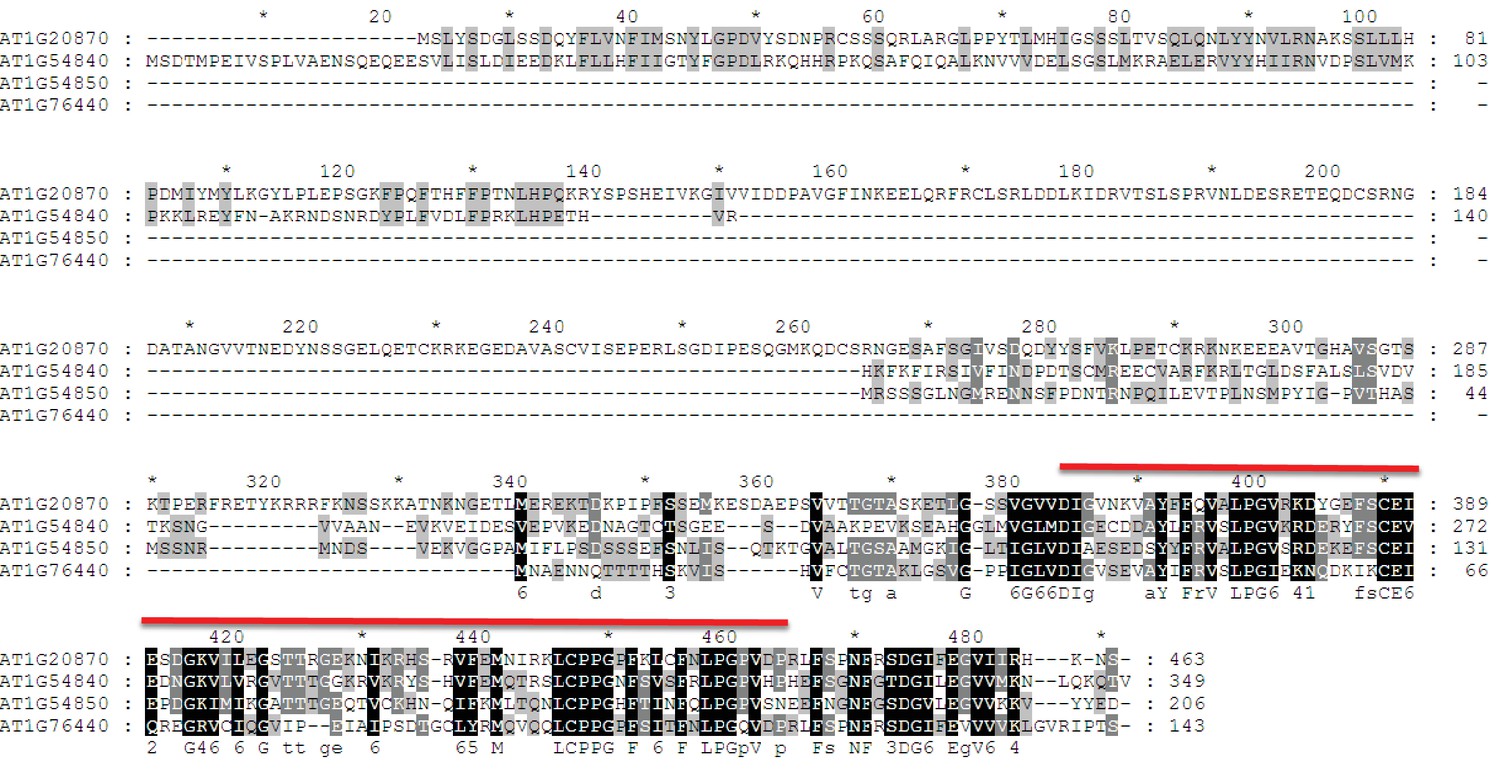
Sequence alignment of LIL and its paralogs.
LIL paralogs were identified using the Arabidopsis thaliana WU-BLAST2 Search function using the TAIR10 Proteins dataset and the full-length amino-acid sequence of LIL (At1g20870) as a query (http://www.arabidopsis.org). The protein sequences were aligned using ClustalW2 (http://embnet.vital-it.ch/software/ClustalW.html) and displayed using Genedoc. Black and grey boxes indicate identical and similar residues, respectively. The region encoding the HSP20-like chaperone domain is indicated by the red line above the alignment. The consensus sequences are indicated underneath the protein alignment.
Figure 2 with 3 supplements
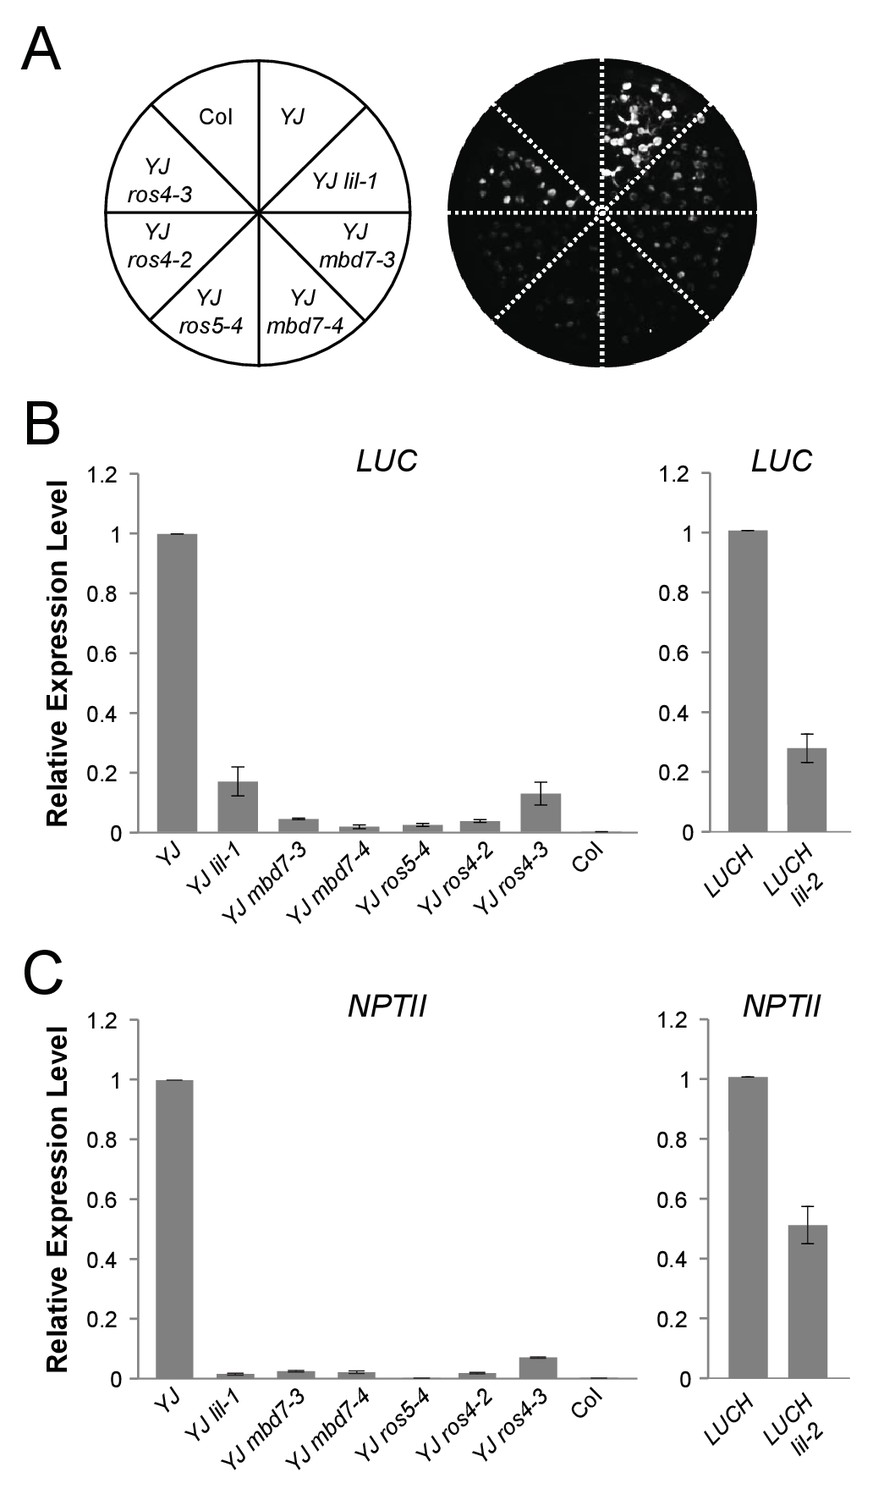
mbd7, ros4, and ros5 mutants phenocopy lil-1 at the YJ transgene.
(A) Luciferase (LUC) luminescence in 10-day-old seedlings as diagramed on the left. (B) Quantification of LUC or (C) NPTII transcript levels by RT-qPCR. Transcript levels were normalized to UBIQUITIN5 with the expression level of LUC or NPTII in the YJ or LUCH controls set to one. Error bars indicate the standard deviation from two biological replicates.
Figure 2—figure supplement 1
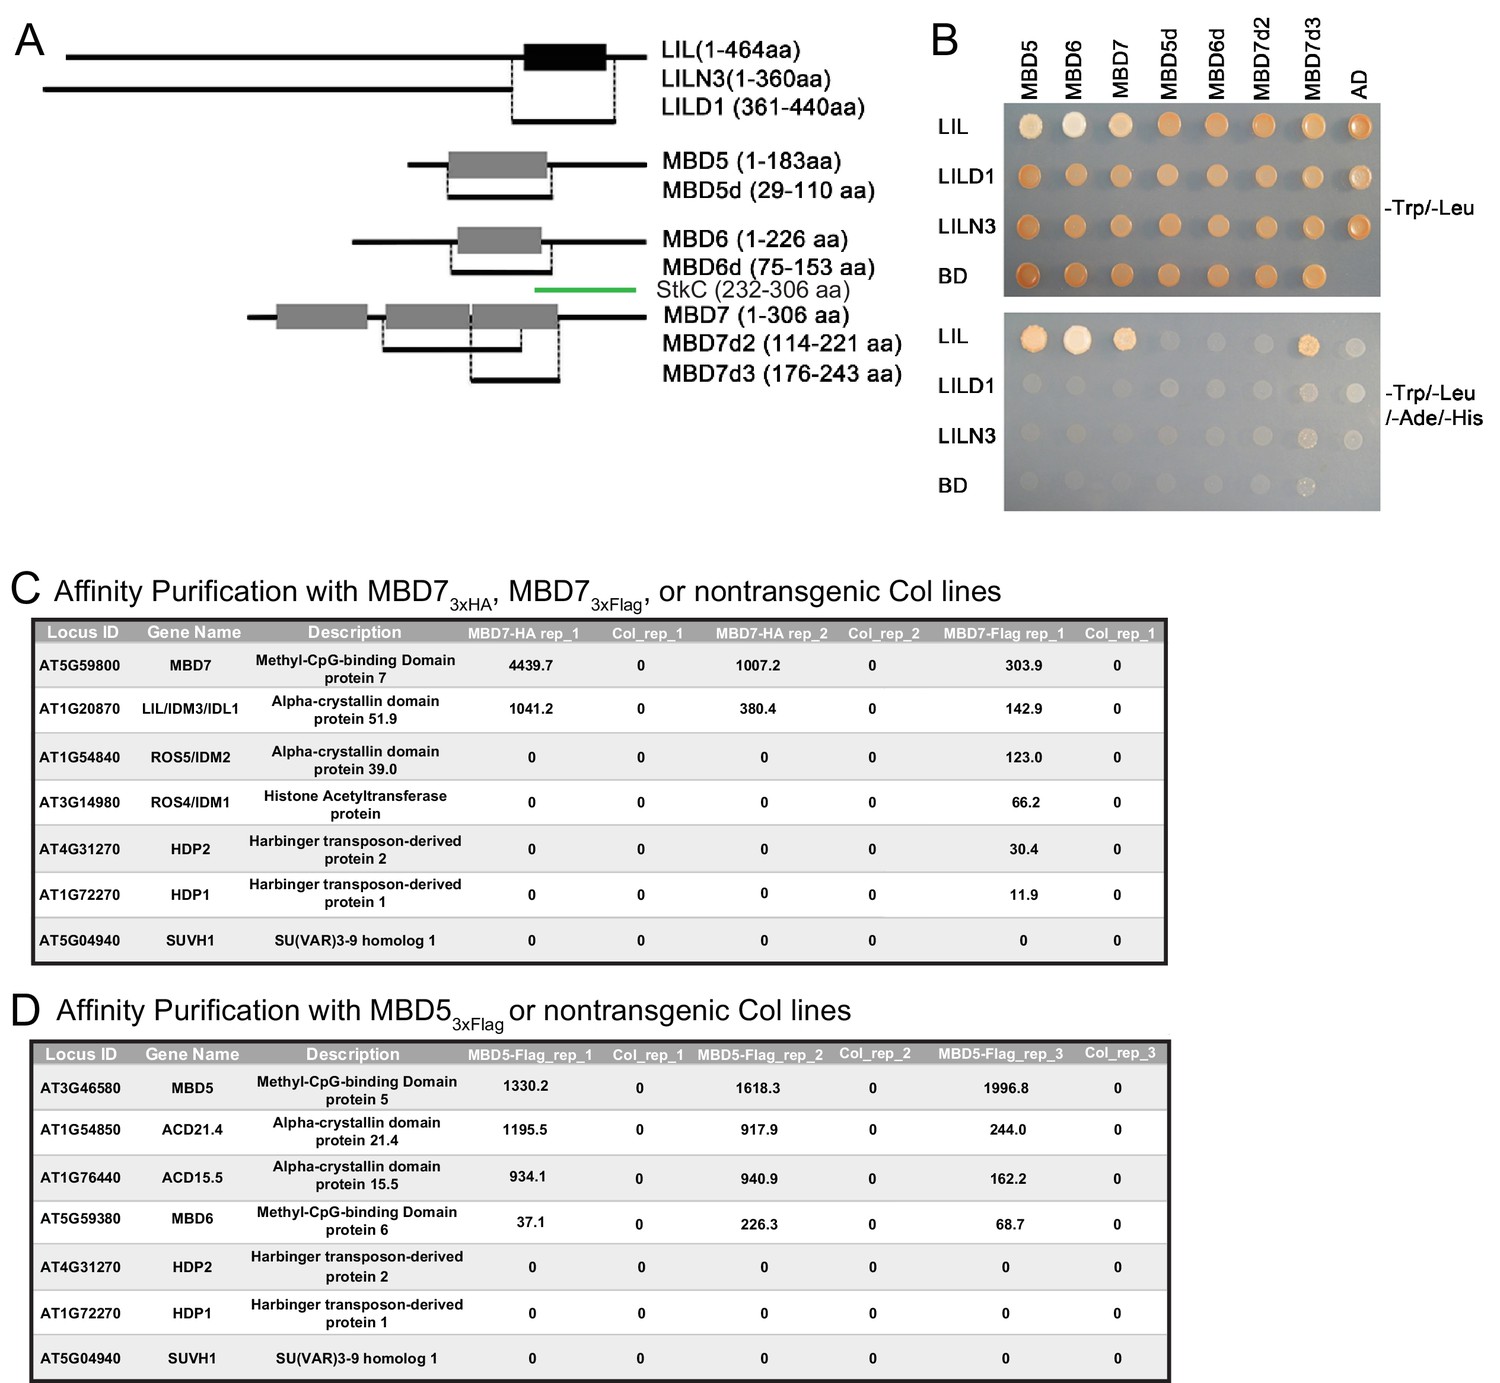
Yeast two-hybrid and affinity purification analyses.
(A) Diagrams of the yeast two-hybrid constructs used in (B). Full-length or partial fragments of LIL or MBD proteins were fused to the GAL4 DNA binding domain (BD) or the GAL4 activation domain (AD) sequences, respectively. The black box indicates the region of LIL encoding the ACD/HSP20-like chaperone domain. Grey boxes indicate methyl-CpG-binding domains. The green bar corresponds to the StkC region of MBD7. aa, amino acid. (B) Yeast two-hybrid interactions. LIL-BD and MBD-AD plasmids were co-transformed into the yeast strain AH109. Yeast growth on -Trp/-Leu plates confirms the transformation of both plasmids into yeast. Yeast growth on -Trp/-Leu/-Ade/-His plates indicates protein interactions. (C) Table of proteins that specifically co-purify with MBD7 following HA or Flag affinity purification and MudPit Mass Spectrometry from two biological replicates (rep_1 and rep_2) or a single purification (rep1), respectively. (D) Table of proteins that specifically co-purify with MBD5 following Flag affinity purification and MudPit Mass Spectrometry from three biological replicates (rep_1, rep_2 and rep_3). In (C) and (D), affinity purifications were conducted using protein extracted from transgenic plants expressing either MBD7-3xHA, MBD7-3xFlag (C) or MBD5-3xFlag (D) and non-transgenic plants of the Col ecotype as a negative control. Values shown are the normalized spectral abundance factors (NSAF) (Florens et al., 2006).
Figure 2—figure supplement 2
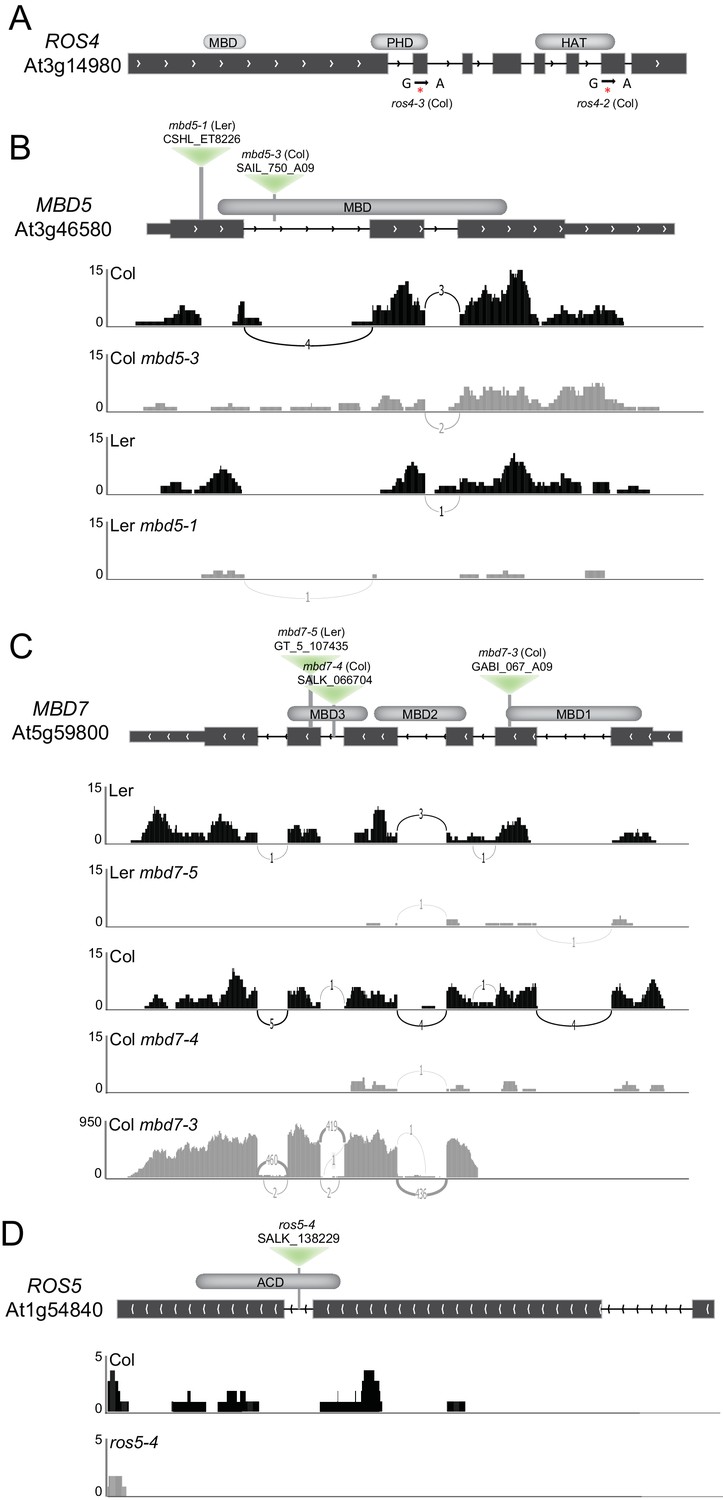
Isolation and characterization of ros4, mbd5, mbd7, and ros5 mutants.
(A) Schematic diagram showing the positions of the two mutations in the ROS4 gene isolated in the YJ screen. Both the ros4-2 and ros4-3 alleles contain G-to-A mutations that result in the generation of stop codons at amino acids 988 and 763, respectively. (B–D) Schematic diagrams showing the sites of the mbd5 (B), mbd7 (C), and ros5 (D) T-DNA insertions (inverted green triangles) and genome browser tracks (Sashimi plots; https://software.broadinstitute.org/software/igv/Sashimi) showing the mRNA sequencing reads mapping to these genes. Genotypes (upper left) and data ranges (left) are indicated for each track. Chevron symbols indicate the direction of the gene, the thick and thin black boxes represent the exons and UTRs, respectively, and the black lines represent introns. The lines connecting the exons are labeled with the number of reads supporting splice junctions. The methyl-CpG-binding domains (MBDs), alpha crystallin domain (ACD), plant homeodomain (PHD), and histone acetyltransferase domains (HAT) are indicated in grey above the diagrams.
Figure 2—figure supplement 3
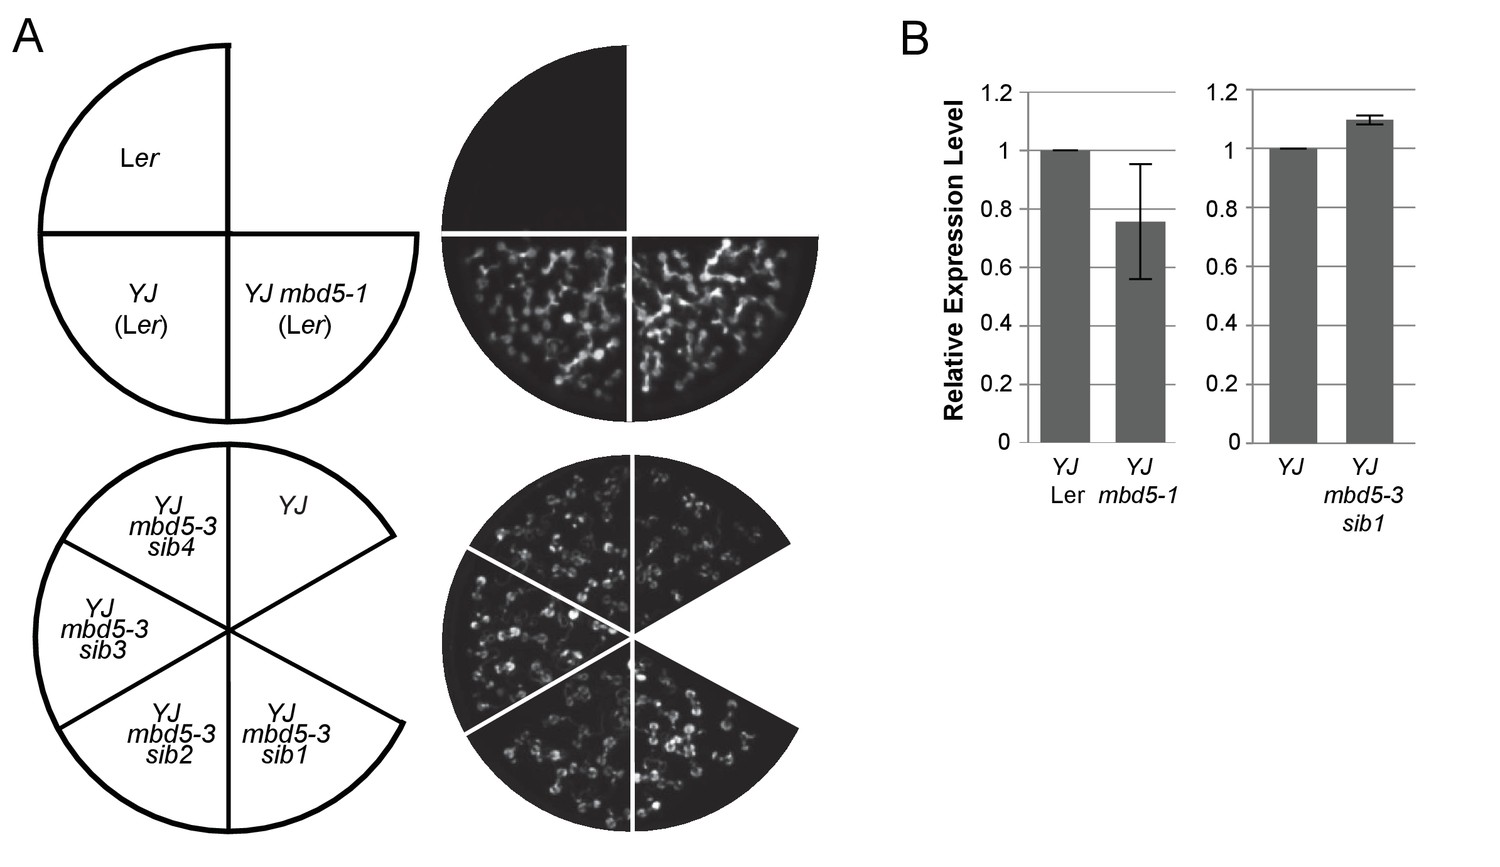
mbd5 mutants do not exhibit reduced LUC expression.
(A) Luciferase (LUC) luminescence in 10-day-old seedlings as diagramed on the left. (B) Quantification of LUC transcript levels by RT-qPCR. LUC transcript levels were normalized to UBIQUITIN5 with the expression level of LUC in the YJ control set to one. Error bars indicate the standard deviation from two biological replicates. ‘mbd5-sib#’ represent sibling plant lines of the indicated T-DNA mutant allele.
Figure 3
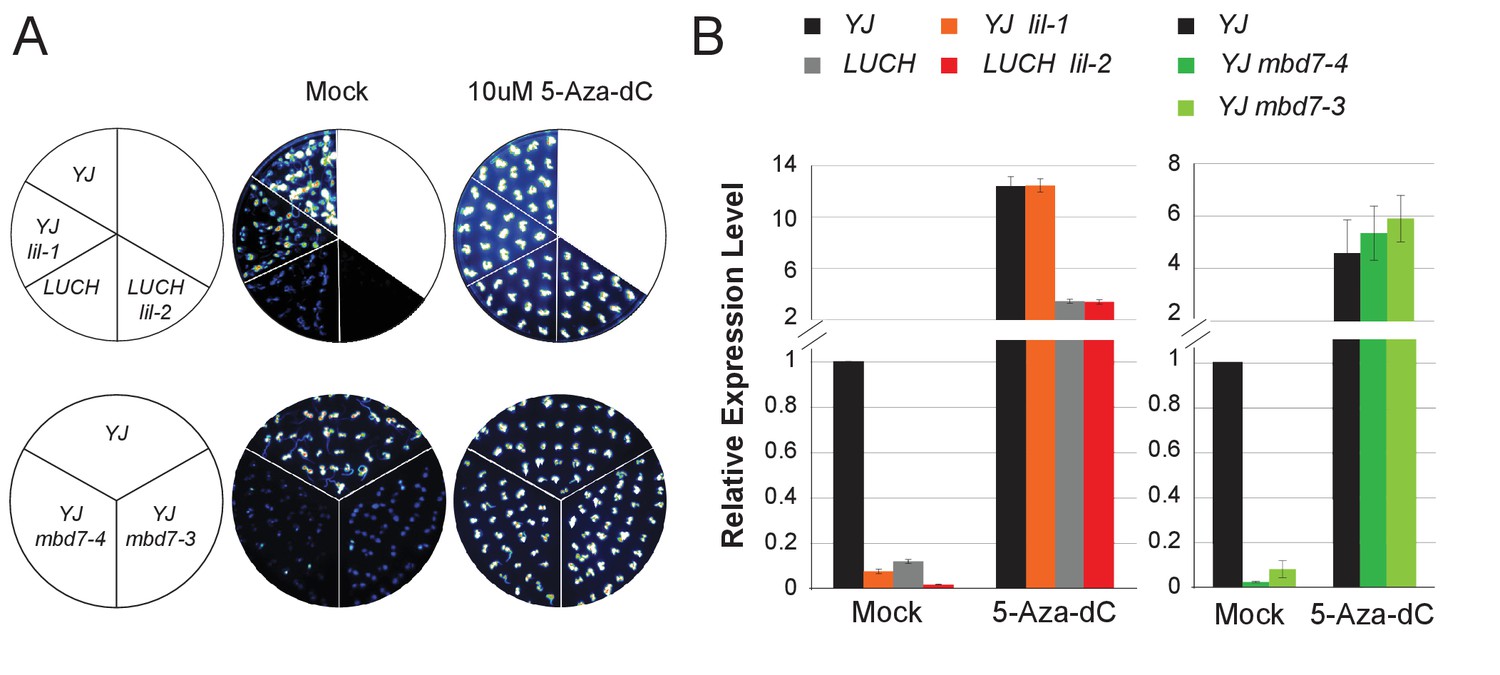
MBD7 and LIL regulate LUC expression in a DNA methylation-dependent manner.
(A) Luciferase luminescence of mock or 5-aza-2’-deoxycytidine (5-Aza-dC)-treated seedlings as diagramed on the left. (B) Quantification of LUC transcript levels by RT-qPCR. LUC transcript levels were normalized to UBIQUITIN5 with the expression level of LUC in the YJ control set to one. Error bars indicate the standard deviation from three biological replicates for the mbd7 datasets and three technical replicates for the lil dataset.
Figure 4 with 1 supplement
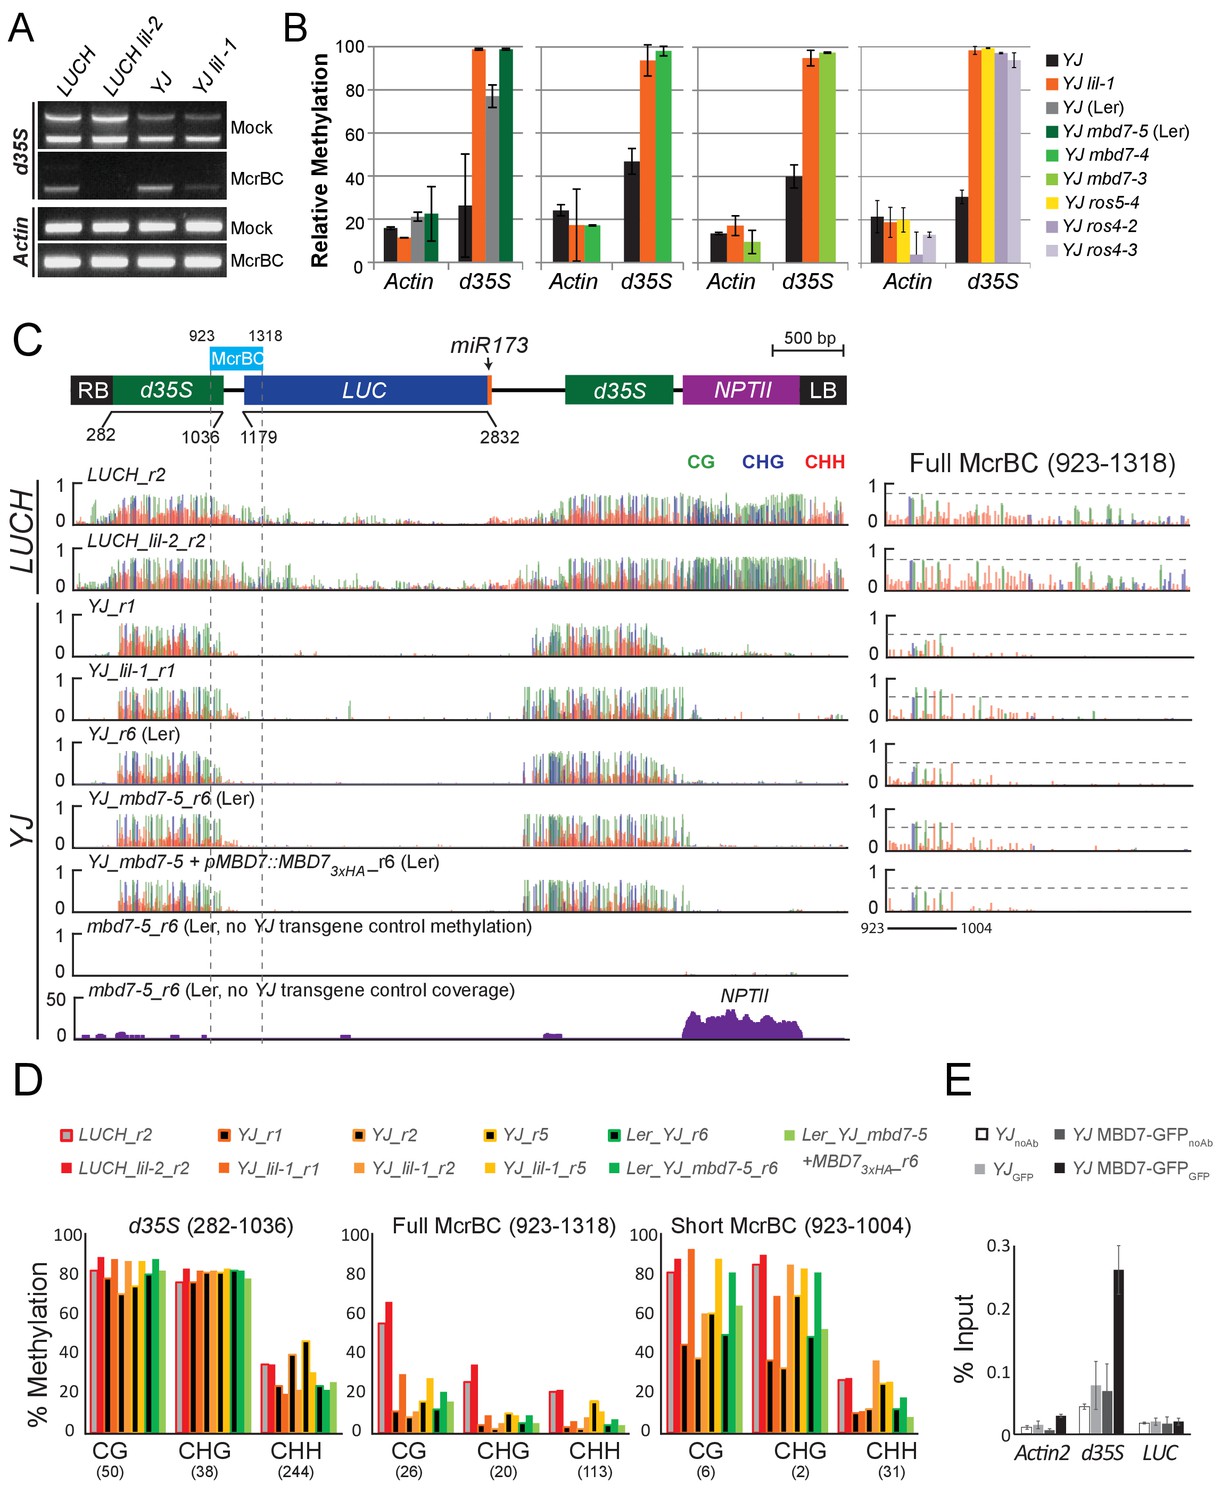
Disruption of the MBD7 complex results in subtle, but reproducible hyper-methylation at the d35S promoter.
Cytosine methylation analysis by McrBC-PCR (A) and McrBC-qPCR (B) using mock or McrBC treated genomic DNA from the indicated genotypes. In (A), two tandem copies of the 35S sequence result in two PCR bands. ACTIN1, which lacks methylation, was used as the internal loading control. In (B), the relative methylation levels are plotted and the error bars indicate the standard deviation from two biological replicates. (C) A diagram of the YJ reporter drawn to scale relative to the browser tracks shown directly below. The light blue box indicates the region amplified for the McrBC assay. This region is expanded in the far right panel. DNA methylation tracks show the DNA methylation level (0–1, where 1 = 100% methylated) in the CG (green), CHG (blue), and CHH (red) sequence contexts at cytosines covered by at least five reads. The LUCH_r2 and YJ_r1 tracks correspond to those shown in Figure 1—figure supplement 1. The YJ mbd7-5 + pMBD7::MBD7-3xHA_r6 (Ler) line corresponds to the ‘ins1a’ line characterized in Figure 4—figure supplement 1. The coverage track for mbd7-5_r6 (bottom) shows the number of reads (y-axis) mapped to the transgene, demonstrating that sequence homology between the T-DNA in the mbd7-5 mutant and the LUC reporter is largely limited to the NPTII drug resistance gene. To facilitate visual assessment of the changes in DNA methylation, dashed horizontal lines are set relative to the maximal CG methylation at the 3’ end of the d35S promoter in the control LUCH and YJ reporters. (D) Quantification of the average percent methylation across the entire d35S promoter (282–1036), the Full McrBC region (923–1318) or a Short MrcBC region (923–1004) within the YJ transgene in the lines presented in (C). Each sample is appended with an ‘r#’ to indicate samples that were processed and sequenced together. Identical genotypes with different r#’s indicate biological replicates (e.g., YJ_r1, YJ_r2, and YJ_r5 are biological replicates). The number of cytosines in each sequence context within the quantified regions is indicated in parentheses. Note that the two d35S promoters driving LUC and NPTII are 94% identical in sequences, thus the DNA methylation data includes both multi-mapping and unique reads. (E) ChIP-qPCR showing enrichment of MBD7-GFP at the d35S promoter driving LUC expression at the YJ reporter. The data represents the average enrichment from three biological replicates as a percentage of the input and the error bars represent the standard deviation between replicates.
Figure 4—figure supplement 1

Complementation of the mbd7-5 phenotype with MBD7-3xHA.
(A) Luciferase luminescence in YJ, YJ mbd7-5, and YJ mbd7-5 MBD7-3xHA seedlings as diagramed on the left. Ins # indicates independent, single-locus insertion lines tested. (B) Quantification of LUC transcript levels by RT-qPCR. LUC transcript levels were normalized to UBIQUITIN5 with the expression level of LUC in the YJ control set to one. Error bars indicate the standard deviation from two biological replicates. (C) Western blot showing the relative abundance of the MBD7-3xHA protein in each complementing line. (*) indicates a non-specific background protein that served as an internal loading control. (D) Cytosine methylation analysis by McrBC-qPCR. Genomic DNA was treated with McrBC or mock treated in parallel reactions prior to qPCR amplification of the d35S promoter region of the LUC gene. ACTIN1, which lacks methylation, was used as the internal negative control. Error bars indicate the standard deviation from two biological replicates.
Figure 5 with 1 supplement
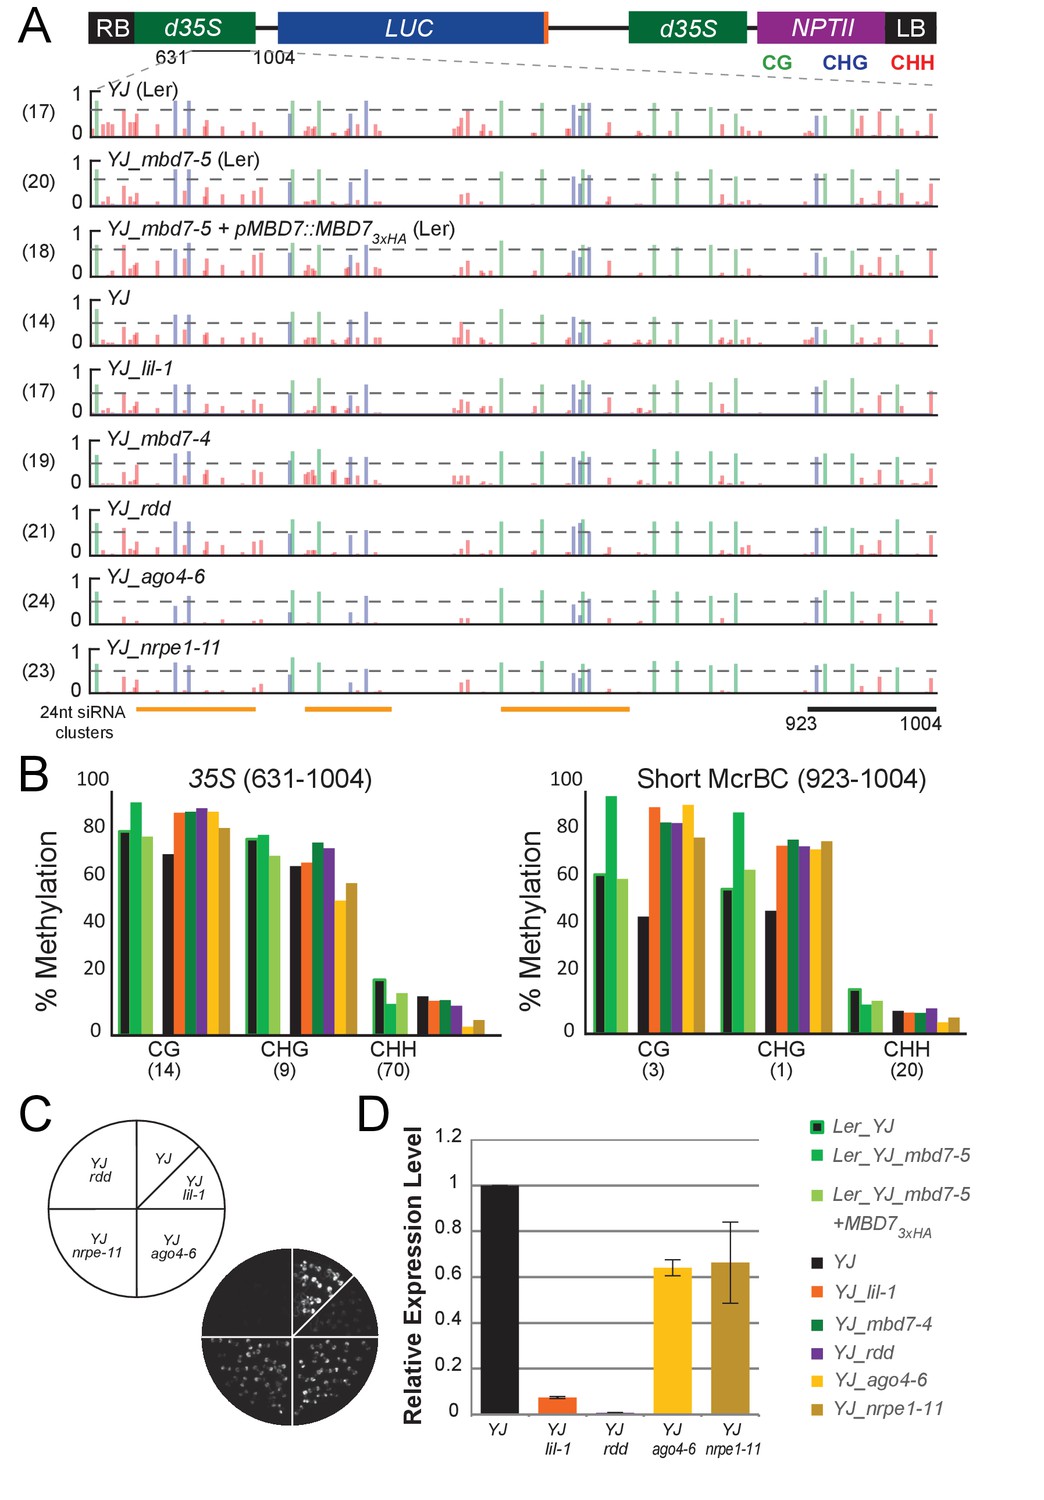
Genetic uncoupling of the DNA methylation and LUC expression phenotypes at the YJ reporter.
(A) Diagram of the YJ transgene indicating the region examined by traditional bisulfite sequencing (631–1004). DNA methylation tracks show the DNA methylation level (0–1, where 1 = 100% methylated) in the CG (green), CHG (blue) and CHH (red) sequence contexts. The tracks represent the average methylation at each position. The number of clones per genotype is indicated in parentheses to the left of each track. The orange bars below the methylation tracks denote regions that produce 24-nt siRNA clusters. The dashed horizontal lines spanning the methylation tracks are set relative to the maximal CG methylation at the 3’ end of the d35S promoter in the YJ reporter to facilitate visual assessment of the changes in DNA methylation in the mutant backgrounds. (B) Quantification of the average percent methylation across the second 35S promoter (631–1004) or a shorter region at the 3’ end of the 35S promoter (923–1004) within the YJ transgene in the lines presented in (A). The number of cytosines in each sequence context within the quantified regions is indicated in parentheses. Note that these numbers differ from those presented in Figure 4 since the traditional bisulfite sequencing only captures methylation on one strand. (C) Luciferase luminescence of 10-day-old seedlings as diagramed on the left. (D) Quantification of LUC transcript levels by RT-qPCR. LUC transcript levels were normalized to UBIQUITIN5 with the expression level of LUC in the YJ control set to one. Error bars indicate the standard deviation from two biological replicates.
Figure 5—figure supplement 1

Traditional bisulfite sequencing at the YJ reporter.
CyMATE (Hetzl et al., 2007) alignments showing the methylation patterns at the 3’ half of the dual 35S promoter driving LUC expression in the YJ reporter. For each sample set, the genotypes are indicated on the left and the reference sequence is shown in grey. Methylated (filled) or unmethylated (open) cytosines are shown for each C in the CG (green circles), CHG (blue squares) and CHH (red triangles) contexts. The region hyper-methylated in the mbd7, lil and rdd mutants is shown in red above the alignment. Missing symbols indicate ambiguities in the sequencing results.
Figure 6 with 4 supplements
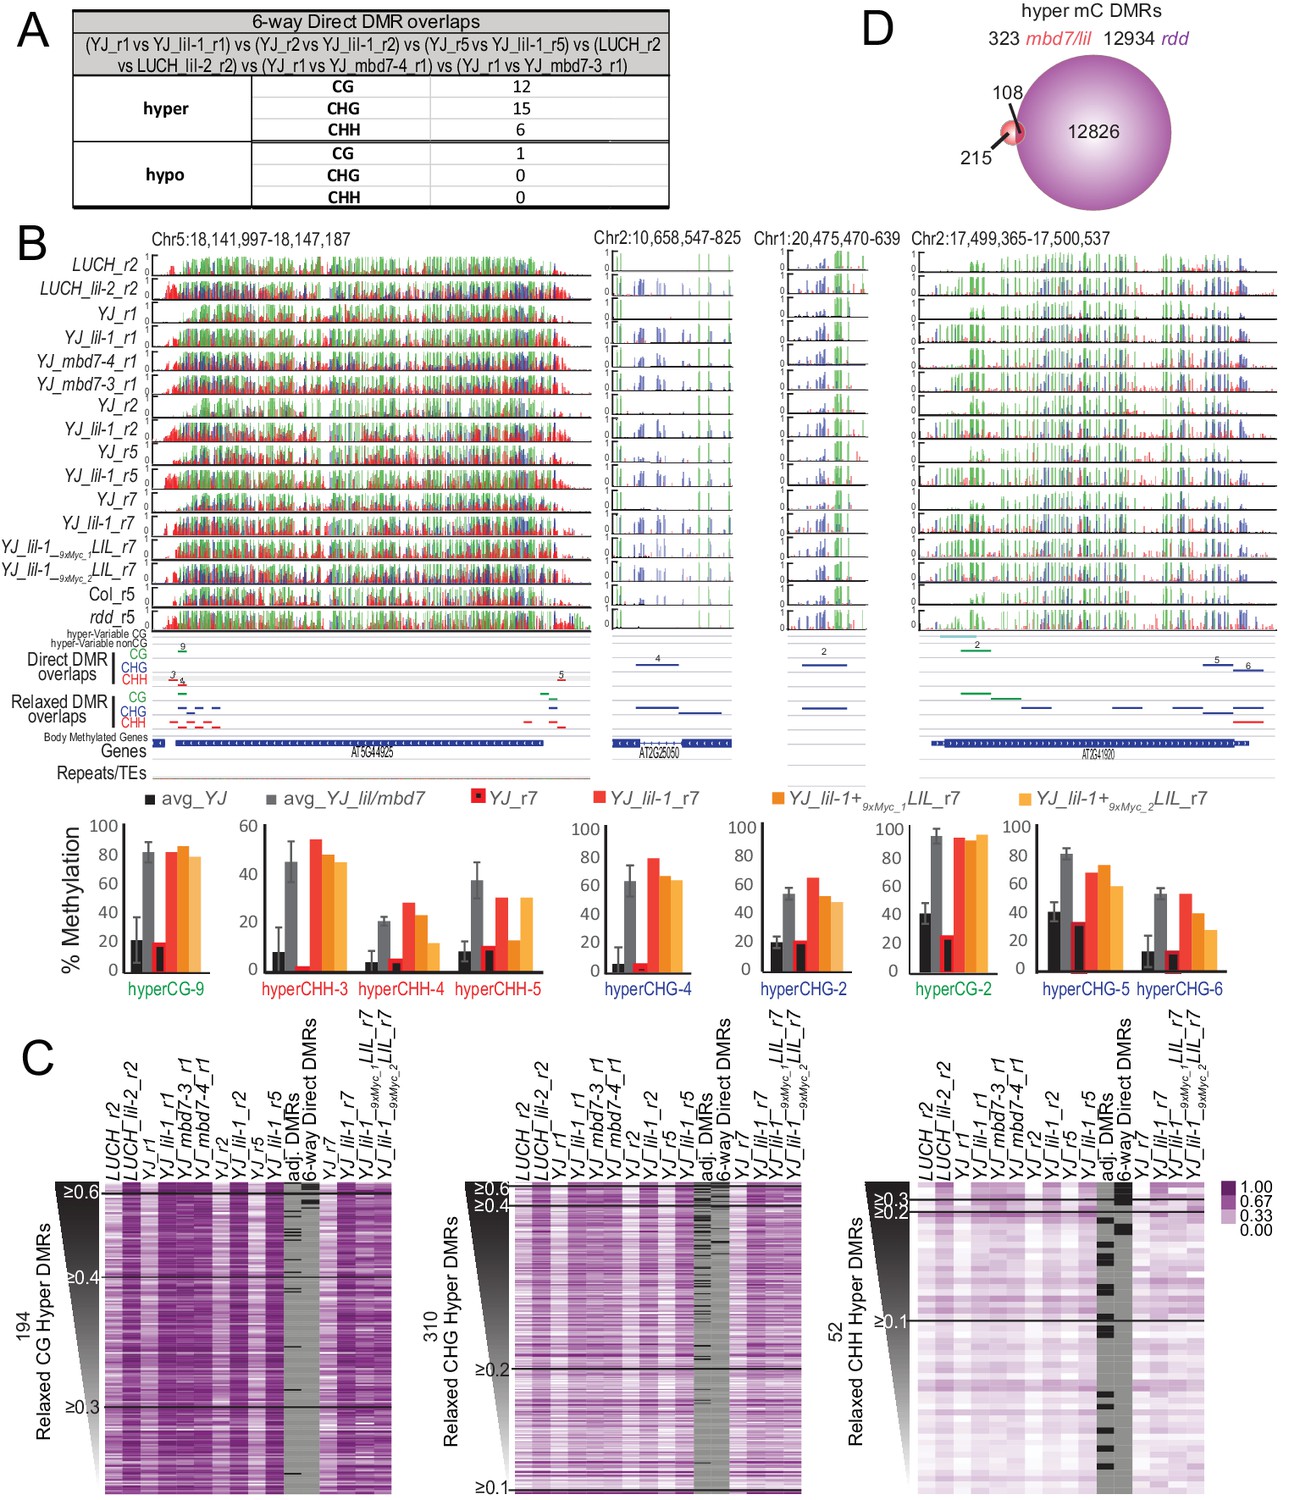
Genomic DMRs identified in the lil and mbd7 mutants.
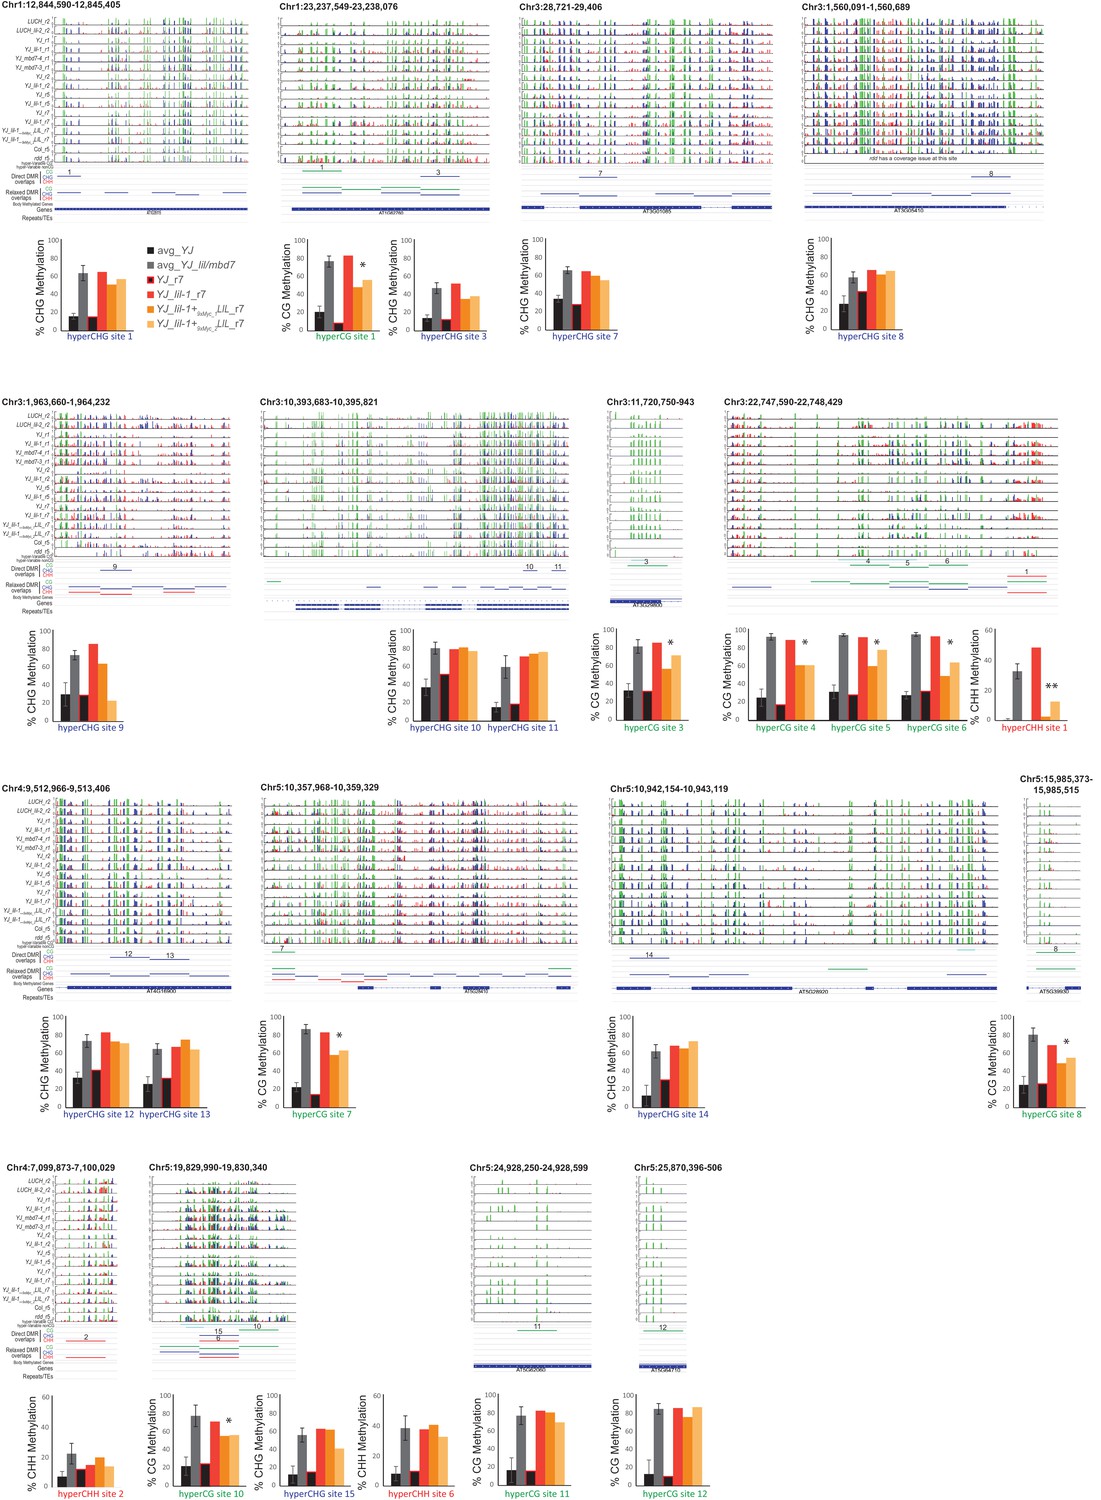
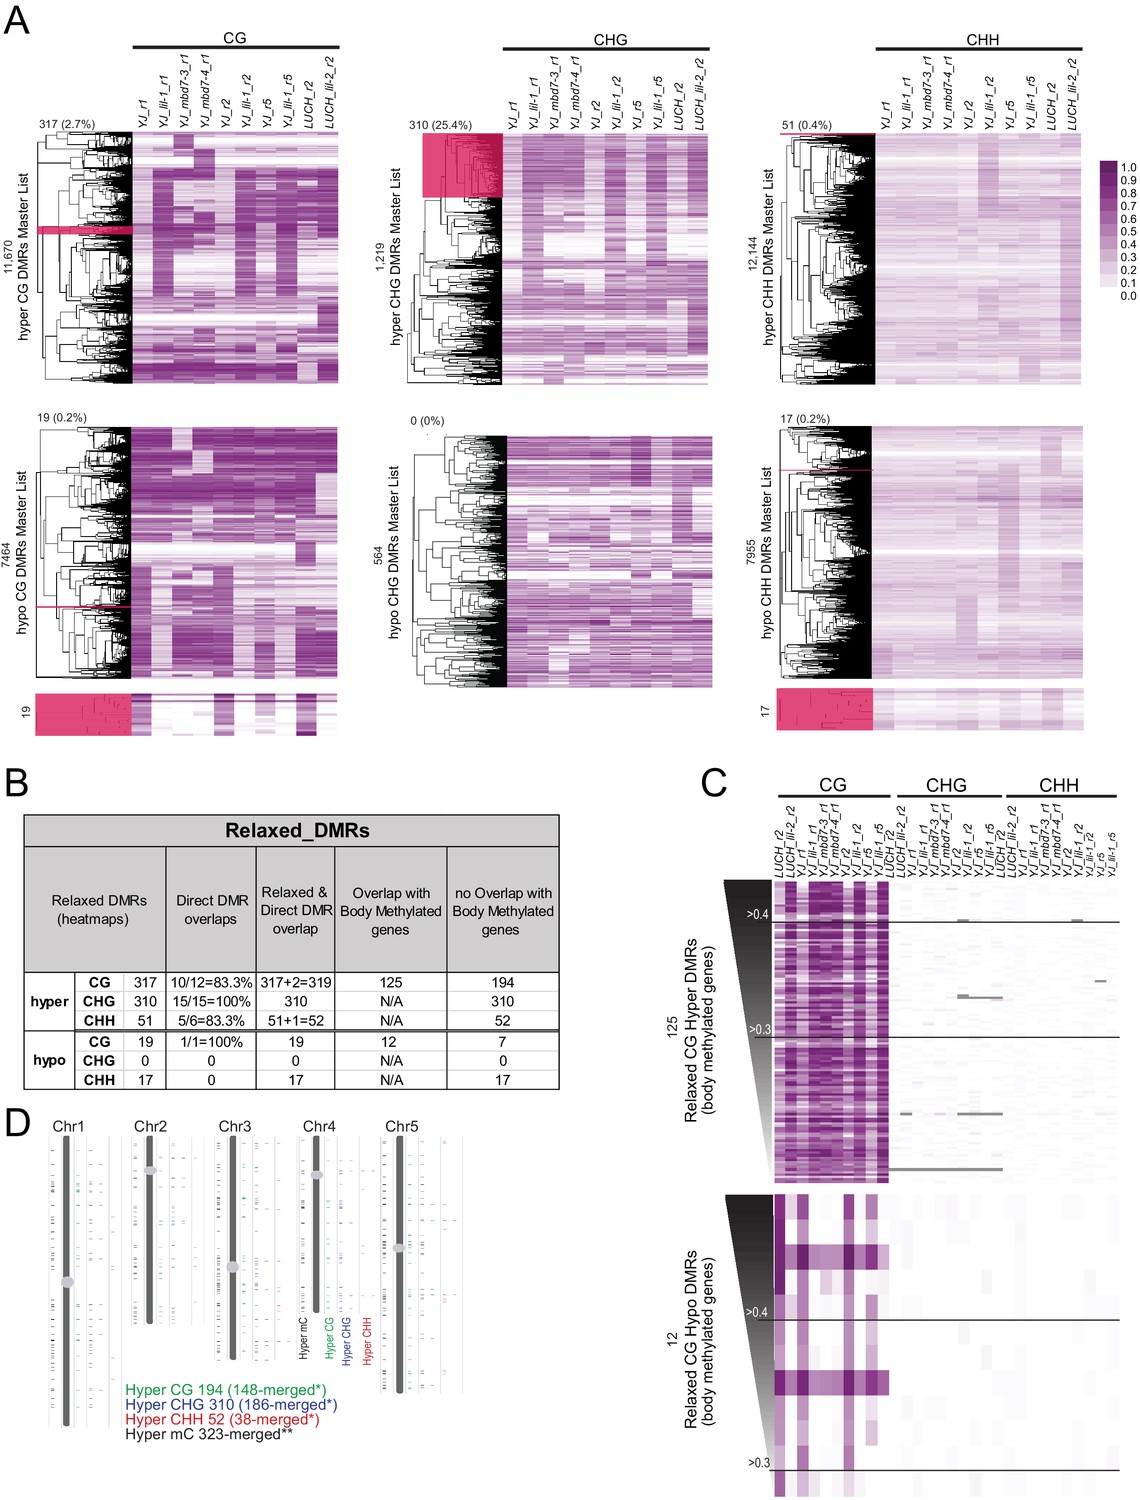
(A) Table summarizing DMRs that overlap among all the lil and mbd7 datasets ‘6-way Direct DMR overlaps’. (B) Screenshots showing the DNA methylation levels (0–1, where 1 = 100% methylated, with CG, CHG and CHH contexts in green, blue and red, respectively) at several DMRs in the genotypes indicated on the left. Below the DNA methylation tracks are the following additional features: (1) hyper-variable DMRs in the CG and non-CG contexts from Schmitz et al. (2011), (2) hyper DMRs in the CG, CHG and CHH contexts that overlap amongst all the lil and mbd7 datasets (‘Direct DMR overlaps’), (3) an expanded set of DMRs identified as detailed in (C) and in Figure 6—figure supplement 2 (‘Relaxed DMR overlaps’), (4) body methylated genes as described in Takuno and Gaut (2012), and (5) TAIR10 annotated genes and repeats. The percent methylation over each DMR is quantified in the bar graphs below. The average levels of methylation in controls vs. the mbd7 and lil DMRs are shown in black and grey, respectively. The error bars represent the standard deviation to capture the level of variation between samples. The levels of methylation in the MycLIL complementation data set are also indicted. (C) Heatmaps showing the methylation levels at DMRs called using a relaxed set of criteria (e.g., DMRs where all of the samples show hyper-methylation in the CHG context, but some are slightly below the required 20% change cutoff). The hyper DMRs are ranked from most to least robust and changes in methylation ≥0.6, ≥0.4, ≥0.3, ≥0.2 and≥0.1 are indicated. The DMRs indicated in panel A (‘6-way_Direct DMRs’) and the less stringent DMRs that map to genomic regions adjacent to the direct DMRs (‘adj. DMRs’) are demarcated by black boxes on the heatmaps. (D) Venn diagram showing the hyper mC DMRs (see Materials and methods) shared between the mbd7 and lil mutants (red) that overlap with DMRs identified in the rdd triple mutant (purple).
Figure 6—figure supplement 1
Visualization and quantification of DNA methylation at the direct overlap DMRs.
Screenshots showing the DNA methylation levels (0–1, where 1 = 100% methylated with CG, CHG and CHH contexts in green, blue and red, respectively) at several DMRs in the genotypes indicated on the left. Below the methylated regions are tracks showing the following additional features: (1) hyper-variable DMRs in the CG and non-CG contexts from Schmitz et al. (2011), (2) hyper DMRs in the CG, CHG and CHH contexts that overlap amongst all the lil and mbd7 datasets (‘Direct DMR overlaps’), (3) an expanded set of DMRs identified as detailed in Figure 6—figure supplement 2 (‘Relaxed DMR overlaps’), (4) body methylated genes as described in Takuno and Gaut (2012), and (5) TAIR10 annotated genes and repeats. The percent methylation over each DMR is quantified in the bar graphs below. The average levels of methylation in controls versus the mbd7 and lil DMRs are shown in black and grey, respectively. The error bars represent the standard deviation to capture the level of variation between samples. The levels of methylation in the MycLIL complementation data set are also indicted. DMRs that show a consistent decrease in DNA methylation upon re-introduction of a functional LIL protein that falls significantly outside the levels of variation shown within the mbd7 and lil mutants are marked with an asterisk (*).
Figure 6—figure supplement 2
Identification of a more relaxed set of DMRs conserved amongst the mbd7 and lil datasets.
(A) A complete set of all DMRs called in each context (hyper or hypo CG, CHG and CHH) amongst all the mbd7 and lil alleles and biological replicates were compiled and the levels of DNA methylation at these DMRs were calculated and clustered as shown in the six heatmaps. The levels of DNA methylation in each 100 bp region are indicated in the legend on the right. Clusters that behaved similarly across all samples (without imposing fold change or coverage cut-offs) are highlighted in dark pink and represent the set of ‘relaxed DMRs’. The number of DMRs in the highlighted region, as well as the fraction of the total DMRs these relaxed DMRs represent, is indicted above the clustering tree. In cases where the selected cluster is too small to visualize, an expanded view is shown below. (B) Table showing a comparison of the direct and relaxed DMRs. Hyper and hypo CG regions that overlap with body methylated genes (Takuno and Gaut, 2012) are indicated. (C) Heatmaps showing the levels of DNA methylation in each sequence context at the identified DMRs. These heatmaps are ranked and labeled as described in Figure 6 and colored as indicated in (A). (D) Chromosome views showing the locations of hyper DMRs in each sequence context (CG, green; CHG blue; and CHH, red). The DMRs are shown as expanded views on the right to highlight 100 bp DMRs that cluster together. The view on the left shows the chromosomal distribution of all the DMRs regardless of context. *indicates that DMRs of the same methylation context within 300 bp of each other were merged. **indicates that directly adjacent DMRs, regardless of the methylation context, were merged.
Figure 6—figure supplement 3
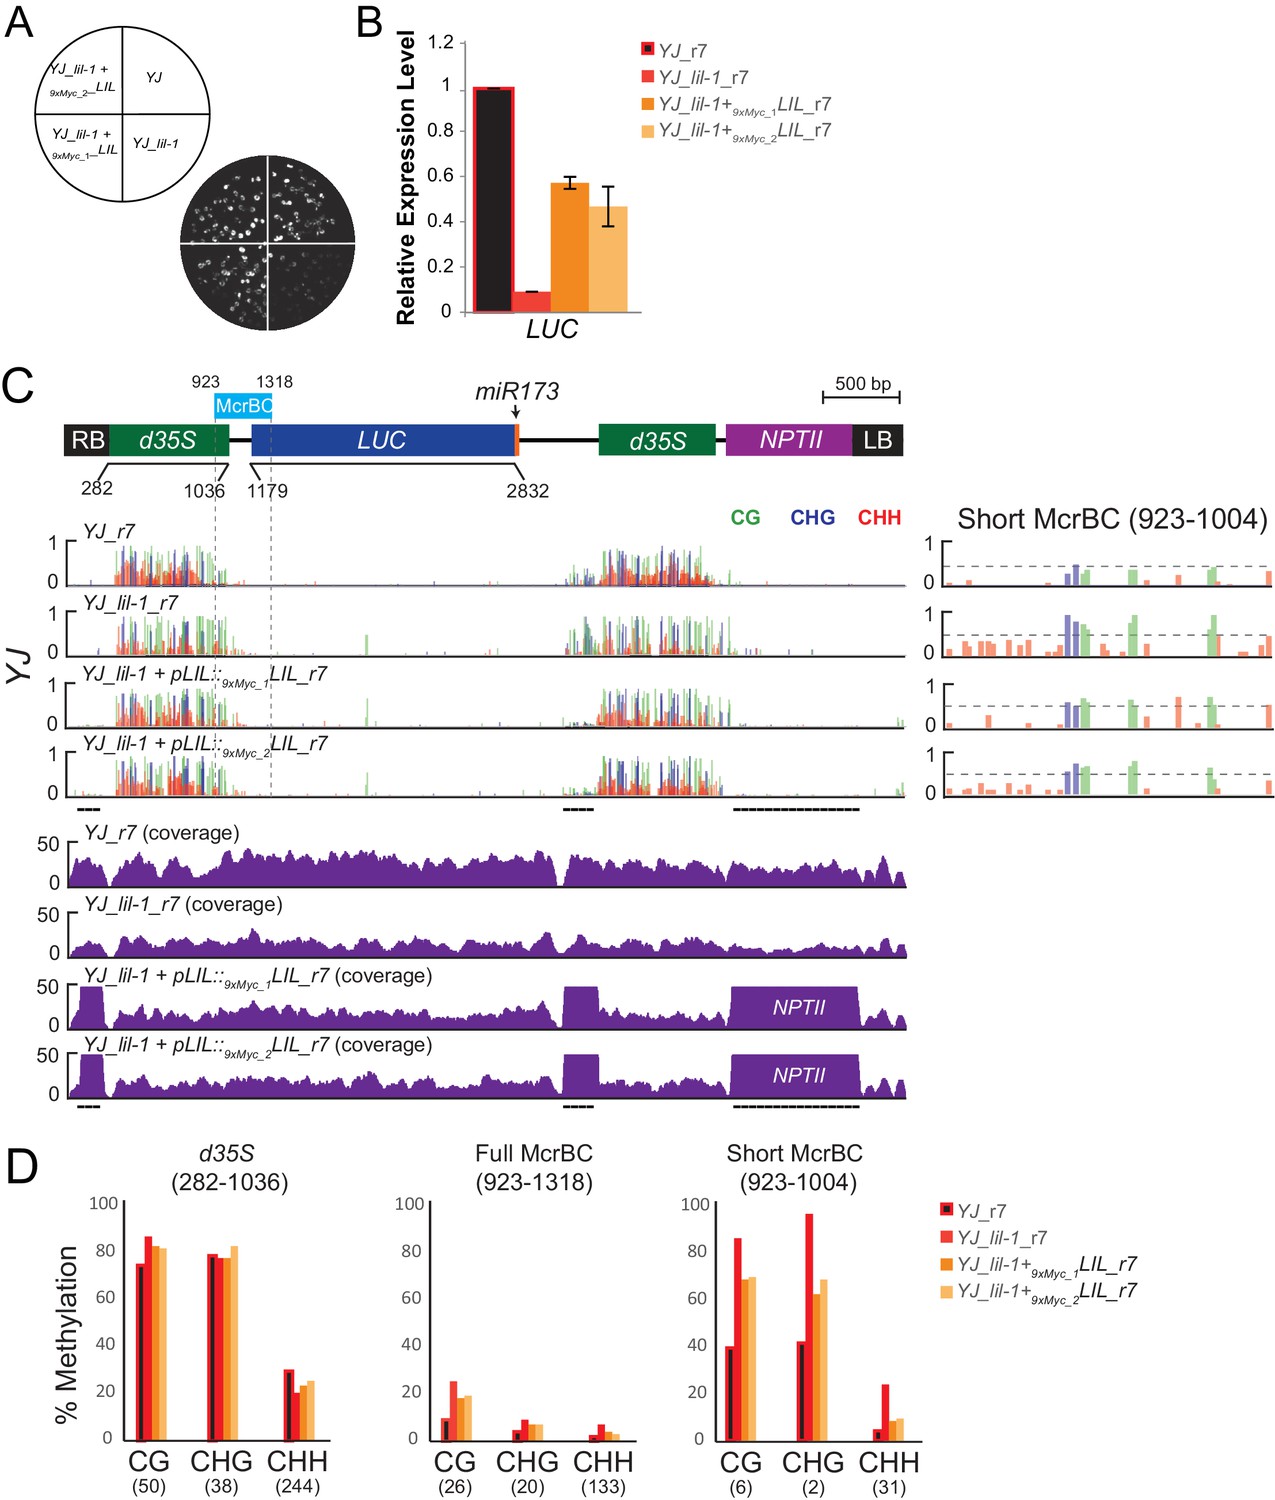
Complementation of the lil-1 phenotype with 9xMyc-LIL.
(A) Luciferase (LUC) luminescence in YJ, YJ lil-1, and YJ lil-1 9xMyc-LIL seedlings as diagramed on the left. Two sibling, homozygous lines from the same single locus insertion event were analyzed (9xMyc_1 and 9xMyc_2). (B) Quantification of LUC transcript levels by RT-qPCR. LUC transcript levels were normalized to UBIQUITIN5 with the expression level of LUC in the YJ control set to one. Error bars indicate the standard deviation from two biological replicates. (C) A diagram of the transgene in the YJ reporter drawn to scale relative to browser tracks shown directly below. The region amplified for the McrBC assay is highlighted by the light blue box. DNA methylation tracks show the DNA methylation level (0–1, where 1 = 100% methylated) in the CG (green), CHG (blue), and CHH (red) sequence contexts at cytosines covered by at least five reads. The Short McrBC region is expanded in the far right panel. The dashed horizontal lines spanning these methylation tracks are set relative to the maximal CG methylation at the 3’ end of the d35S promoter in the YJ control to facilitate visual assessment of the changes in DNA methylation in the mutant backgrounds. Coverage tracks for all four genotypes are shown below. Regions of the YJ transgene that share homology with the transgene harboring the pLIL::9xMyc-LIL construct are underlined in black and are outside of the coverage scale (0–50 reads). Notably, these regions fall outside of the d35S promoters being assessed for changes in DNA methylation. (D) Quantification of the average percent methylation across the d35S promoter (282–1036), the Full McrBC region (923–1318) or a shorter MrcBC region (923–1004) within the YJ transgene in the lines presented in (C). The genotype of each sample is appended with an ‘r#’ to indicate samples that were processed and sequenced together. The number of cytosines in each sequence context within the quantified regions in (D) is indicated in parentheses. Note that the two d35S promoters driving LUC and NPTII are 94% identical in sequences, thus the DNA methylation data shown includes both multi-mapping and unique reads.
Figure 6—figure supplement 4

Gene expression at previously characterized loci in mbd7 and lil mutants.
(A) Normalized expression values (FPKM; fragments per kilobase mapped) of control and mutant RNA-seq samples at genes previously shown to be associated with hyper DMRs and to display reduced expression by qPCR in mutants of the MBD7 complex (Lang et al., 2015; Li et al., 2015b; Qian et al., 2014; Duan et al., 2017; Qian et al., 2012). Genes marked by an ‘a’ were assessed in Lang et al. (2015), ‘b’ in Qian et al. (2014), ‘c’ in Qian et al. (2012), ‘d’ in Duan et al. (2017) and ‘e’ in Li et al. (2015b) and the two genes marked by a ‘^' were assayed under heat stress conditions in Lang et al. (2015). The asterisk (*) marks the only gene consistently down-regulated (>2x) in any of the mutants tested.
Author response image 1

Expression of putative MBD7 targets in dry seeds.
Quantification of transcript levels by RT-qPCR using pooled dry seeds. Transcript levels were normalized to UBIQUITIN5 with the expression level of the target loci in the YJ and LUCH controls set to one. Error bars indicate the standard deviation from at least two biological replicates.
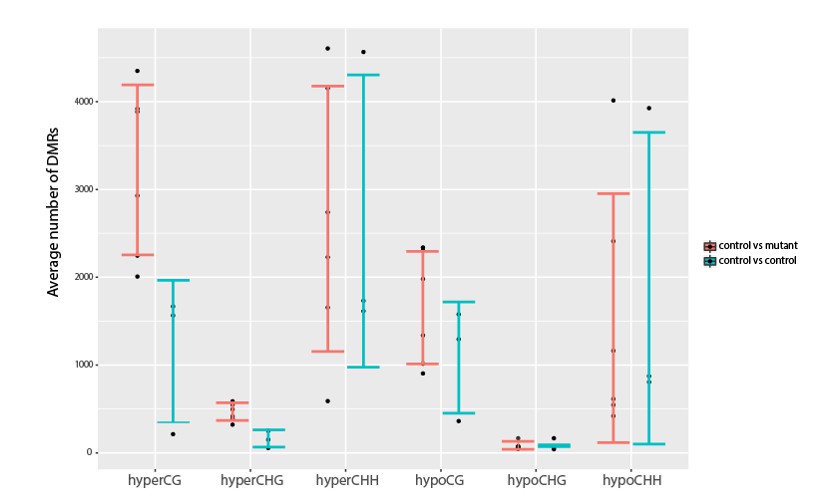
Author response image 2
Investigation into variation in DNA methylation.
Comparisons of the average number of DMRs observed between all pairwise combinations of three YJ replicates (YJ_r1, YJ_r5 and YJ_r7) or between all pairwise combinations of these controls and their corresponding YJ_lil data sets. Error bars represent the standard deviation as a measure of variance.
Additional files
-
Source code 1
Custom Perl script used to trim 3’ adapter sequences 839 from raw reads.
- https://doi.org/10.7554/eLife.19893.021
-
Supplementary file 1
MethylC-seq and smRNAseq data processing
(A) LUC reporter MethylC-seq mapping information. (B) LUC reporter MethylC-seq coverage. (C) LUC reporter mapping and coverage of small RNA data. (D) List of supplemental materials for LUC Reporter Genomics. (E) TAIR10 genome mapping and coverage information. (F) List of supplemental materials for the genome-wide analyses (TAIR10).
- https://doi.org/10.7554/eLife.19893.022
-
Supplementary file 2
DMRs and DMR overlaps
(A) Hyper and Hypo DMRs in the CG, CHG and CHH contexts. (B-F) Direct DMR overlaps in the various lil and mbd7 datasets corresponding to 2-way, 3-way, 4-way, 5-way, and 6-way overlaps, respectively. (G-J) six way DMR coordinates in the hyper CG, CHG, CHH and hypo CG contexts, respectively. (K-P) Master DMR coordinates in the hyper CG, CHG, CHH, and hypo CG, CHG, and CHH contexts, respectively. (Q-U) Relaxed DMR coordinates in the hyper CG, CHG, CHH, and hypo CG, CHG, and CHH contexts, respectively. (V) mbd7 and lil hyper DMRs, all mC contexts merged. (W) rdd hyper DMRs, all mC contexts merged.
- https://doi.org/10.7554/eLife.19893.023
-
Supplementary file 3
Analysis of lil and mbd7 RNAseq experiments.
- https://doi.org/10.7554/eLife.19893.024
-
Supplementary file 4
Primers.
- https://doi.org/10.7554/eLife.19893.025
Download links
A two-part list of links to download the article, or parts of the article, in various formats.
Downloads (link to download the article as PDF)
Open citations (links to open the citations from this article in various online reference manager services)
Cite this article (links to download the citations from this article in formats compatible with various reference manager tools)
The MBD7 complex promotes expression of methylated transgenes without significantly altering their methylation status
eLife 6:e19893.
https://doi.org/10.7554/eLife.19893


