IRBIT controls apoptosis by interacting with the Bcl-2 homolog, Bcl2l10, and by promoting ER-mitochondria contact
- RIKEN Brain Science institute, Japan
- School of Medicine Hokkaido University, Japan
Figures
Figure 1
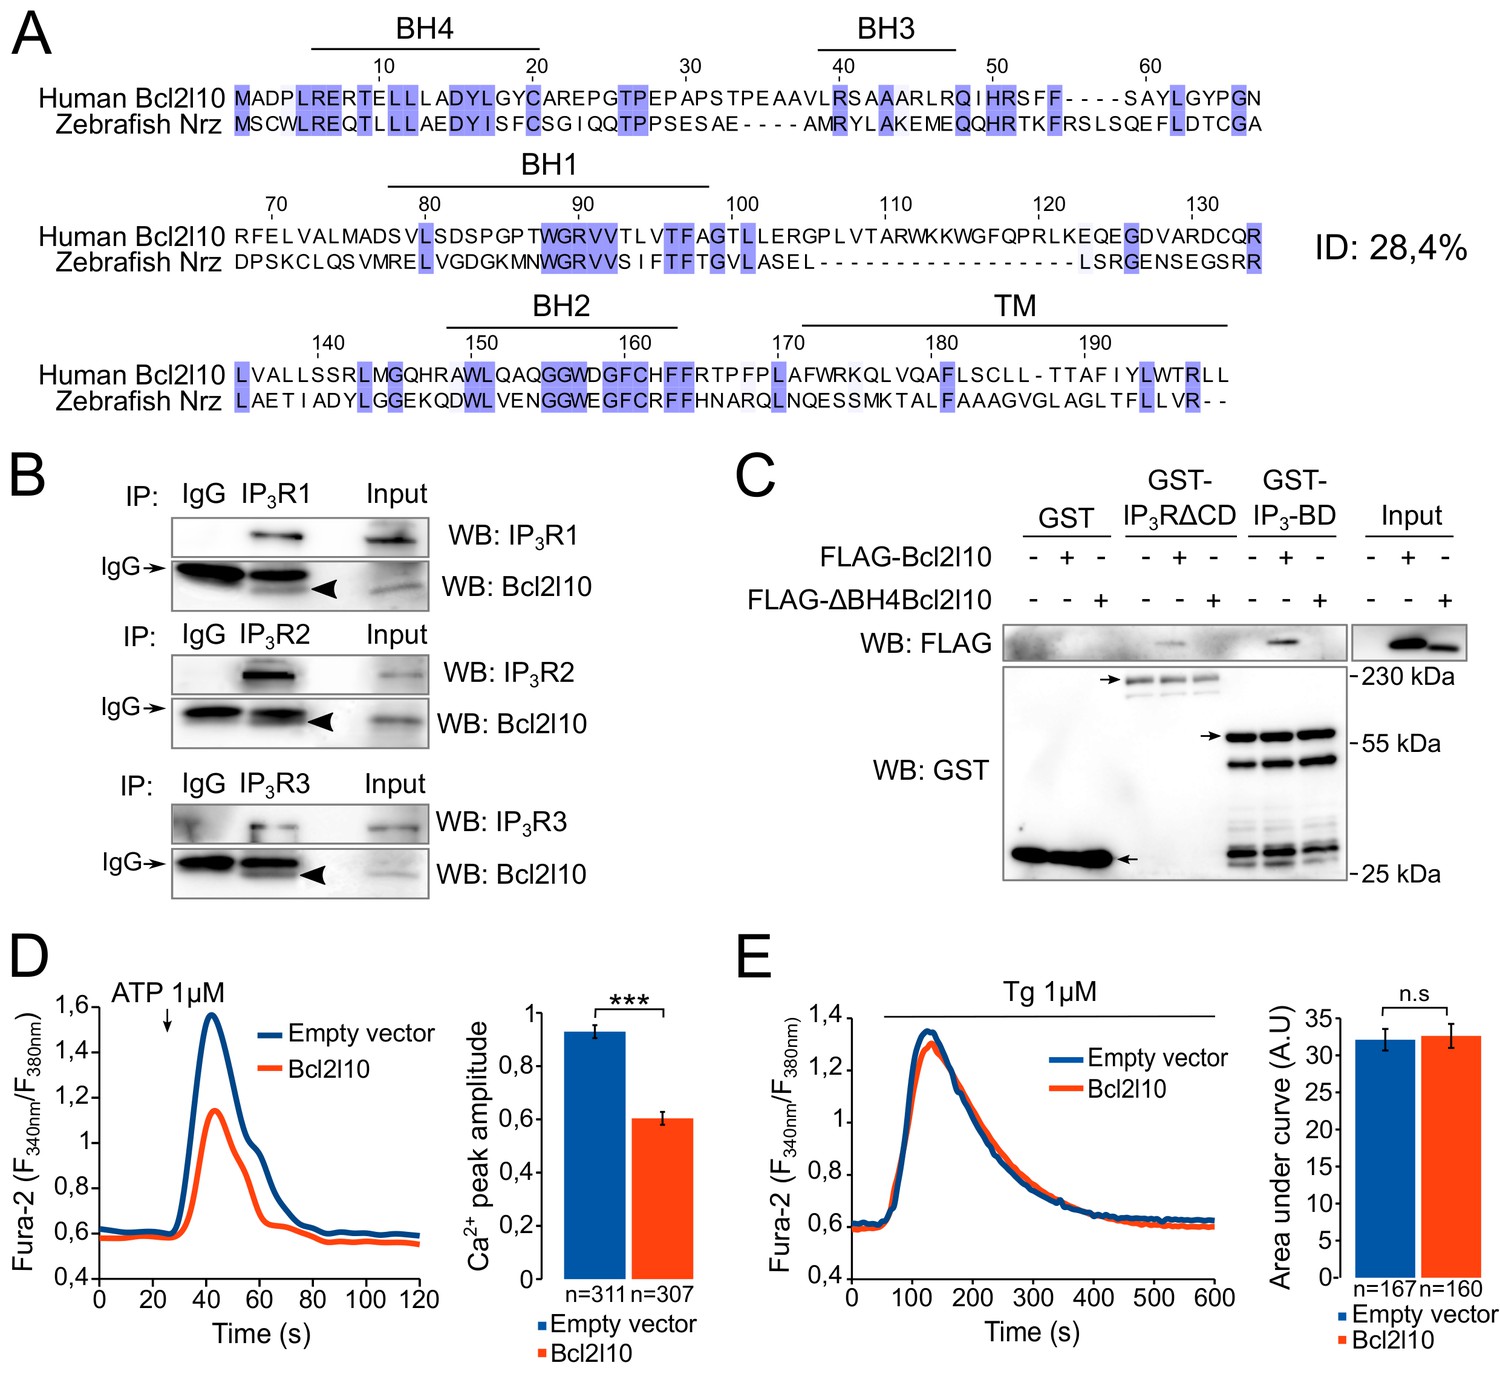
Bcl2l10 interacts with and regulates IP3R.
(A) Clustal Omega alignment of human Bcl2l10 and zebrafish Nrz primary structures. Identical residues are boxed in blue. The positions of conserved Bcl-2 homology (BH) domains and of the C-terminal transmembrane (TM) domain are indicated. (B) Western blot of immunoprecipitation (IP) between the three endogenous IP3R isoforms (IP3R1, IP3R2 and IP3R3) and endogenous Bcl2l10. IgG antibodies are indicated by arrows. Arrow heads indicate bands corresponding to Bcl2l10 in IP. Western blots are representative of three independent experiments. (C) Western blot of GST-pulldown performed with GST, GST-IP3R∆CD or GST-IP3BD on lysates of HeLa cells expressing FLAG-Bcl2l10 or FLAG-∆BH4Bcl2l10. Arrows indicate the bands corresponding to GST, GST-IP3R∆CD and GST-IP3BD. Western blot representative of three independents experiments. (D) Left panel: representative Ca2+ response curve of Fura-2-loaded cells stimulated with 1 µM ATP at the indicated times. Cells were transfected with empty vector or FLAG-Bcl2l10. Basal Fura-2 F340 nm/F380 nm = 0.61 ± 0.01 and 0.59 ± 0.01 for empty vector and Bcl2l10 cells, respectively. Right panel: Bar graph showing the mean amplitude (±SEM) of the ATP-induced Ca2+ peak (n: number of cells analyzed from five independent experiments). (E) Left panel: representative response curve of Fura-2-loaded cells treated with 1 µM thapsigargin at the indicated times. Right panel: Bar graph showing the mean area under curve (AUC) (±SEM) of the thapsigargin-induced Ca2+ peak (n: number of cells analyzed from three independent experiments). ***p<0.001; n.s p>0.05.
Figure 2

IRBIT and Bcl2l10 cooperate to regulate IP3R activity.
(A) Representative Ca2+ response curve of Fura-2-loaded IRBIT KO MEF cells stimulated with 1 µM ATP at the indicated times. Cells were transfected with empty vector or with a plasmid expressing either FLAG-Bcl2l10 or FLAG-IRBIT alone, or FLAG-Bcl2l10 and FLAG-IRBIT together. Basal Fura-2 F340 nm/F380 nm = 0.61 ± 0.01, 0.59 ± 0.01, 0.59 ± 0.01 and 0.58 ± 0.01 for empty vector, Bcl2l10, IRBIT and Bcl2l10+IRBIT, respectively. (B) Bar graph showing the mean amplitude (±SEM) of the ATP-induced Ca2+ peak (n: number of cells analyzed from five independent experiments). (C) Western blot of GST-pulldown performed with GST or GST-IP3BD on lysates of HeLa cells expressing HA-IRBIT alone or in combination with FLAG-Bcl2l10. Quantification was performed from three independent experiments. (D) Western blot of GST-pulldown performed with GST-IP3BD on recombinant Bcl2l10 alone or in combination with recombinant IRBIT produced in Sf9 cells. Quantification was performed from three independent experiments.(E) Western blot of GST-pulldown performed with GST-IP3BD on lysates of HeLa cells expressing HA-IRBIT alone or in combination with FLAG-Bcl2l10 in the presence of 0, 1 or 10 µM IP3. Quantification was performed from three independent experiments. *p<0.05, **p<0.01, ***p<0.001.
Figure 3
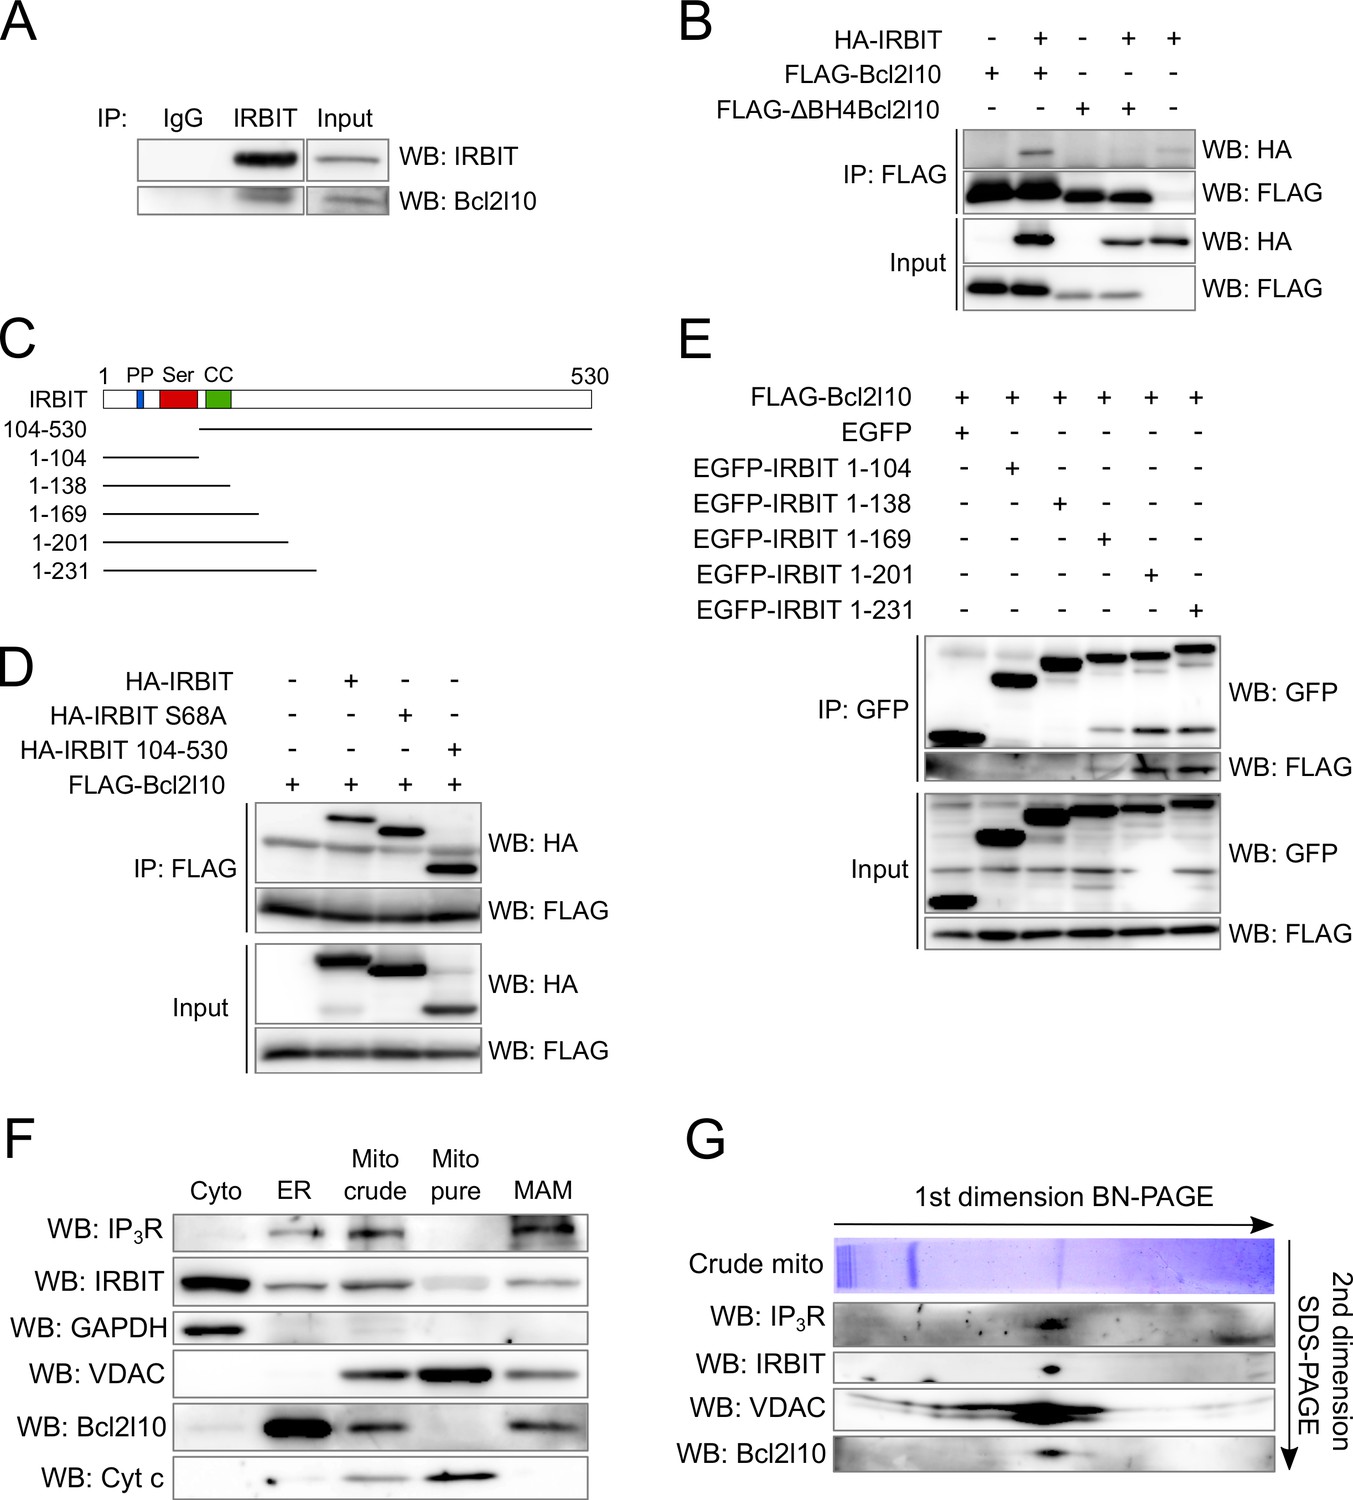
IRBIT and Bcl2l10 interact together and belong to a protein complex in MAM.
(A) Western blot of IP between endogenous IRBIT and endogenous Bcl2l10. Western blot representative of three independent experiments. (B) Western blot of IP between HA-IRBIT and FLAG-Bcl2l10 or FLAG-∆BH4Bcl2l10. Western blot representative of three independent experiments. (C) Schematic representation of full-length IRBIT and of the deletion mutants used. PP – Protein phosphatase-1 binding site; Ser –Serine-rich region; CC – Coiled-coil domain. (D) Western blot of IP between FLAG-Bcl2l10 and HA-IRBIT or the indicated HA-tagged mutants of IRBIT. Western blot representative of three independent experiments. (E) Western blot of IP between FLAG-Bcl2l10 and EGFP or the indicated mutants of IRBIT in fusion with EGFP. (F) Protein components of subcellular fractions prepared from HeLa cells revealed by Western blot analysis. Cyto – Cytosol; ER – Endoplasmic reticulum; Mito crude – crude mitochondria which is composed of pure mitochondria (Mito Pure) and mitochondria-associated membranes (MAM). Western blot representative of three independent experiments. (G) Blue-native (BN) and SDS-PAGE 2D separation of a crude mitochondria fraction prepared from HeLa cells. Second dimension SDS-PAGE was analyzed by Western blot. Western blot representative of two independent experiments.
Figure 4 with 1 supplement

IRBIT is required for apoptosis, during which it is dephosphorylated and translocated from ER membranes.
(A) Bar graph showing the mean percentage (±SEM) of WT or IRBIT KO HeLa cells positive for active-Caspase-3 staining after treatment with DMSO (1/1000 for 24 hr), staurosporine (STS 1 µM for 4 hr) or tunicamycin (Tun 20 µM for 24 hr) (n = three independent experiments, three fields analyzed per condition within each experiment, >200 cells per field). (B) Western blot analysis of extracts of WT HeLa cells transfected with empty vector or of IRBIT KO HeLa cells transfected with empty vector or HA-IRBIT and treated with DMSO (1/1000 for 24 hr), staurosporine (STS 1 µM for 4 hr) or tunicamycin (Tun 20 µM for 24 hr). Quantification was performed from three independents experiments. (C) Western blot of extracts of HeLa cells treated with DMSO (1/1000 for 24 hr), staurosporine (STS 1 µM for 4 hr) or tunicamycin (Tun 20 µM for 24 hr). (D) Bar graph showing the relative phosphorylation of the Ser68/71 and Ser74/77 residues of IRBIT after staurosporine (1 µM) or tunicamycin (20 µM) treatment for 4 hr or 24 hr, respectively. (n = three independent experiments.) (E) Western blot of extracts of HeLa cells treated with DMSO for 2 hr (−) or with 1 µM STS for 30 min, 60 min or 90 min (left panel) or with DMSO for 8 hr (−) or 20 µM tunicamycin for 4, 6 or 8 hr (right panel). (F) Bar graph showing relative phosphorylation of the Ser68/71 and Ser74/77 residues of IRBIT after STS (1 µM) treatment for 30 min, 60 min or 90 min (left panel) or TUN (20 µM) treatment for 4, 6 or 8 hr (right panel). (n = three independent experiments.) (G) Protein components of subcellular fractions prepared from HeLa cells treated with STS for 4 hr or TUN for 24 hr and revealed by Western blot analysis. Cyto – Cytosol; MAM – mitochondria-associated membranes; ER – Endoplasmic reticulum. *p<0.05, **p<0.01, ***p<0.001. See also Figure 4—figure supplement 1.
Figure 4—figure supplement 1
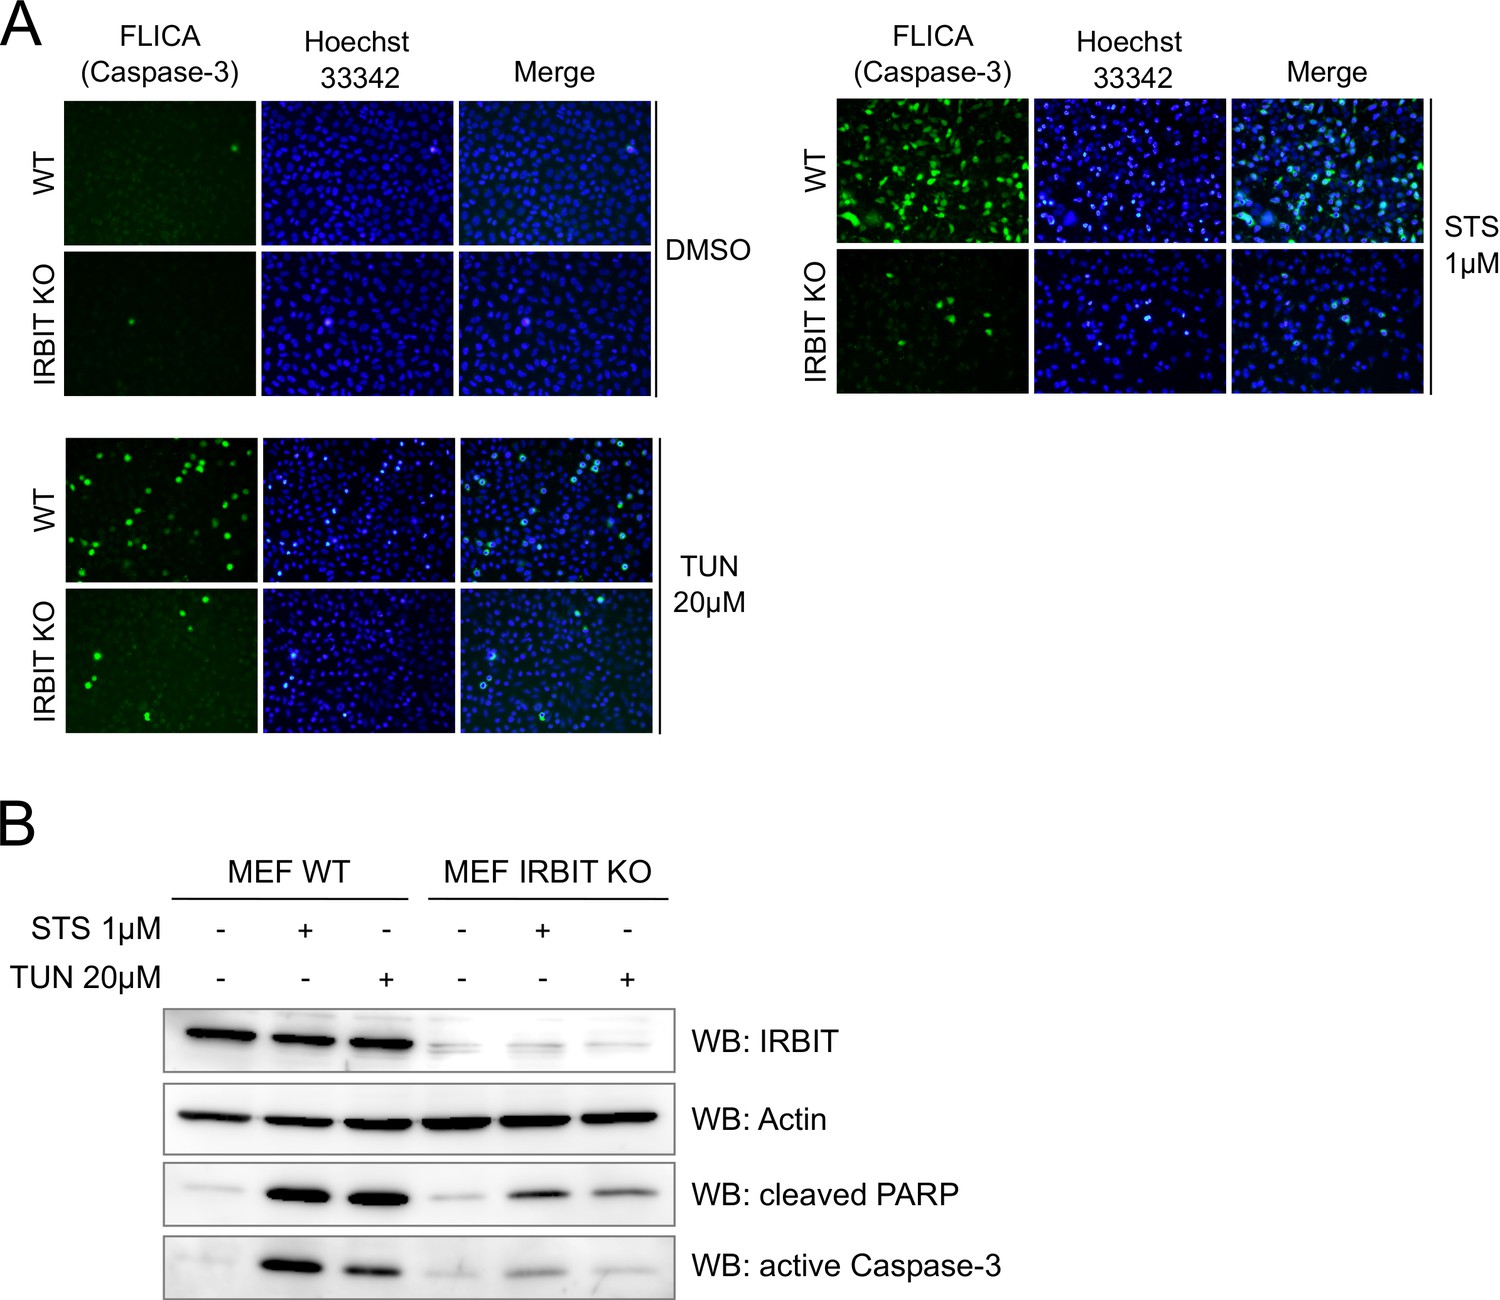
IRBIT KO protects cells from apoptosis.
(A) Representative fluorescence microscopy images of WT and IRBIT KO HeLa cells treated with DMSO (1/1000 for 24 hr), staurosporine (STS 1 µM for 4 hr) or tunicamycin (Tun 20 µM for 24 hr) and stained with FLICA for active Caspase-3 (green) and Hoechst 33342 for nucleus labelling. (B) Western blot analysis of extracts of WT or IRBIT KO MEF cells transfected with empty vector or HA-IRBIT and treated with DMSO (1/1000 for 24 hr), staurosporine (STS 1 µM for 4 hr) or tunicamycin (Tun 20 µM for 24 hr).
Figure 5
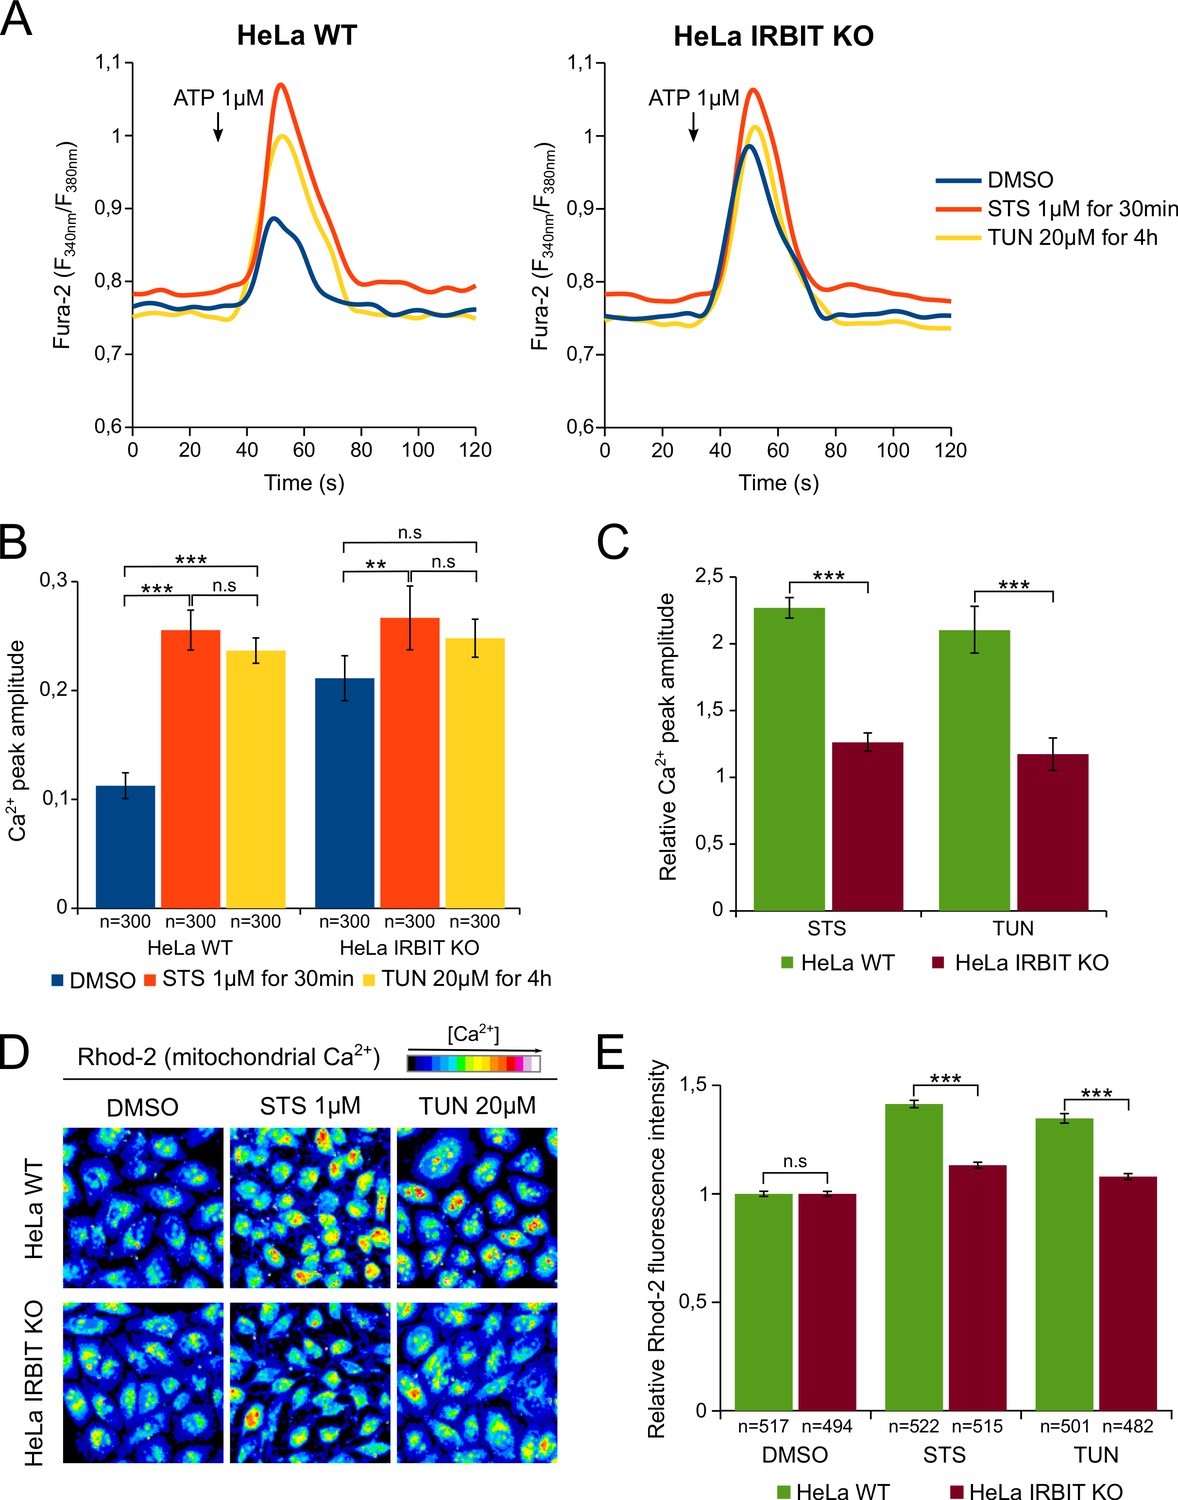
IRBIT KO abolishes the effect of apoptosis-inducing drugs on Ca2+ signaling.
(A) Representative Ca2+ response curve of Fura-2-loaded HeLa cells stimulated with 1 µM ATP at the indicated times. WT (left panel) or IRBIT KO (right panel) cells were treated with either DMSO (1/1000) for 4 hr, STS 1 µM for 30 min or TUN 20 µM for 4 hr before imaging. Basal Fura-2 F340 nm/F380 nm = 0.76 ± 0.01, 0.79 ± 0.01 and 0.75 ± 0.01 for WT cells treated with DMSO, STS and TUN, respectively; basal Fura-2 F340 nm/F380 nm = 0.75 ± 0.01, 0.78 ± 0.01 and 0.74 ± 0.01 for for IRBIT KO cells treated with DMSO, STS and TUN, respectively. (B) Bar graph showing the mean amplitude (±SEM) of the ATP-induced Ca2+ peak (n: number of cells analyzed from three independent experiments). (C) Bar graph showing the mean relative amplitude (±SEM) of the ATP-induced Ca2+ peak in cells treated with the indicated drugs compared to control (DMSO). (D) Representative images of Rhod-2-loaded HeLa cells treated with either DMSO (1/1000) for 8 hr, STS 1 µM for 90 min or TUN 20 µM for 8 hr. (E) Bar graph showing the mean relative Rhod-2 fluorescence intensity (±SEM) of HeLa cells treated with the indicated drugs compared to control (DMSO). (n: number of cells analyzed from three independent experiments.) *p<0.05, **p<0.01, ***p<0.001.
Figure 6 with 1 supplement
Unphosphorylated IRBIT inhibits Bcl2l10 activity.
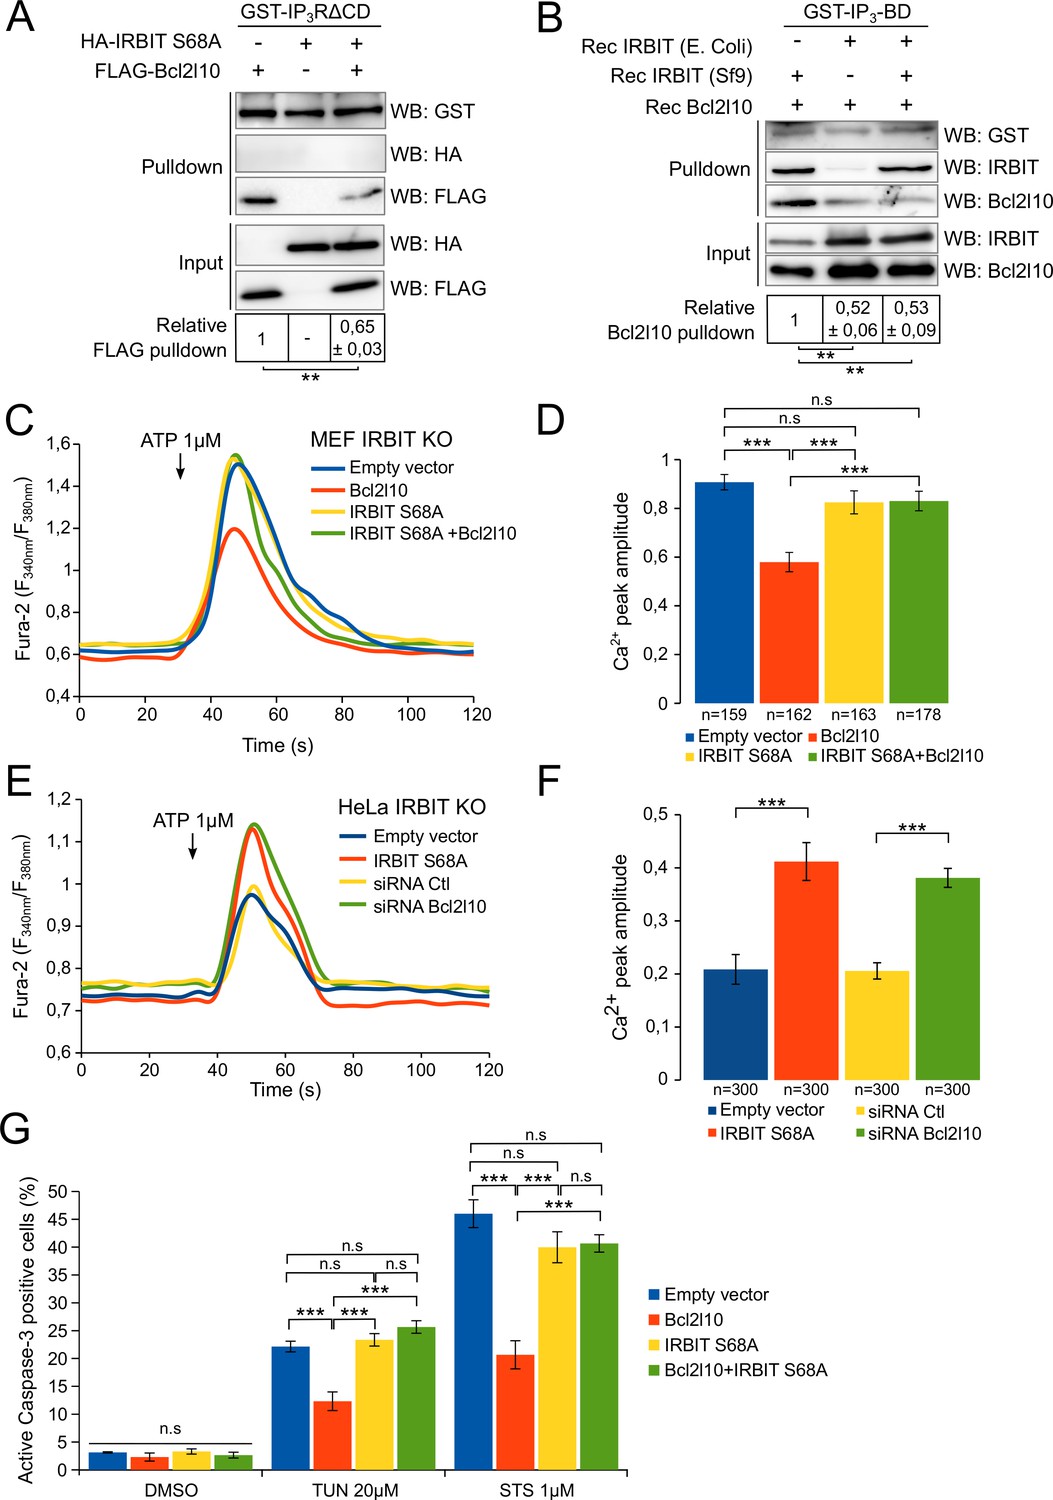
(A) Western blot of GST-pulldown performed with GST-IP3RΔCD on lysates of HeLa cells expressing HA-IRBIT S68A and FLAG-Bcl2l10 alone or in combination. Quantification was performed from three independent experiments. (B) Western blot of GST-pulldown performed with GST-IP3BD on recombinant Bcl2l10 in combination with recombinant IRBIT produced in Sf9 cells or in E. coli. Quantification was performed from three independent experiments. (C) Representative Ca2+ response curve of Fura-2-loaded IRBIT KO MEF cells stimulated with 1 µM ATP at the indicated times. Cells were transfected with empty vector or with a plasmid expressing FLAG-Bcl2l10 and FLAG-IRBIT S68A alone or together. (D) Bar graph showing the mean amplitude (±SEM) of the ATP-induced Ca2+ peak (n: number of cells analyzed from three independent experiments). (E) Representative Ca2+ response curve of Fura-2-loaded IRBIT KO HeLa cells stimulated with 1 µM ATP at the indicated times. Cells were transfected with empty vector or with a plasmid expressing FLAG-IRBIT S68A or with a control siRNA or with a siRNA against Bcl2l10. (F) Bar graph showing the mean amplitude (±SEM) of the ATP-induced Ca2+ peak (n: number of cells analyzed from three independent experiments). (G) Bar graph showing the mean percentage (±SEM) of HeLa cells expressing FLAG-Bcl2l10 and FLAG-IRBIT S68A alone or in combination and positive for active-Caspase-3 staining after treatment with DMSO (1/1000 for 24 hr), tunicamycin (TUN; 20 µM for 24 hr) or staurosporine (STS; 1 µM for 4 hr) (n = 3 independent experiments, three fields analyzed per condition within each experiment, >200 cells per field). *p<0.05, **p<0.01, ***p<0.001. See also Figure 6—figure supplement 1.
Figure 6—figure supplement 1
Unphosphorylated IRBIT inhibits Bcl2l10 anti-apoptotic activity.
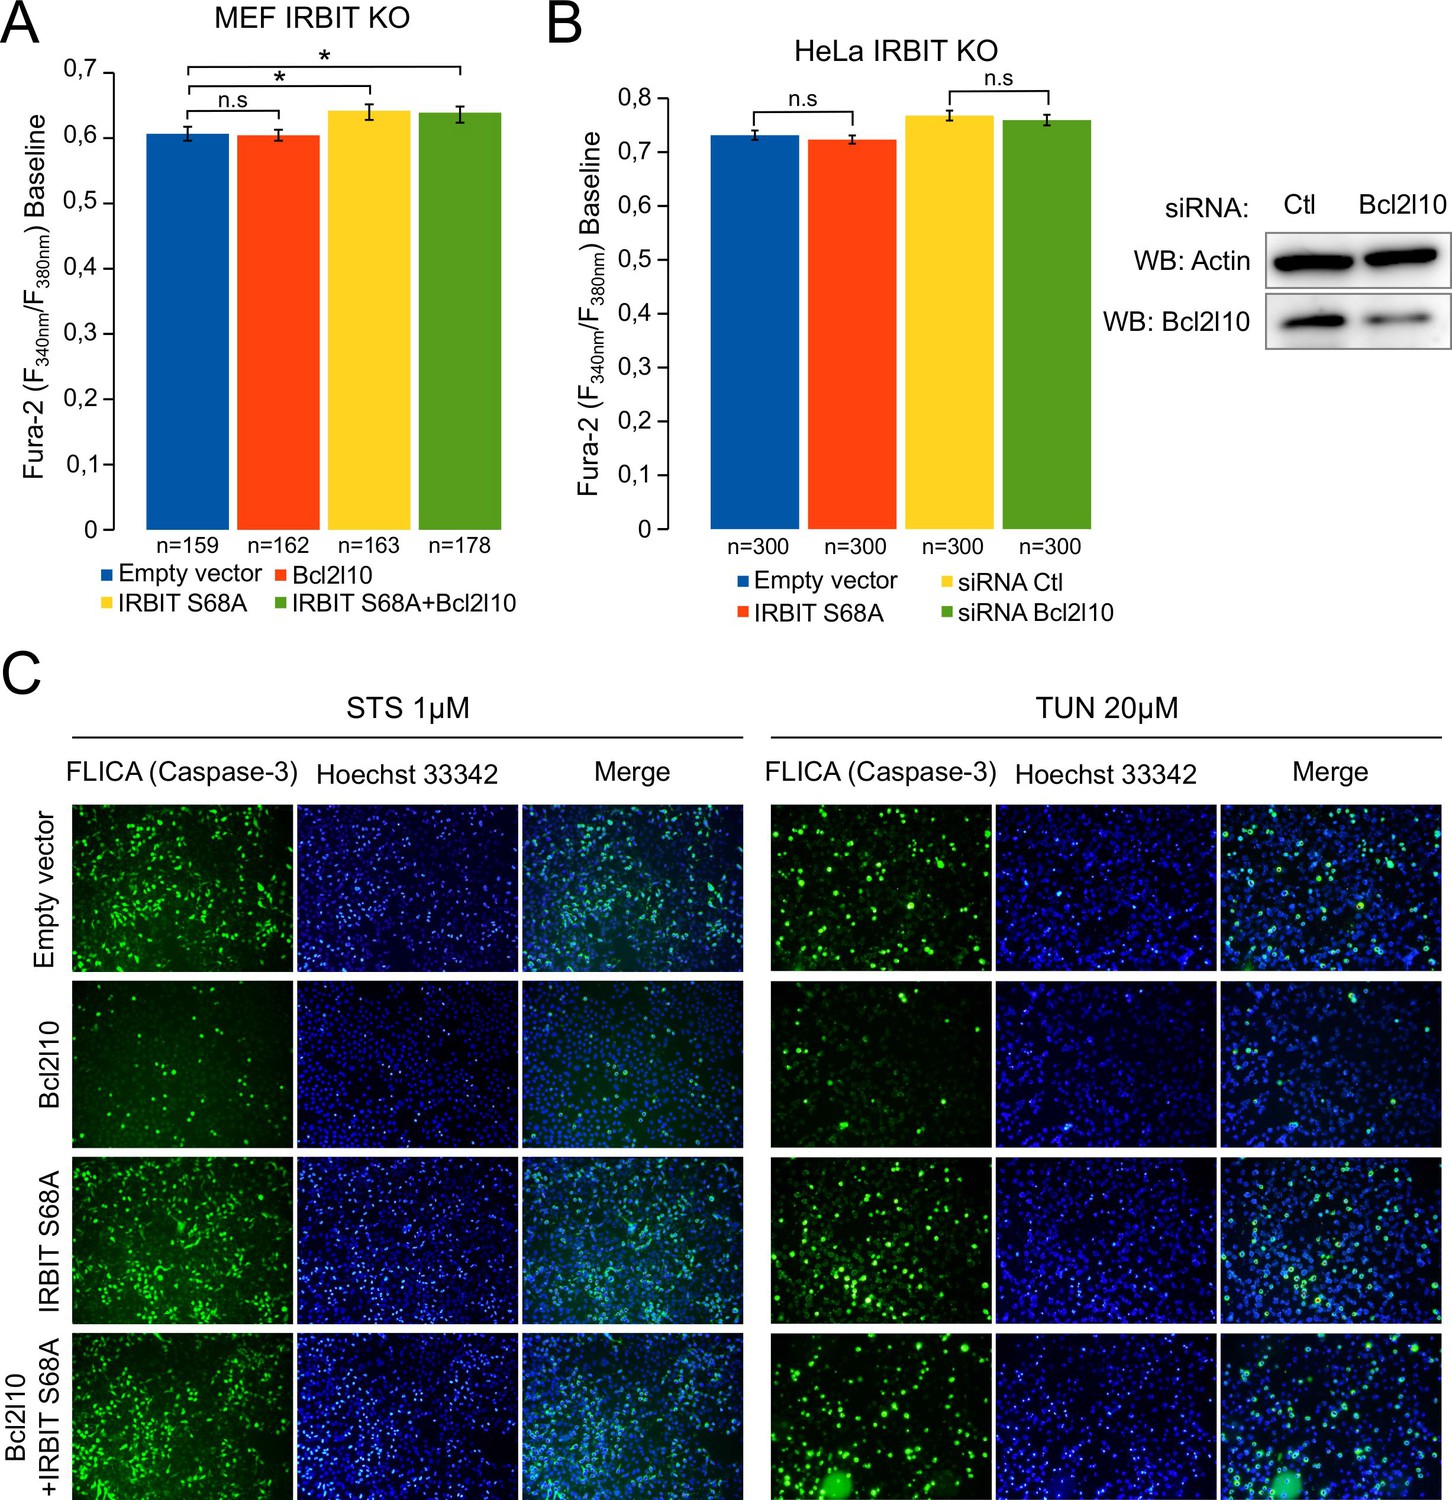
(A) Bar graph showing the mean amplitude (±SEM) of the basal Fura-2 ratio value in MEF IRBIT KO cells before ATP stimulation (n: number of cells analyzed from three independent experiments). (B) Bar graph showing the mean amplitude (±SEM) of the basal Fura-2 ratio value in HeLa IRBIT KO cells before ATP stimulation (n: number of cells analyzed from three independent experiments). Insert: Western blot analysis of extracts of IRBIT KO HeLa cells transfected with control siRNA (Ctl) or with siRNA targeting bcl2l10 mRNA. (C) Representative fluorescence microscopy images of WT HeLa cells transfected with empty vector or expressing FLAG-Bcl2l10 and FLAG-IRBIT S68A alone or in combination and treated with 1 µM staurosporine (STS) for 4 hr or 20 µM tunicamycin (TUN) for 24 hr. Cells were stained with FLICA for active Caspase-3 (green) and Hoechst 33342 for nucleus labelling.
Figure 7 with 1 supplement
IRBIT promotes ER-mitochondria Ca2+ transfer and contact.
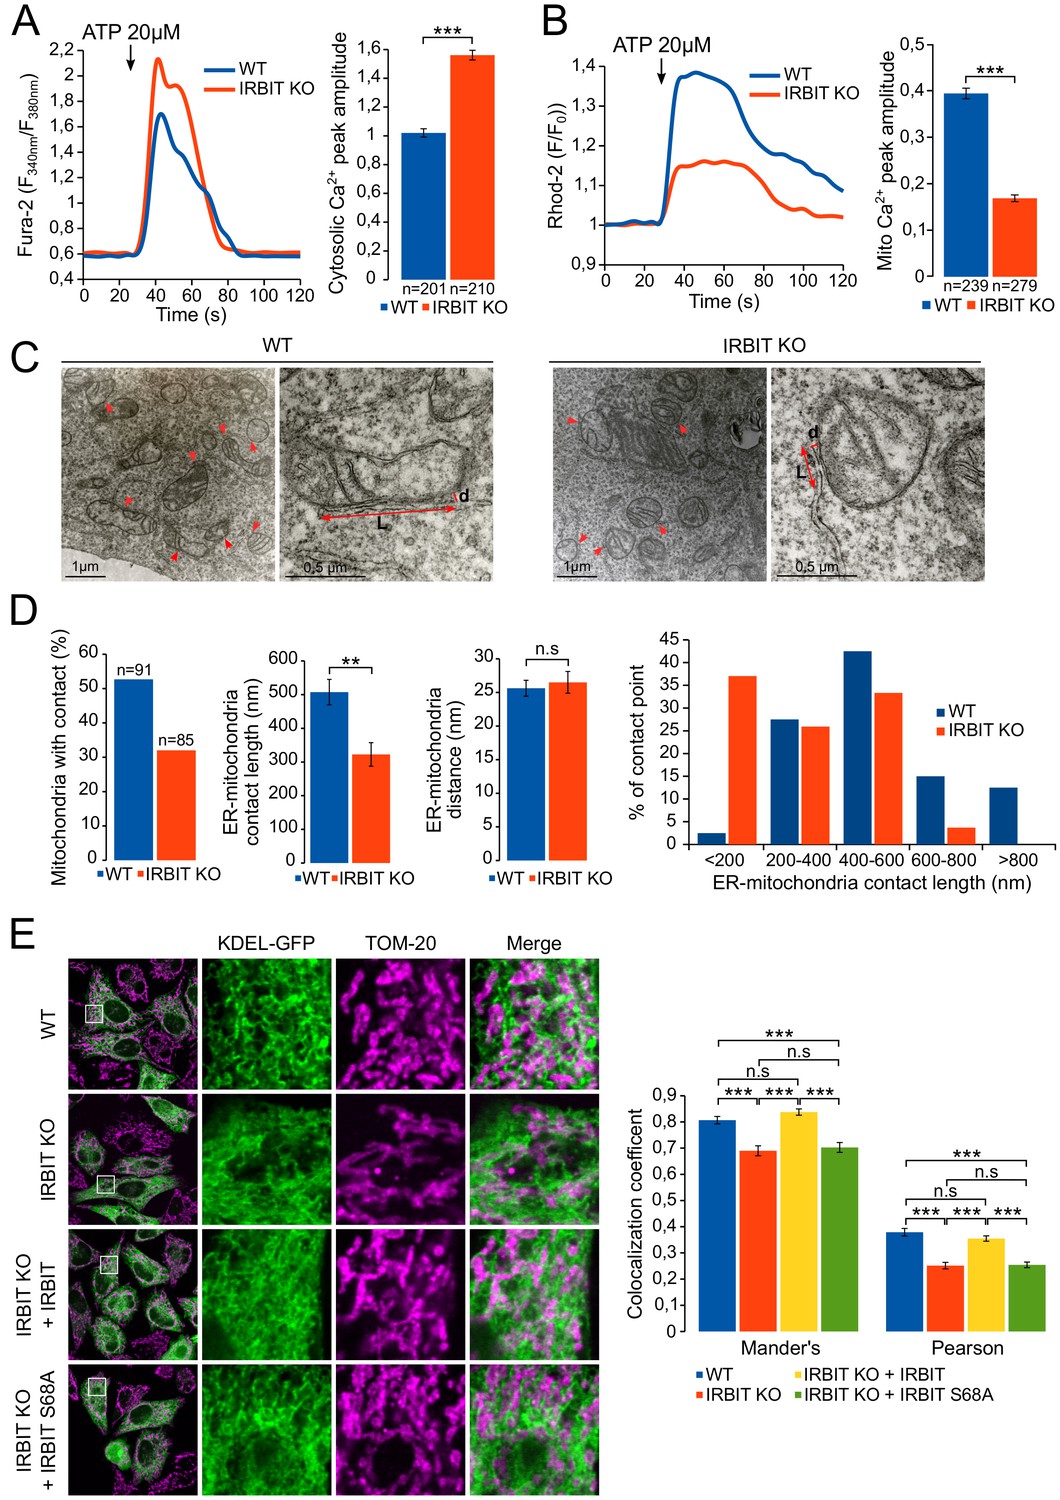
(A) Left panel: representative Ca2+ response curve of Fura-2 loaded WT or IRBIT KO MEF cells stimulated with 20 µM ATP at the indicated times. Right panel: Bar graph showing the mean amplitude (±SEM) of the ATP-induced Ca2+ peak (n: number of cells analyzed from three independent experiments). (B) Left panel: representative Ca2+ response in the mitochondria of Rhod-2-loaded WT or IRBIT KO MEF cells stimulated with 20 µM at the indicated times. Right panel: bar graph showing the mean amplitude (±SEM) of the ATP-induced Ca2+ peak in the mitochondria (n: number of cells analyzed from three independent experiments). (C) Representative electronic microscopy images of WT and IRBIT KO HeLa cells. Red arrows indicate contact points between ER and mitochondria. Red double-headed arrows indicate the length of the ER-mitochondria contact (L) and the distance between ER and mitochondria (d). (D) Quantitative analysis of ER-mitochondria contacts observed by electronic microscopy in WT and IRBIT KO HeLa cells. Bar graphs show the percentage of mitochondria in contact with ER (n = three cells analyzed per condition. WT – 91 mitochondria, IRBIT KO – 85 mitochondria), the mean length (±SEM) of ER–mitochondria contact, the mean distance (±SEM) between ER and mitochondria at contact points and the percentage of ER-mitochondria contact points measuring the indicated length (n = three cells analyzed per condition; WT – 48 mitochondria, IRBIT KO – 27 mitochondria). (E) Left panel: immunofluorescence of WT and IRBIT KO HeLa cells transfected with an ER marker (KDEL-GFP (green)) and stained with anti-TOM20 antibody (magenta) for mitochondria labelling. WT cells were also transfected with empty vector and IRBIT KO cells with empty vector or with a vector expressing FLAG-IRBIT or FLAG-IRBIT S68A. Areas shown in close-up highlight ER-mitochondria contact sites. Right panel: Bar graph showing the mean Mander’s overlap coefficient (±SEM) and the mean Pearson coefficient (±SEM) of WT and IRBIT KO cells expressing the indicated protein (n = three independent experiments, ~20 cells analyzed per condition for each experiment). *p<0.05, **p<0.01, ***p<0.001. See also Figure 7—figure supplement 1.
Figure 7—figure supplement 1
IRBIT KO reduces ER-mitochondria contact in MEF cells.
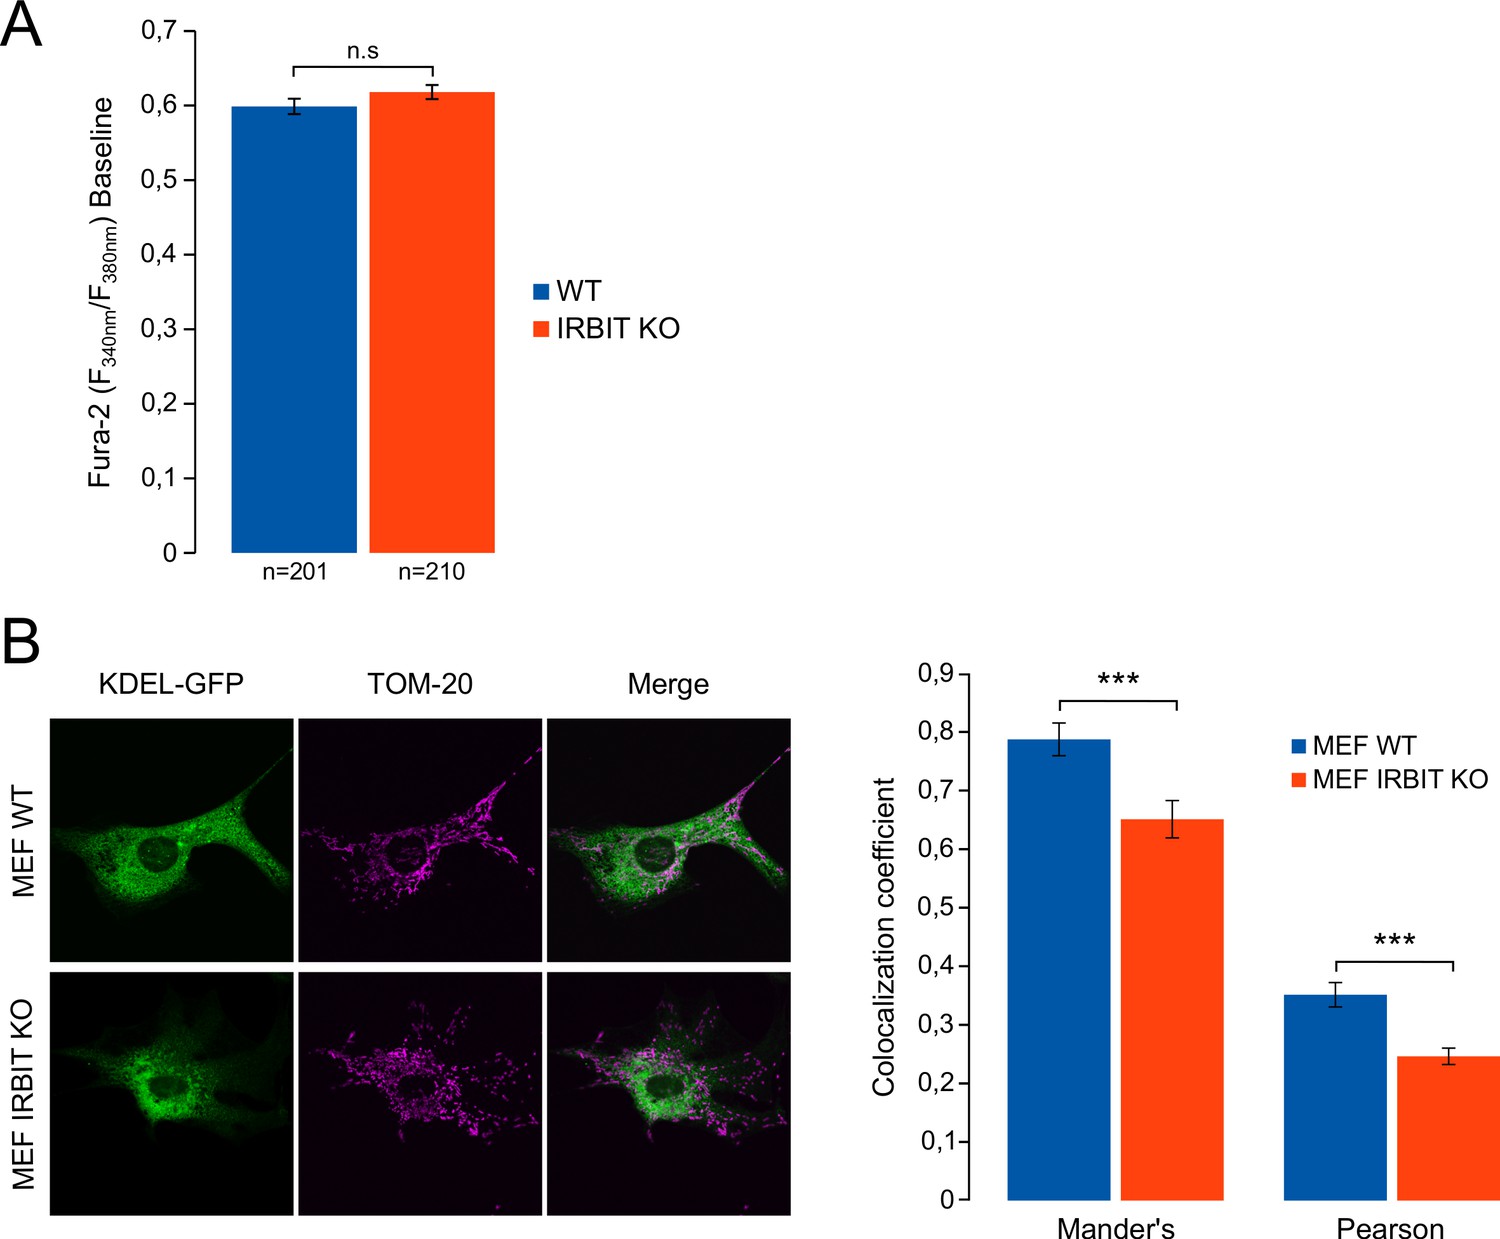
(A) Bar graph showing the mean amplitude (±SEM) of the basal Fura-2 ratio value in MEF cells before ATP stimulation (n: number of cells analyzed from three independent experiments). (B) Left panel: immunofluorescence of WT and IRBIT KO MEF cells transfected with an ER marker (KDEL-GFP (green)) and stained with anti-TOM20 antibody (magenta) for mitochondria labelling. Right panel: histogram showing the mean Mander’s overlap coefficient (±SEM) and the mean Pearson coefficient (±SEM) of WT and IRBIT KO MEF cells (n = three independent experiments, ~20 cells analyzed per condition for each experiment).
Figure 8
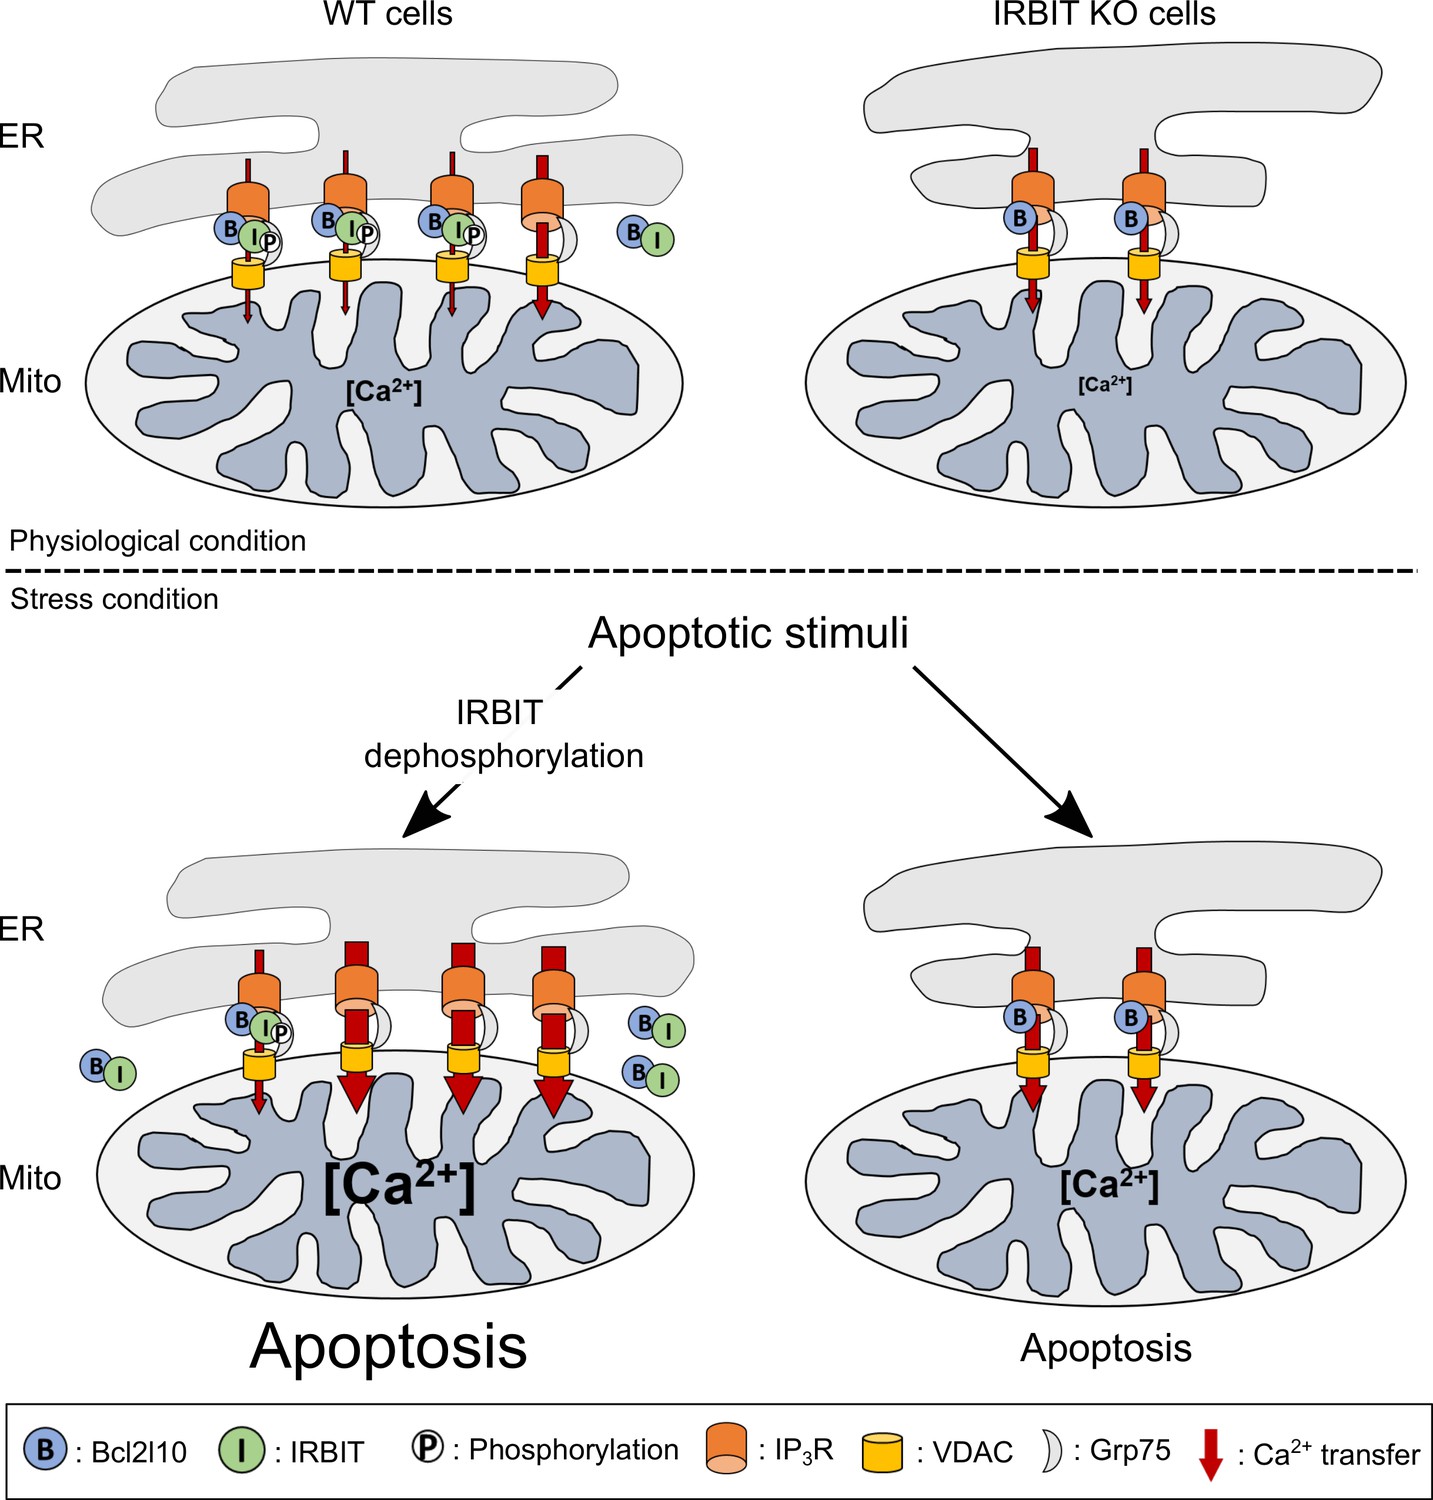
Schematic model depicting the role of IRBIT-Bcl2l10 interplay in physiological and stress conditions.
In physiological conditions, in WT cells, IRBIT promotes ER-mitochondria contact rendering Ca2+ transfer easier between the two organelles. The additive effect of Bcl2l10 and phosphorylated IRBIT on IP3R maintains Ca2+ transfer at a low level. In IRBIT KO cells, the amount of Ca2+that is released through IP3R is increased due to absence of IRBIT, but Ca2+ transfer to the mitochondria is reduced because of the great reduction of ER-mitochondria contact. Following an apoptotic stimuli, Ca2+ release from the ER is increased. In WT cells, IRBIT dephosphorylation induces its translocation into the cytosol together with Bcl2l10, allowing a massive Ca2+ transfer from ER to mitochondria. By contrast, in IRBIT KO cells, Bcl2l10 is no longer displaced from MAMs, reducing the release of Ca2+from ER. This, combined with the reduction of ER-mitochondria contact, prevents massive Ca2+ transfer to mitochondria and thus greatly attenuates apoptosis.
Author response image 1

Western blot of GST-pulldown performed with GST-IP3BD on lysates of HeLa cells expressing FLAG-IRBIT (WT) or FLAG-tagged mutants of IRBIT.
Mutations: SDDD: S71D, S74D and S77D; ADDD: S68A, S71D, S74D and S77D; DDDD: S68D, S71D, S74D and S77D; EDDD: S68E, S71D, S74D and S77D.
Download links
A two-part list of links to download the article, or parts of the article, in various formats.
Downloads (link to download the article as PDF)
Open citations (links to open the citations from this article in various online reference manager services)
Cite this article (links to download the citations from this article in formats compatible with various reference manager tools)
IRBIT controls apoptosis by interacting with the Bcl-2 homolog, Bcl2l10, and by promoting ER-mitochondria contact
eLife 5:e19896.
https://doi.org/10.7554/eLife.19896


