Vocal development in a Waddington landscape
- Princeton University, United States
Figures
Figure 1
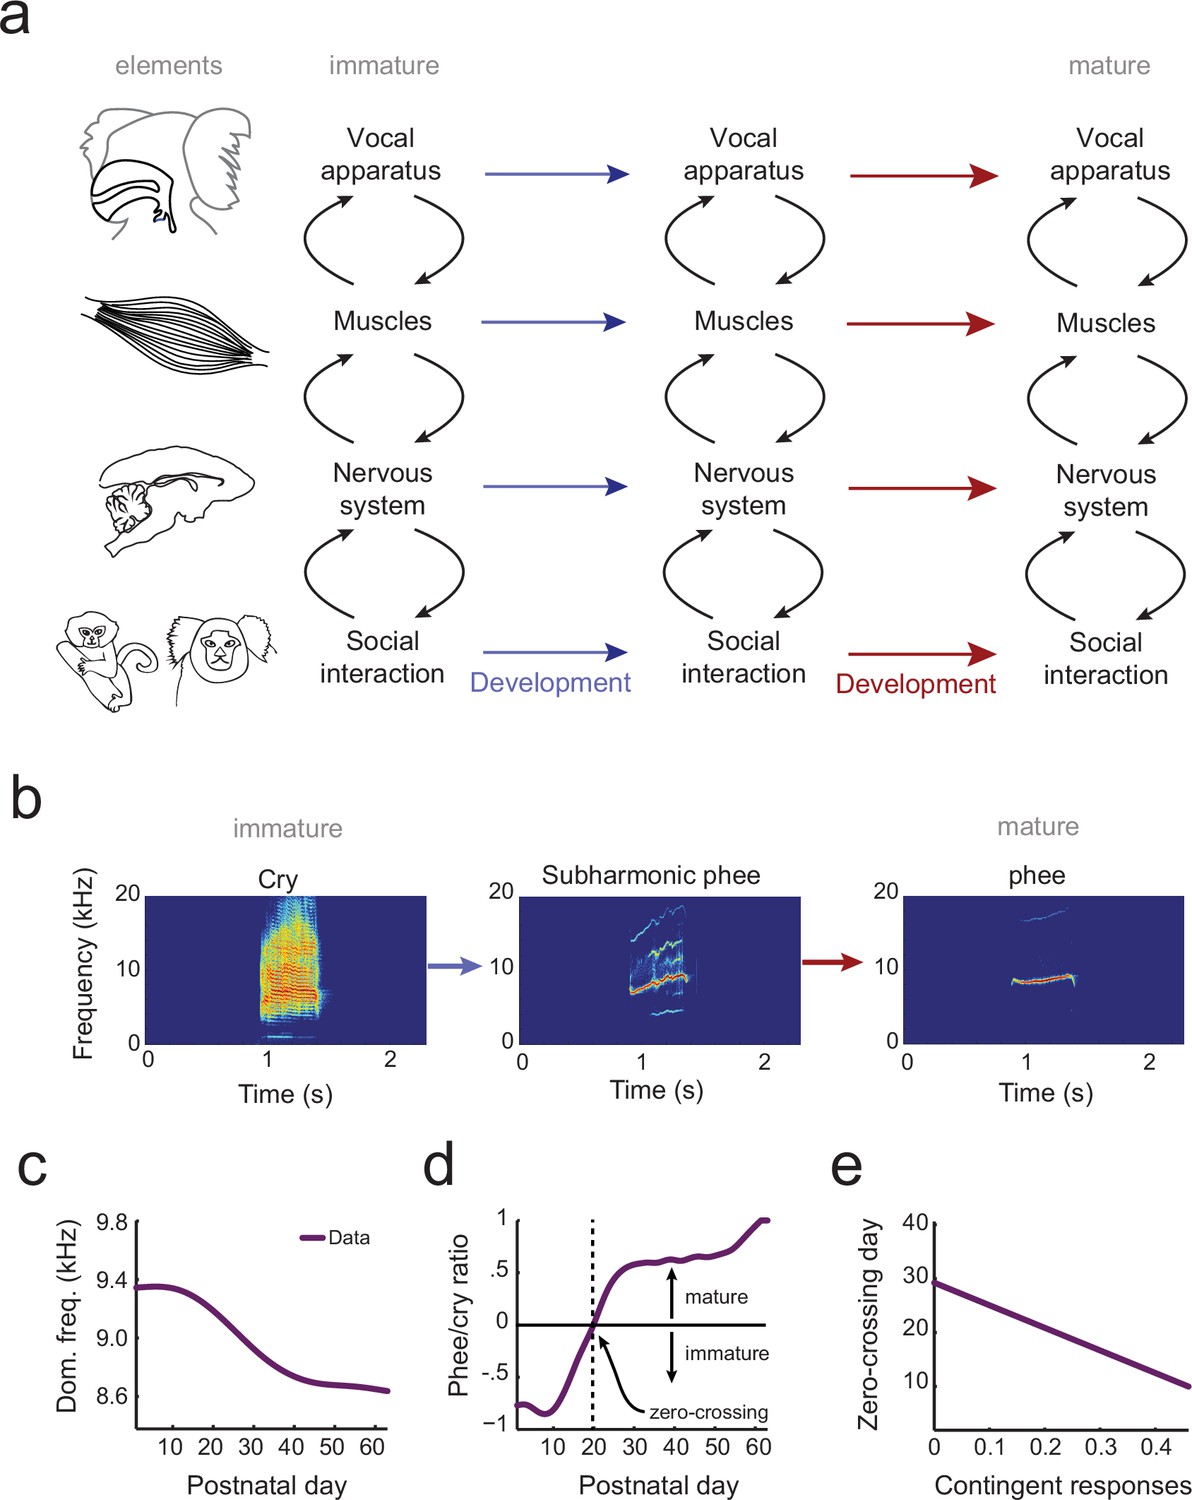
The elements of vocal development and their interactions.
(a) Vocal development is the result of changes in, and interactions among, the vocal apparatus, muscles, nervous system, and social context. (b) Infant marmosets produce mostly immature calls (cries and subharmonics) during early postnatal days which are replaced by more adult-like calls (phees) during development. (c) Changes in vocal acoustics during development include a lowering of the dominant frequency. Purple curve shows a cubic spline fit to the data. (d) Change in the proportion of mature calls compared to immature calls (the phee/cry ratio). Purple curve shows a cubic spline fit to the data. The zero-crossing day is the postnatal day in which the number of cries and phees are the same, marking the transition from mature to immature vocalization. (e) Relationship between the probability of parental contingent responses and the zero-crossing day. Purple line shows the linear regression fit to the data.
Figure 2
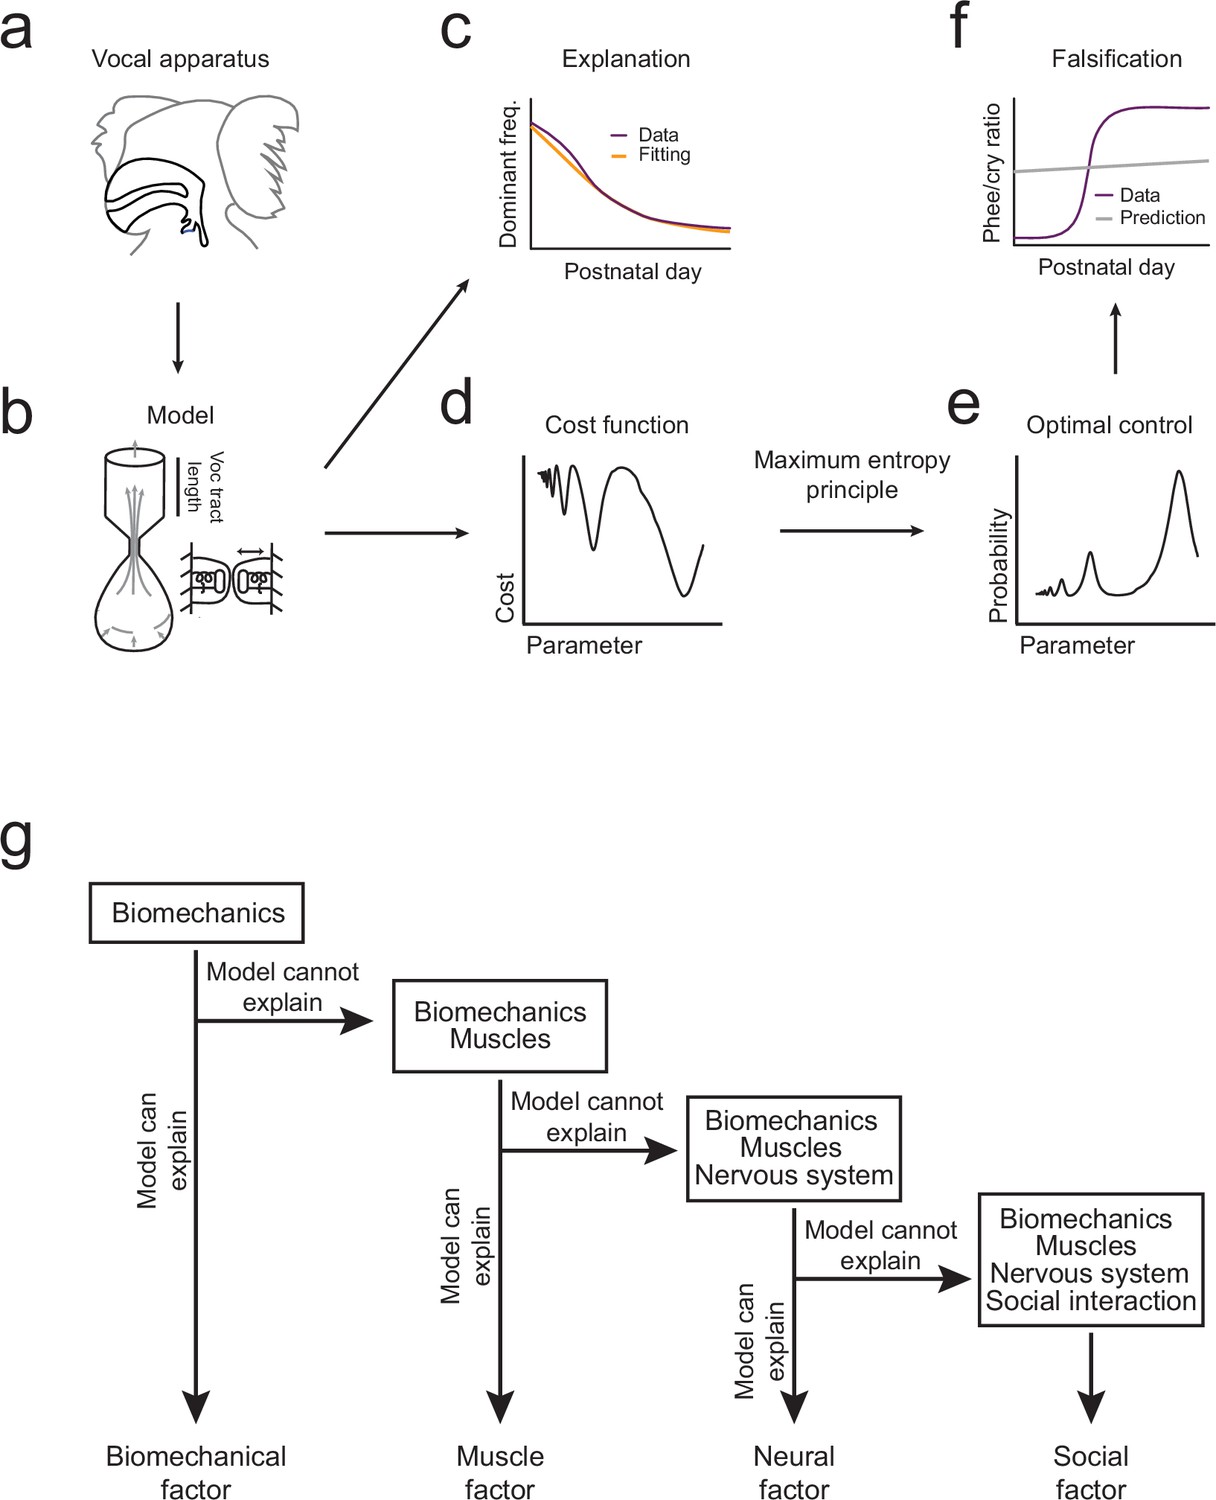
Illustration of the inferential process used in the study.
(a,b) A biomechanical model is made of the infant marmoset monkey vocal apparatus. (c) The model is used to simulate how the growth of the vocal tract lowers the dominant frequency of calls. Model data (yellow line) can be fitted to the real data (purple line). (d,e) Optimal control theory is used to generate a cost function for producing different call types and the maximum entropy principle is used to calculate a probability distribution. (f) Using the probability distribution, we can calculate the phee/cry ratios produced by the simulated vocal tract growth (gray line) and compare with the real marmoset phee/cry ratio data (purple line). (g) The contributions of other individual elements (see Figure 1a) are gradually added to the framework using a sequential inferential approach together with mathematical modeling.
Figure 3
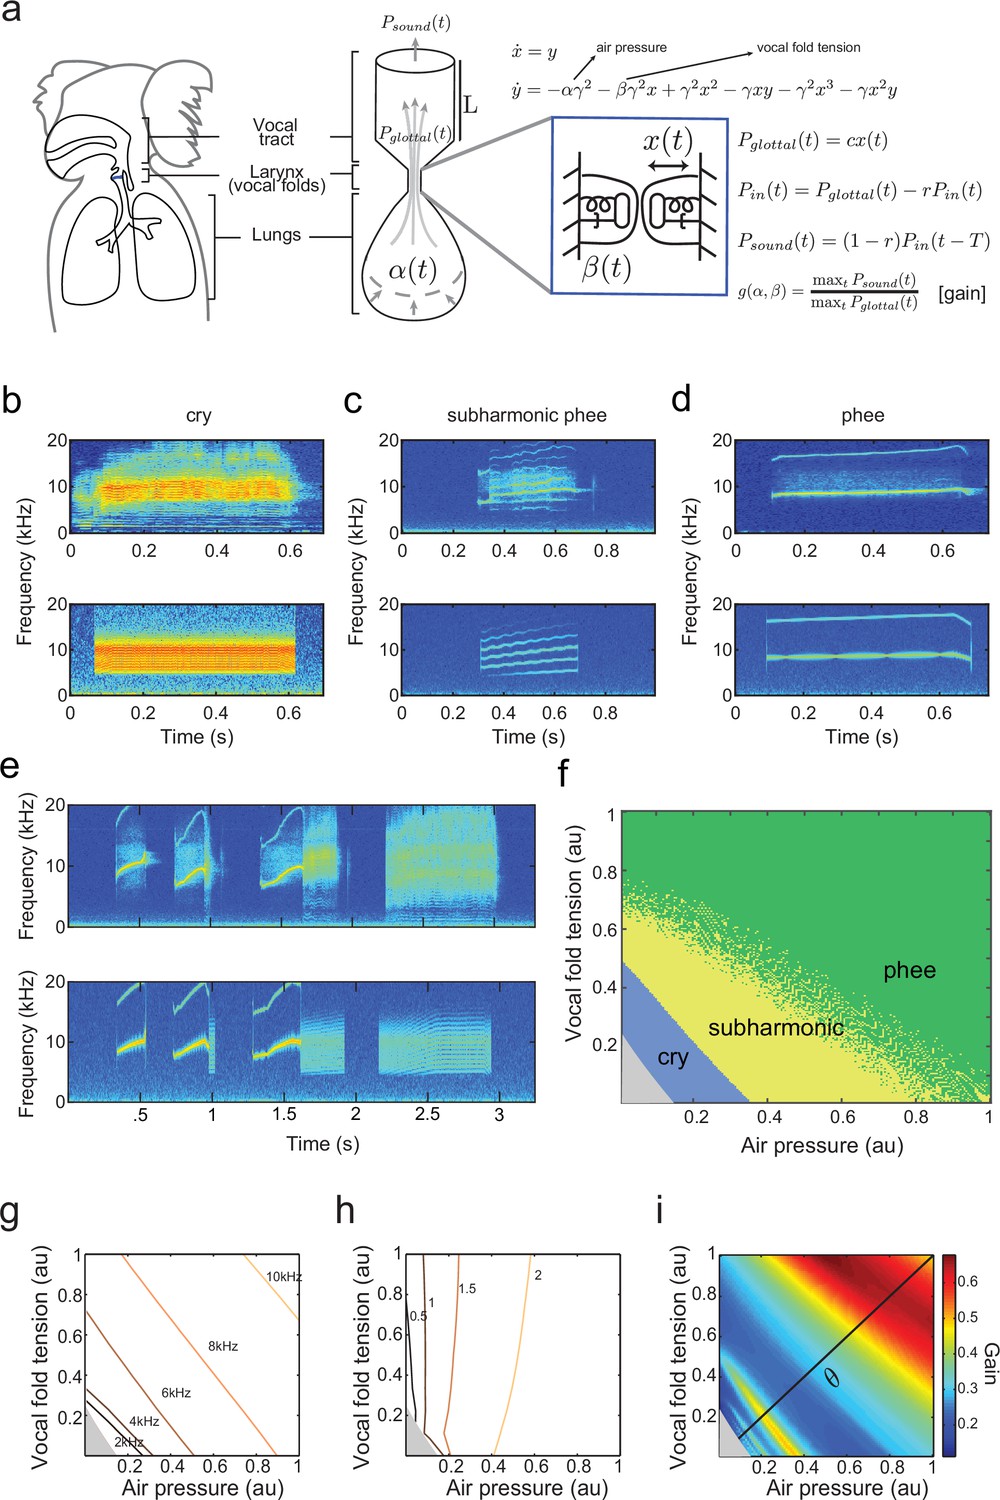
A biomechanical model of marmoset vocal apparatus.
(a) Representation of the biomechanical model of the vocal production apparatus. In our one-mass model are displacement and velocity of vocal folds; nondimensional lung air pressure, vocal fold tension and overall inverse timescale are represented by parameters and . Glottal exit air flow is filtered by the vocal tract, modeled as a cylinder of length with reflection coefficient at the mouth, to produce vocal output . is the one way travel time with sound speed . (b–d) Examples of real infant calls (top) and model simulation of the same calls (bottom). (e) Example of a sequence of infant calls (top) and model simulation (bottom). (f) Different values of air pressure and vocal fold tension produce distinct types of calls. Gray region represents parameter values that do not produce vocalization (i.e., self-sustained oscillation). (g) Isofrequency curves. Lines show air pressure and vocal fold tension values that produce glottal air flow that oscillates at the same frequencies; parameters in the gray region do not produce self-sustained oscillations. (h) Iso-amplitude curves. Lines show air pressure and vocal fold tension values that produce glottal air flow with same amplitudes. (i) Plot showing gains: the ratios between sound produced after the resonance (vocal output) and before the resonance (glottal air flow); warmer colors indicate higher ratios. The diagonal line () is parametrized by . au = arbitrary units.
Figure 4
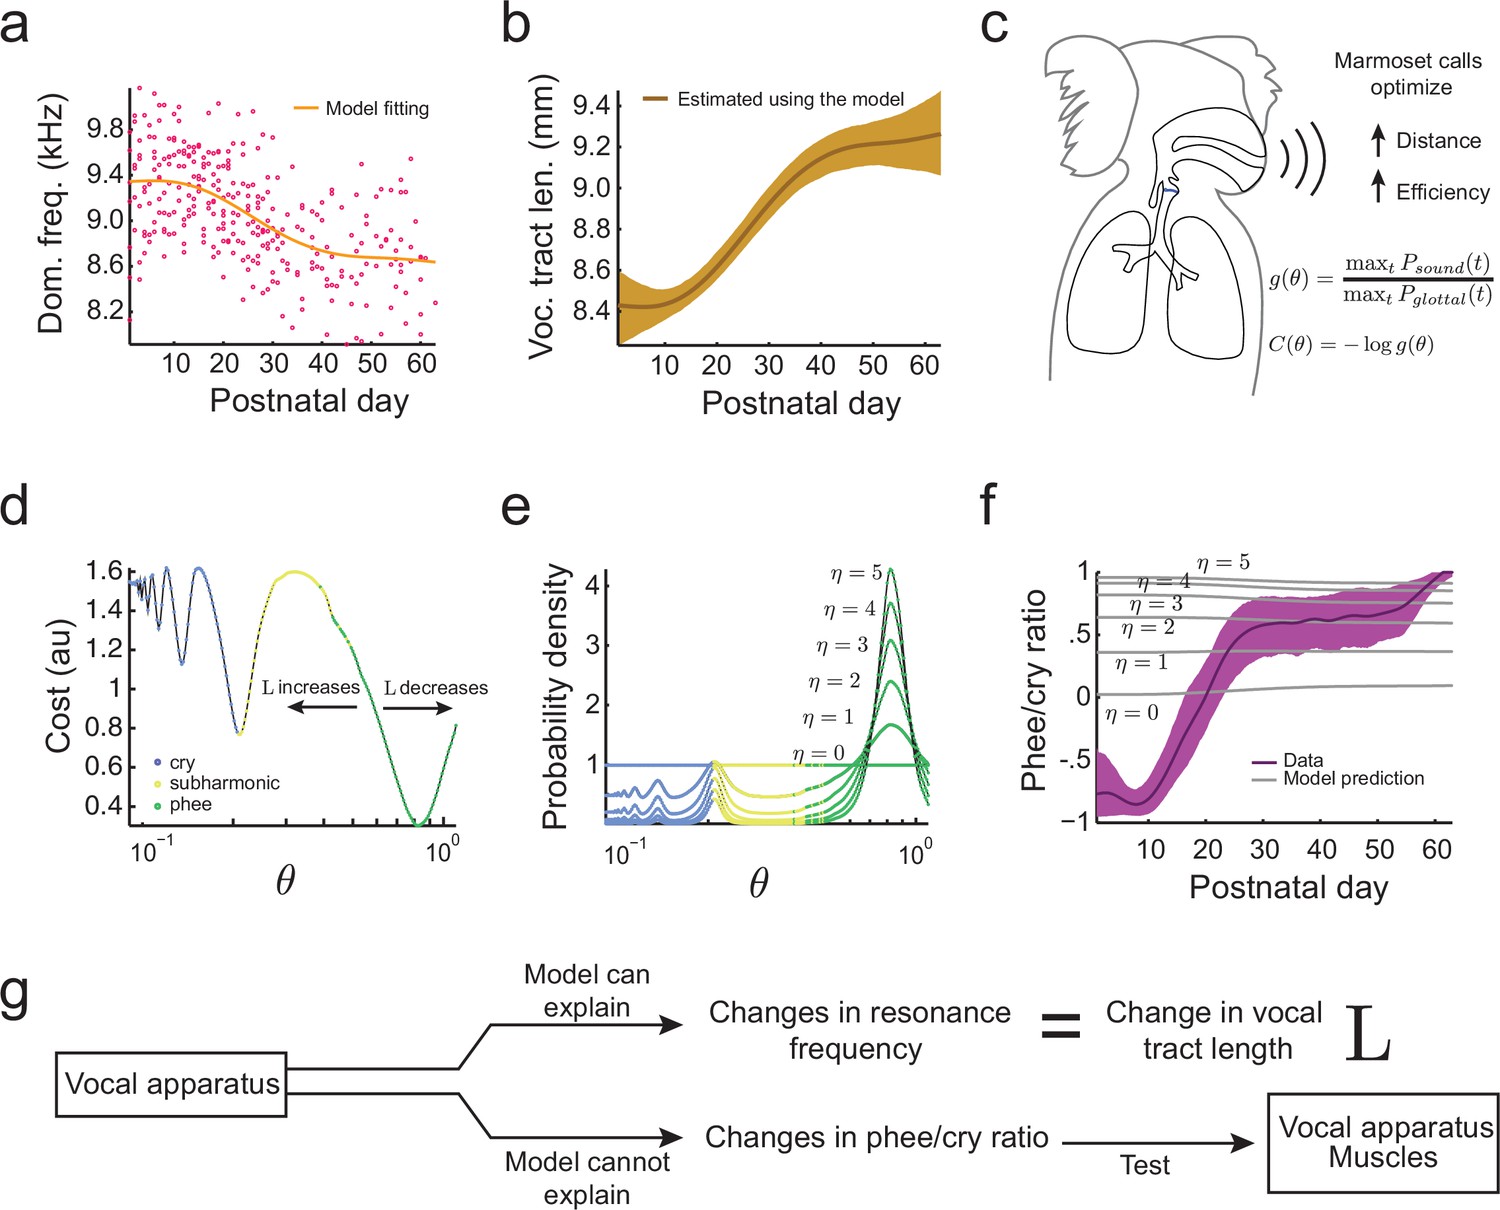
Growth of the vocal tract.
(a) Change in dominant frequency of infant marmoset calls during development. Yellow curve shows the value of resonant frequency fitted by the biomechanical model. Red dots are the mean dominant frequency of each postnatal day for all 10 infants ( sessions). (b) Vocal tract length estimated by the model assuming a closed-closed cylindrical tube (brown curve); shaded region indicates 95% confidence interval. (c) Infant marmosets produce calls that maximize distance and efficiency. Therefore, the cost of producing a call is inversely related to the gain . (d) Cost function to produce calls at different air pressure and vocal fold tension values (). Blue, yellow, and green dots indicate parameter regions for cry, subharmonic-phee, and phee production, respectively. Minimal cost is achieved for phees, which have glottal air flow oscillating at the natural frequency of the vocal cavity; -axis is in log-scale. (e) Probability density to produce calls at different values; color code is the same as in (d). Increasing concentrates probability in the parameter range that produces phees. (f) Population and model phee/cry ratios. Purple line is the population value of phee/cry ratio for the real marmoset infant data; shaded region indicates 95% confidence interval ( sessions). Gray lines indicate phee/cry ratios predicted by the model for different values of . (g) Growth (lengthening) of the vocal tract can explain the lowering of the dominant frequency, but not the transition from cries to phees.
Figure 5
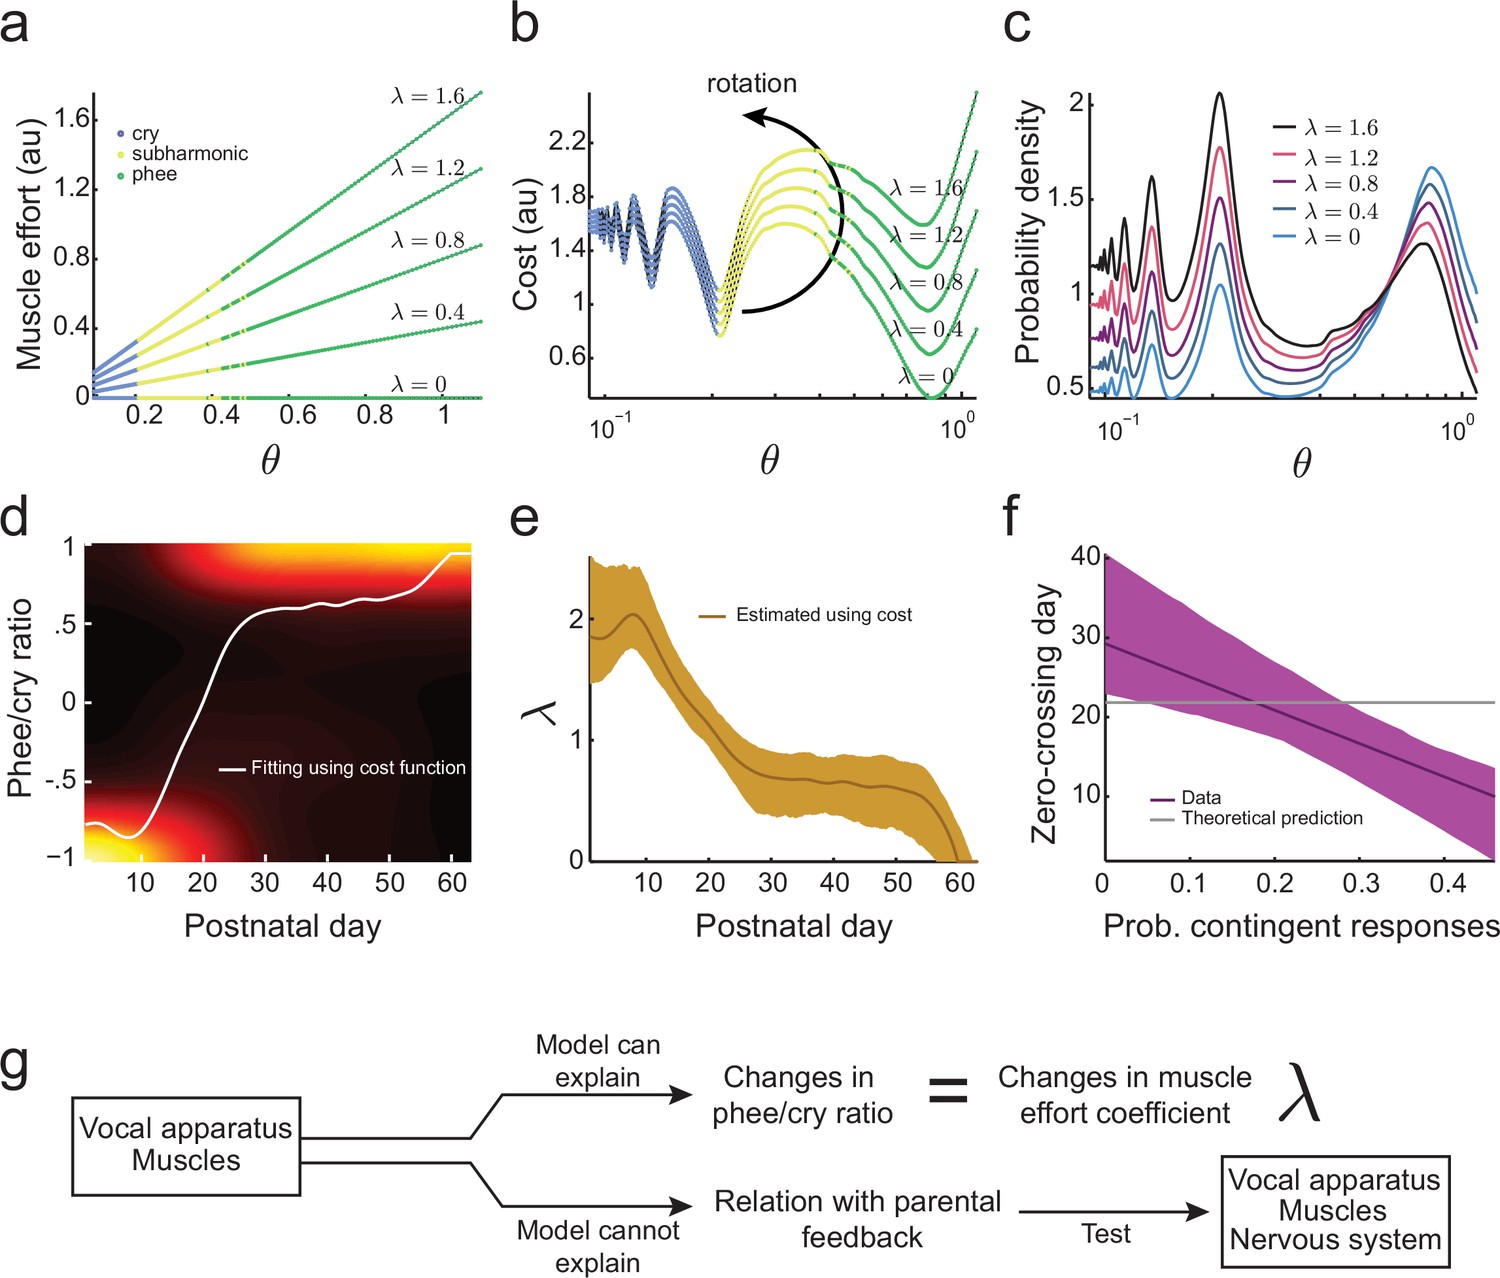
Development of muscular control in the vocal apparatus.
(a) Muscular control necessary to produce different air pressure and vocal fold tension; higher values of imply a greater effort to produce given air pressure and vocal fold tension. Blue, yellow, and green dots indicate parameter regions for cry, subharmonic-phee, and phee production, respectively. (b) Cost functions for different values of . (c) Probability to produce calls at different air pressure and vocal fold tension. For higher values of , probability to produce phee diminishes and the probability to produce cries increases. (d) Phee/cry ratio fitted by the model (white curve). Colors indicate the probability density of the phee/cry ratio for the marmoset population ( sessions); warmer colors indicate higher probability densities. (e) Estimated muscle effort coefficient () during development (brown curve); shaded region indicates confidence interval ( sessions). (f) Relationships between the probability of contingent parental responses and zero-crossing day for real data (purple line) and the model (gray line); shaded region indicates confidence interval ( infants). (g) Changes in muscular control can explain the population change in the phee/cry ratio, but not the social feedback-influenced the individual timing of this transition.
Figure 6
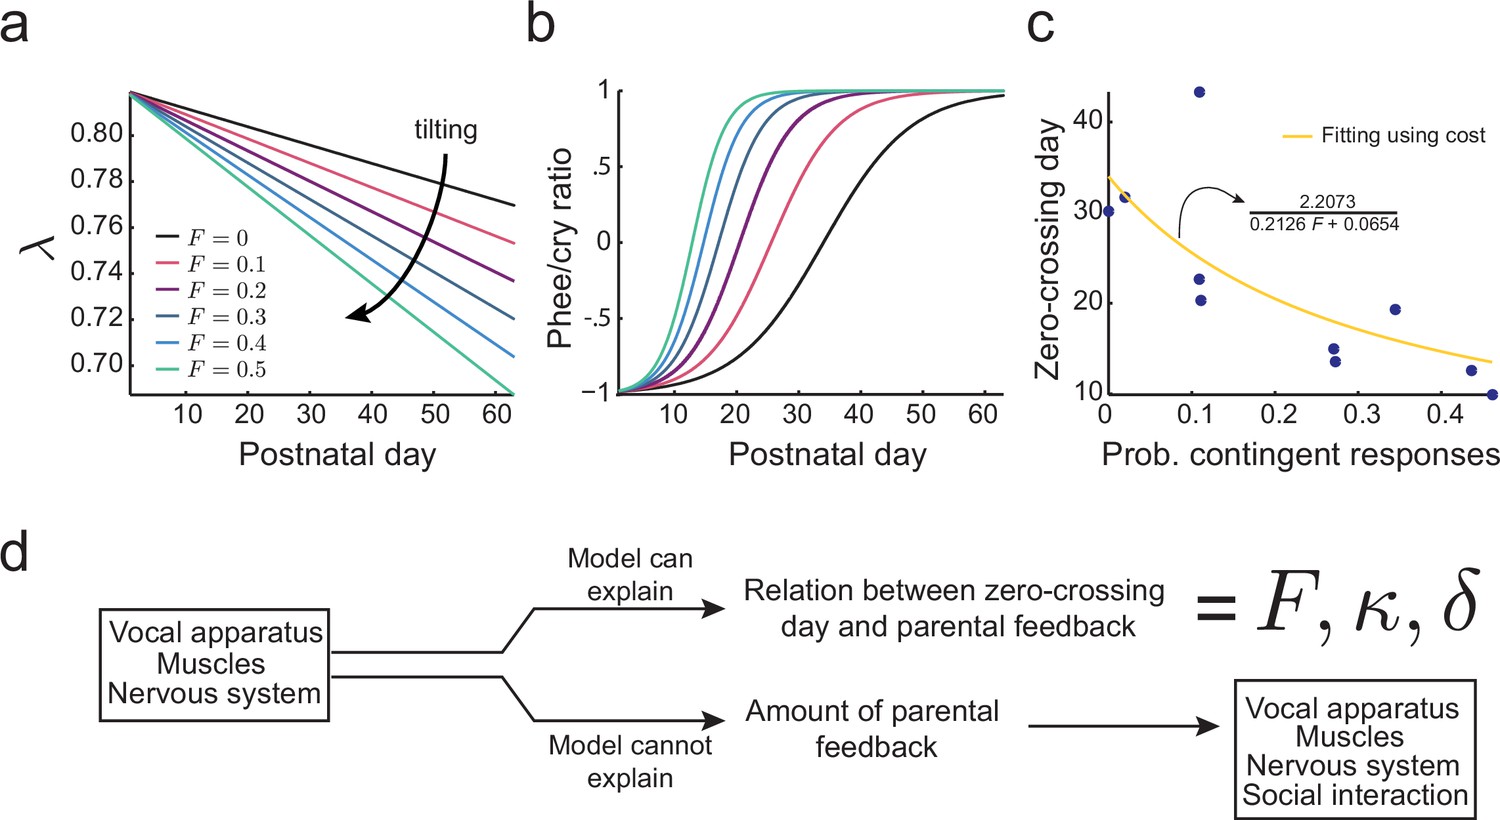
Learning in the developing nervous system.
(a) Developmental change of for different values of the probability of contingent parental response, , with constant learning parameter (see Materials and methods: The full cost function and more parameter choices). Higher values of parental feedback cause faster decay of . (b) Predicted phee/cry ratios for different values of the probability of contingent parental responses. Higher values of parental feedback cause earlier and faster transitions from cries to phees. Color code is the same as in (a). (c) Relationship between the probability of contingent parental response and zero-crossing day; blue dots represent real data ( infants) and yellow line is the model fit. (d) Changes in the nervous system can explain the relation between the rate of transition from cries to phees and the probability of contingent parental feedback, but not the amount of parental feedback.
Figure 7
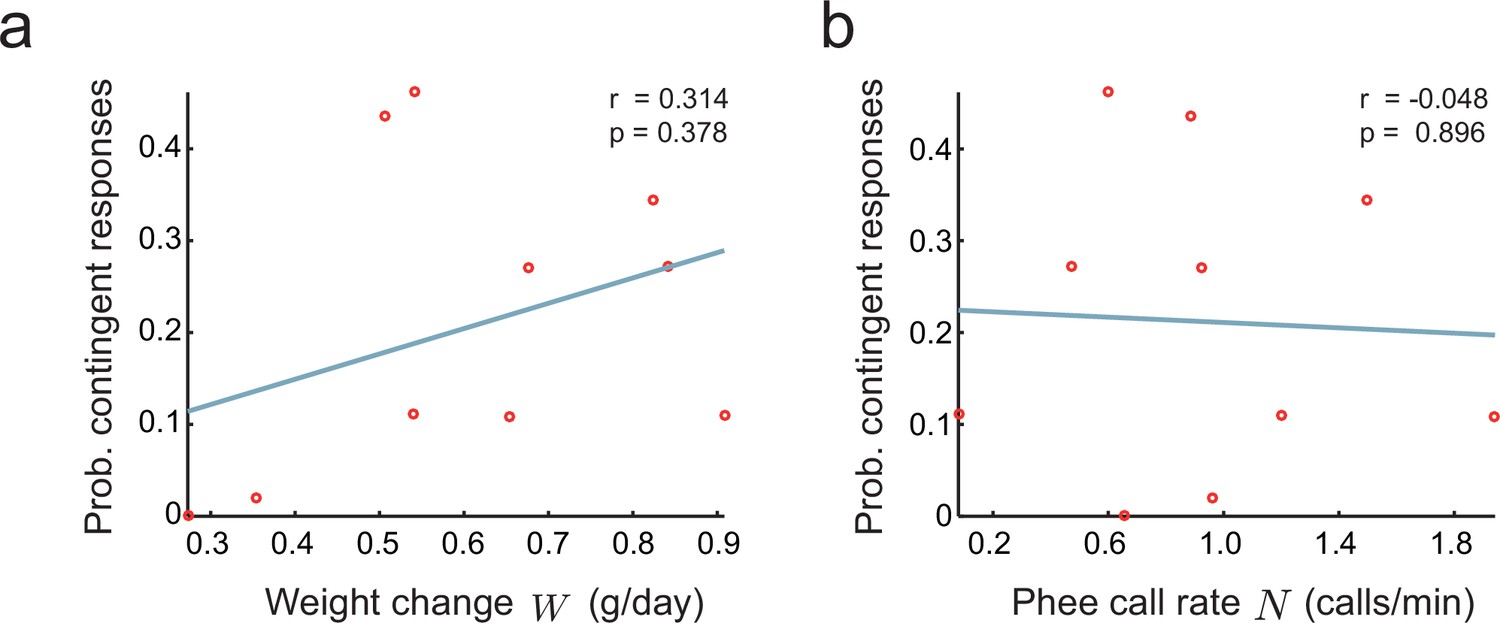
Relationship between parental feedback and infant growth.
(a) Relationship between rate of infant weight change and the probability of parental responses . Red circles represent data ( infants). Line indicates linear fit; Pearson correlation. (b) Relationship between rate of infant phee call production and probability of parental responses ; plot convention as in (a).
Figure 8
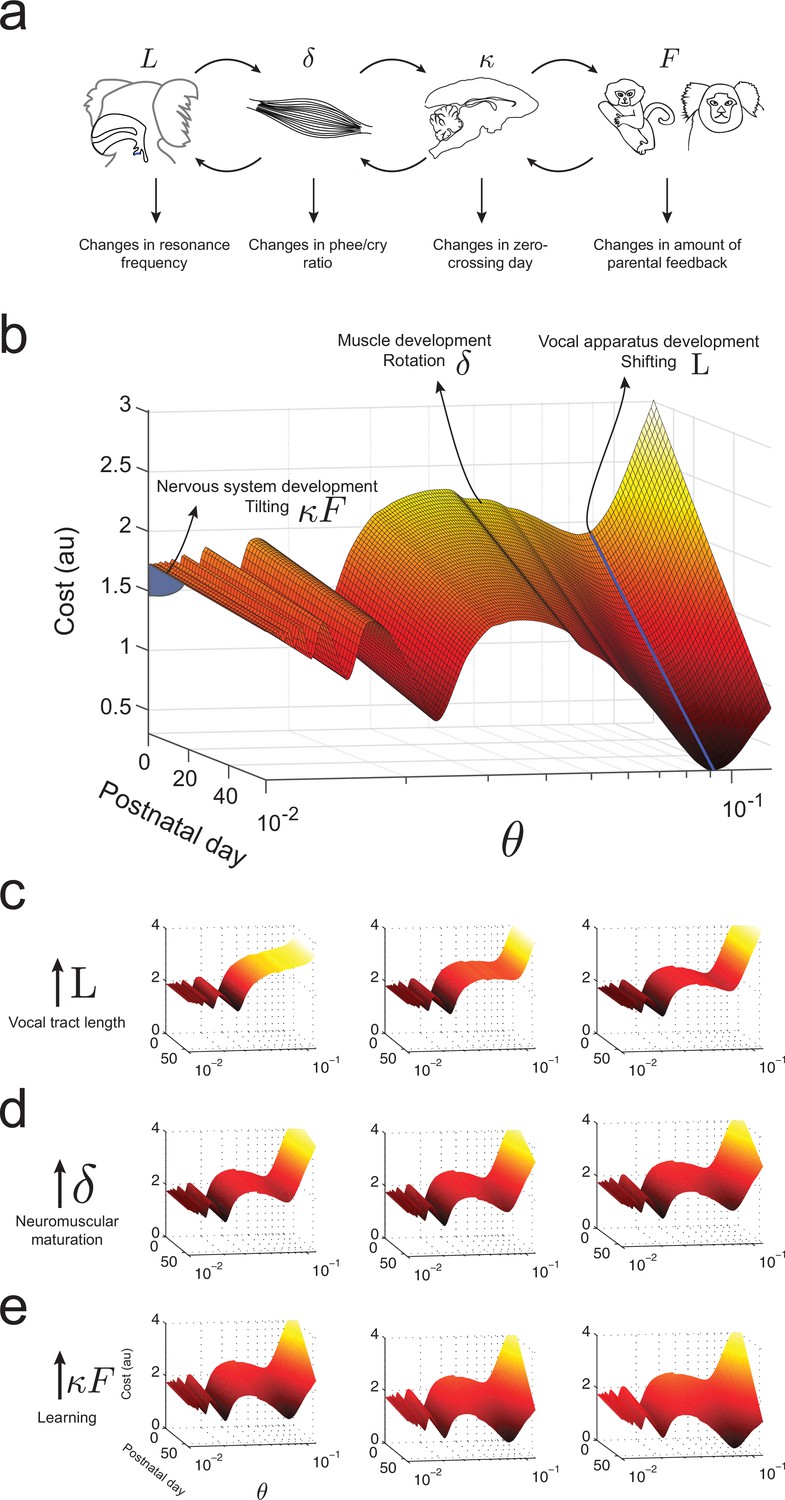
Waddington landscape for vocal development.
(a) Developmental changes associated with each vocal component: vocal tract length , neuromuscular maturation , learning rate , and parental feedback . (b) Different components of vocal behavior change distinct features of the developmental landscape. Similar colors indicate regions with the same cost values; darker colors indicate lower costs. The blue solid line shows the natural frequency of the vocal tract, which depends upon its length . Neuromuscular maturation parameter changes the shape of the landscape. The nervous system, influenced by parental feedback , changes the slope of the landscape, speeding up development as increases; -axis represents values in logarithmic scale. (c) Change in landscape as vocal tract length increases for fixed (left to right). (d) Change in landscape as neuromuscular maturation increases for fixed (left to right). (e) Change in landscape as learning rate times amount of parental feedback increases for fixed (left to right). See Table 2 for parameter values.
Figure 9
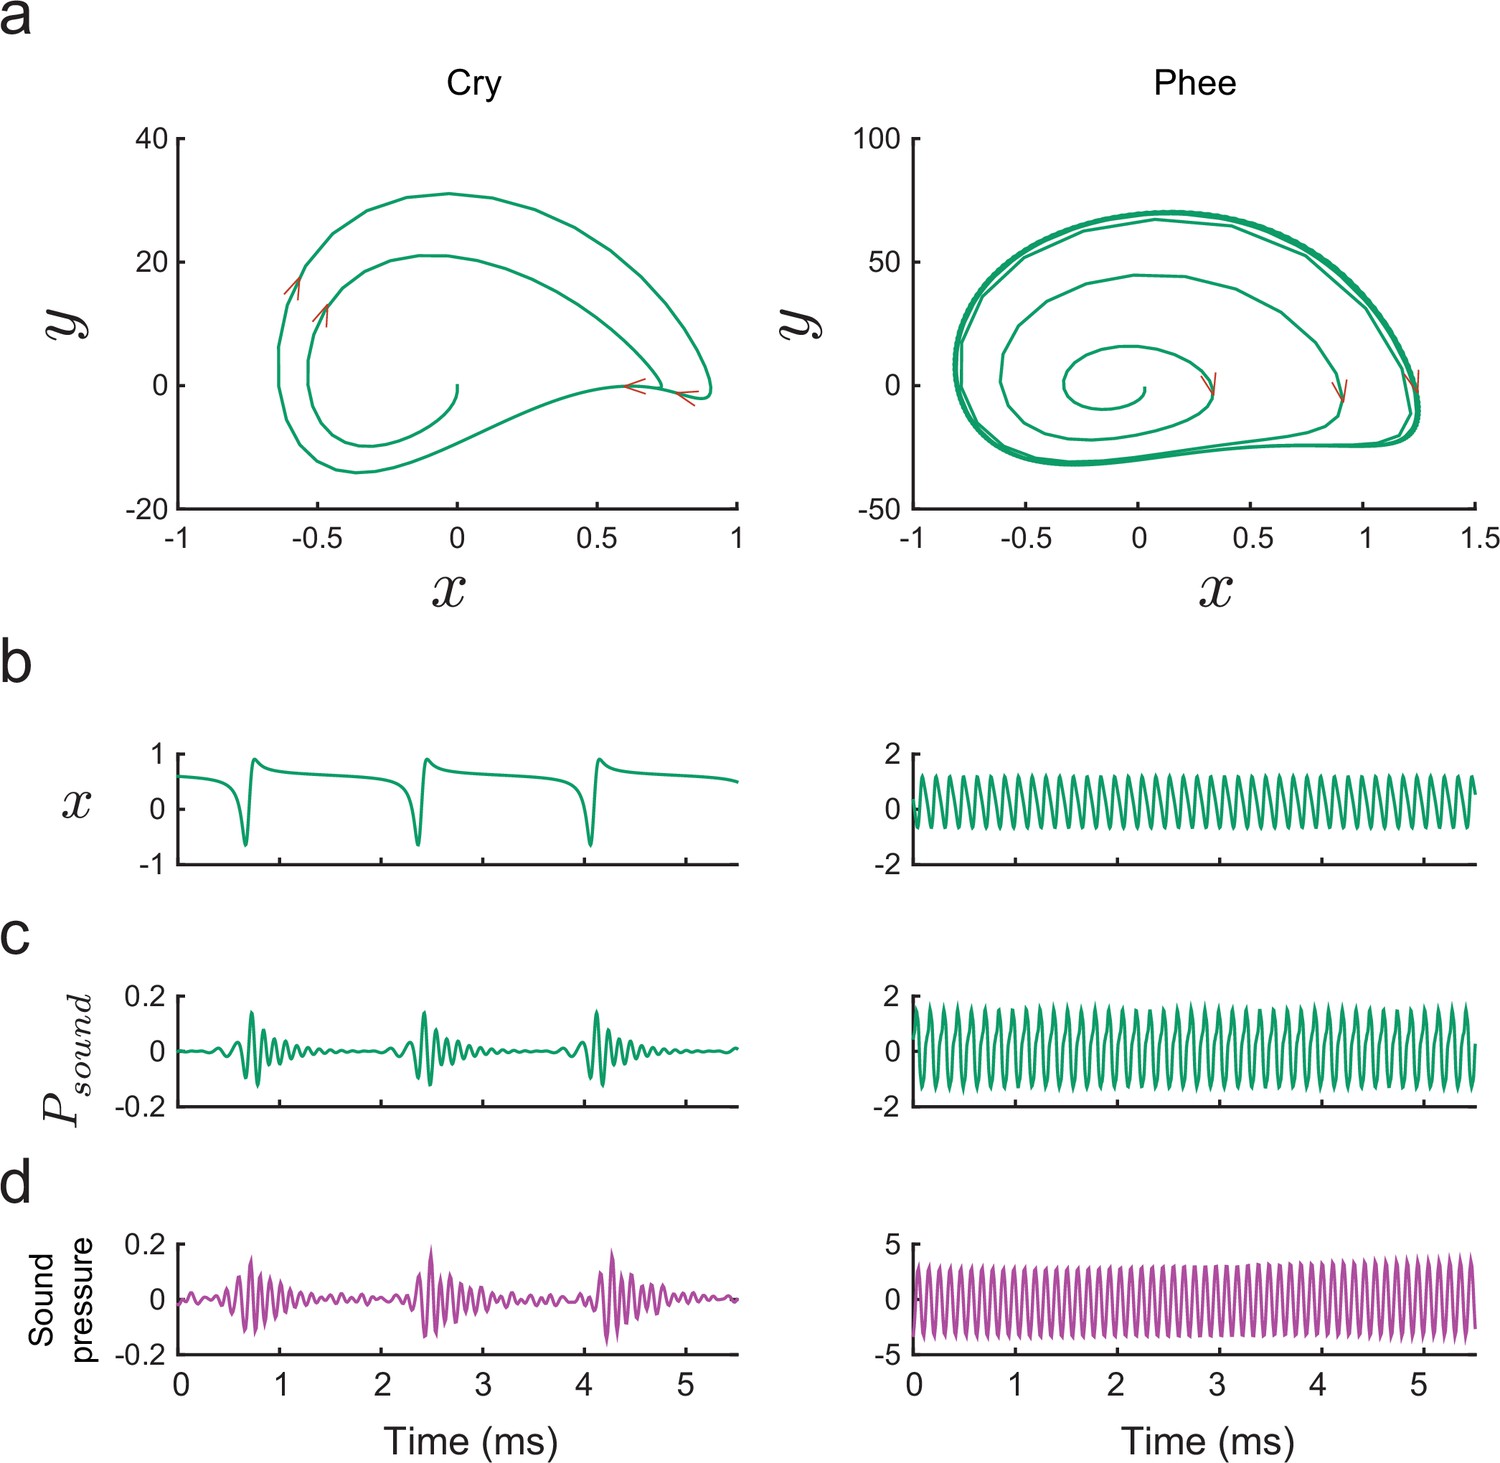
Producing marmoset cries and phees with the model.
(a) Trajectories of plotted vs. for Equation (14) for a cry (left) and a phee (right). Parameter values for cry and for phee respectively. (b) Glottal air flows produced by the model and (c) vocalizations produced after resonance in the vocal tract for a cry and a phee. (d) Cry and phee waveforms for calls recorded from infant marmosets; compare with model waveforms shown in (c). Note different vertical scales on left and right columns, indicating that phees are substantially louder than cries.
Figure 10
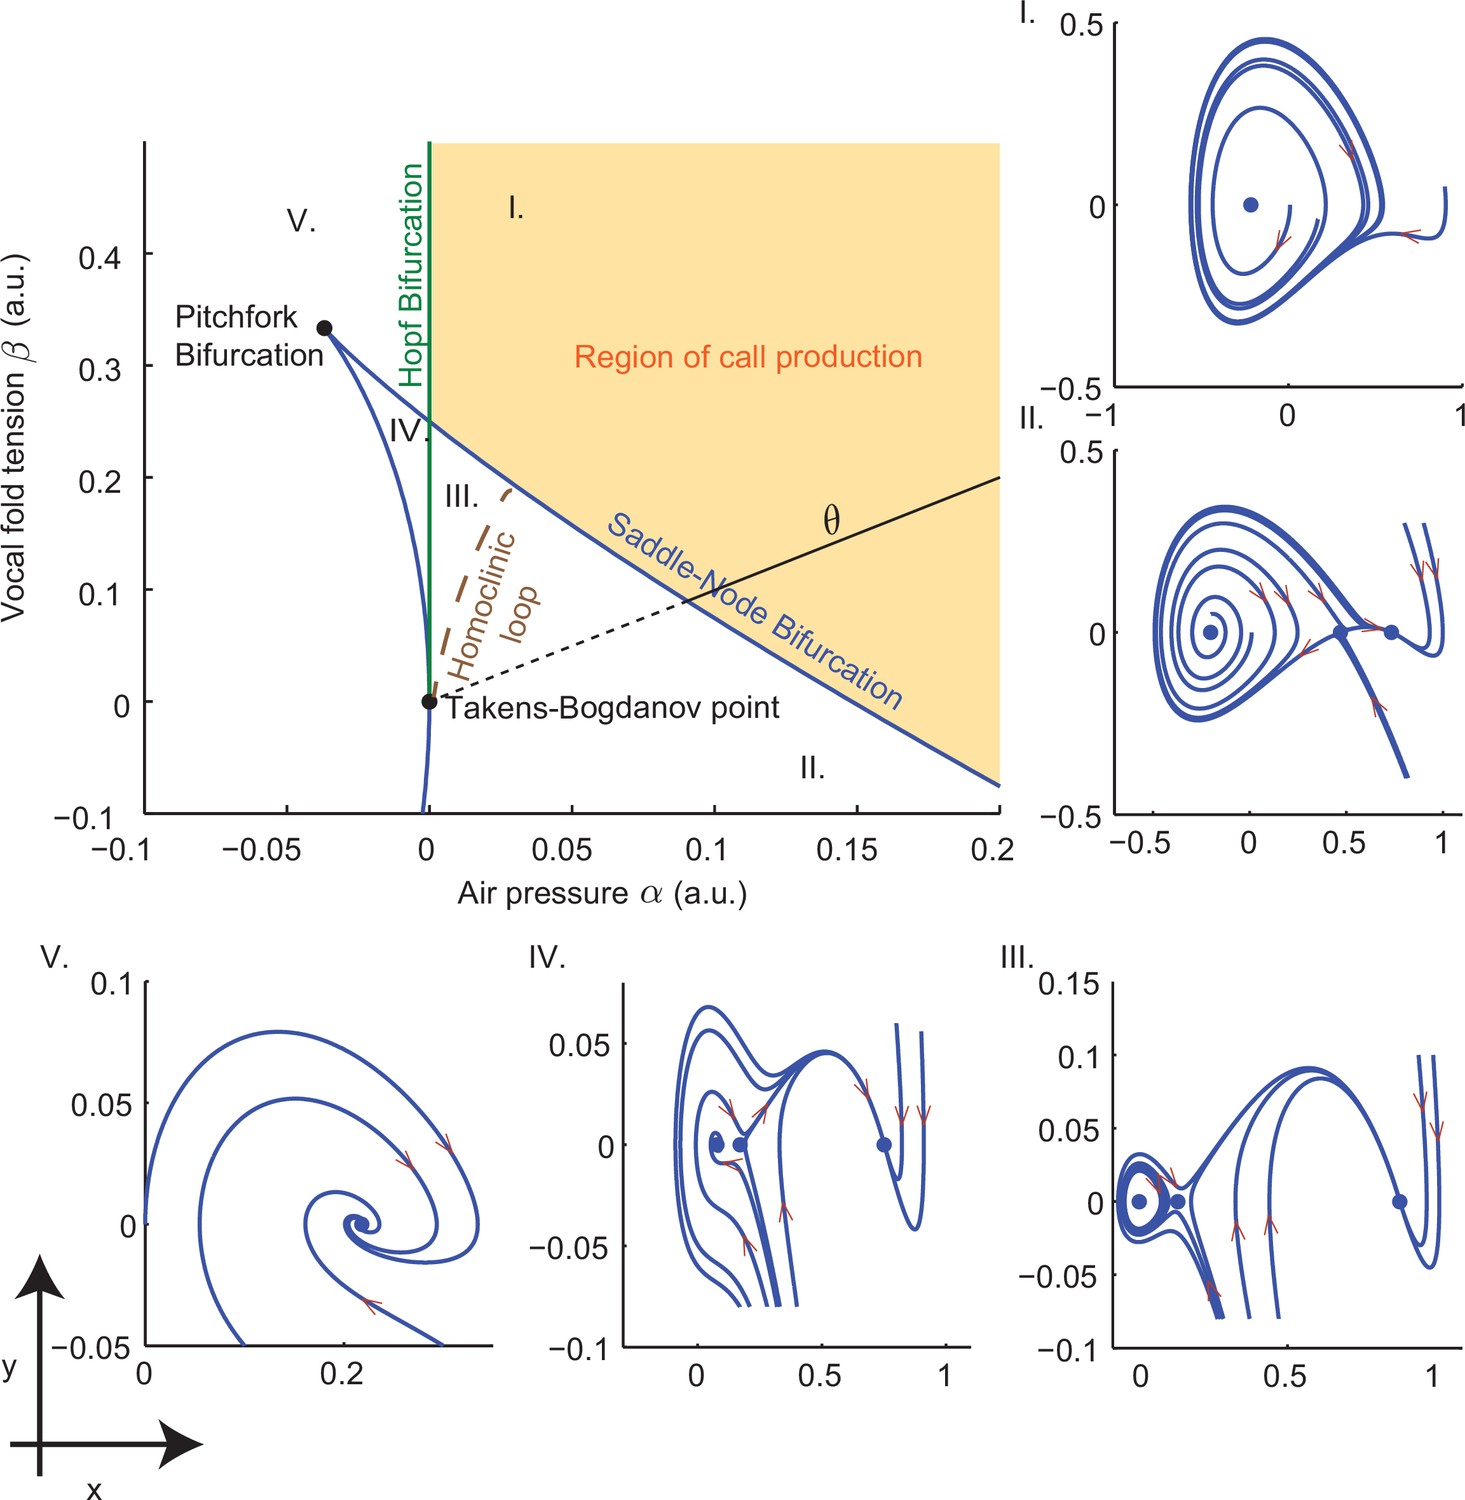
Bifurcation set and phase portraits of the model (Equation (14)).
Top left panel shows the bifurcation set in the parameter space spanned by air pressure and muscle tension . Solid curves indicate saddle-node bifurcations in which pairs of fixed points disappear leaving regions II, III and IV, and Hopf bifurcations in which a stable limit cycle appears entering region I from region V and region III from region IV. Phase portraits in -space illustrate vocal fold dynamics in regions I-V. Sustained oscillations surrounding a source produce calls in region I; a source, sink and saddle coexist with a small limit cycle in region III, but viable calls are not produced. A unique sink exists in region V, two sinks and a saddle in region IV, and a sink, saddle and source in region II; no sustained oscillations appear in these regions. Solid part of the line labeled starting at the Takens-Bogdanov point indicates the axis used in evaluating cost functions. Note that region of -parameter space is smaller than that in Figure 3f–i.
Figure 11
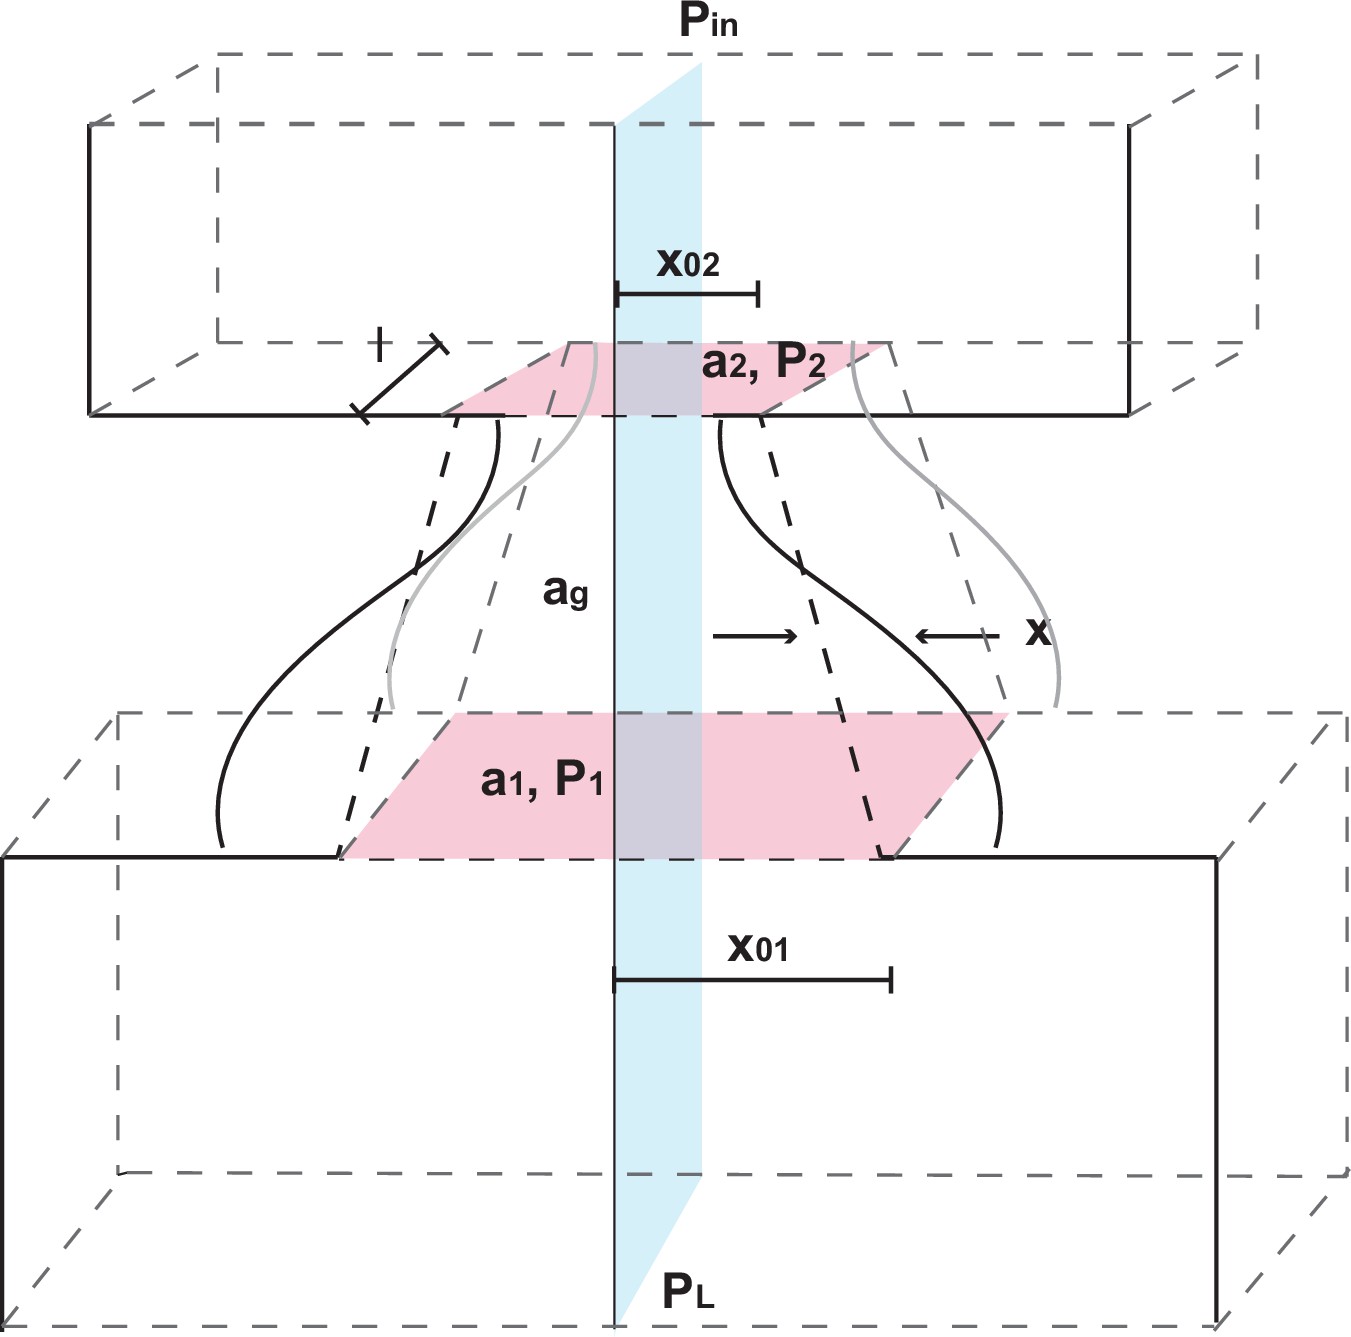
The larynx and glottis model.
The coordinate system is shown with fixed depth , lateral displacement at midpoint, cross sectional areas at larynx entry and exit, at midpoint, air pressures , and prephonatory widths at entry and exit. Adapted from Titze (1988).
Videos
Video 1
Animation showing a typical realization of a diffusion process with cost function as described in Materials and methods: Softmax action selection rule.
The particle travels through a developmental landscape that changes its shape due to changes in vocal apparatus, muscle strength, nervous system, and social interaction. The particle’s location represents the behavior of a marmoset infant. In early postnatal days, it stays mostly in the parameter region producing immature calls, whereas in later postnatal days, it stays mostly in the region producing more mature calls. Diffusion dynamics are shown at intervals of six days. Lower left panel shows the numbers of cries and phees produced in each simulated postanatal day; lower right panel shows the phee/cry ratio for the same postnatal days.
Tables
Table 1
Parameter values used for simulations to fit marmoset calls. The notation means that values are chosen in the range 0 to 1.1.
| Parameter | Description | Value(s) |
|---|---|---|
| Time step size (s) | 5 | |
| Nondimensional pressure | ||
| Nondimensional muscle tension | ||
| Time constant (1/ms) | 45 | |
| Pressure coefficient | 1 | |
| Pressure reflection coefficient | 0.8 | |
| Time for one way sound travel in vocal tract (s) | 50 |
Download links
A two-part list of links to download the article, or parts of the article, in various formats.
Downloads (link to download the article as PDF)
Open citations (links to open the citations from this article in various online reference manager services)
Cite this article (links to download the citations from this article in formats compatible with various reference manager tools)
Vocal development in a Waddington landscape
eLife 6:e20782.
https://doi.org/10.7554/eLife.20782


