Regulation of B cell fate by chronic activity of the IgE B cell receptor
- University of California, San Francisco, United States
- Tsinghua University, China
Figures
Figure 1 with 2 supplements

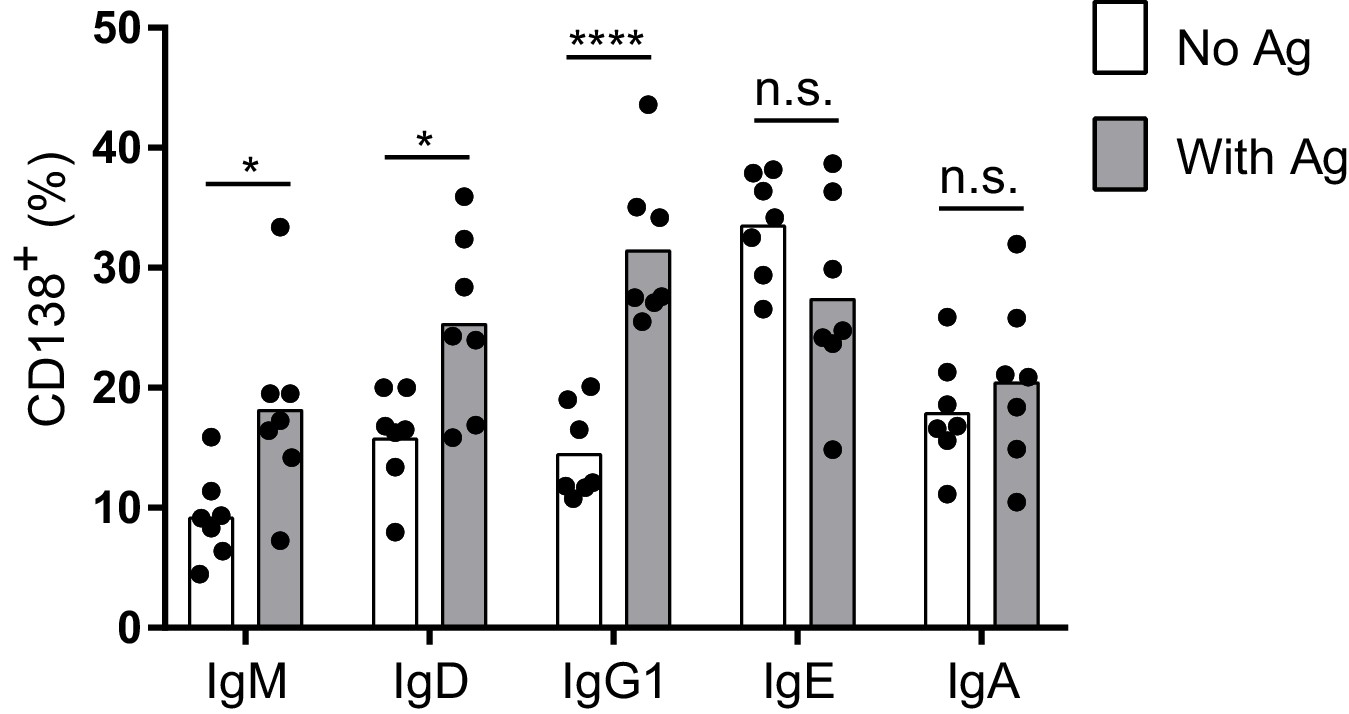
The IgE BCR promotes antigen-independent PC differentiation of mouse B cells in culture.
(A and B) Representative flow cytometry (A) and quantification (B) of PC differentiation (CD138+) from wild-type B cells cultured for 4 d with IL-4 and anti-CD40 (αCD40). Cells were pre-gated as IgD–IgM– and with a broad B220+ gate. (C) Diagram of the retroviral construct for the ectopic expression of BCR heavy chains of various isotypes. A detailed vector diagram is provided in Figure 1—figure supplement 1. (D) Frequency of PCs (CD138+) among AID-deficient B cells ectopically expressing different BCR isotypes or Thy1.1 (Thy1) as a control. Cells were cultured for a total of 4 d with anti-CD40 and IL-4 and were retrovirally transduced on d 1. (E) Diagram of the retroviral construct for the ectopic expression of both heavy and light chains of BCRs specific for TNP. (F) Frequency of PCs (CD138+) among AID-deficient B cells ectopically expressing different isotypes of TNP-specific BCRs in the absence or presence of TNP-OVA antigen (Ag). Cells were cultured for 4d with anti-CD40 and IL-4, were retrovirally transduced on d 1, and antigen was added on d 2. Similar data were obtained with B1-8flox/+ Cγ1Cre/+ B cells (Figure 1—figure supplement 2). Transduced cells for (D) and (F) were identified as Cerulean+. Dots represent data points from individual experiments. Bars represent the mean. LTR, long terminal repeat, which on the 3’ end is self-inactivating (white x); ψ+, extended packaging signal; VH and Vκ, coding sequences for the variable region of the heavy and light chains, respectively; CH and Cκ, coding sequences for constant regions of the heavy chain and light chain, respectively; M1, M2, coding sequences for the M1 and M2 exons; n.s., not significant; **p<0.01; ***p<0.001; ****p<0.0001 (t-tests with the Holm-Sidak correction for multiple comparisons (B,F), or one-way ANOVA with Dunnett’s post-test comparing each heavy chain to the Thy1.1 control sample (D)).
Figure 1—figure supplement 1
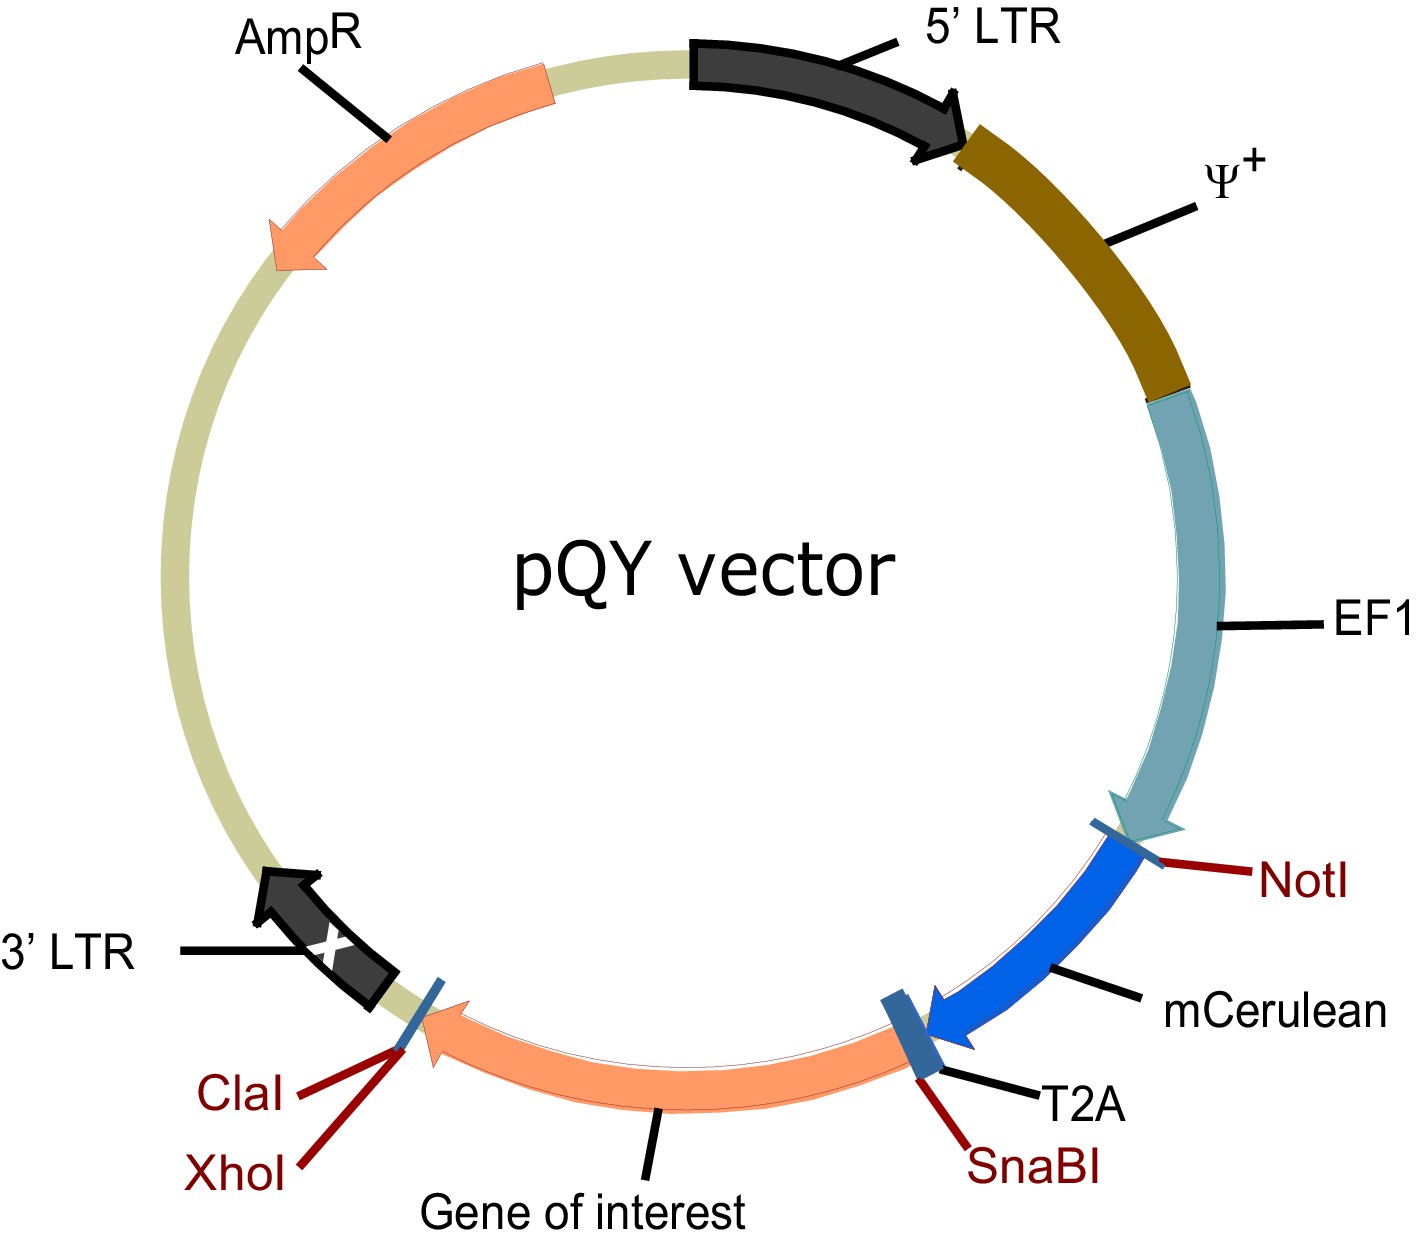
Vector for retroviral transduction of BCRs.
Diagram of the retroviral vector for ectopic expression of different isotypes of BCR in primary B cells and B cell lines. LTR, long terminal repeat, which on the 3’ end is self-inactivating (white x); ψ+, extended packaging signal; EF1, EF1α promoter, AmpR, ampicillin resistantance gene.
Figure 1—figure supplement 2
Antigen-independent versus antigen-dependent PC differentiation with B1-8flox/+ Cγ1Cre/+ B cells.
Quantification of the frequency of PCs (CD138+) in B1-8flox/+ Cγ1Cre/+ B cells ectopically expressing different isotypes of TNP-specific BCRs in the absence or presence of TNP-OVA antigen (Ag). Transduced cells were identified as Cerulean+. Dots represent data points from individual experiments, bars represent the mean. n.s., not significant; *p<0.05; ****p<0.0001 (t-tests with the Holm-Sidak correction for multiple comparisons).
Figure 2 with 1 supplement
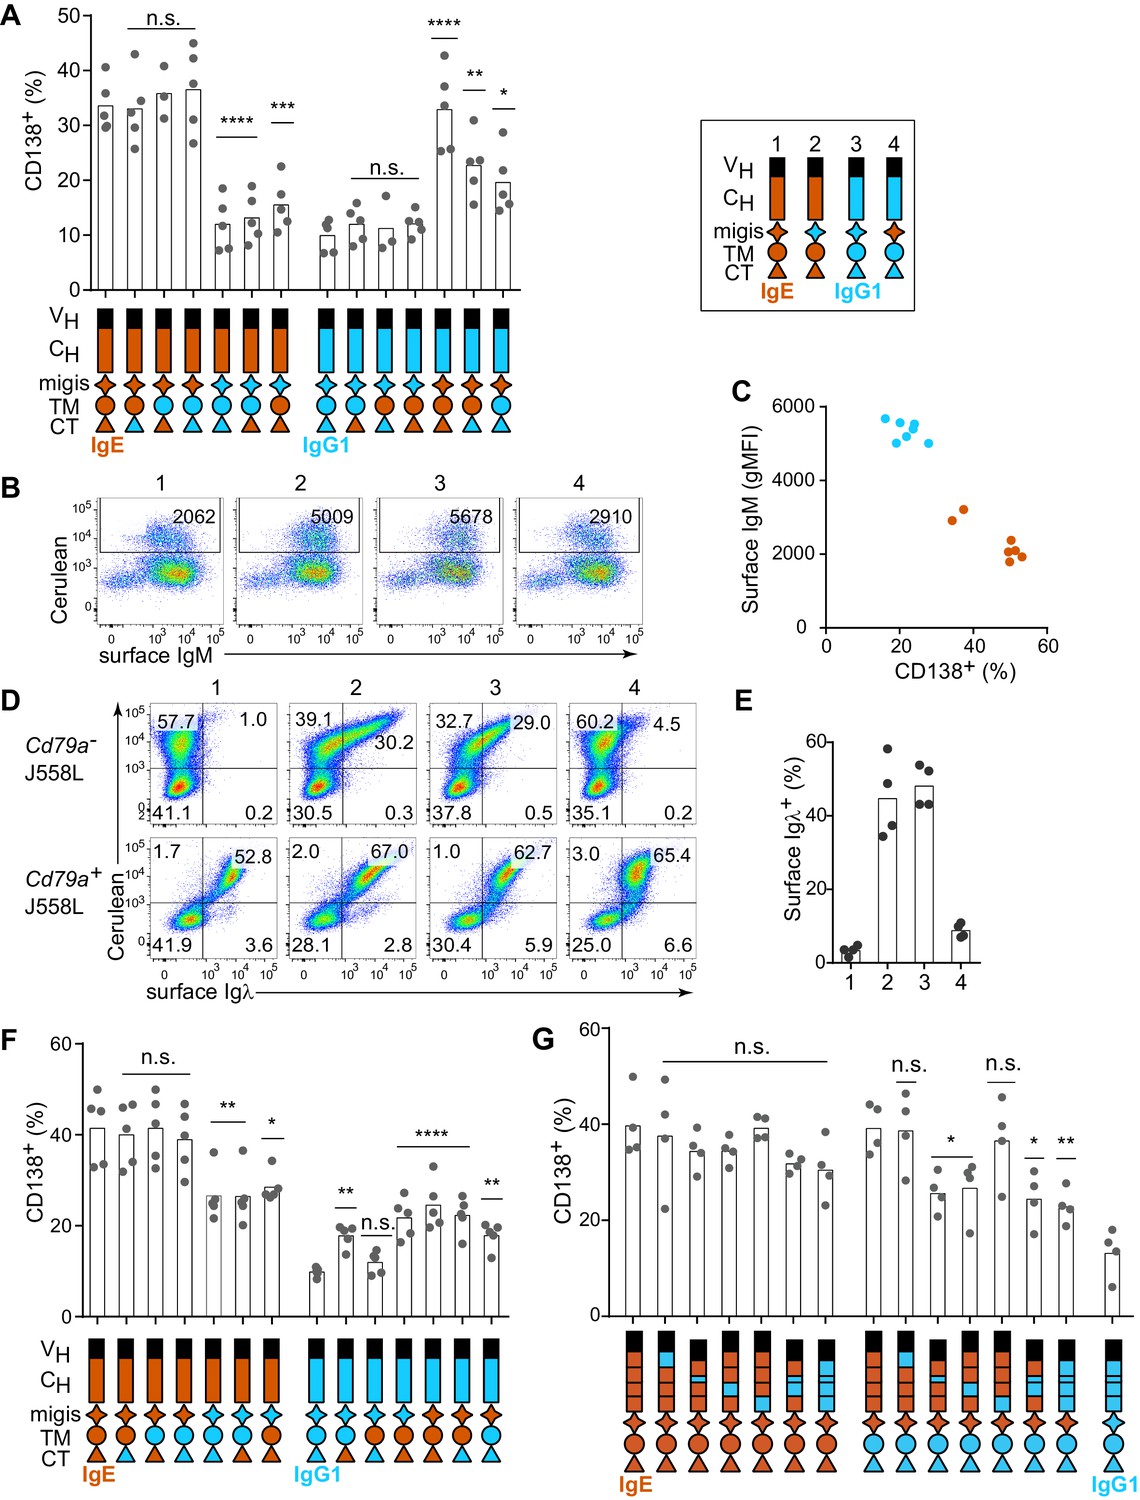
Contribution of different domains of the IgE BCR to antigen-independent PC differentiation.
Cells were retrovirally transduced with constructs in which the domains of IgE (orange) and IgG1 (blue) were swapped as illustrated (see legend in upper-right for numbered constructs in (B, D, and E)). Primary B cells were cultured with anti-CD40 and IL-4 in (A–C and F–G). (A) Frequency of PC differentiation (CD138+) among transduced AID-deficient B cells. (B) Representative flow cytometry of the surface abundance of IgM in transduced AID-deficient B cells. Numbers in the plots show the gMFI of surface IgM. (C) Inverse correlation of cell surface IgM with PC differentiation (CD138+) in transduced AID-deficient B cells. Each dot represents the results from B cells transduced with a distinct chimeric BCR from the constructs shown in (A); dots in orange represent chimeric BCRs with the migis derived from IgE; dots in blue represent chimeric BCRs with the migis derived from IgG1. (D) Representative flow cytometry of surface BCR (λ light chain) expression on transduced J558L cells. The lower panels depict cells that had been stably transduced with Cd79a (Igα). (E) Quantification of surface BCR (λ light chain) expression on transduced (Cerulean+) J558L cells (Cd79a–). (F and G) Frequency of PC differentiation (CD138+) among transduced B1-8flox/+ Cγ1Cre/+ B cells. In (G) the individual CH domains of IgE and IgG1 were swapped as illustrated. Surface BCR and Cerulean reporter expression are provided in Figure 2—figure supplement 1. Transduced cells were identified as Cerulean+ (A–E) with the addition of IgM–IgD– (F–G). Dots represent data points from individual experiments, except in (C) where the data are from a single experiment representative of three independent experiments. Bars represent the mean. VH, coding sequence for the variable region of the heavy chain; CH, coding sequence for the constant region of the heavy chain; TM, transmembrane region; CT, cytoplasmic tail; gMFI, geometric mean fluorescence intensity; n.s., not significant. **p<0.01, ***p<0.001, ****p<0.0001 (for each group of related constructs, one-way ANOVA with Dunnett’s post-test comparing each construct to the leftmost parent construct).
Figure 2—figure supplement 1
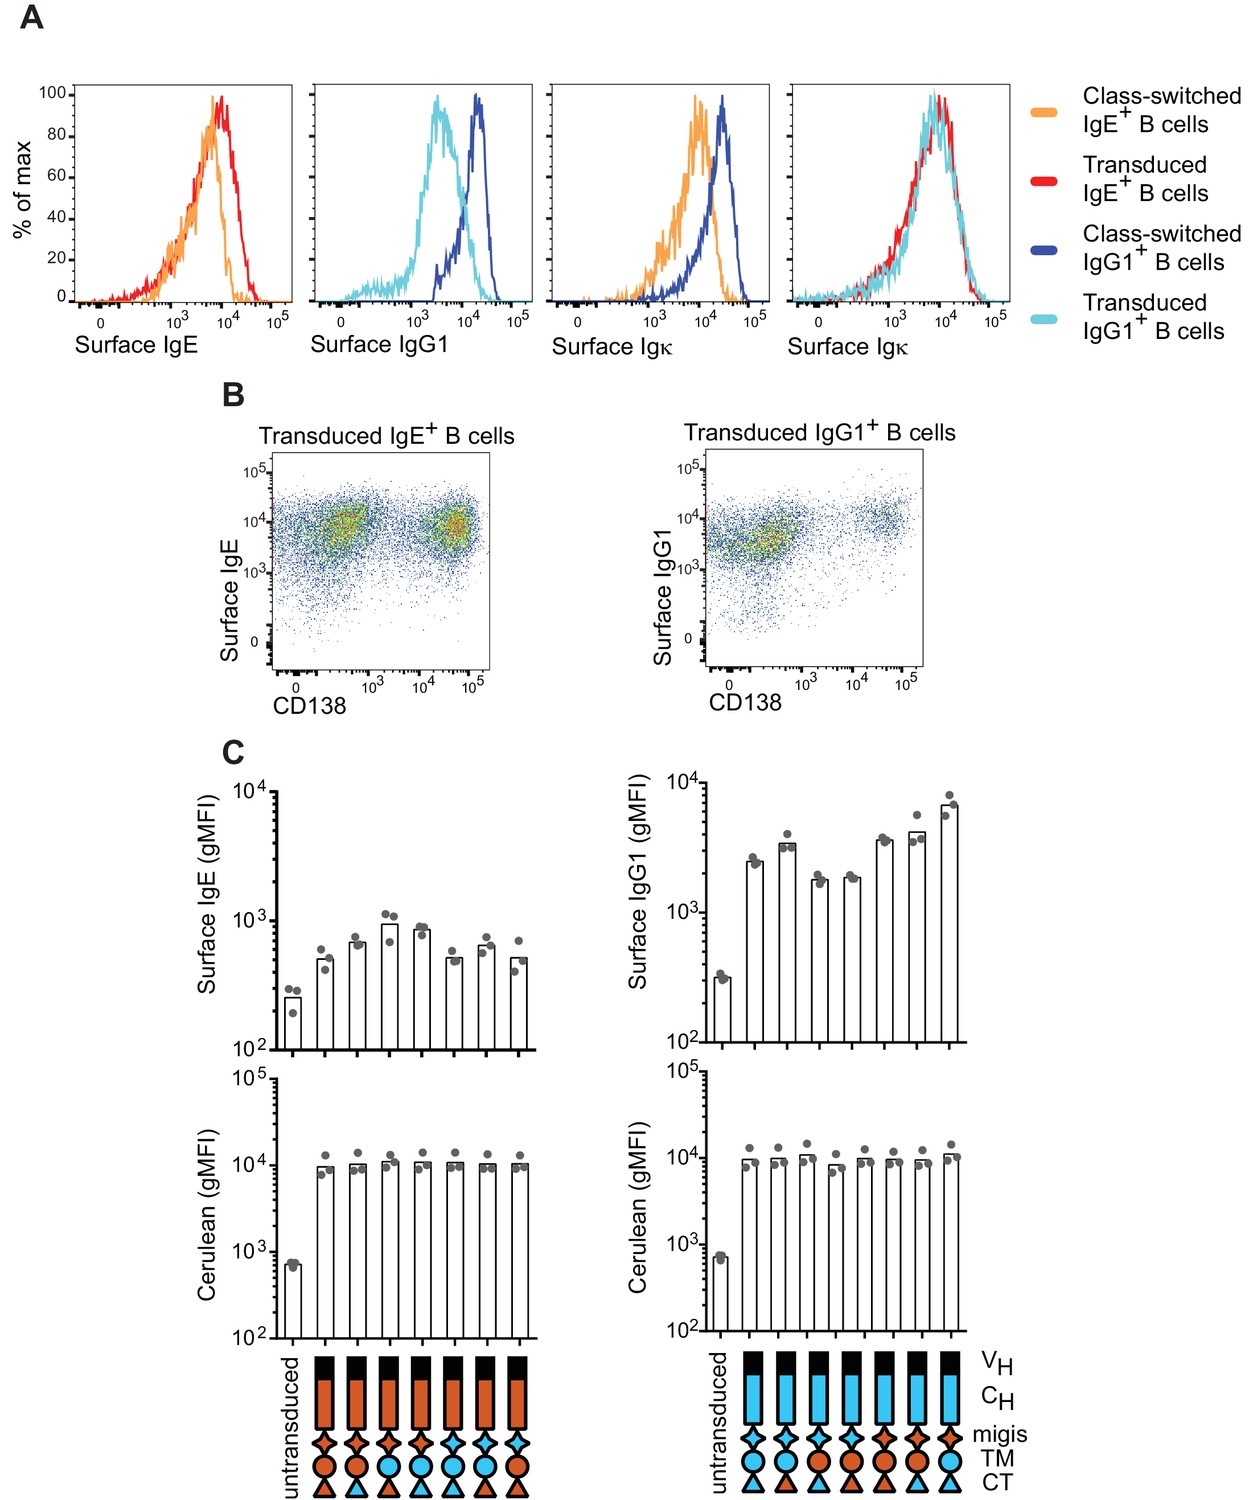
Surface expression of BCRs on naturally class-switched versus transduced primary B cells.
B cells were cultured for 4 d with anti-CD40 and IL-4. (A) Representative histograms of surface BCR expression measured by isotype-specific antibodies (surface IgE, surface IgG1) or anti-κ light chain (surface Igκ) on wild-type B cells that underwent natural CSR to IgE or IgG1 (class-switched) versus on B1-8flox/+ Cγ1Cre/+ B cells retrovirally transduced with IgE or IgG1. Cells were pre-gated as IgM–IgD– and transduced cells were identified as Cerulean+. (B) Representative flow cytometry of B1-8flox/+ Cγ1Cre/+ B cells retrovirally transduced with IgE or IgG1 BCRs. Cells were pre-gated as IgM–IgD–Cerulean+. (C) Quantification of surface BCR expression measured with isotype-specific antibodies (upper panels) and Cerulean fluorescence intensity (lower panels). AID-deficient B cells were retrovirally transduced with the indicated constructs (related to Figure 2A). Dots represent data points from individual experiments, bars represent the geometric mean fluorescence intensity (gMFI). VH, coding sequence for the variable region of the heavy chain; CH, coding sequence for the constant region of the heavy chain; TM, transmembrane region; CT, cytoplasmic tail.
Figure 3
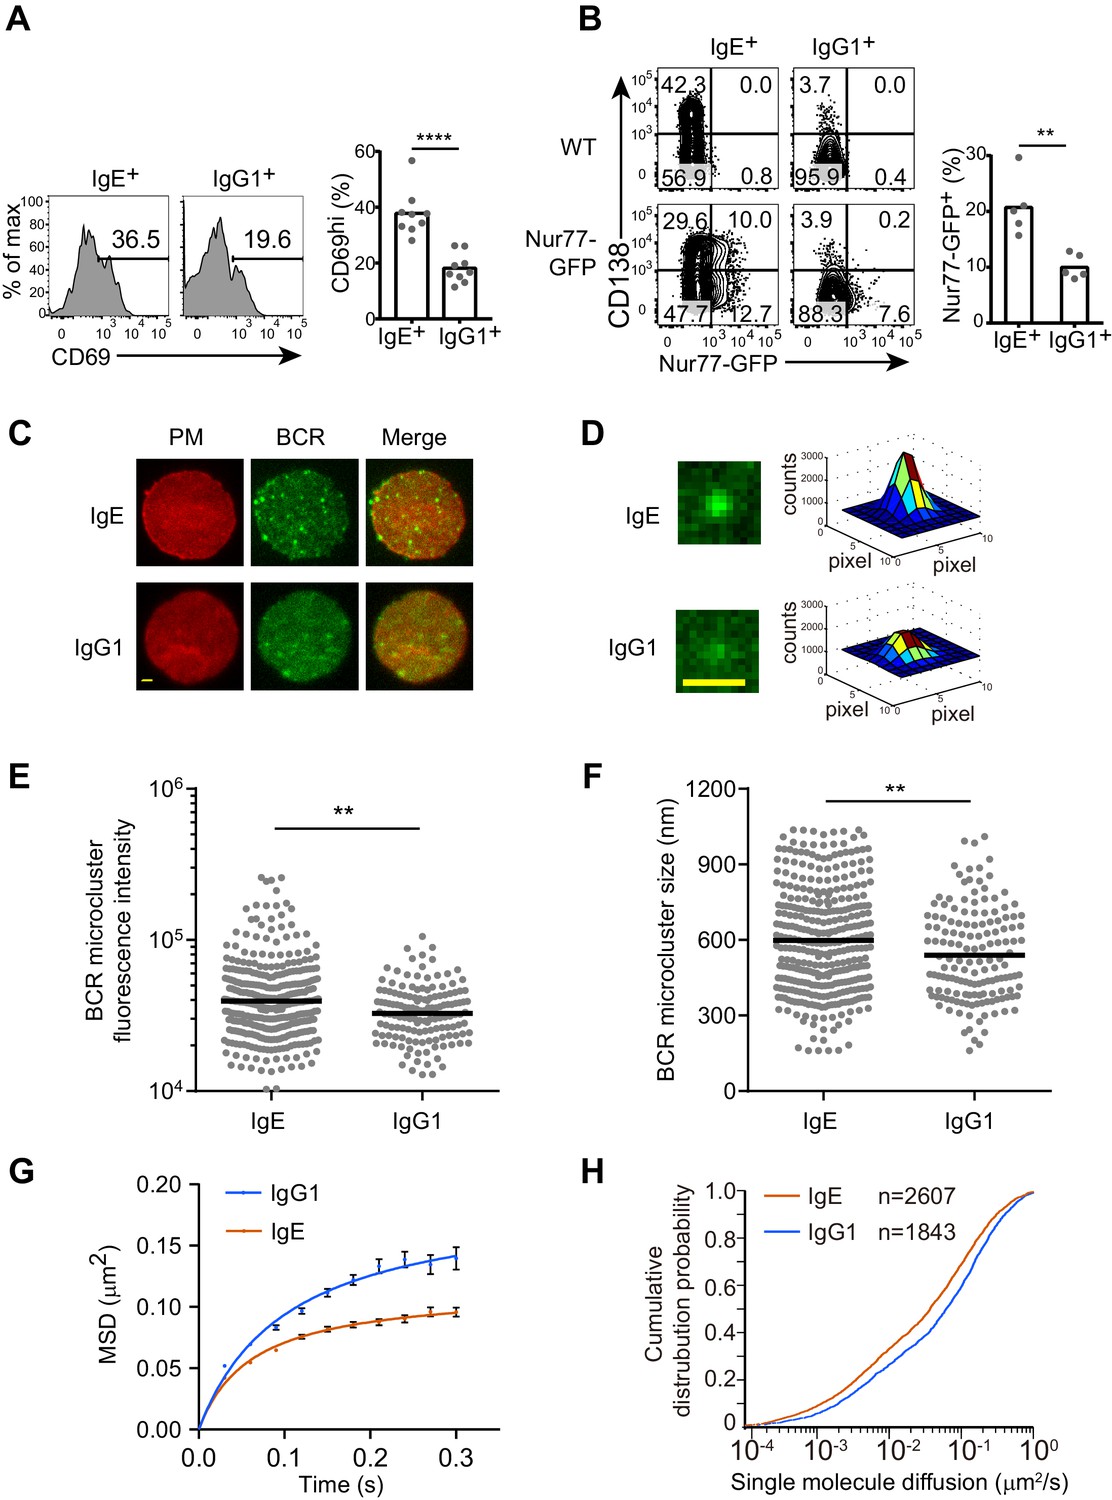
The IgE BCR exhibits differential constitutive activity compared with the IgG1 BCR.
(A and B) Primary B cells were cultured for 4 d with IL-4 and anti-CD40 followed by flow cytometric evaluation of IgE+ and IgG1+ cells as in Figure 1A. Representative flow cytometry (left) and quantification (right) of the frequency of cells that were CD69+ (A) or Nur77-GFP+ (B). Dots represent individual samples pooled from four (A) or five (B) experiments. (C–H) TIRF microscopy of J558L cells that were transduced with the IgE or IgG1 BCRs together with Igα-YFP (‘BCR’) and stained to show the plasma membrane (PM). (C and D). Representative TIRF microcopy images of single cells (C) and individual BCR clusters (D). Scale bars, 1.5 µm. (E and F) Quantification of the fluorescence intensity (E) and size (F) of BCR microclusters. Dots indicate individual measurements. (G and H) Characterization of the Brownian diffusion coefficient of IgE and IgG1 BCRs by single molecule tracking, displayed as mean squared displacement (MSD) versus time (G) and cumulative probability distribution (H) plots. Bars show the mean (A, B, and F) or the geometric mean (E). Error bars (G) indicate the SEM. **p<0.01, ***p<0.001, ****p<0.0001 (Mann-Whitney U-test).
Figure 4 with 1 supplement
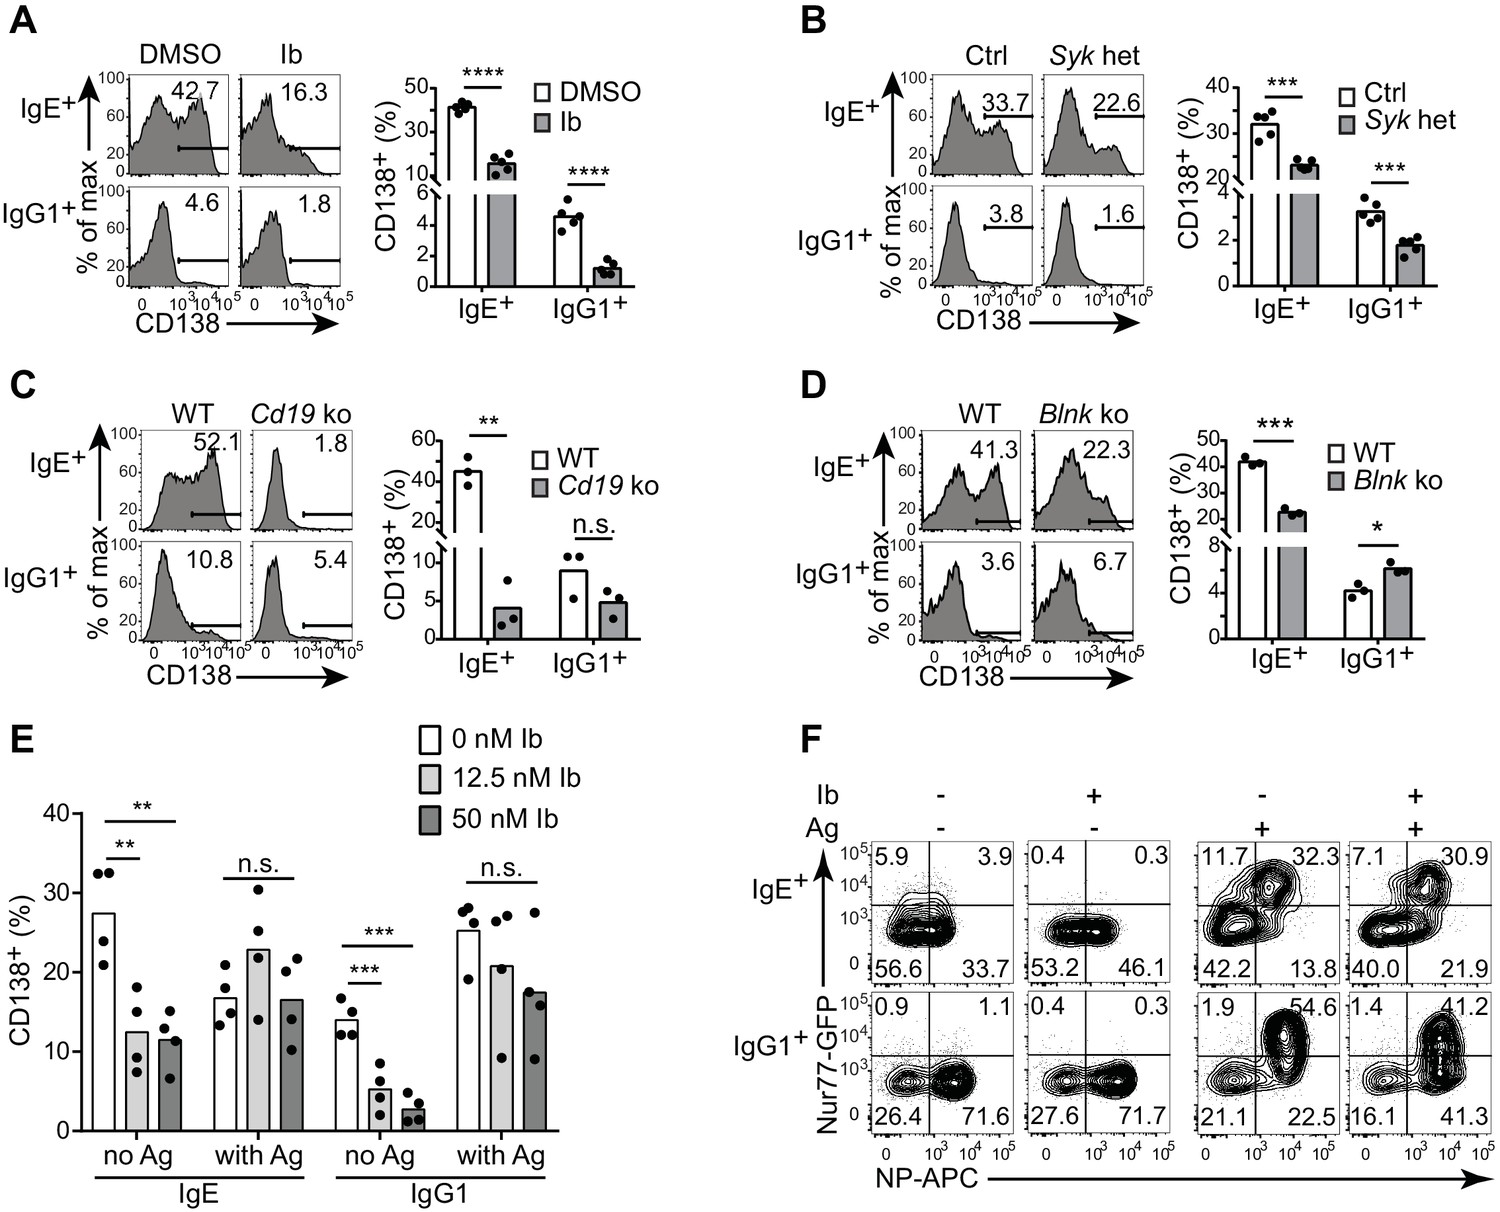
Antigen-independent PC differentiation mediated by the IgE BCR is sensitive to perturbations in BCR signaling.
B cells were cultured with IL-4 and anti-CD40 for 4 d. (A–D) Representative flow cytometry (left) and quantification (right) of PC differentiation (CD138+) among B cells that were treated with DMSO solvent control versus 12.5 nM ibrutinib (Ib) (A), from control (Ctrl) Syk+/+ Cγ1Cre/+ versus Sykflox/+ Cγ1Cre/+ (Syk het) mice (B), from wild-type (WT) control versus Cd19Cre/Cre (Cd19 ko) mice (C), or from wild-type (WT) control versus Blnk–/– (Blnk ko) mice (D). Cells were gated as in Figure 1A. See also Figure 4—figure supplement 1. (E) Quantification of the frequency of PCs (CD138+) among B1-8flox/+ Cγ1Cre/+ B cells retrovirally transduced with TNP-specific IgE or IgG1 BCRs. Ibrutinib (Ib) was added immediately after spinfection (d 1), antigen (TNP-OVA) was added on d 2, and cells were analyzed on d 4. Transduced cells were identified as IgM–IgD–Cerulean+. (F) Flow cytometry of GFP expression in B1-8i, Nur77-GFP B cells. 12.5 nM ibrutinib (Ib) was added on d 2 and then the cognate antigen NP-APC (Ag) was added on d 3, and cells were analyzed on d 4 with further staining on ice with NP-APC to detect antigen-specific cells. Data are representative of two experiments. Dots represent data points from individual experiments. Bars represent the mean. *p<0.05, **p<0.01, ***p<0.001, ****p<0.0001 (t-tests with the Holm-Sidak correction for multiple comparisons (A–D), one-way ANOVA followed by Dunnett’s post-test (E)).
Figure 4—figure supplement 1
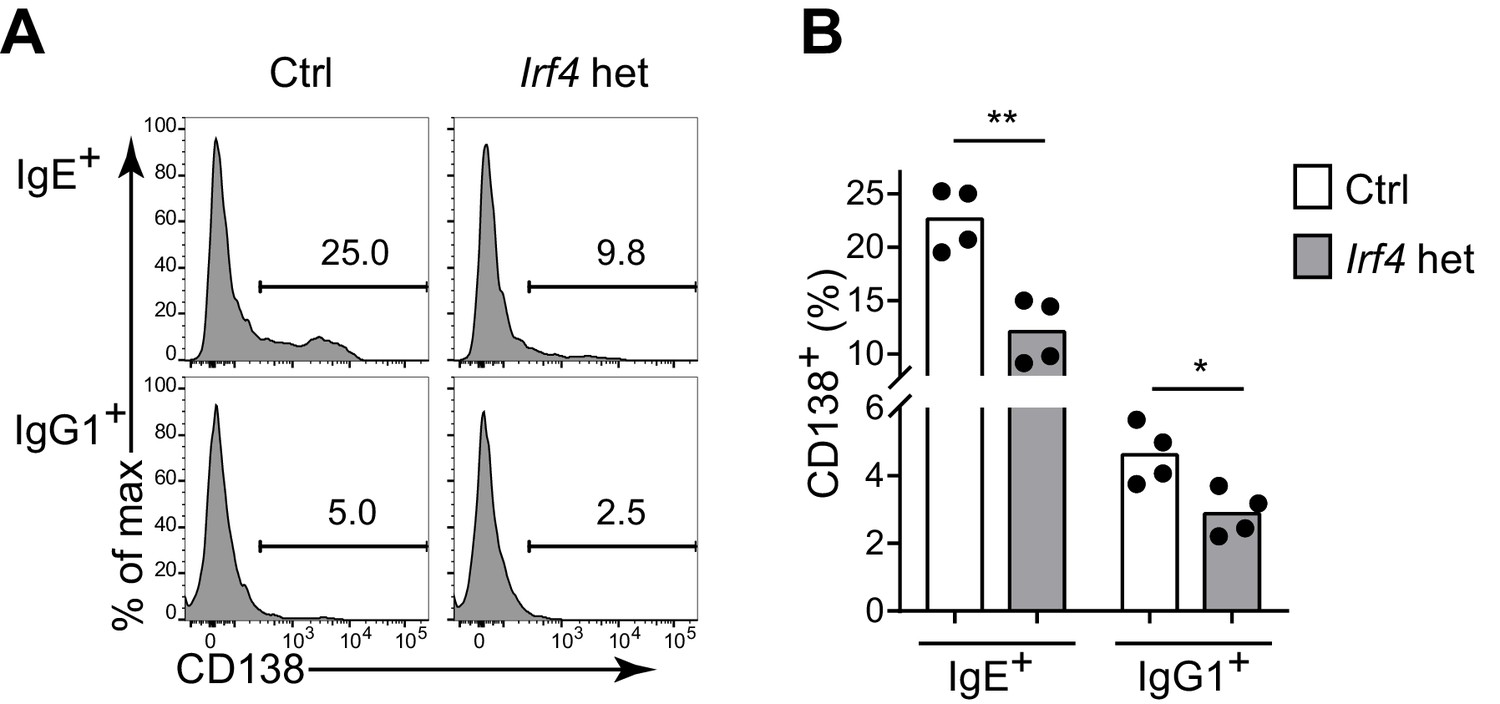
IRF-4 contributes to antigen-independent PC differentiation mediated by the IgE BCR in cell culture.
Representative flow cytometry (A) and quantification (B) of PC differentiation (CD138+) of control Irf4+/+ Cγ1Cre/+ (Ctrl) versus Irf4flox/+ Cγ1Cre/+ (Irf4 het) B cells cultured for 4 d with IL-4 and anti-CD40. Cells were gated as in Figure 1A. Dots represent data points from separate experiments, bars represent the mean. *p<0.05, **p<0.01, (t-tests with the Holm-Sidak correction for multiple comparisons).
Figure 5 with 2 supplements
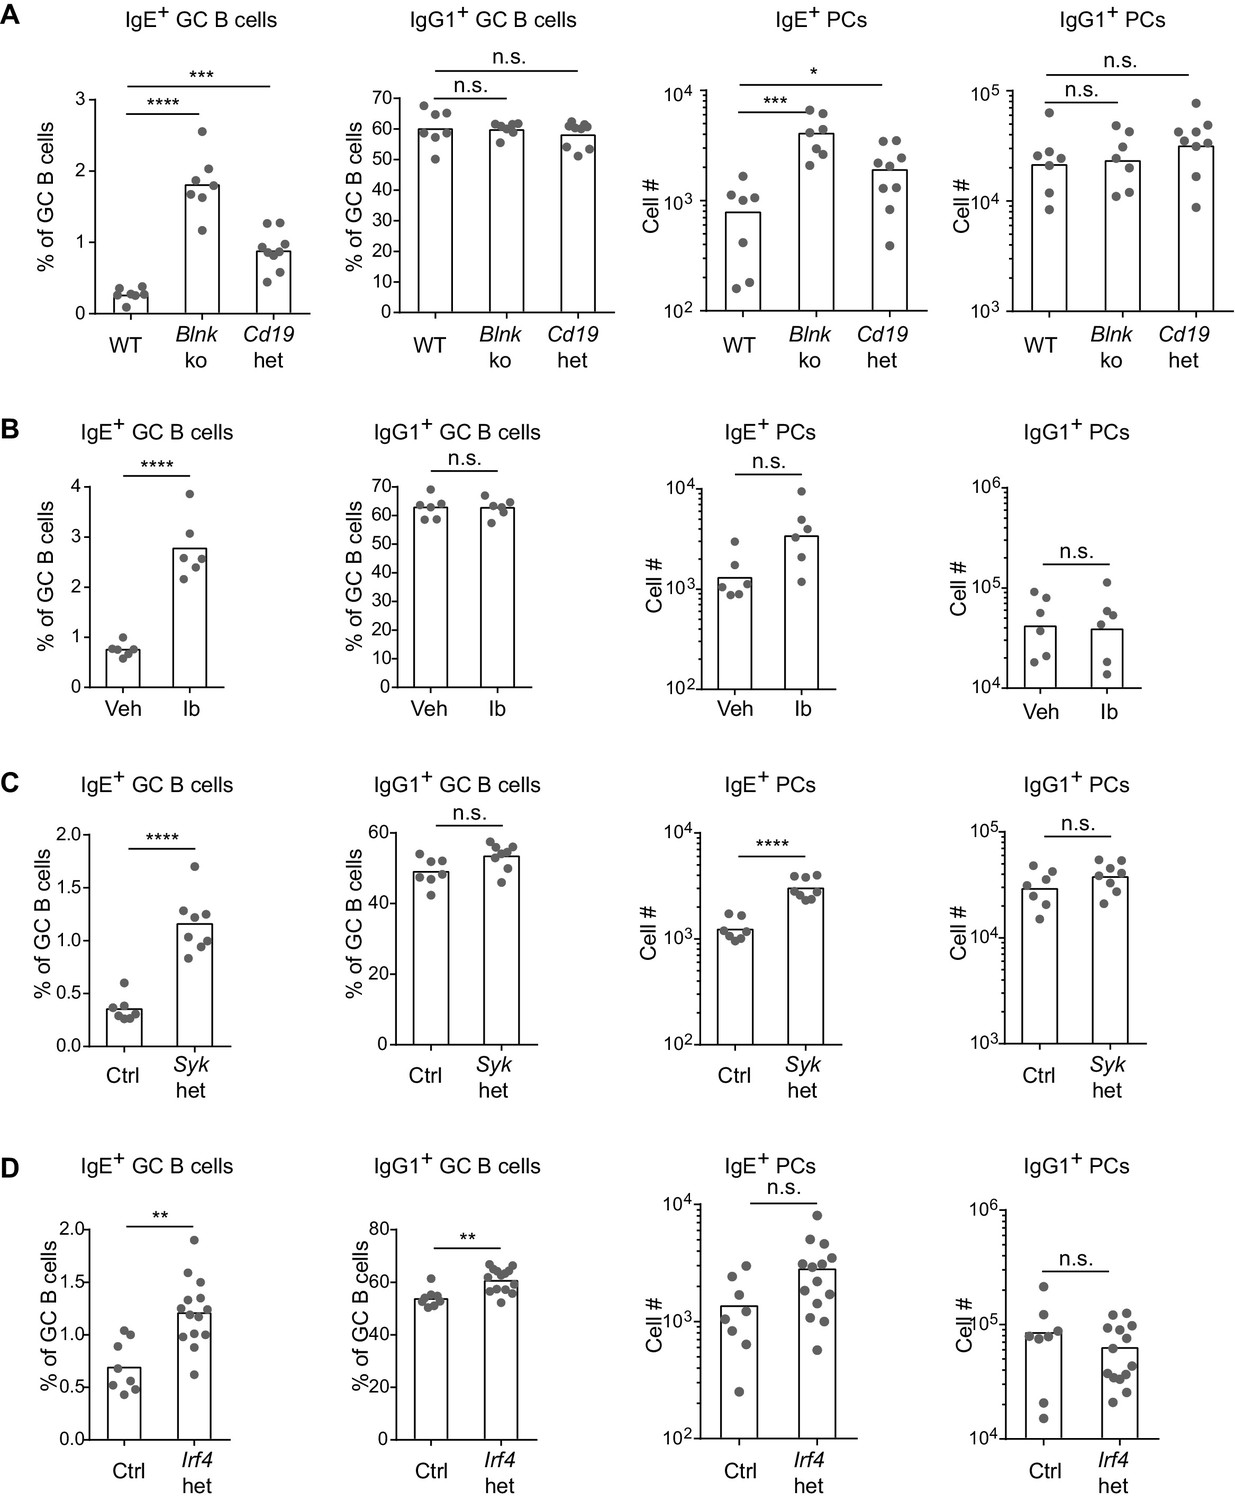
BCR signaling negatively regulates in vivo IgE+ responses.
Mice were immunized subcutaneously with NP-CGG in alum adjuvant and draining lymph nodes were analyzed by flow cytometry 9 d later. (A to D) Quantification of frequency of IgE+ and IgG1+ cells among GC B cells and the total number of IgE+ and IgG1+ PCs in wild-type (WT) versus Blnk–/– (Blnk ko) versus Cd19Cre/+ (Cd19 het) mice (A), Captex 355 vehicle (Veh) versus ibrutinib (Ib)-treated mice (B), control Syk+/+ Cγ1Cre/+ (Ctrl) versus Sykflox/+ Cγ1Cre/+ (Syk het) mice (C), control Irf4+/+ Cγ1Cre/+ (Ctrl) versus Irf4flox/+ Cγ1Cre/+ (Irf4 het) mice (D). The total number of lymph node cells and GC B cells are provided in Figure 5—figure supplement 1. An analysis of somatic hypermutation related to (C) is provided in Figure 5—figure supplement 2. PCs were CD138+B220lo-intCD38loIgDlo and intracellular IgEhi or total IgG1hi. GC B cells were CD138–B220hiPNAhiCD38loIgDlo and intracellular IgEint or total IgG1int. Dots represent individual mice. Bars represent the mean (% of GC B cells) or geometric mean (cell number). Data are representative of two (A), three (C), and four (B) independent experiments. n.s., not significant; **p<0.01; ***p<0.001; ****p<0.0001 (one-way ANOVA followed by Dunnett’s post-test (A), t-tests with the Holm-Sidak correction for multiple comparisons (B–D); the numbers of PCs were log transformed for all statistical tests).
Figure 5—figure supplement 1
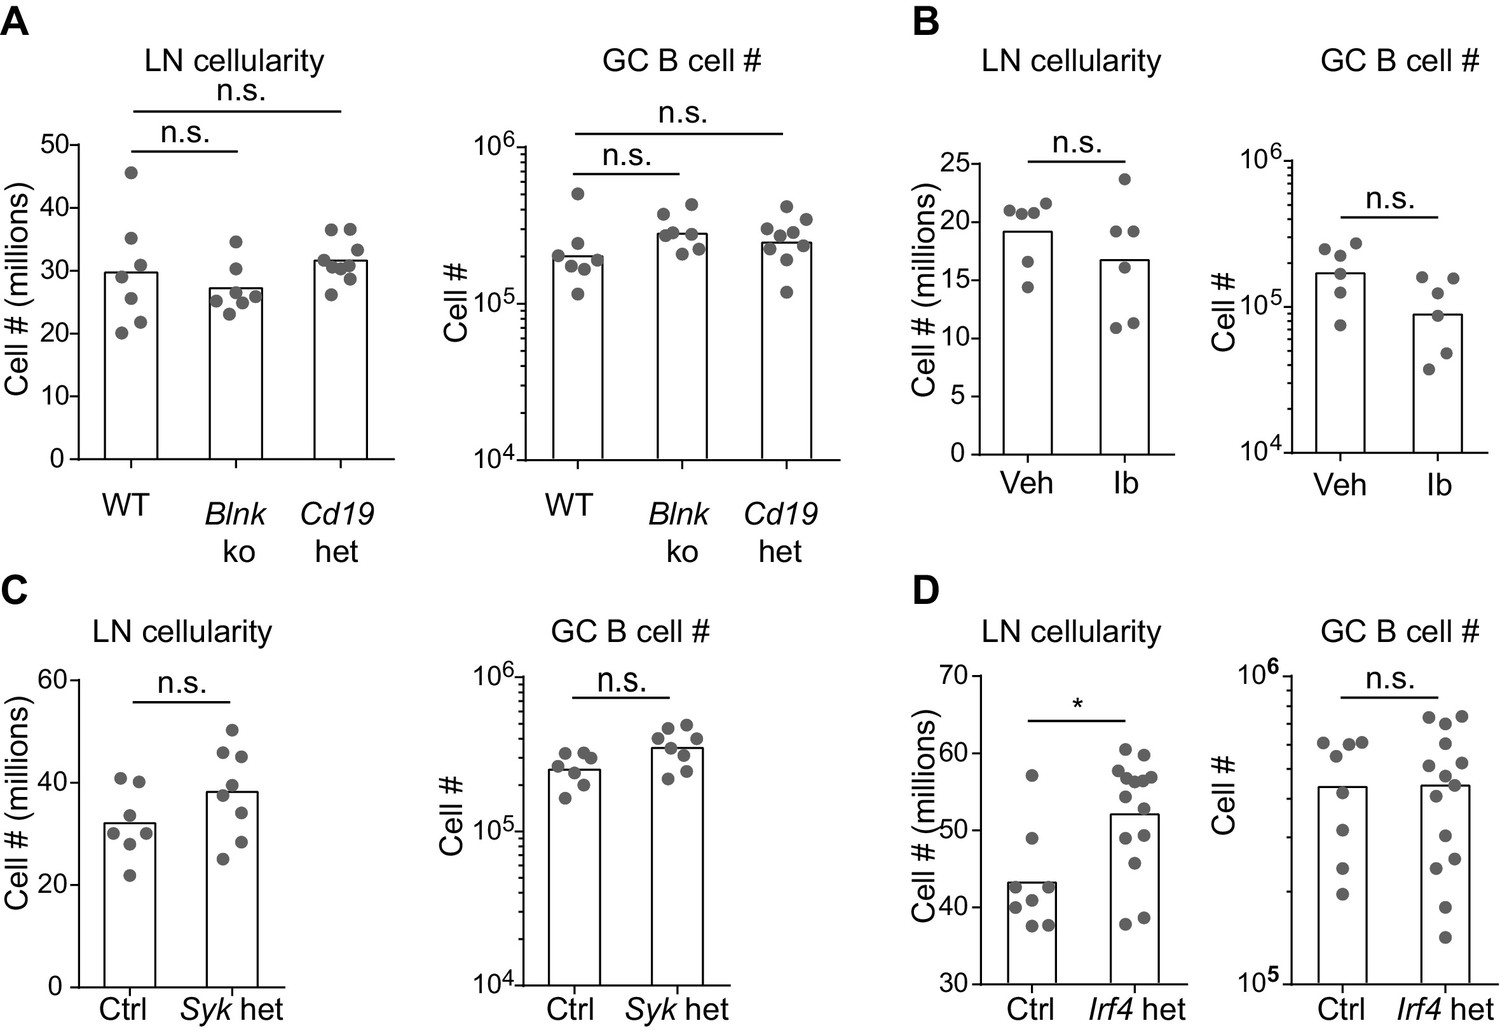
Number of total lymph node cells and GC B cells in mice with perturbations in BCR signaling.
Mice were immunized subcutaneously with NP-CGG in alum adjuvant and draining lymph nodes were analyzed by flow cytometry 9 d later. (A to D) Quantification of the total LN cellularity (left) and total number (#) of GC B cells (right) in wild-type (WT) versus Blnk–/– (Blnk ko) versus Cd19Cre/+ (Cd19 het) mice (A), Captex 355 vehicle (Veh) versus ibrutinib (Ib)-treated mice (B), control Syk+/+ Cγ1Cre/+ (Ctrl) versus Sykflox/+ Cγ1Cre/+ (Syk het) mice (C), control Irf4+/+ Cγ1Cre/+ (Ctrl) versus Irf4flox/+ Cγ1 Cre/+ (Irf4 het) mice (D). GC B cells were CD138–B220hiPNAhiCD38loIgDlo. Dots represent individual mice. Bars represent the median (LN cellularity) or geometric mean (GC cell number). n.s., not significant; *p<0.05, (one-way ANOVA followed by Dunnett’s post-test (A), t-tests with the Holm-Sidak correction for multiple comparisons (B-D); the numbers of cells were log transformed for all statistical analyses).
Figure 5—figure supplement 2
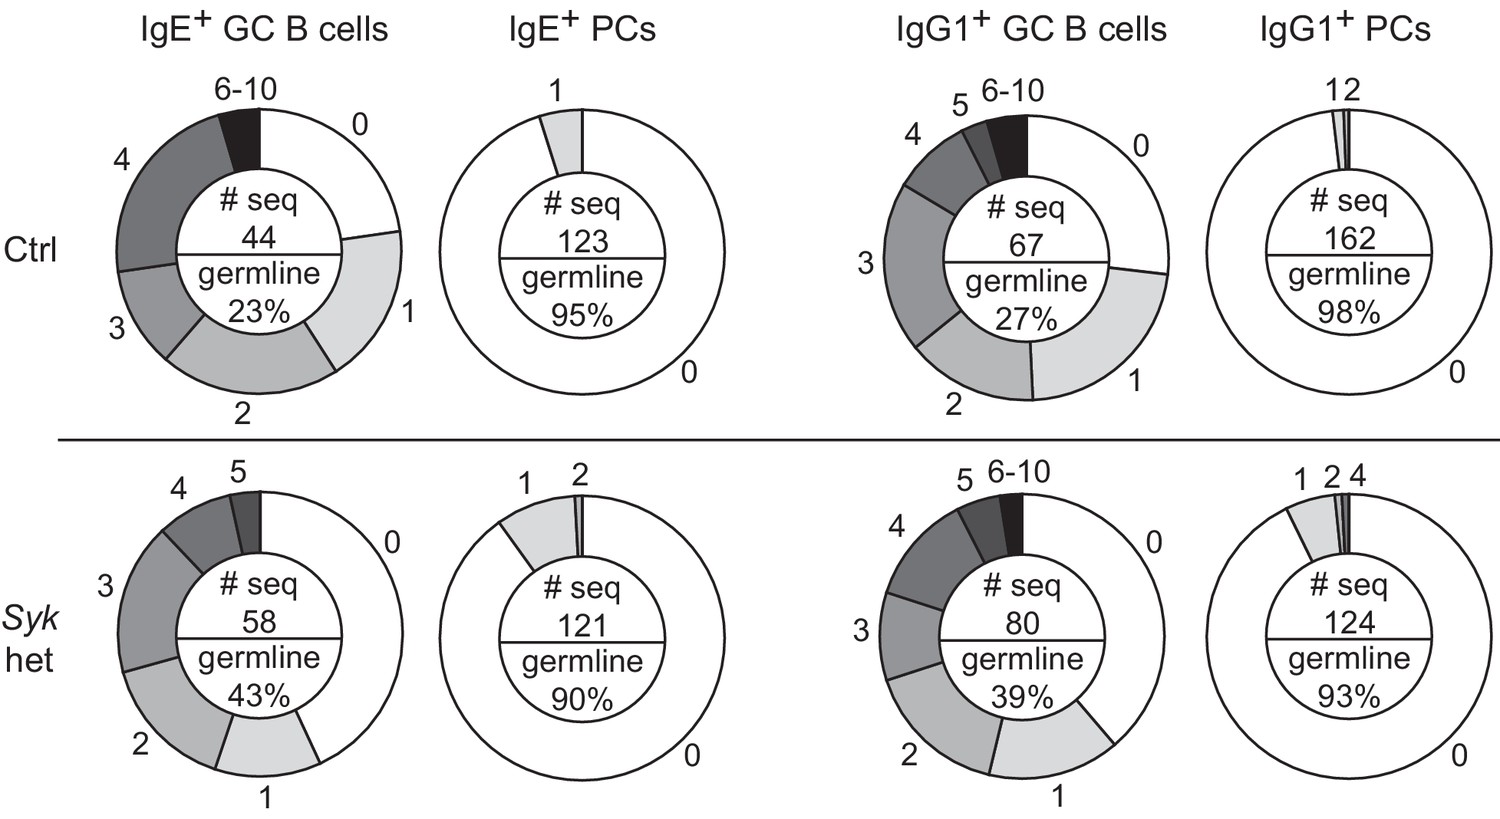
Frequency of somatic mutations in GC B cells versus PCs.
Sequence analysis of VH186.2 amplified from single NP-specific GC B cells or PCs from draining lymph nodes of control Syk+/+ Cγ1Cre/+ (Ctrl) versus Sykflox/+ Cγ1Cre/+ (Syk het) mice. The numbers of mutations compared with the germline sequence are shown on the outer edges of the circles. The pie chart is shaded to represent the fraction of cells with the indicated number of mutations. An inset in the center of each pie chart shows the total number of sequences analyzed (# seq) and the frequency of germline sequences. GC B cells were identified as CD138–B220hiPNAhiCD38loIgDlo, total NPint, and intracellular IgEint or total IgG1int. PCs were CD138+B220lo-intPNAloCD38loIgDlo, total NPhi, and intracellular IgEhi or total IgG1hi. Mice were immunized subcutaneously with NP-CGG in alum adjuvant and draining lymph nodes were harvested 9 d later. Cells were sorted over two experiments from a total of 16 mice (Ctrl) and 17 mice (Syk het) and the sequences were pooled for analysis. We note that while there appear to be a higher frequency of GC B cells with germline sequences in Syk het mice, this was not consistent finding when the data were disaggregated by experiment. The high affinity mutation W33L was only present in a negligible number of sequences at this timepoint, as expected.
Figure 6
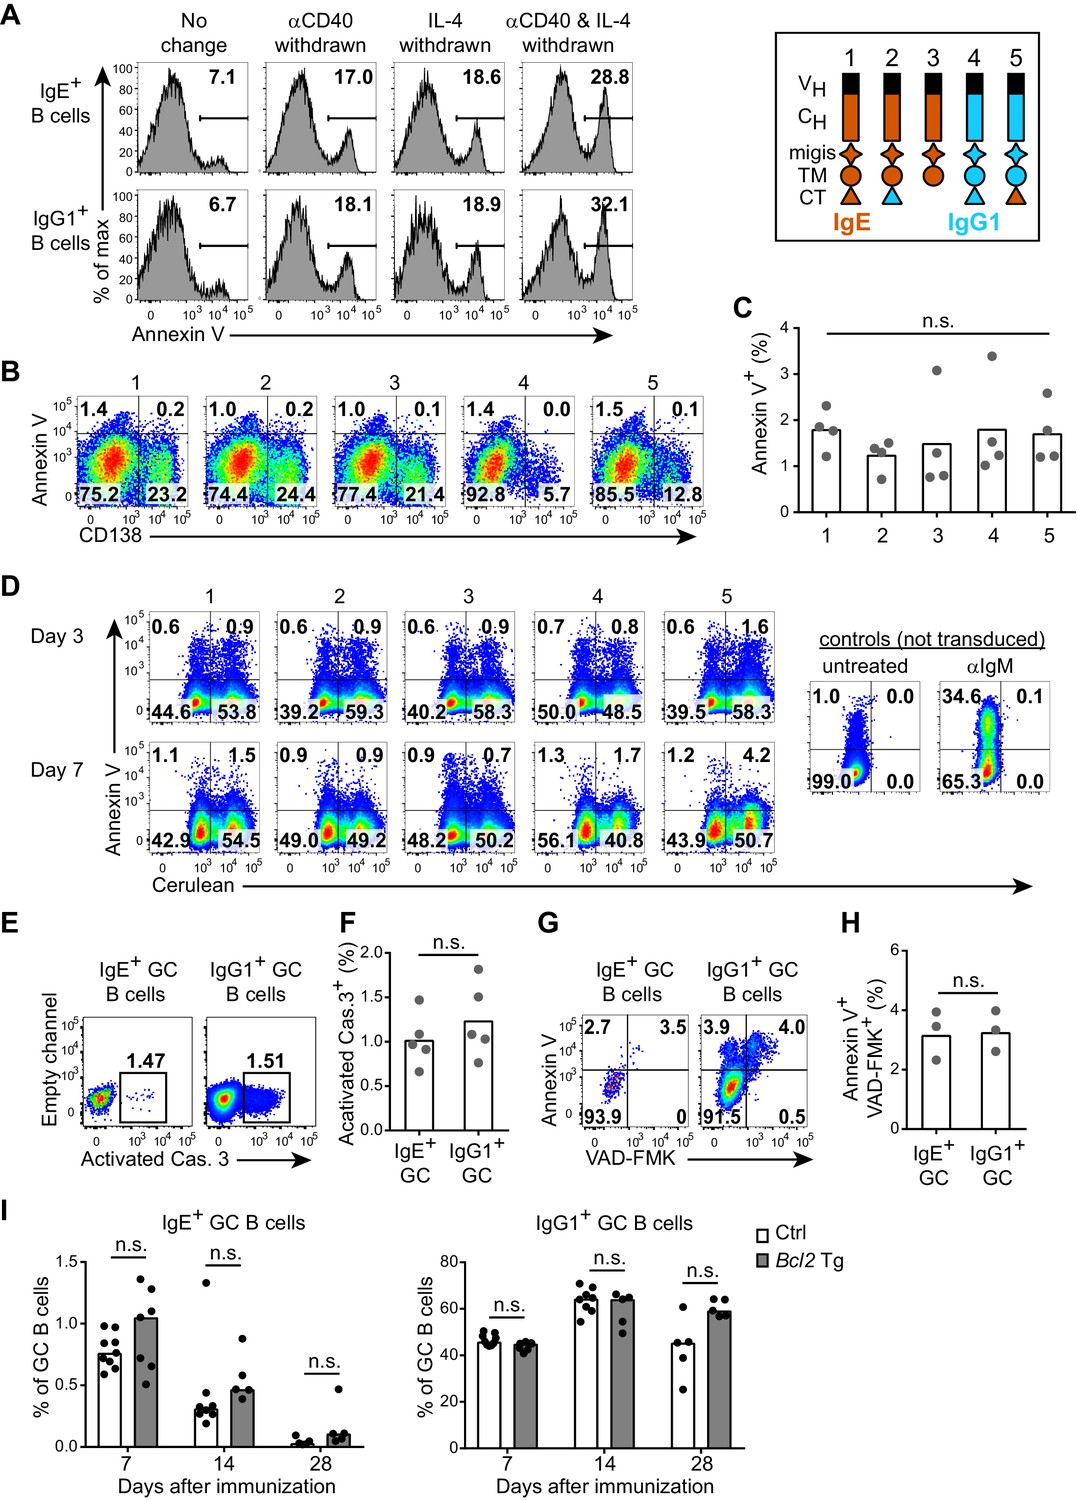
The IgE BCR does not promote intrinsic apoptosis in vitro or in vivo.
(A) Representative flow cytometry of the frequency of apoptosis (annexin V+) of wild-type B cells cultured for 4 d with IL-4 and anti-CD40 (αCD40). The culture media was left unchanged, or replaced with fresh media without anti-CD40 (αCD40 withdrawn), without IL-4 (IL-4 withdrawn), or without both anti-CD40 and IL-4 (αCD40 and IL-4 withdrawn) 5 hr before annexin V staining. Cells were gated as B220+IgD–IgM– CD138–. (B and C) Representative flow cytometry (B) and quantification (C) of the frequency of apoptosis (annexin V+) of B1-8flox/+ Cγ1Cre/+ B cells that were retrovirally transduced with the indicated constructs (refer to the legend in the upper-right) on d 1 of culture. Cells were gated as Cerulean+. (D) Representative flow cytometry of the frequency of apoptosis (annexin V+) of WEHI-231 cells retrovirally transduced with the indicated constructs (refer to the legend in the upper-right) compared to negative (untreated) or positive controls (αIgM treated) and then analyzed after the indicated number of days. Data are representative of three independent experiments. (E–F) Representative flow cytometry (E) and quantification (F) of the frequency of apoptosis (positive for an antibody to activated caspase (Cas.) 3) among IgE+ versus IgG1+ GC B cells in draining lymph nodes 7 d after immunization. Similar results were observed in three independent experiments. (G, H) Representative flow cytometry (G) and quantification (H) of the frequency of apoptosis (‘Casp-Glow’ VAD-FMK+, annexin V+) among IgE+ versus IgG1+ GC B cells 7 d after immunization. (I) Quantification of frequency of IgE+ and IgG1+ cells among GC B cells in littermate control (Ctrl) versus Eµ-Bcl2-22 transgenic (Tg) mice the indicated number of days after immunization. Data were pooled from four experiments. Mice were immunized subcutaneously with NP-CGG (E–H) or NP-KLH (I) in alum and draining lymph nodes were analyzed by flow cytometry. GC B cells were gated as CD138–B220hiPNAhiCD38loIgDlo and intracellular IgEint or total IgG1int. Dots represent samples from individual experiments (C), or mice (F, H, I). Bars represent the mean (C, F, H) or median (I). n.s., not significant (one-way ANOVA (C), paired t-tests (F, H), and t-tests with the Holm-Sidak correction for multiple comparisons (I)).
Figure 7
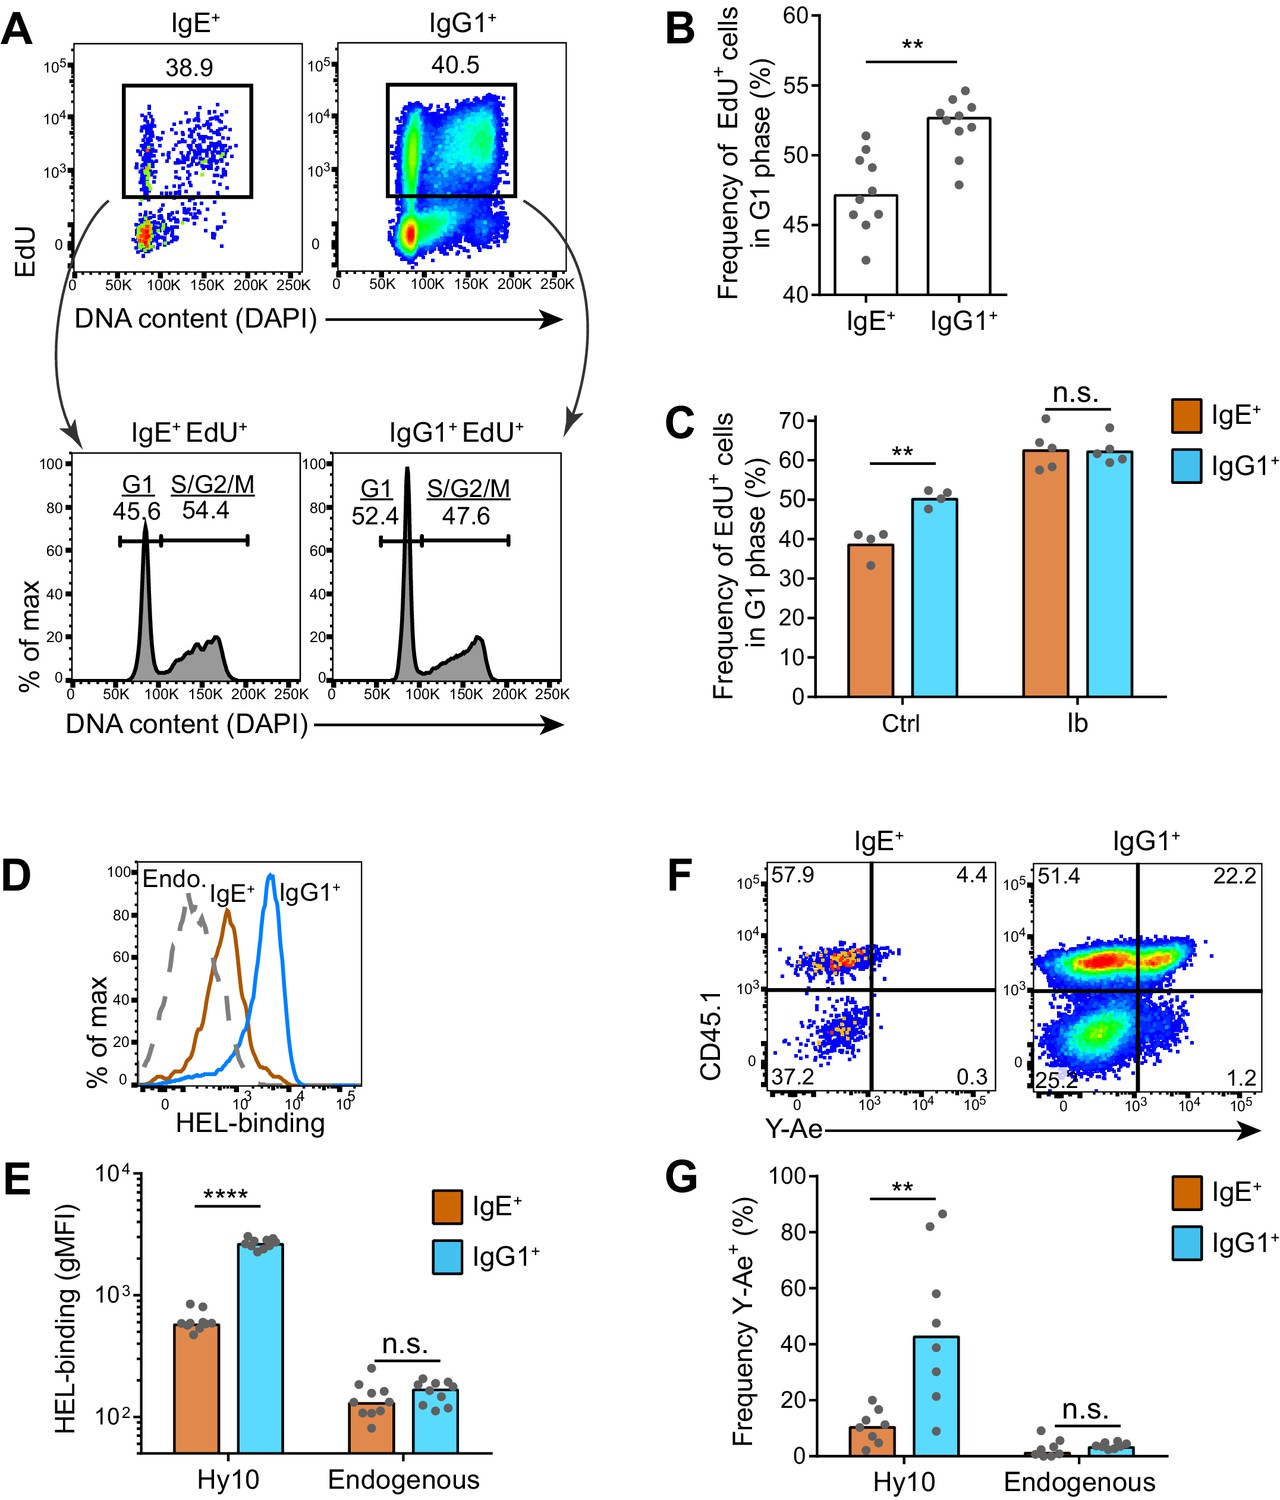
IgE+ GC B cells exhibit delayed cell cycle progression and reduced antigen presentation.
(A–C) Mice were injected with EdU to pulse-label cells in S phase 6.5 d after subcutaneous immunization with NP-CGG in alum. Draining lymph nodes were harvested 3.5 hr later. (A) Representative flow cytometry of EdU staining and DAPI labeling (DNA content) in IgE+ and IgG1+ GC B cells. EdU+ cells were gated (upper panels) and G1 versus S/G2/M phase cells were resolved by DNA content (lower panels). (B) Quantification of the frequency of EdU+ cells in G1 phase among IgE+ versus IgG1+ GC B cells. (C) Quantification of the frequency of EdU+ cells in G1 phase among IgE+ versus IgG1+ GC B cells from mice treated with vehicle (Ctrl) or ibrutinib (Ib) twice daily for 3 d, starting 4 d after immunization. (D–G) HEL-specific (Hy10) B cells were transferred into wild-type congenic recipient mice and then mice were immunized subcutaneously with DEL-OVA in alum and draining lymph nodes were analyzed 7 d later. (D and E) Representative flow cytometry (D) and quantification (E) of BCR surface expression by HEL-Alexa647 labeling of Hy10 GC B cells (CD45.2+) compared with recipient endogenous (Endo.) GC B cells (CD45.1+). (F and G) Representative flow cytometry (F) and quantification (G) of Eα peptide-MHC II antigen presentation by Y-Ae antibody staining of Hy10 GC B cells (CD45.1+) compared with recipient endogenous GC B cells (CD45.1–). GC B cells were gated as CD138–B220hiPNAhiCD38loIgDlo and intracellular IgEint or total IgG1int in all panels, with the addition of IgMlo (F and G). Similar results were obtained in two independent experiments. Dots represent individual mice and bars represent the median (B, E, G) or mean (C). gMFI, geometric mean fluorescence intensity; n.s., not significant; **p<0.01; ****p<0.0001 (Wilcoxon matched-pairs signed rank test (B), and t-tests with the Holm-Sidak correction for multiple comparisons (C, E, G)).
Additional files
-
Supplementary file 1
Table of reagents used in flow cytometry.
- https://doi.org/10.7554/eLife.21238.016
-
Supplementary file 2
Table of exact p values from all statistical comparisons
- https://doi.org/10.7554/eLife.21238.017
-
Source code 1
Matlab source code.
- https://doi.org/10.7554/eLife.21238.018
Download links
A two-part list of links to download the article, or parts of the article, in various formats.
Downloads (link to download the article as PDF)
Open citations (links to open the citations from this article in various online reference manager services)
Cite this article (links to download the citations from this article in formats compatible with various reference manager tools)
Regulation of B cell fate by chronic activity of the IgE B cell receptor
eLife 5:e21238.
https://doi.org/10.7554/eLife.21238


