Mitochondrial respiratory gene expression is suppressed in many cancers
- Memorial Sloan Kettering Cancer Center, United States
- Harvard Medical School, United States
- Dana-Farber Cancer Institute, United States
Figures
Figure 1 with 3 supplements
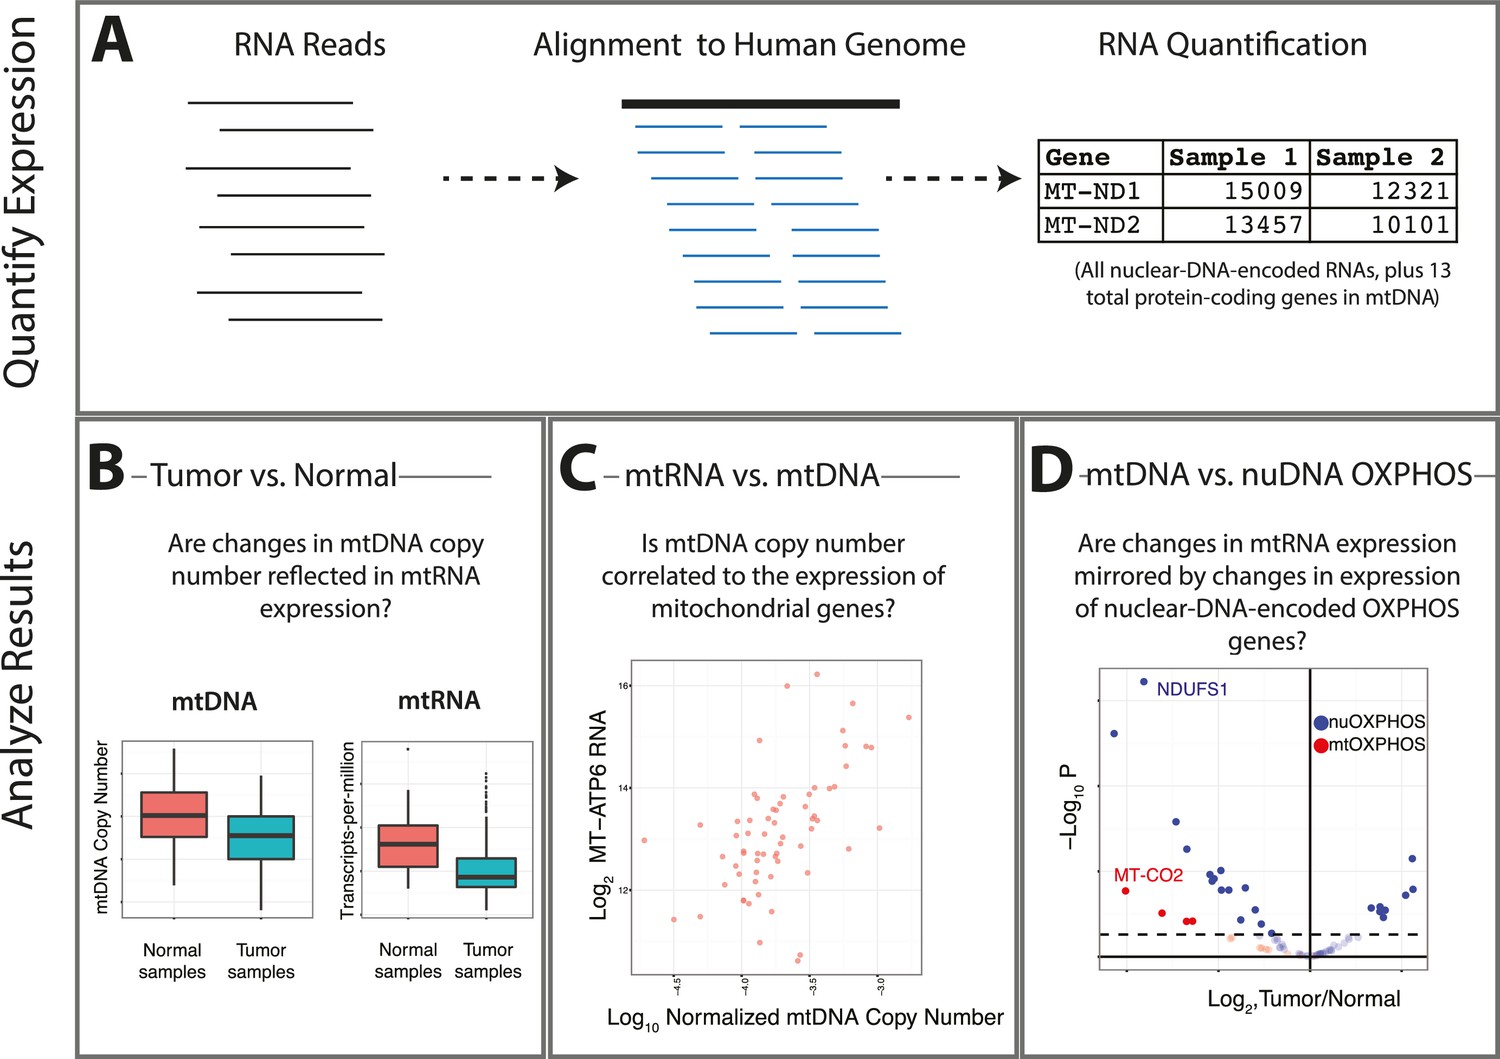
Summary of analysis.
(A) RNA-sequencing reads from the TCGA are aligned, and reads mapping to the mitochondrial genome are retained. (B) Changes in the expression of mtRNAs in tumors compared to adjacent-normal tissue are compared to analogous changes in mtDNA copy number. (C) Quantitative estimates of the correlation between mtDNA copy number and mtRNA are determined. (D) A comparison is made between the tumor vs. normal differential expression of OXPHOS subunits encoded in mtDNA and nuDNA.
Figure 1—figure supplement 1
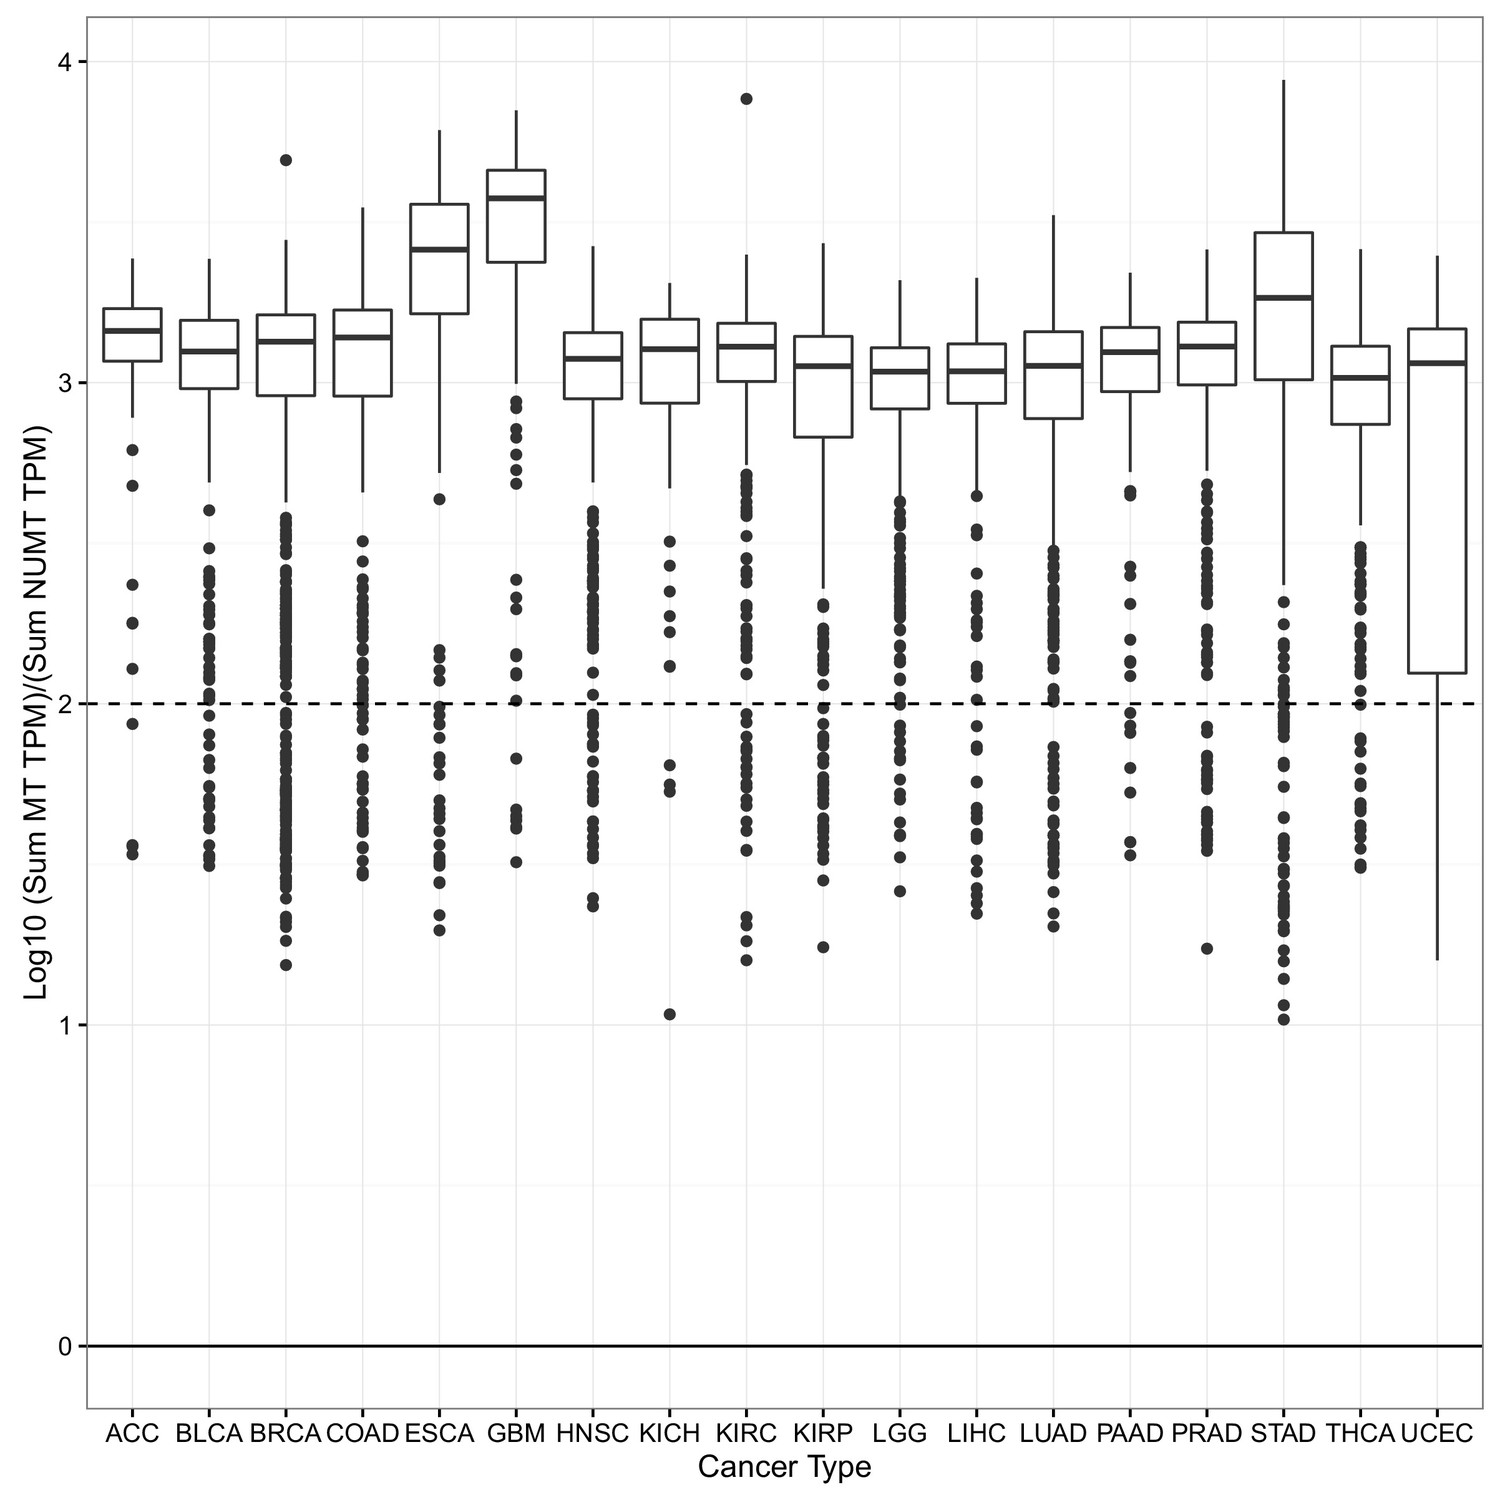
For each sample, the log10 ratio of the expression of the 13 mtRNAs (calculated using the sum of their TPM) to the expression of 175 mtDNA pseudogenes (calculated using the sum of their TPMs) was calculated.
Top and bottom of each box indicate the 75th and 25 percentile of this ratio. The whisker corresponds to a distance 1.5 times the interquartile range. In the vast majority of samples, bona fide expression from mtDNA is 2–3 orders of magnitude greater than the expression of mtDNA pseudogenes.
Figure 1—figure supplement 2
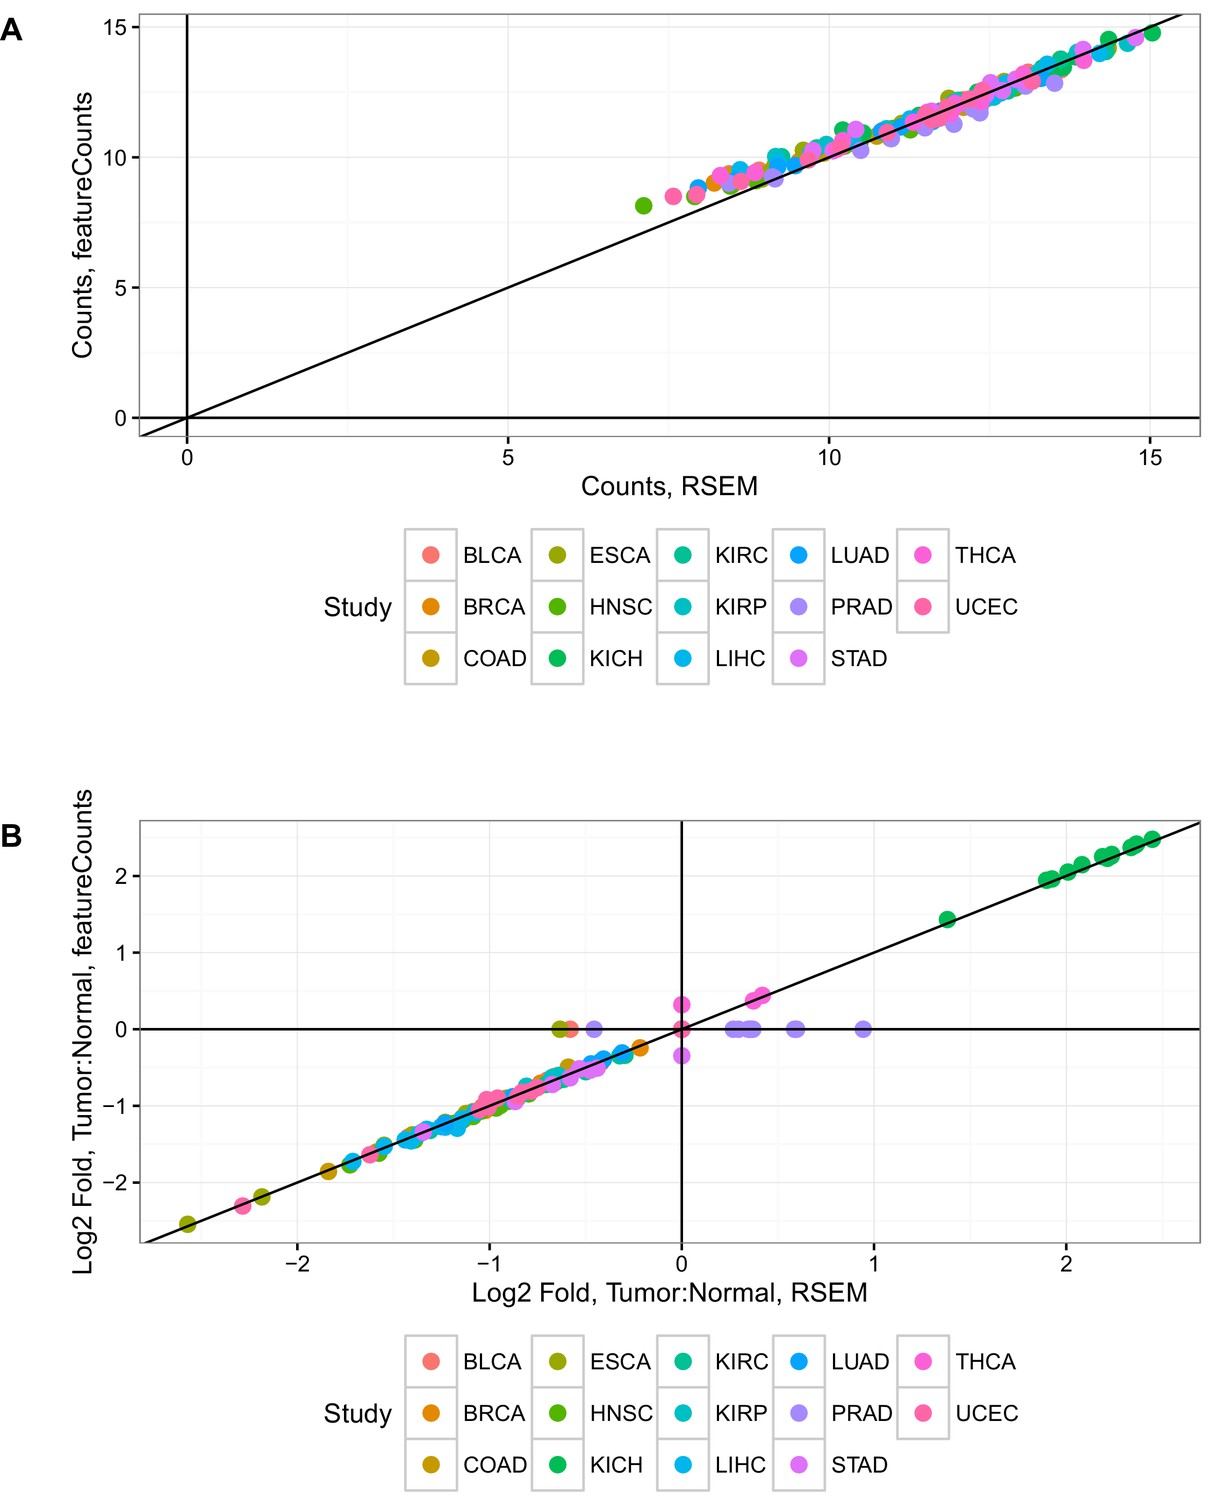
Estimates of mtRNA abundance and differential expression from RSEM and featureCounts are in good agreement.
(A) Comparison of expression (in log2 normalized counts from limma voom) using featureCounts or RSEM. Each dot corresponds to a single mtRNA in a single cancer type.(B) Comparison of log-fold change estimates using featureCounts or RSEM. Each dot corresponds to the log2 ratio of expression in tumor compared to normal for a single mtRNA in a single cancer type.
Figure 1—figure supplement 3
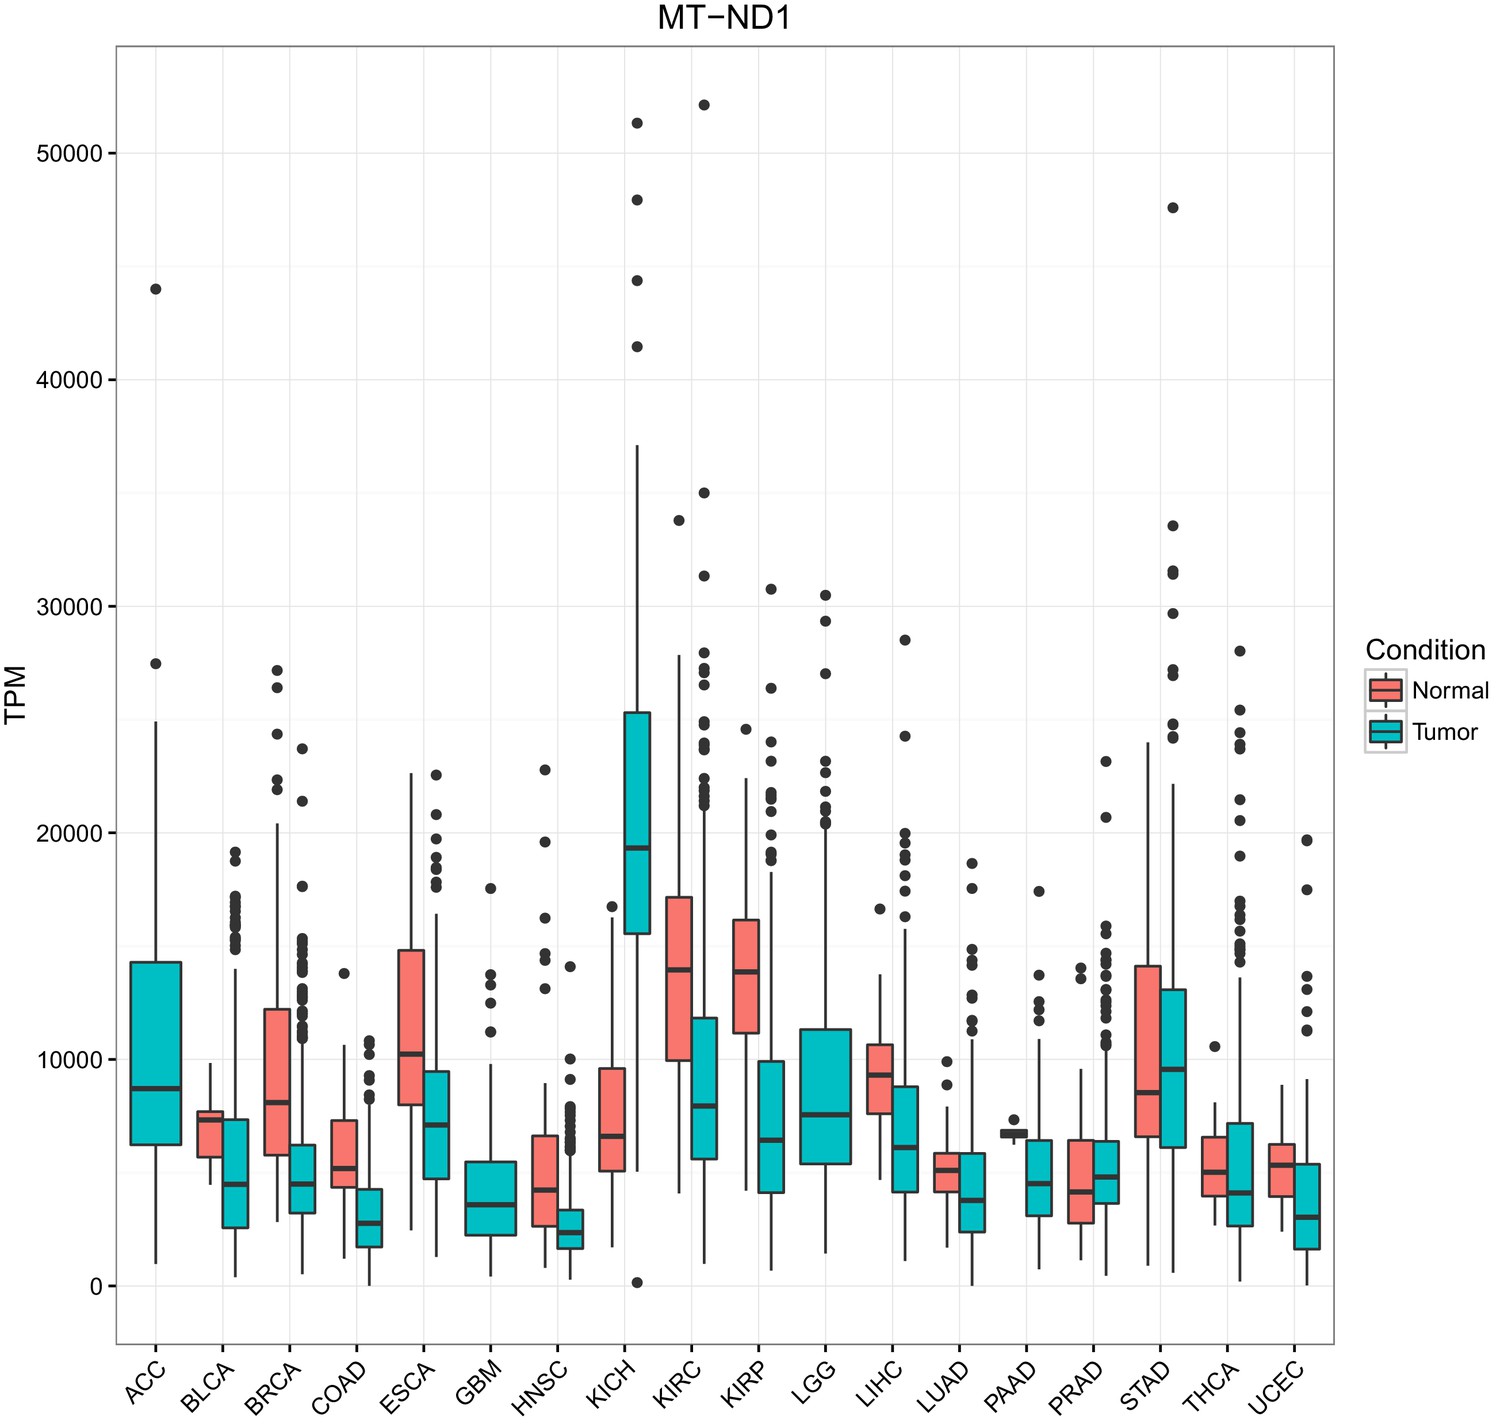
Comparison of mtRNA expression across different tissues.
The expression of MT-ND1 is depicted. Expression of other mtRNAs is similar.
Figure 2
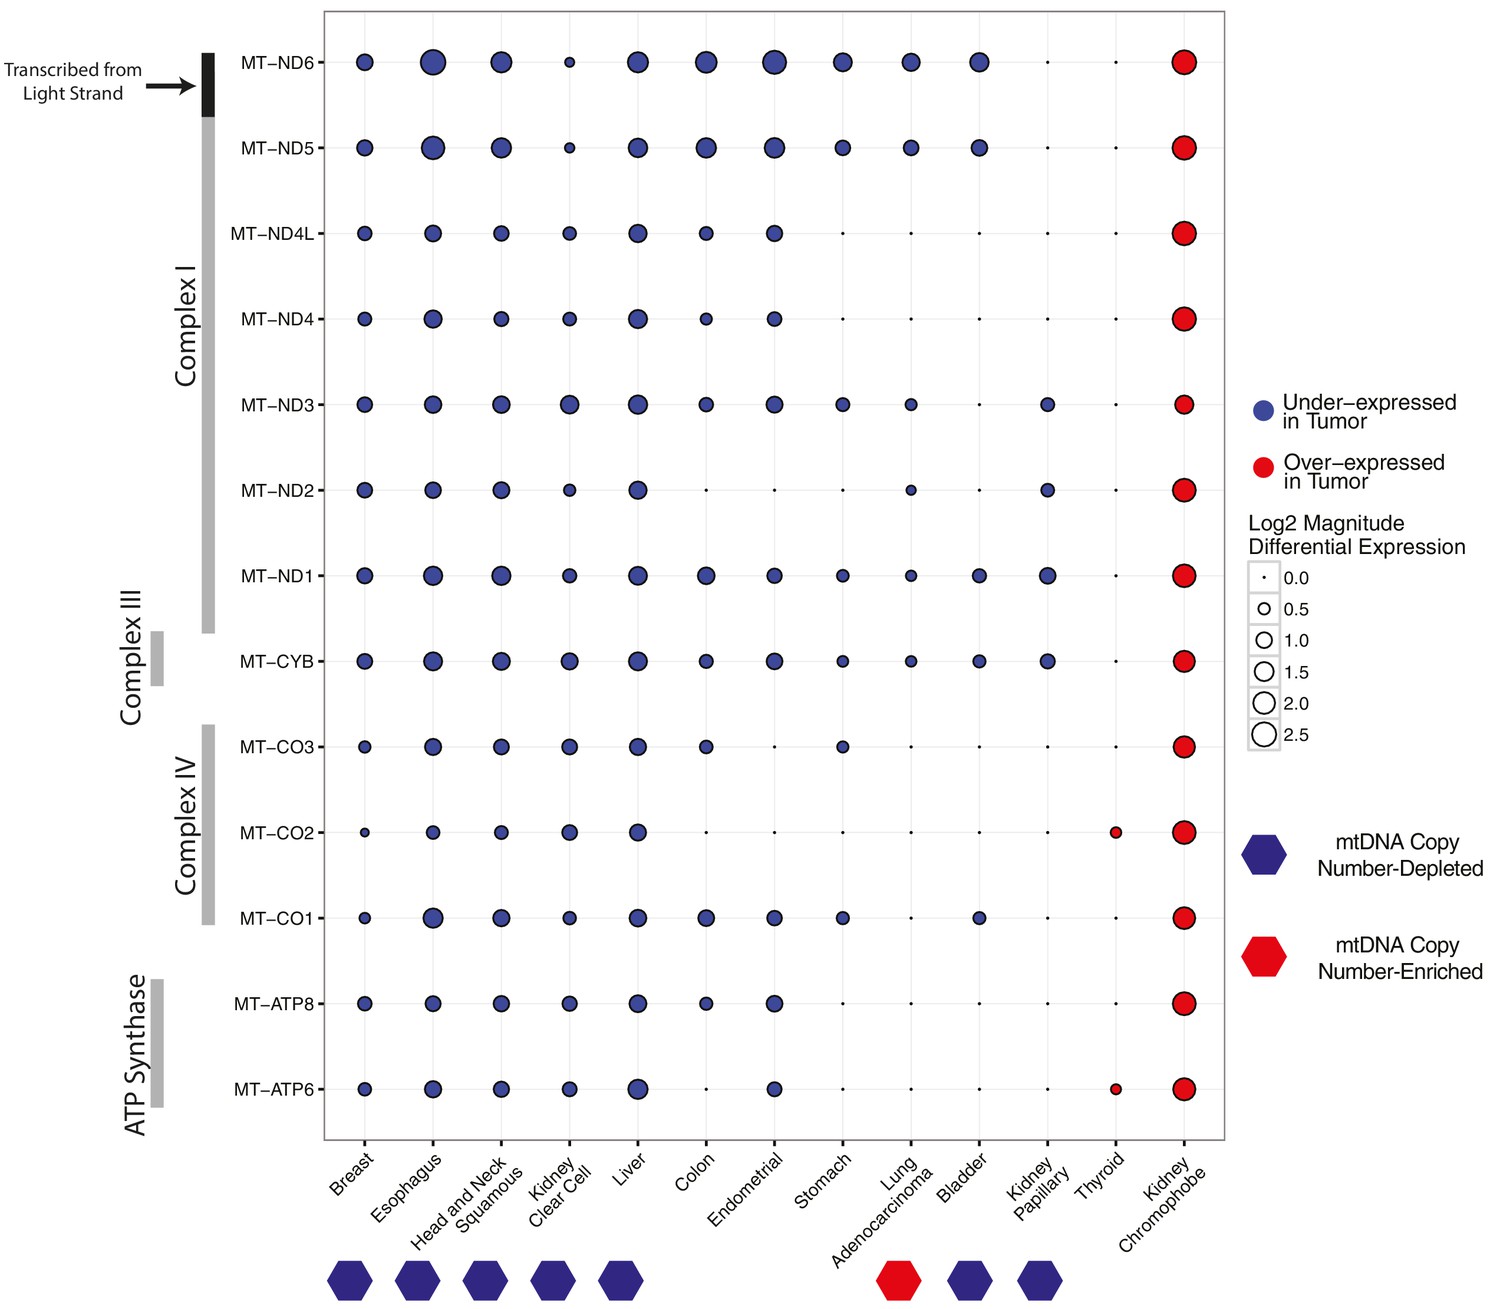
Differential expression of mitochondrial genes across cancer types.
Magnitude and statistical significance of differential expression evaluated by limma voom (see Materials and methods). The majority of mtRNAs are strongly down-regulated in several cancer types, including esophageal, breast, head and neck squamous, kidney clear cell, and liver cancers. One cancer type (kidney chromophobe), shows increases in the abundance of mtRNAs. All tumor types showing mtDNA copy number depletion in tumors relative to adjacent normal tissue (bottom annotation) show analogous depletion of mtRNAs. In contrast, mtDNA copy number changes in lung adenocarcinomas and kidney chromophobes are not reflected in differential expression of mtRNAs.
Figure 3
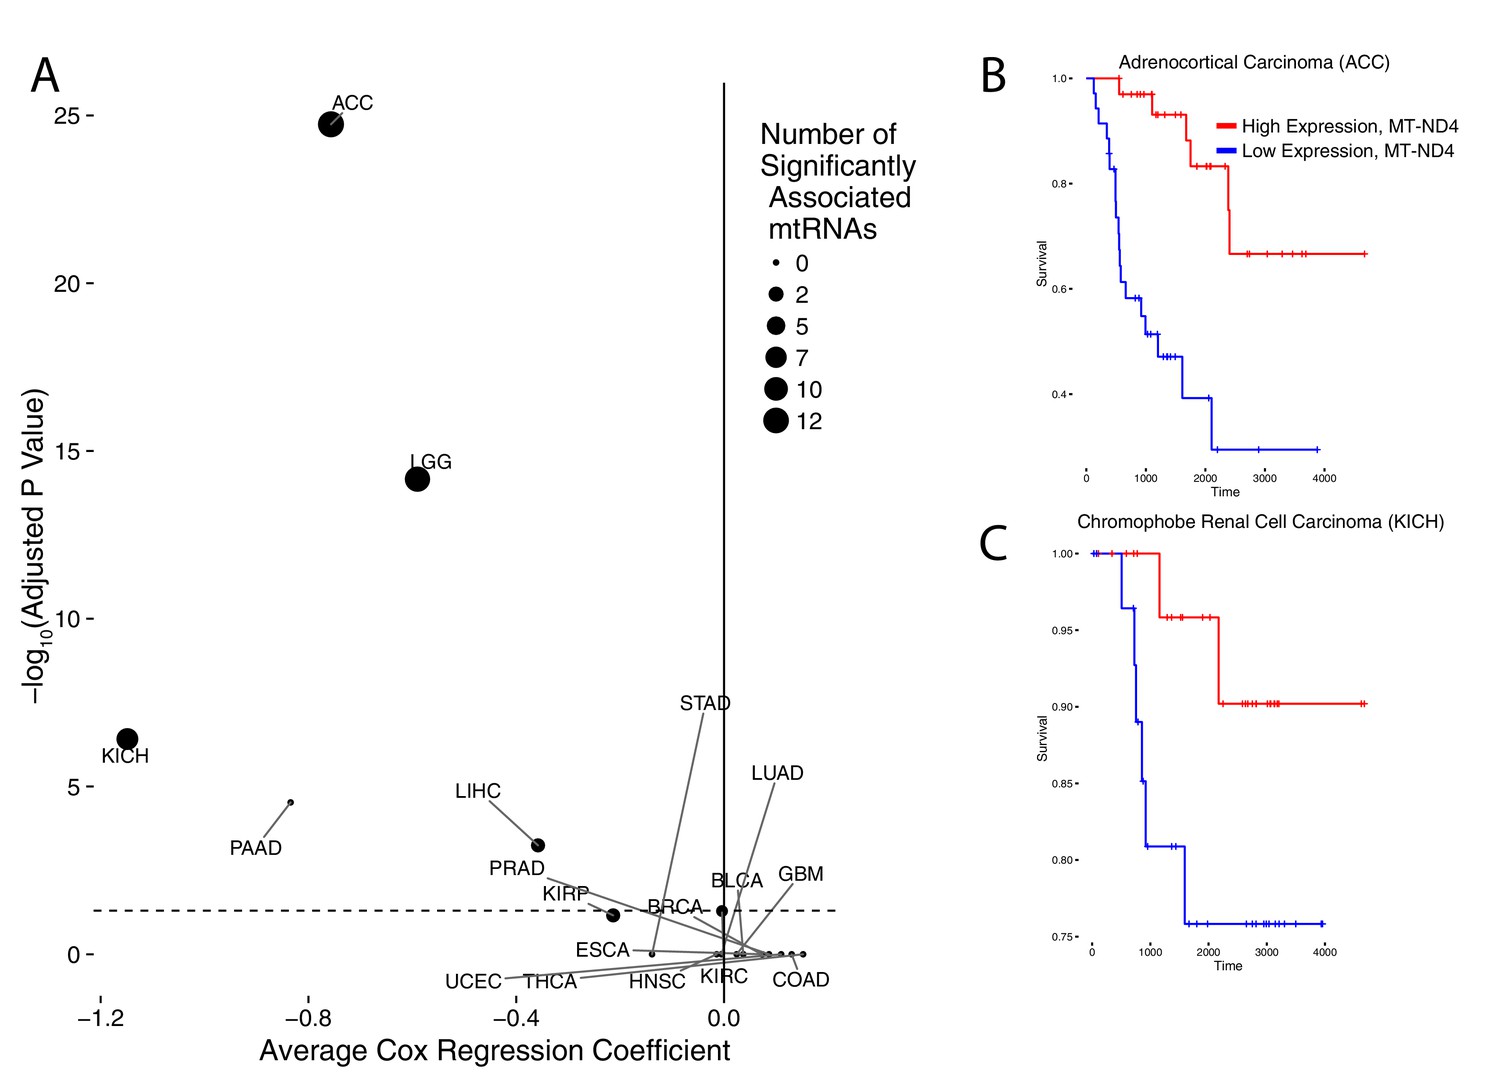
Association of mtRNA expression levels with overall survival across cancer types.
Multiple-hypothesis-adjusted univariate p-values from Cox regression for each mtRNA are combined using Fisher’s method for each cancer type. Several cancer types show an association between high mtRNA expression and improved outcome (negative Cox regression coefficient). Dashed line indicates threshold for statistical significance. Representative Kaplan-Meier plots are shown for overall survival in ACC (B) and KICH (C), partitioning patients into high expression vs. low expression groups based on median expression of MT-ND4.
Figure 4 with 3 supplements
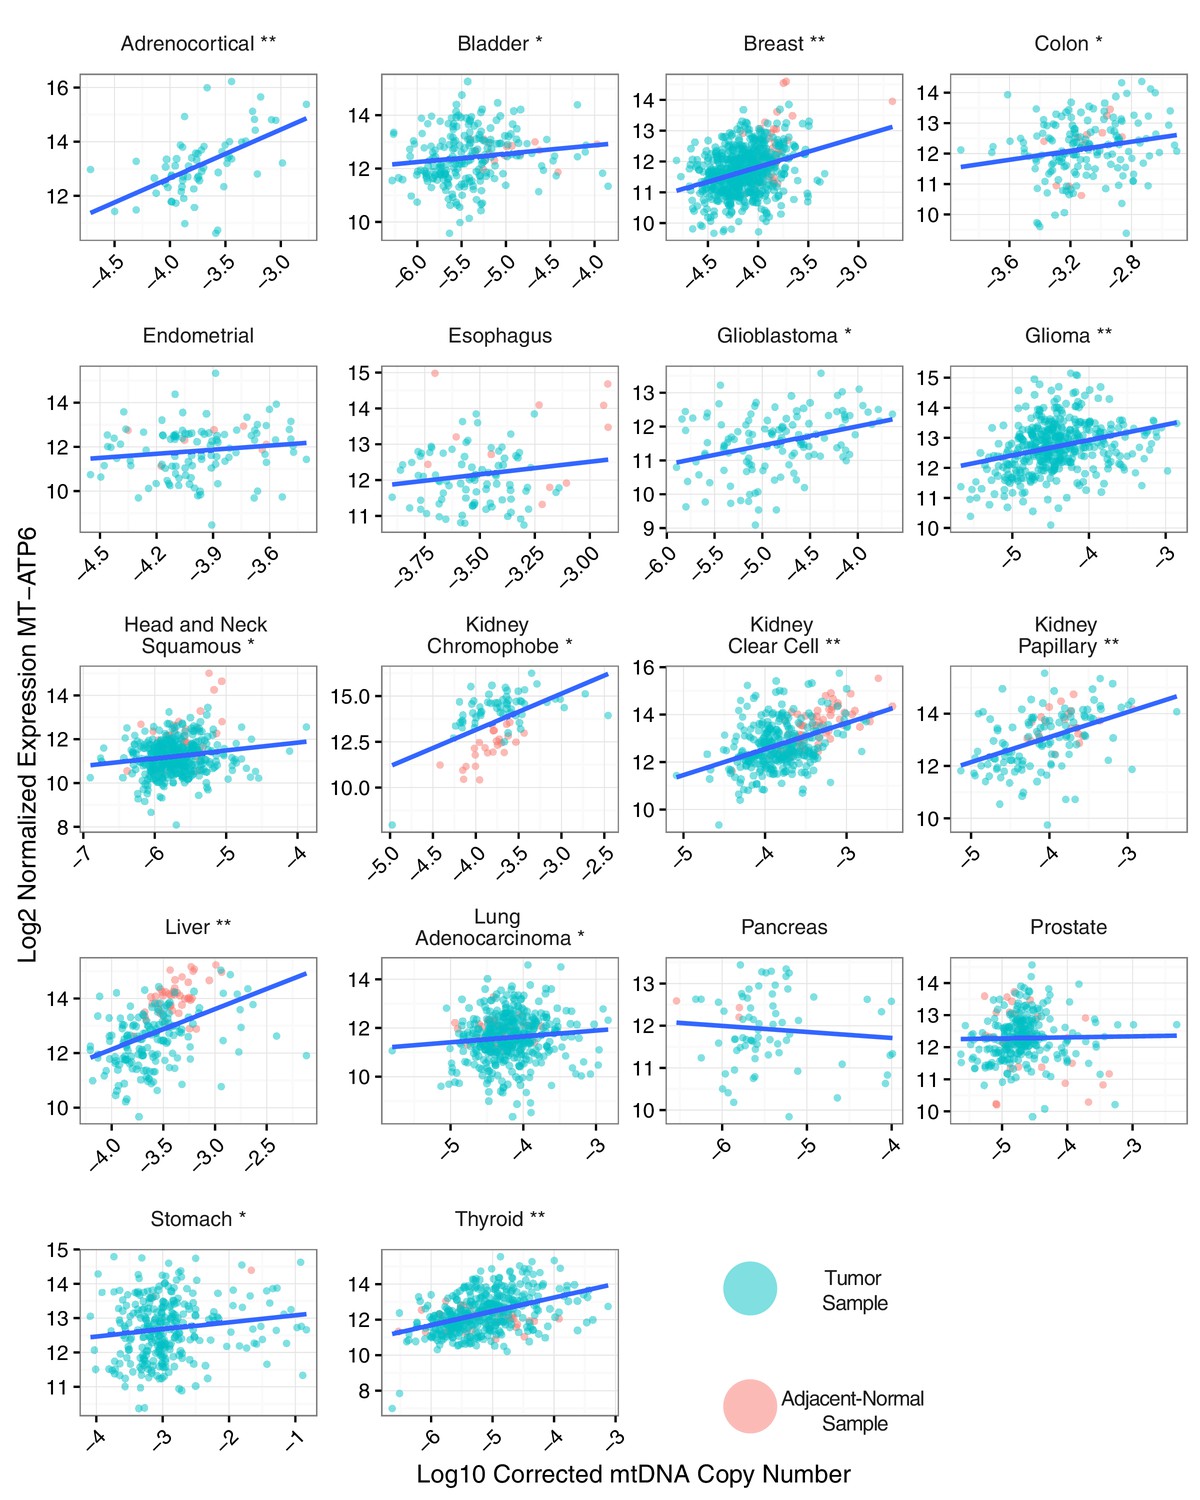
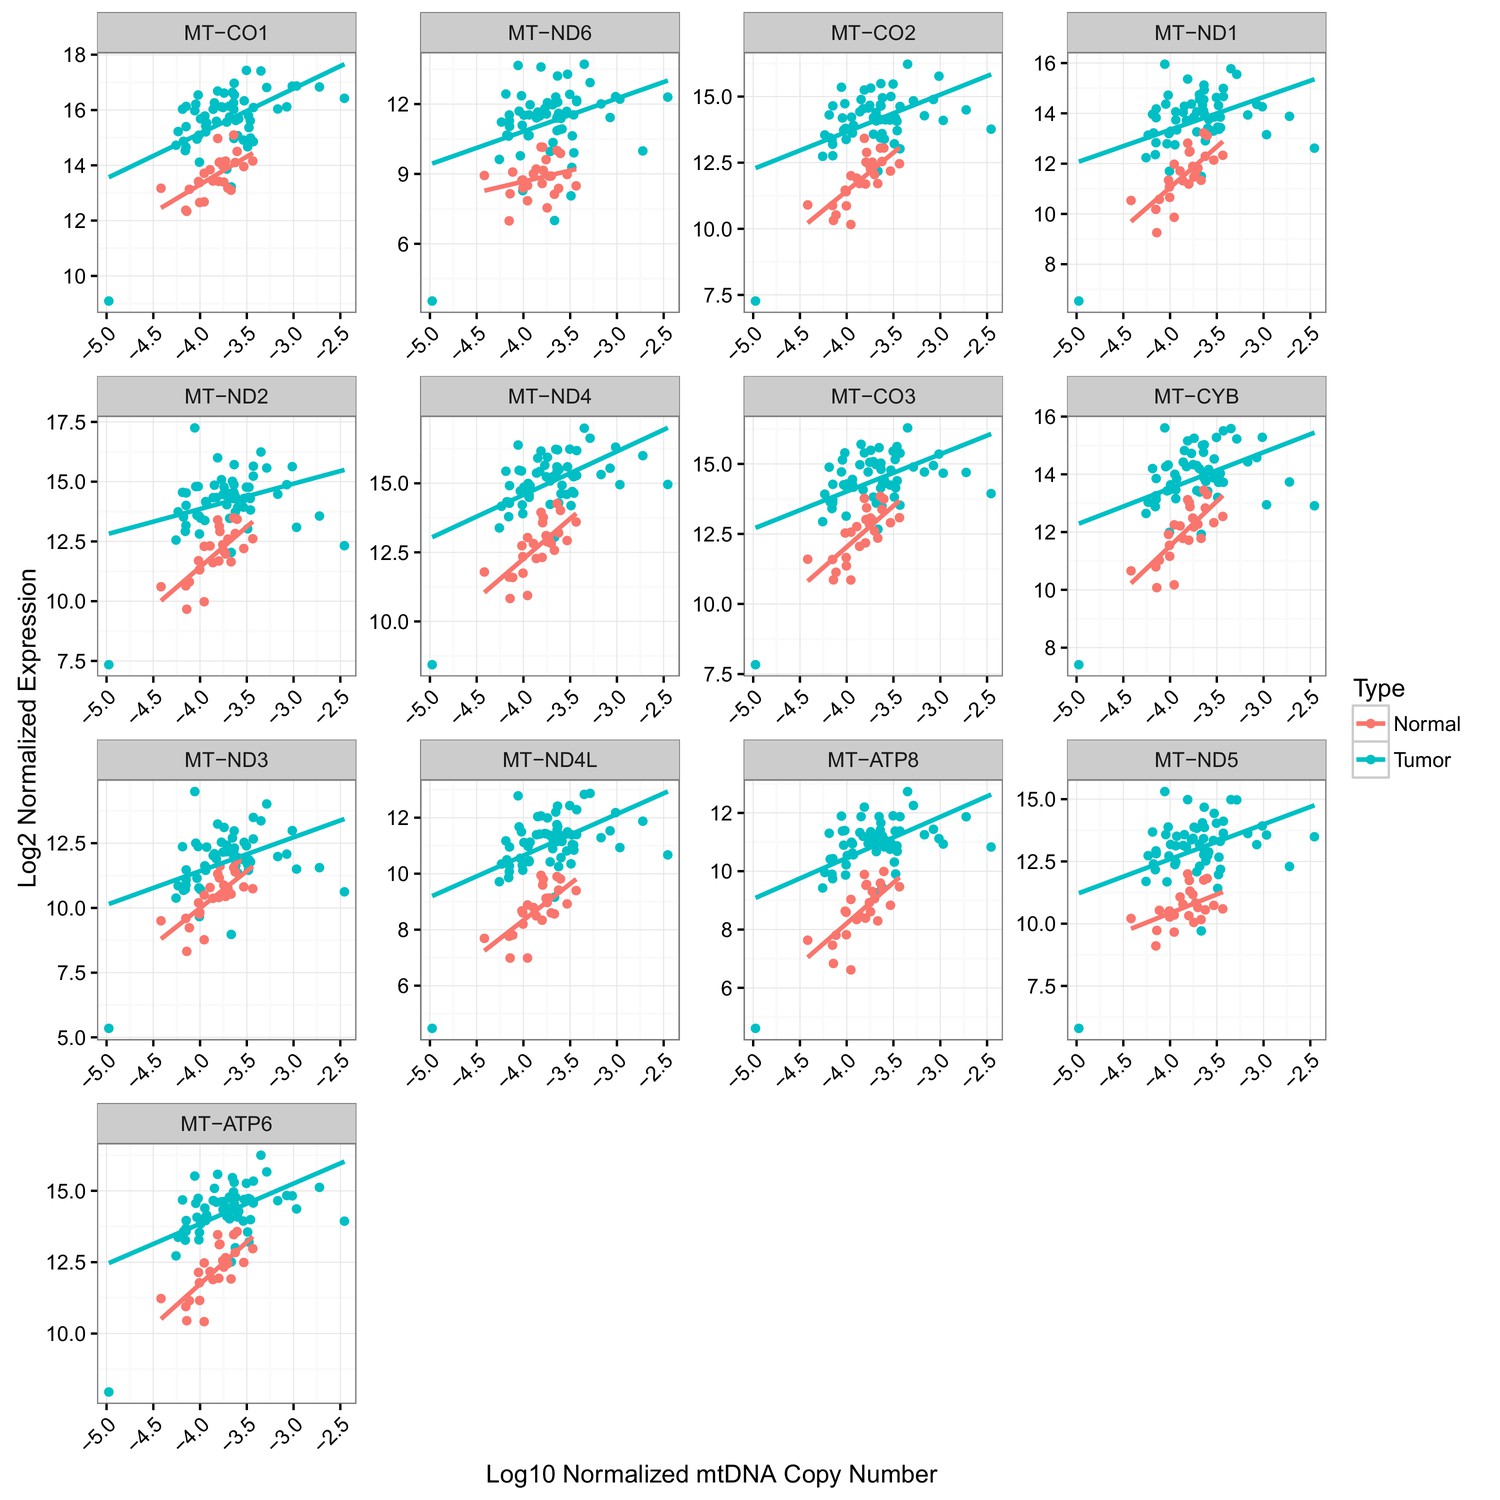
Correlation between mtDNA copy number and mtRNA expression.
Relative mtDNA copy number was correlated against mtRNA expression (log normalized counts from limma voom). The expression of one gene, MT-ATP6, is depicted, although other mtDNA protein coding genes are similar. Lines indicate best fit linear trend between mtDNA copy number and log MT-ATP6 expression. Cancer types titled with an asterisk indicate a statistically significant correlation (Spearman, BH-adjusted p-value <0.05). Double asterisk indicates an especially strong correlation (BH-adjusted p-value <10−5).
Figure 4—figure supplement 1
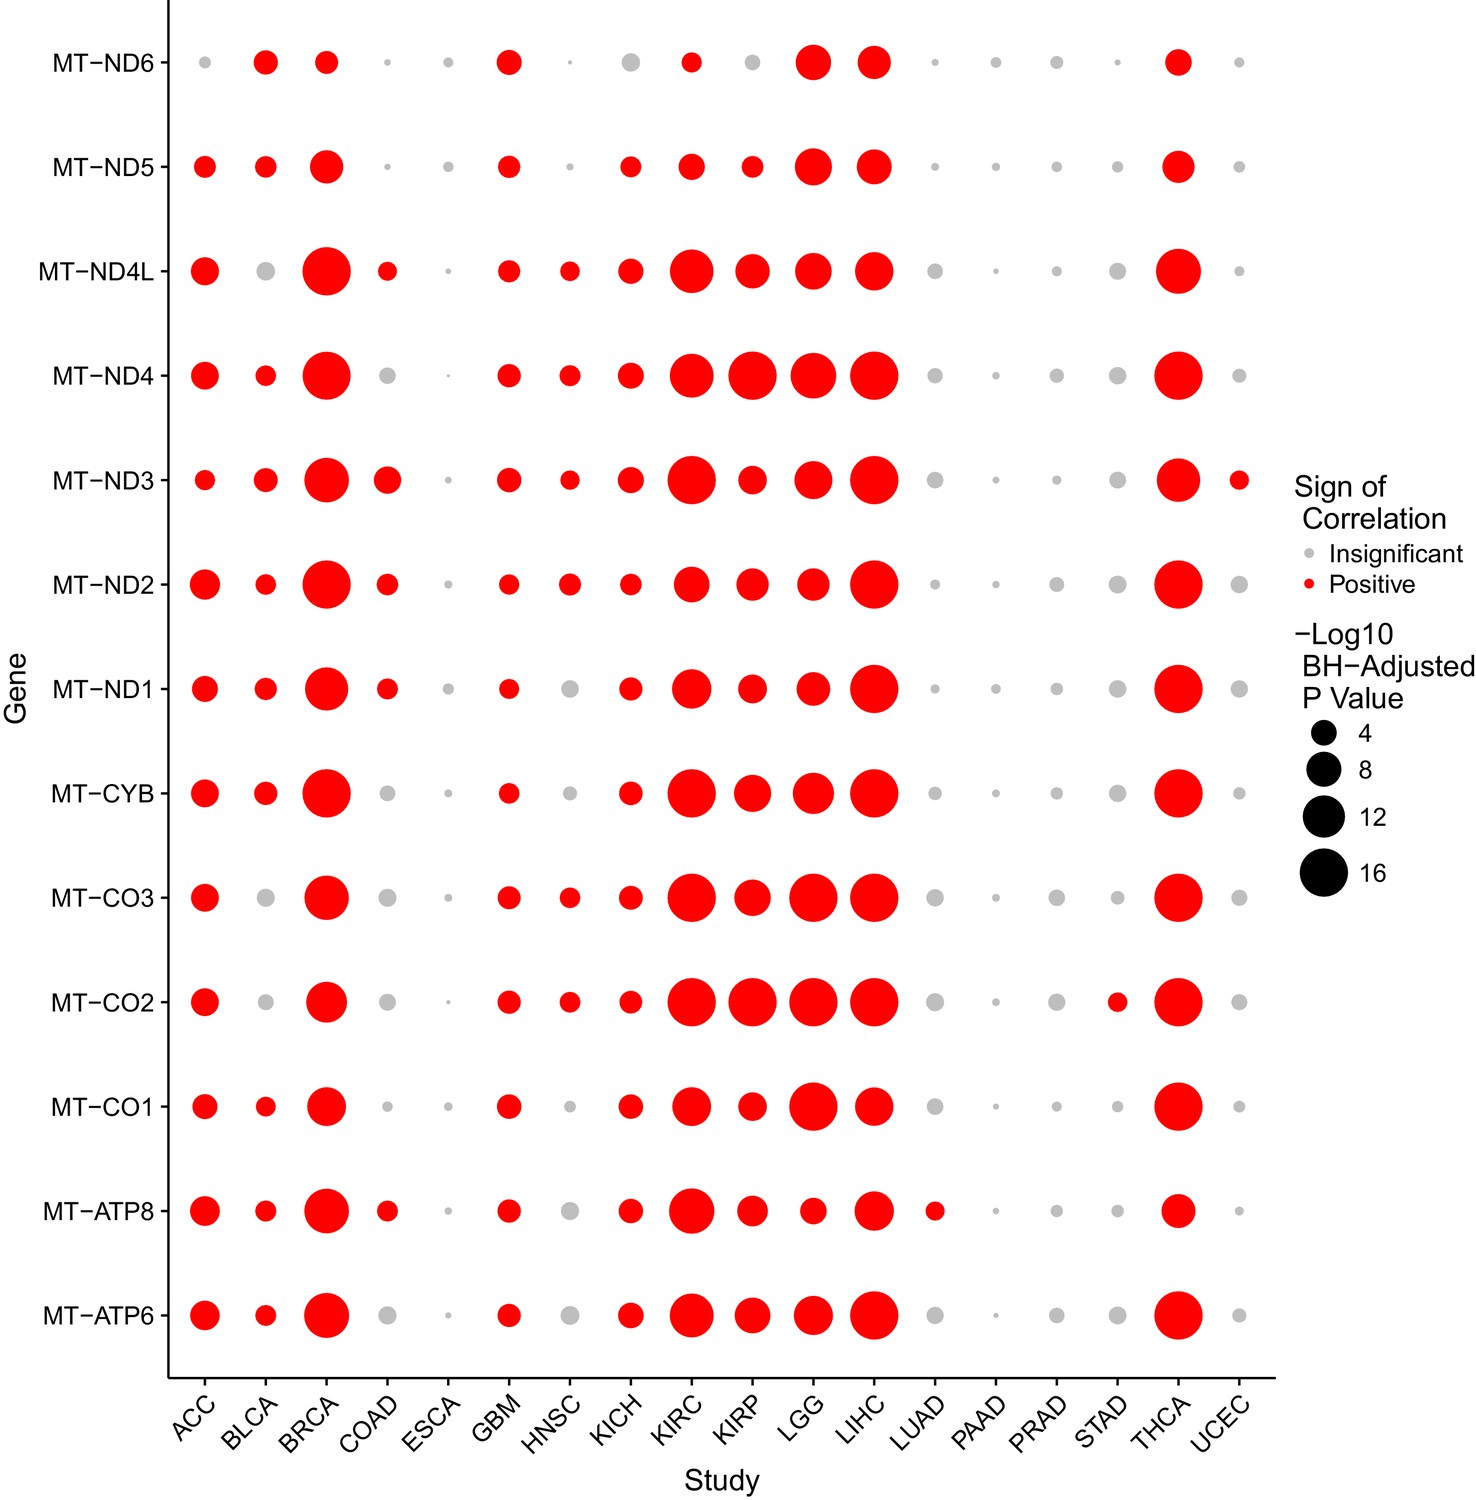
Correlation between mtDNA copy number and mtRNA expression is highly dependent on cancer type, as well as on mtRNA gene.
Radius of circle corresponds to BH-adjusted -log10 p-value, as assessed by Spearman correlation. Insignificant correlations are colored in grey. Correlations are calculated using all available (both tumor and adjacent-normal) samples.
Figure 4—figure supplement 2
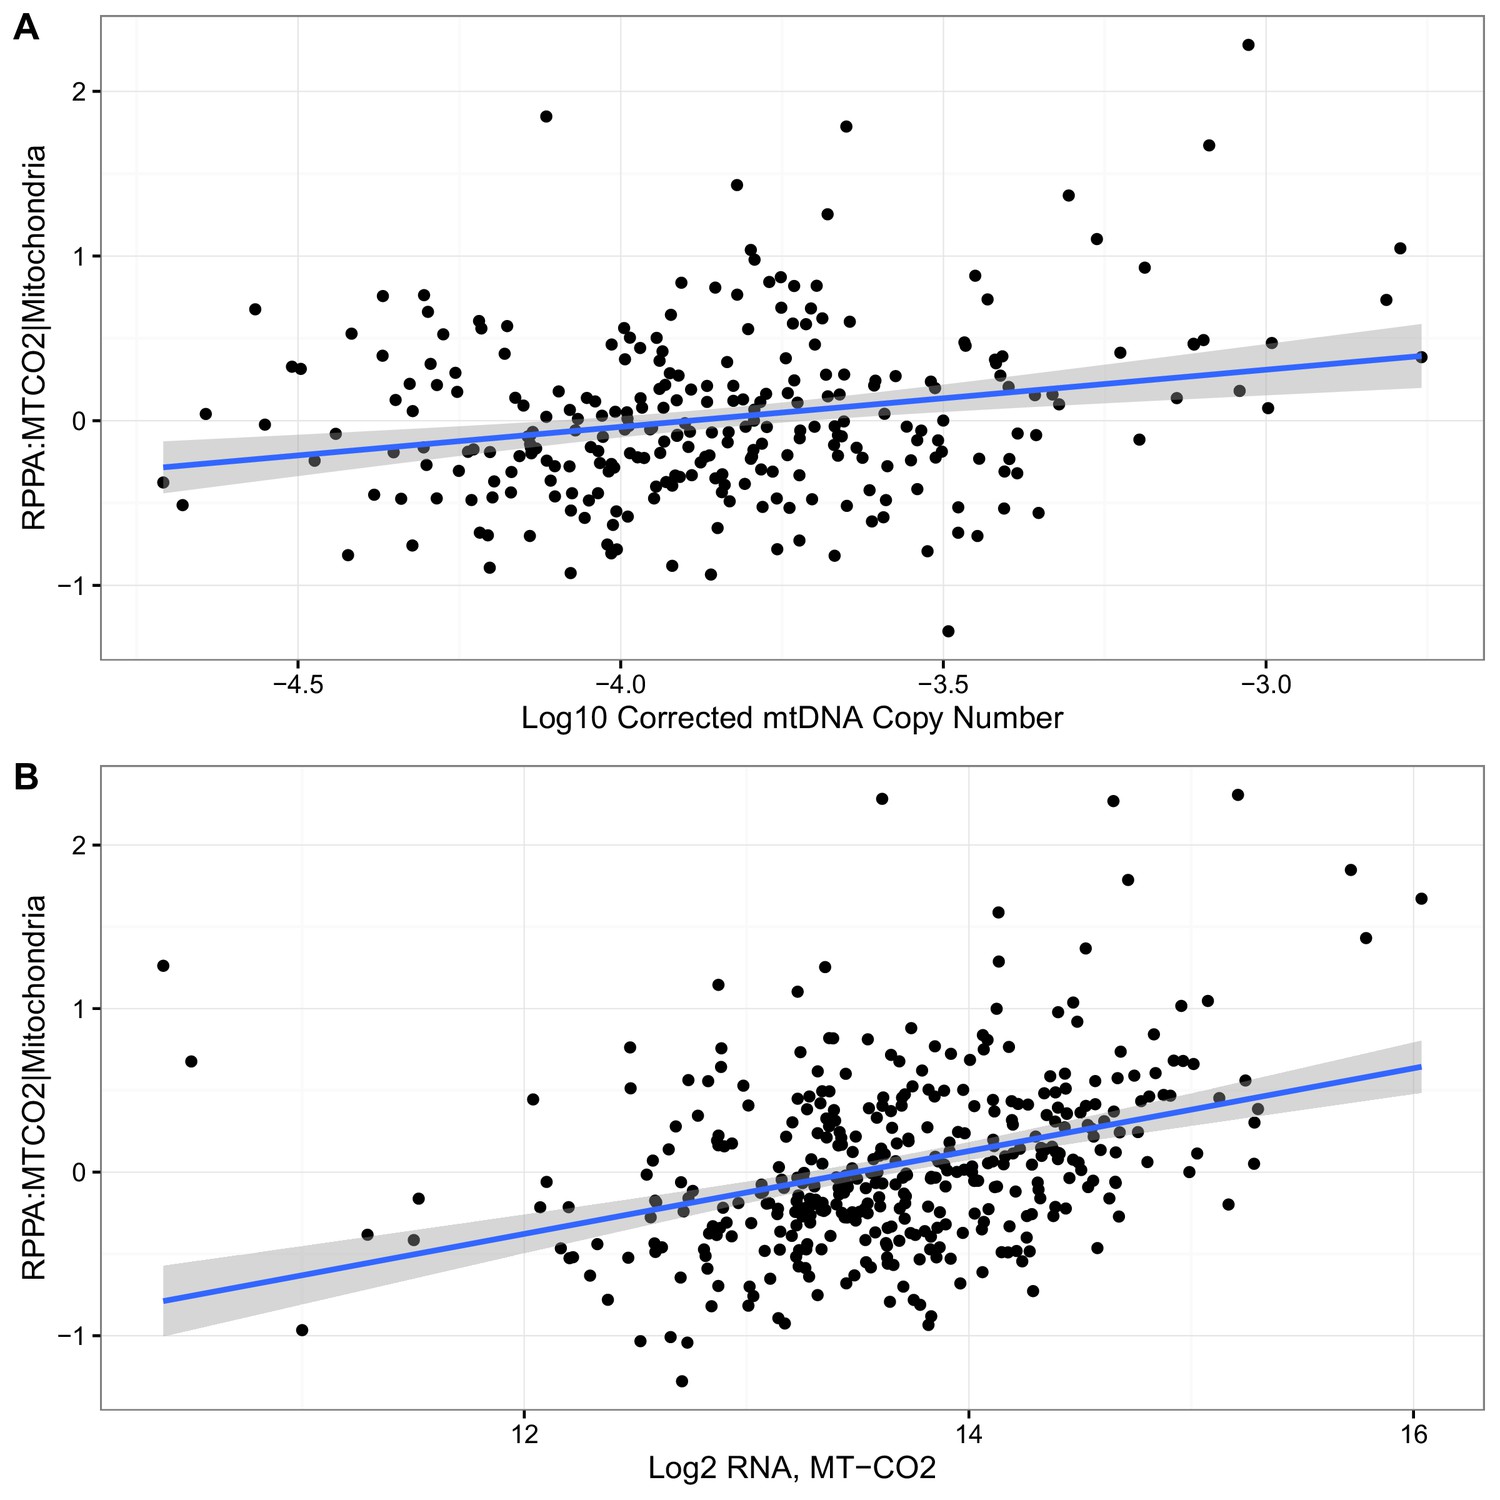
Correlation of RPPA with (A) mtDNA copy number (Spearman 0.18, p-value 0.003) and (b) MT-CO2 RNA expression (Spearman 0.38, p-value <10−14) in KIRC.
Blue lines indicate best-fit linear trend.
Figure 4—figure supplement 3
Correlation of mtDNA copy number and mtRNA expression in KICH.
Separate colors and trend lines correspond to tumor and normal samples.
Figure 5
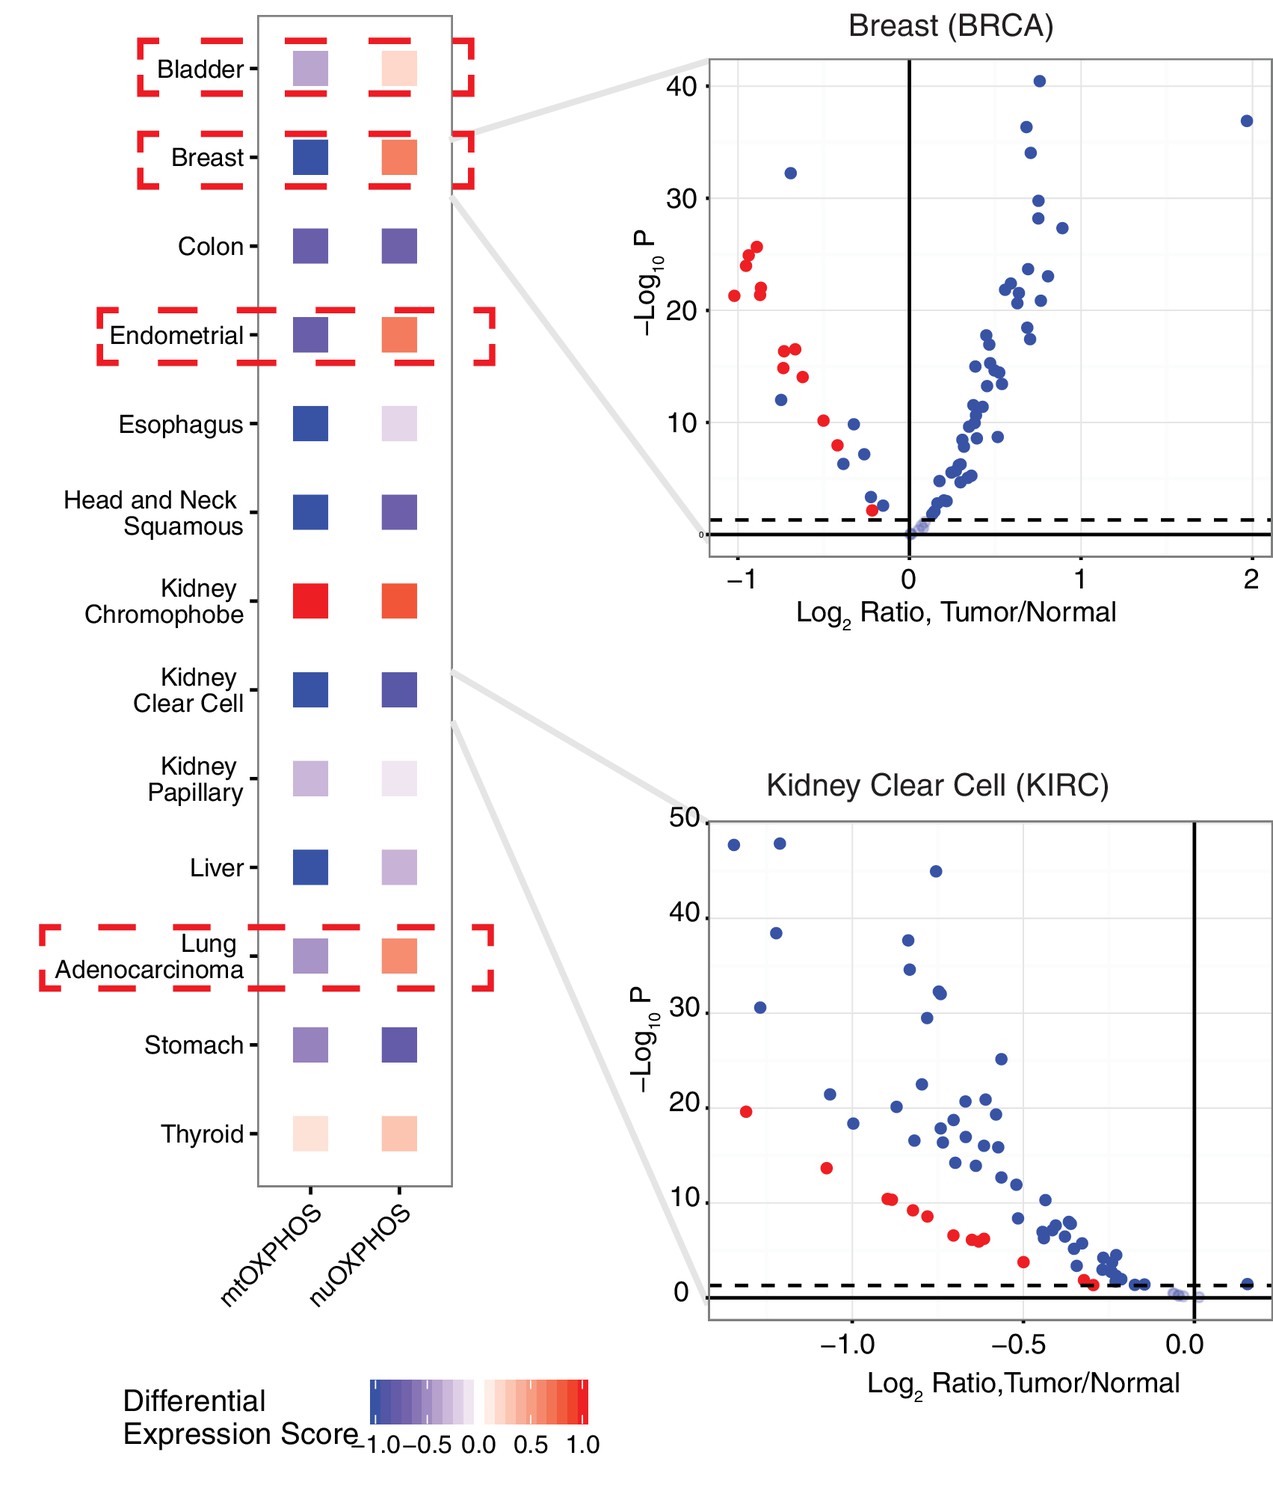
Comparison of differential expression (tumor vs. adjacent-normal tissue) of mtDNA-encoded OXPHOS subunits (mtOXPHOS) and nuclear-DNA-encoded OXPHOS subunits (nuOXPHOS).
(A) Differential expression scores for mtOXPHOS and nuOXPHOS across cancers. Red dashed boxes highlight cancer types with opposite trends in mtOXPHOS and nuOXPHOS differential expression. (B) Volcano plots highlighting differential expression of mtOXPHOS (red) and nuOXPHOS (blue) genes in BRCA and KIRC.
Additional files
-
Supplementary file 1
Summary of sample sizes for each cancer type.
- https://doi.org/10.7554/eLife.21592.013
-
Supplementary file 2
Expression of 13 mtRNAs across all profiled samples.
- https://doi.org/10.7554/eLife.21592.014
-
Supplementary file 3
Results of clinical analysis.
- https://doi.org/10.7554/eLife.21592.015
Download links
A two-part list of links to download the article, or parts of the article, in various formats.
Downloads (link to download the article as PDF)
Open citations (links to open the citations from this article in various online reference manager services)
Cite this article (links to download the citations from this article in formats compatible with various reference manager tools)
Mitochondrial respiratory gene expression is suppressed in many cancers
eLife 6:e21592.
https://doi.org/10.7554/eLife.21592


