The cortical connectivity of the periaqueductal gray and the conditioned response to the threat of breathlessness
- University of Oxford, United Kingdom
Figures
Figure 1 with 1 supplement
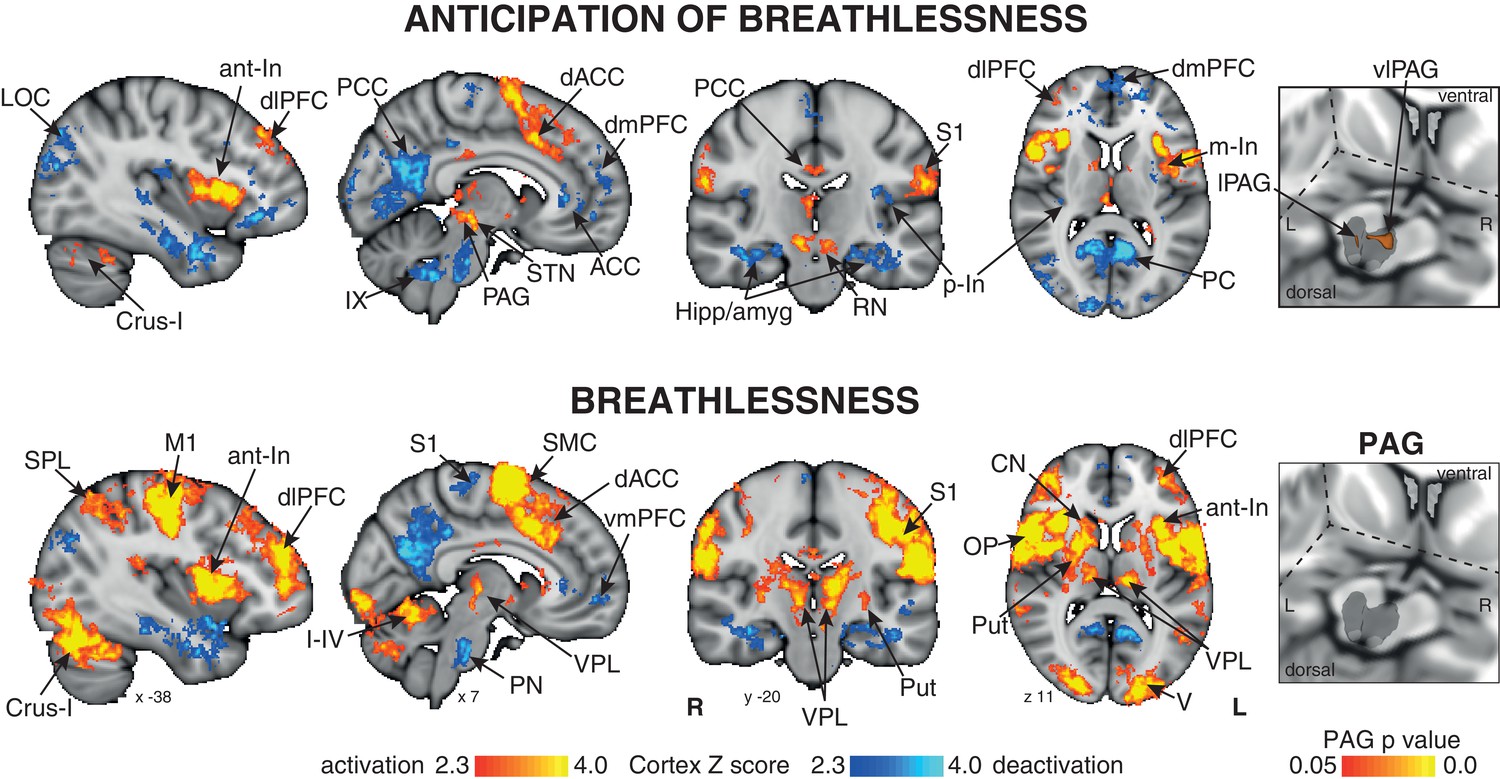
Mean BOLD response to breathlessness and anticipation of breathlessness.
Right: 3-dimensional projection of the periaqueductal gray (PAG) within a cut-out of the midbrain. The images consist of a colour-rendered statistical map superimposed on a standard (MNI 1 x 1 × 1 mm) brain, and significant regions are displayed with a threshold Z > 2.3, with a cluster probability threshold of p<0.05 (corrected for multiple comparisons). Right: The grey region represents the periaqueductal gray, with significant clusters overlaid (p<0.05; non-parametric statistics, small volume-corrected for multiple comparisons using represented PAG mask). Abbreviations: PAG, periaqueductal gray; vlPAG and lPAG, ventrolateral and lateral PAG; M1, primary motor cortex; S1, primary sensory cortex; CN, caudate nucleus; SMC, supplementary motor cortex; Put, putamen; ACC, anterior cingulate cortex; dACC, dorsal anterior cingulate cortex; PCC, posterior cingulate cortex; PC, precuneus; dlPFC, dorsolateral prefrontal cortex; dmPFC, dorsomedial prefrontal cortex; vmPFC, ventromedial prefrontal cortex; Hipp, hippocampus; amyg, amygdala; a-In, anterior insula; m-In, middle insula; p-In, posterior insula; LOC, lateral occipital cortex; SPL, superior parietal lobule; STN, subthalamic nucleus; RN, Red nucleus; OP, operculum; V1, primary visual cortex; IX, I-IV and Crus-I, cerebellar lobes; thalamic nuclei: VPL, ventral posterolateral nucleus; VIN; activation, increase in BOLD signal; deactivation, decrease in BOLD signal.
Figure 1—figure supplement 1
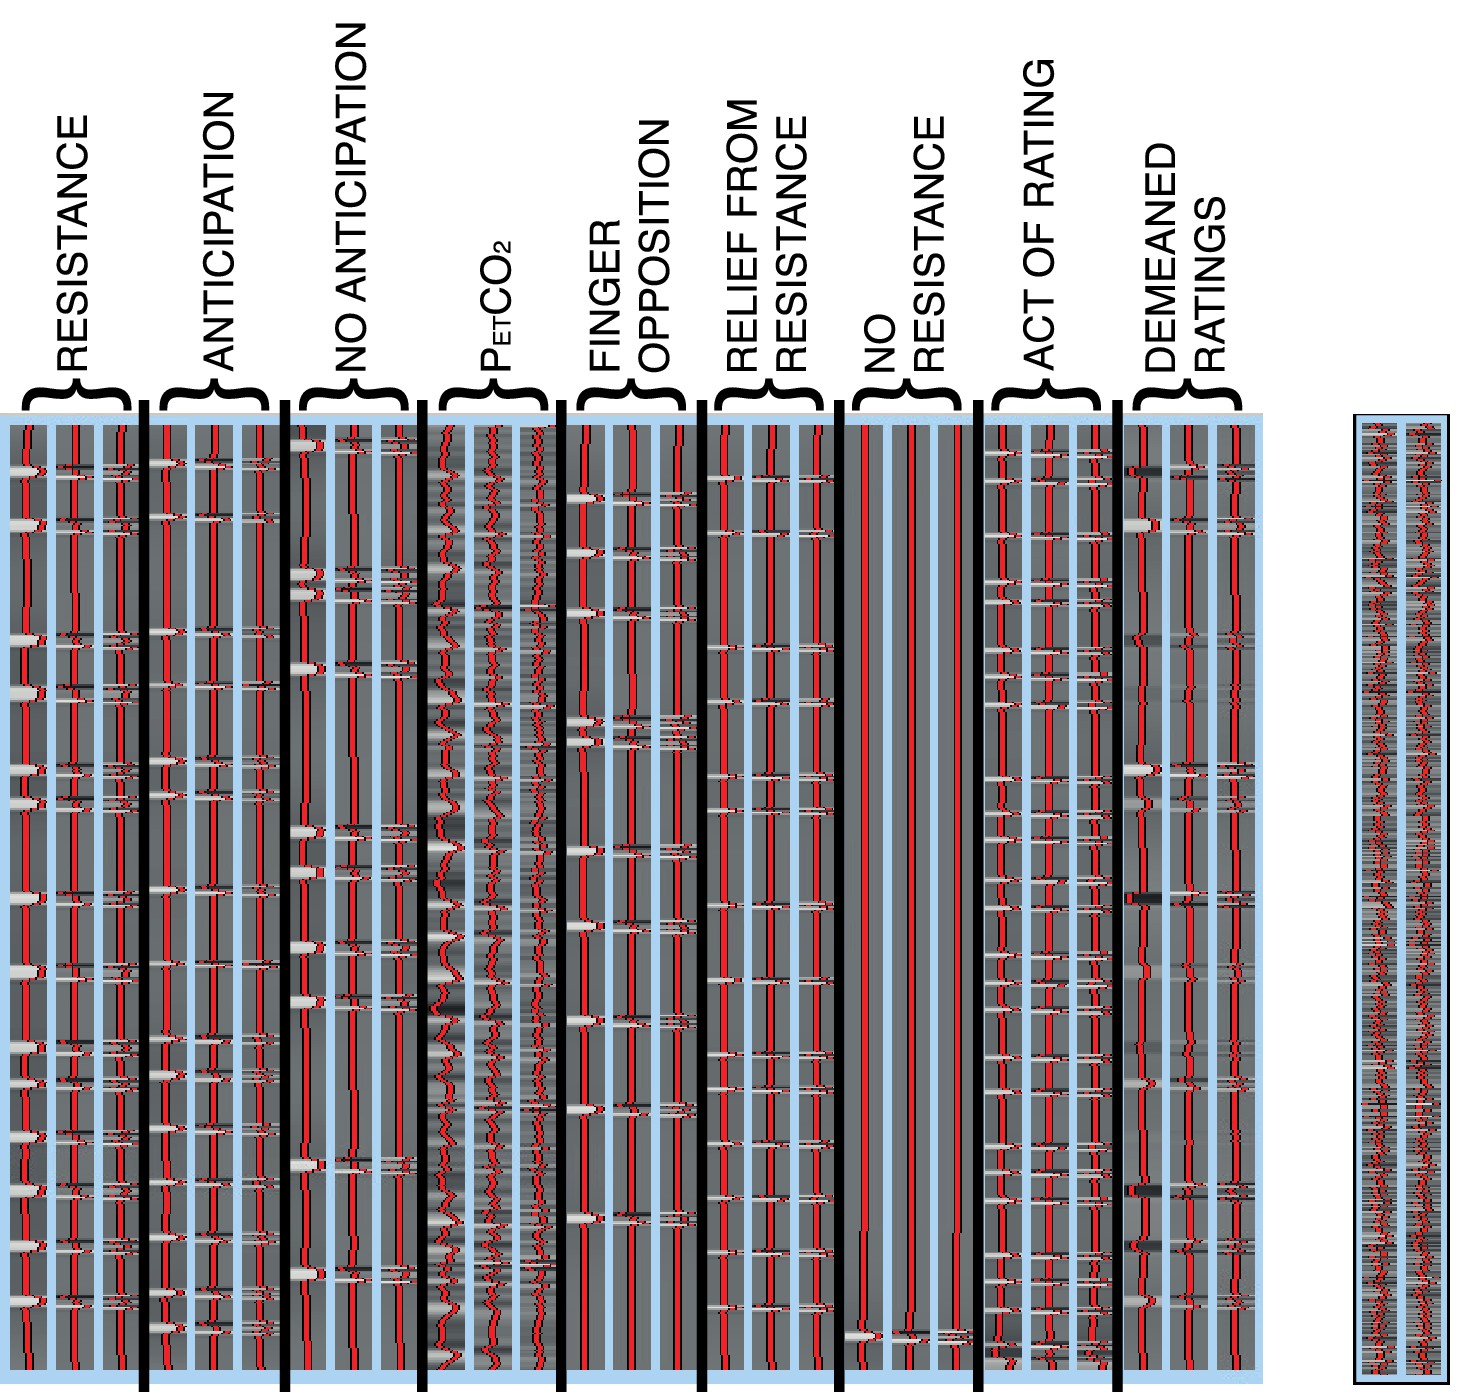
Task subject-level general linear model.
Left: Example general linear model used in each single subject lower level task analysis within FEAT. The FLOBS function creates three EVs for each regressor. The ‘resistance’ onset and duration were calculated from the recorded inspiratory pressure physiological traces, while the anticipation duration (‘anticipation’) was calculated from the onset of the stimulus to the beginning of the resistance. The ‘PETCO2’ trace was included to de-correlate the CO2-induced BOLD changes from the respiratory stimuli throughout the functional scan, and was formed by linearly interpolating between the end-tidal expired CO2 peaks. ‘No anticipation’ and ‘finger opposition’ onset and duration represented the presentation of the corresponding stimuli on the screen, and ‘relief from resistance’ was modelled as the rest periods immediately following each resistance application, prior to ratings (4 s duration). The ‘no resistance’ regressor was a single trial where no resistance was applied following an anticipation period, allowing greater decorrelation between the anticipation and resistance regressors. The ‘act of rating’ regressor was included to remove noise from the physical act of pressing the button box, and spanned each of the rating periods. Finally, ‘demeaned ratings’ matched the ‘resistance’ regressor for timings, and the intensity of the regressor was the demeaned intensity value assigned to each of the inspiratory resistance blocks, to remove the trial-by-trial variability of subjective perceptions of resistive loading from the mean ‘resistance’ regressor. Contrasts of interest were the first regressor of the ‘resistance’ FLOBS set for the breathlessness task, and a differential contrast between the first of each of ‘anticipation’ and ‘no anticipation’ for the anticipation task. Motion regressors were incorporated into the regression of ICA noise during preprocessing. Right: Additional ‘physiological’ and ‘PPI’ regressors used for PPI analysis. Physiological regressors were calculated from the mean timeseries of the vlPAG or lPAG seed under investigation, and the PPI was produced via an interaction between the physiological regressor and the task of interest (‘resistance’ for breathlessness, and an altered differential regressor of ‘anticipation’ above ‘no anticipation’ for anticipation). See http://fsl.fmrib.ox.ac.uk/fsl/fslwiki/PPIHowToRun for more details.
Figure 2
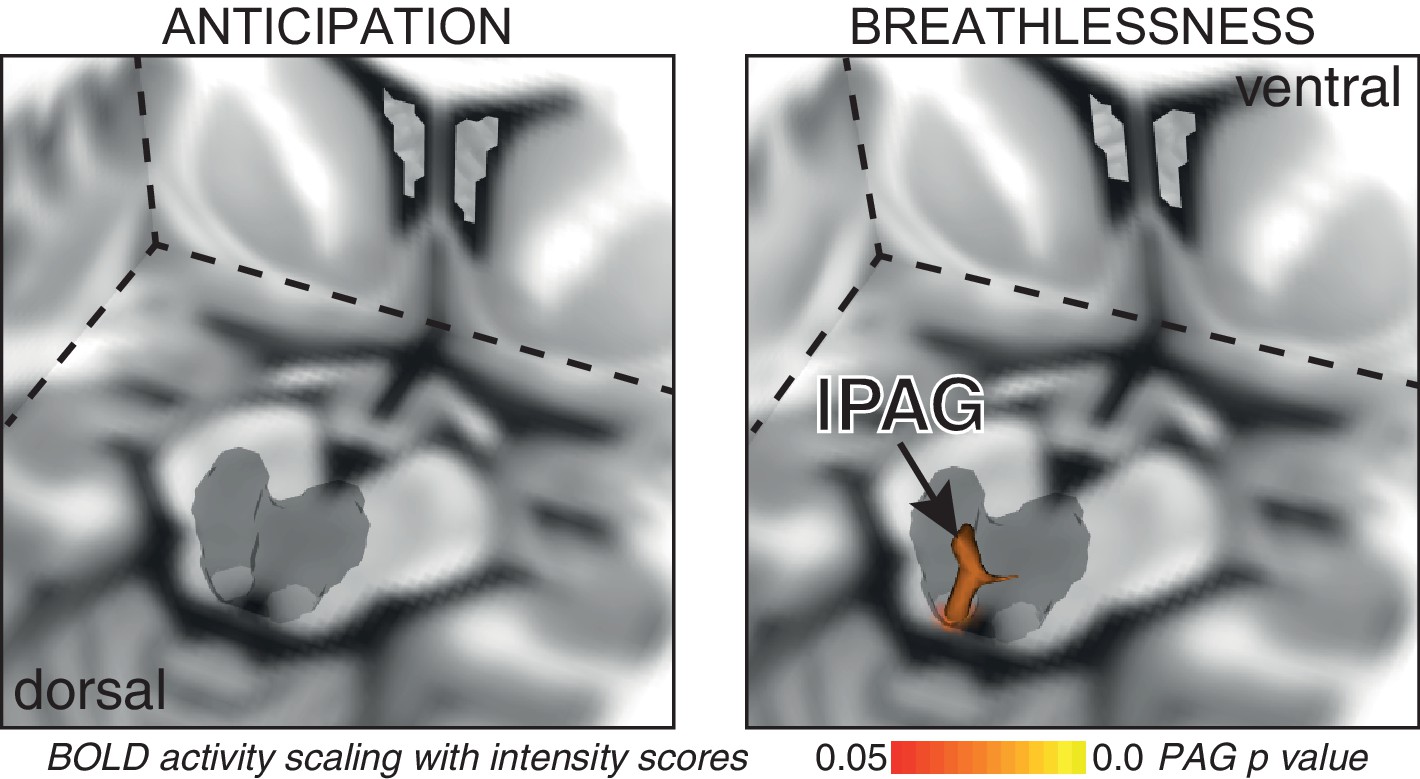
BOLD response to breathlessness that scales with intensity values across subjects.
The periaqueductal gray (PAG) is represented as a 3-dimensional projection within a cut-out of the midbrain. The images consist of a 3-dimensional colour-rendered statistical map superimposed on a standard (MNI 1 x 1 × 1 mm) brain. The grey region represents the periaqueductal gray, with significant clusters overlaid (p<0.05; non-parametric statistics with threshold-free cluster enhancement, small volume-corrected for multiple comparisons using represented PAG mask).
Figure 3
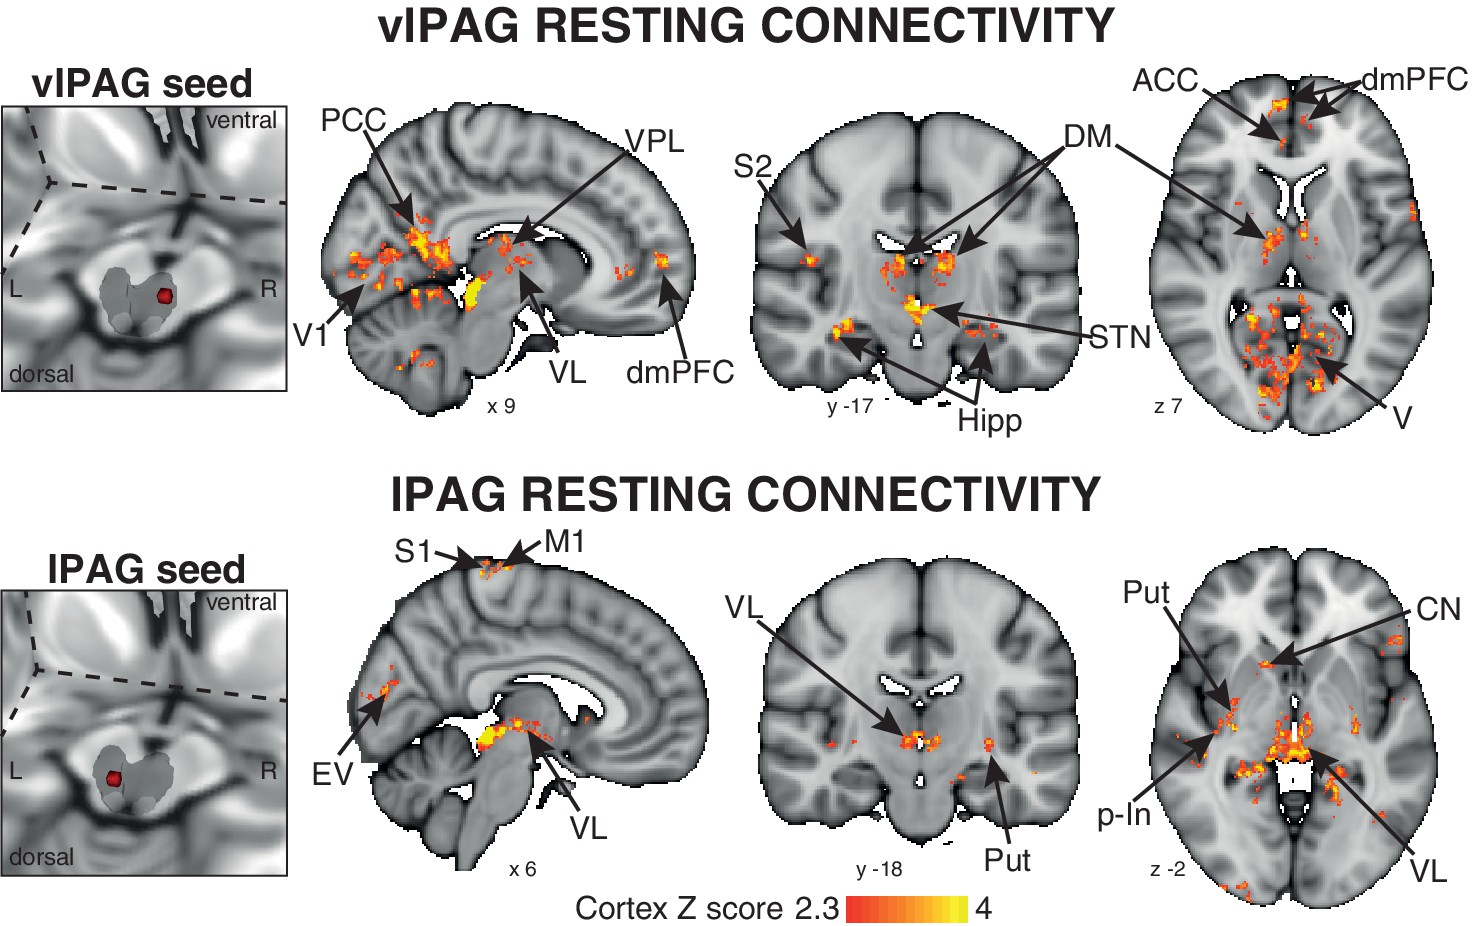
Mean resting state functional connectivity of the active PAG seed regions.
Left: 3-dimensional projection of the periaqueductal gray (PAG) within a cut-out of the midbrain, and the seed placement within the PAG according to functional BOLD activity results. Right: Resting functional connectivity (correlation strength) between the PAG seed and the rest of the brain. The images consist of a colour-rendered statistical map superimposed on a standard (MNI 1 x 1 × 1 mm) brain, and significant regions are displayed with a threshold Z > 2.3, with a cluster probability threshold of p<0.05 (corrected for multiple comparisons). Abbreviations: PAG, periaqueductal gray; vlPAG and lPAG, ventrolateral and lateral PAG; M1, primary motor cortex; S1, primary sensory cortex; CN, caudate nucleus; ACC, anterior cingulate cortex; PCC, posterior cingulate cortex; p-In, posterior insula; dmPFC, dorsomedial prefrontal cortex; Hipp hippocampus; V1, primary visual cortex; V, visual cortex; thalamic nuclei: VP, ventral posterolateral nucleus; VL, ventrolateral nucleus; DM, dorsomedial nucleus.
Figure 4
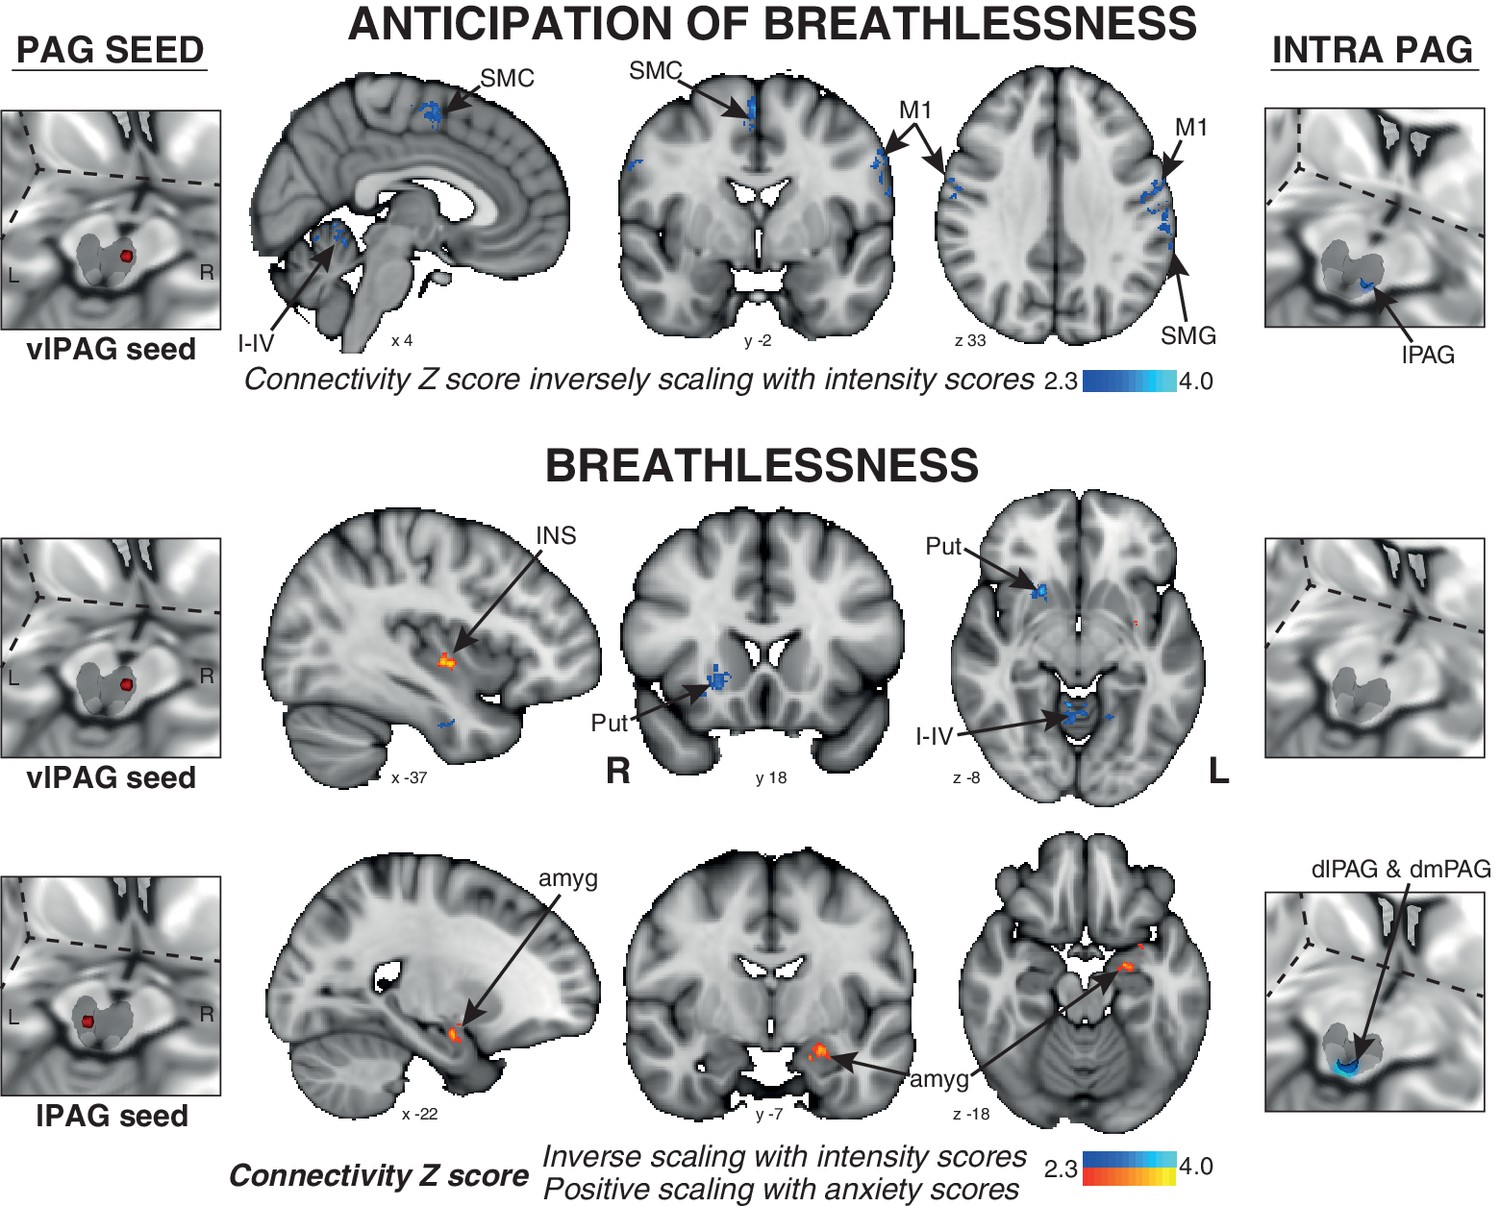
Psychophysiological interactions (PPI) of the active PAG seed regions that scale with subjective ratings of intensity and anxiety of breathlessness across subjects.
Left: 3-dimensional projection of the periaqueductal gray (PAG) within a cut-out of the midbrain, and the seed placement within the PAG according to functional BOLD activity results. Middle: Task functional connectivity (using psychophysiological interaction analyses; PPI) between the PAG seed and the rest of the brain during the anticipation and breathlessness tasks. The images consist of a colour-rendered statistical map superimposed on a standard (MNI 1 x 1 × 1 mm) brain, and significant regions are displayed with a threshold Z > 2.3, with a cluster probability threshold of p<0.05 (corrected for multiple comparisons). Right: Intra-PAG connectivity measured using permutation-testing within the whole PAG. Abbreviations: PAG, periaqueductal gray; vlPAG and lPAG, ventrolateral and lateral PAG; M1, primary motor cortex; SMC, supplementary motor cortex; Put, putamen; amyg, amygdala; INS, middle insula; I-IV, cerebellar lobe.
Additional files
-
Supplementary file 1
Physiology and psychology of breathlessness task.
(A) Supplementary Table 1. Mean (±sd) physiological variables across conditioned respiratory tasks. (B) Supplementary Table 2. Mean (±sd) physiological and psychological variables during breathlessness for both athletes and sedentary subjects. No significant differences were found between groups.
- https://doi.org/10.7554/eLife.21749.007
-
Supplementary file 2
Data preprocessing and measures of residual motion.
(A) Supplementary Table 3. Index of data quality and residual head motion using a framewise change in signal intensity. Mean and standard deviation (SD) of DVARS (root mean square of the differential of all timecourses within the mask at each frame) as a percentage of BOLD signal for raw and cleaned data (see below for details on data cleaning procedures). (B) Data preprocessing description.
- https://doi.org/10.7554/eLife.21749.008
Download links
A two-part list of links to download the article, or parts of the article, in various formats.
Downloads (link to download the article as PDF)
Open citations (links to open the citations from this article in various online reference manager services)
Cite this article (links to download the citations from this article in formats compatible with various reference manager tools)
The cortical connectivity of the periaqueductal gray and the conditioned response to the threat of breathlessness
eLife 6:e21749.
https://doi.org/10.7554/eLife.21749


