MPI depletion enhances O-GlcNAcylation of p53 and suppresses the Warburg effect
- Icahn School of Medicine at Mount Sinai, United States
- Division of Liver Diseases, Icahn School of Medicine at Mount Sinai, United States
- Icahn Institute for Genomics and Multiscale Biology, Icahn School of Medicine at Mount Sinai, United States
- Sanford Burnham Prebys Medical Discovery Institute, United States
- New York University Abu Dhabi, United Arab Emirates
Figures
Figure 1
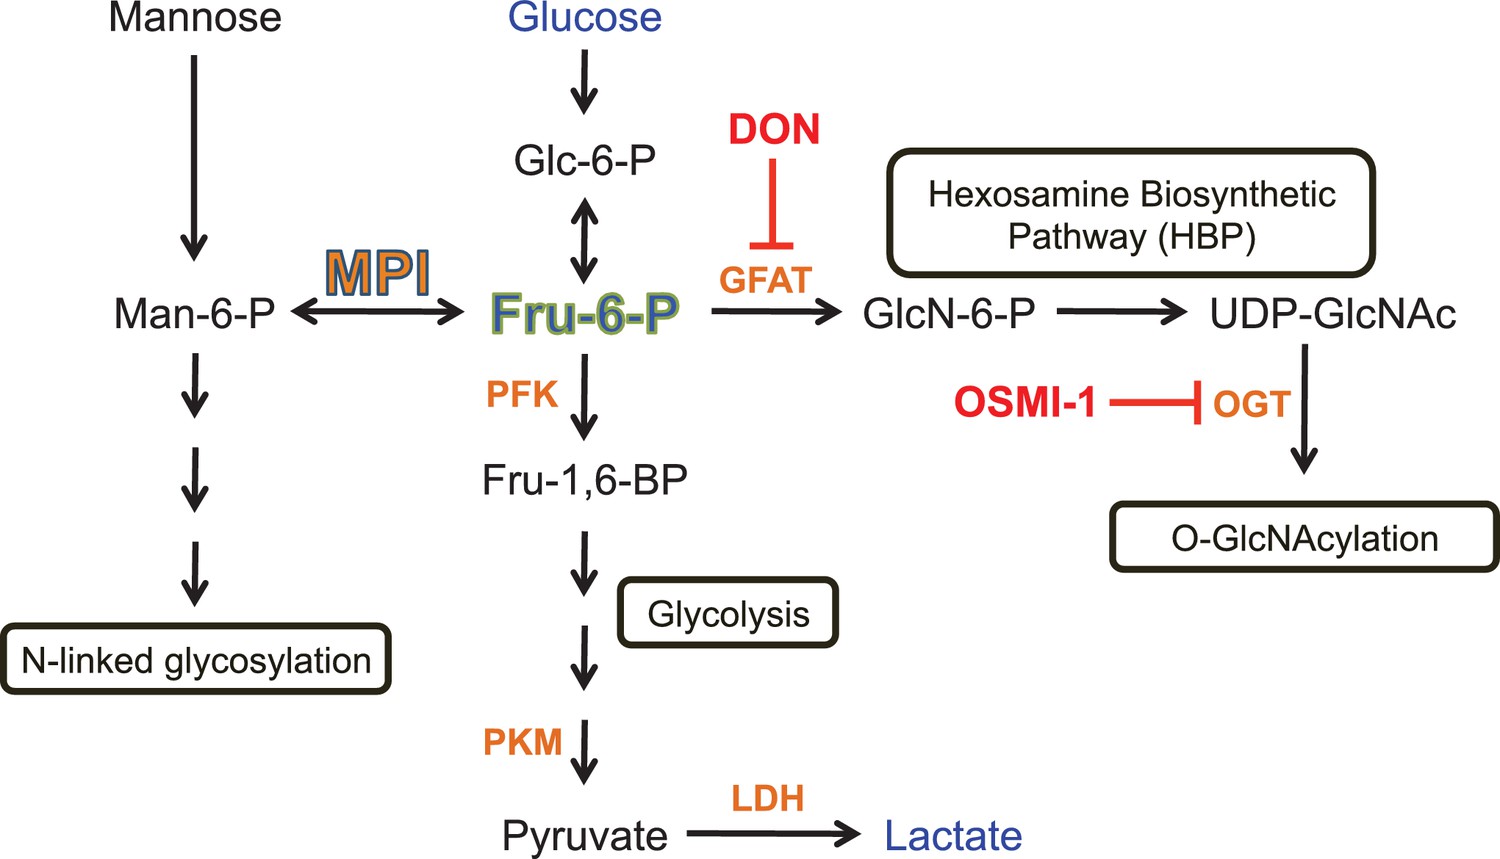
Schematic illustration of involvement of MPI and Fru6P in metabolic pathways.
Key points described in the scheme are: MPI interconverts Man6P and Fru6P, and Man6P is a precursor of N-glycosylation. Fru6P is a substrate of PFK in glycolysis or a substrate of GFAT in HBP. PFK is a central rate-limiting enzyme in glycolysis; LDH catalyzes formation of lactate from pyruvate. DON is an inhibitor of GFAT, and as such an inhibitor of HBP. OGT is the primary enzyme that catalyzes the addition of O-GlcNAC to proteins. Metabolites measured in this study are shown in blue (glucose and lactate) and green (Fru6P). Chemical inhibitors used in this study are shown in red. Relevant enzymes are shown in orange.
Figure 2 with 3 supplements
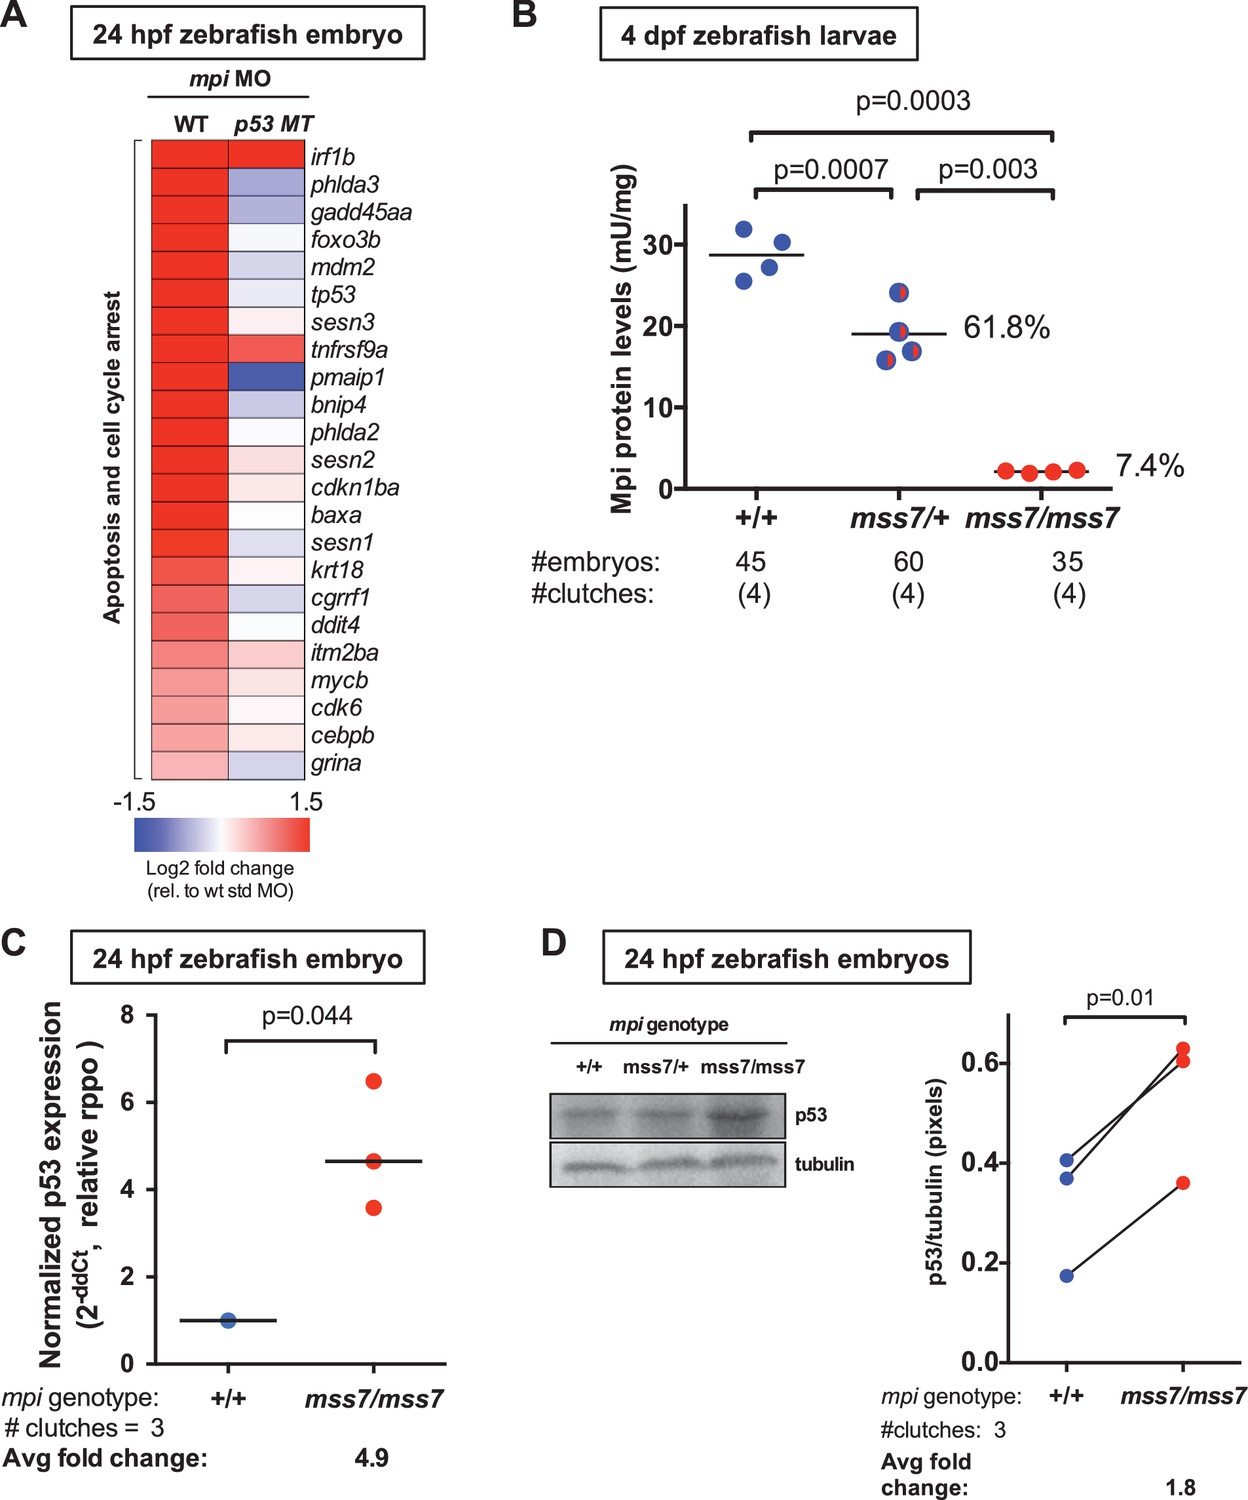
Mpi loss causes cell death in zebrafish embryos via activation of p53.
(A) Whole transcriptome analysis of Mpi-depleted zebrafish embryos using RNA-seq showed increased p53 and apoptosis-related genes. Standardized fold change (FC) in mpi morphants in WT and p53 MT was calculated relative to standard control morpholino (std MO)-injected embryos. The color scheme represents gene expression changes in a log2 scale, in the range of −1.5 (blue, decreased) to 1.5 (red, increased). (B) Residual Mpi activity is significantly decreased at 4 dpf in mpimss7 MT larvae, compared to mpi+/+ siblings. (C) p53 mRNA levels are upregulated as analyzed through qPCR analysis in 24 hpf mpimss7/mss7 embryos, compared to mpi+/+ siblings. (D) p53 protein levels significantly increased at 24 hpf in mpimss7/mss7 embryos assessed by western blot, as compared to mpi+/+ siblings. Western blots quantified using densitometry analysis (ImageJ). p-Value based on two-tailed paired one sample t-test.
-
Figure 2—source data 1
Changes in expression of the genes involved in the N-glycosylation pathway.
Partial dataset of RNAseq analysis performed in 24 hpf zebrafish embryos injected with std or mpi MO. Log2 fold change (FC) values relative to WT + std MO. The list of showing the changes in expression of the genes involved in the N-glycosylation pathway.
- https://doi.org/10.7554/eLife.22477.004
-
Figure 2—source data 2
Changes in expression of the genes involved in apoptosis and cell cycle arrest.
Partial dataset of RNAseq analysis performed in 24 hpf zebrafish embryos (WT and p53 null) injected with std or mpi MO. Log2 fold change (FC) values relative to WT + std MO. The list of showing the changes in expression of the genes involved in apoptosis and cell cycle arrest.
- https://doi.org/10.7554/eLife.22477.005
Figure 2—figure supplement 1

Mpi-depleted zebrafish embryos show few changes in N-glycosylation.
(A) Residual Mpi activity in fish injected with 0.1 ng, 0.4 ng, 1 ng, and 4 ng mpi MO at t = 0. Mpi enzyme activity was measured at 4 dpf and was found to decrease in a dose-dependent manner. Mpi activity expressed as the percent of control activity is shown. p-Value based on two-tailed paired Student's t-test. (B) Heat map shows expression of genes involved in the N-glycosylation pathway in 24 hpf zebrafish embryos injected with std or mpi MO. Log2 fold change (FC) values relative to WT + std MO are listed.
Figure 2—figure supplement 2

p53 and its targets are increased in Mpi-depleted zebrafish embryos.
(A) Validation of RNA-seq data by qPCR of 24 hpf zebrafish mpi morphant embryos showing transcriptional activation of candidate genes involves in apoptosis. The Ct values were normalized relative to the expression of rpp0 gene. Relative fold change (FC) was calculated as delta Ct in mpi MO compared to the std MO control. (B) and (C) Western blots showing p53 protein expression in 24 hpf and 4 dpf larvae after std MO and mpi MO injection. Western blots are quantified using densitometry analysis (ImageJ) and normalized to actin. Lines connecting std MO and mpi MO points indicate samples within the same clutch. All p-values were calculated using paired two-tailed Student’s t-test.
Figure 2—figure supplement 3
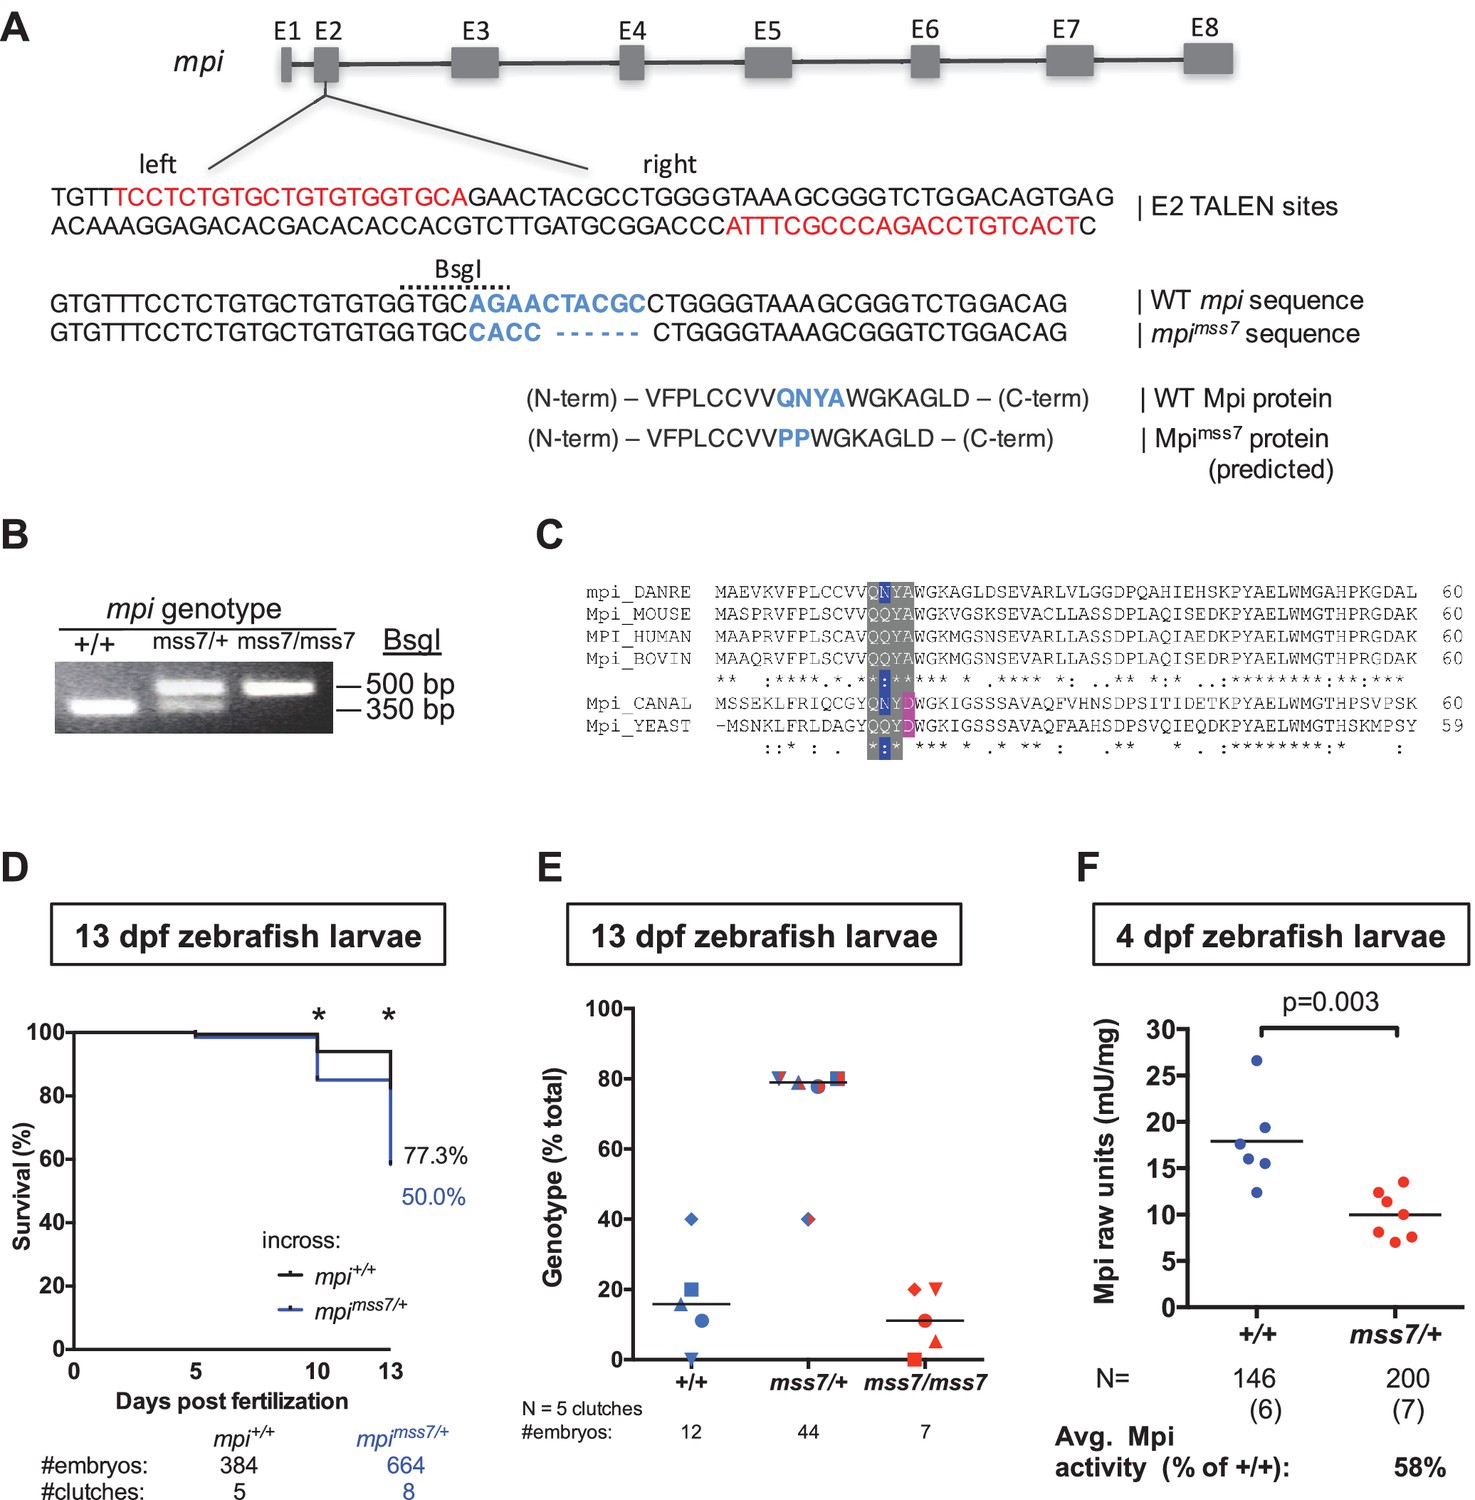
mpi mss7 MT are embryonic lethal.
(A) Schematic of mpi gene with annotated exons. Diagram of partial mpi genomic DNA sequence, showing the TALEN-binding sites (in red), targeting exon 2. WT genomic and predicted protein sequences annotated (second and third rows). mss7 mutant genomic and predicted protein sequences annotated (rows four-seven), suggesting indel substitution mutation change in blue. (B) Representative genotyping of the mpi MT embryos after BsgI digestion. Genotyping described in Materials and methods. (C) Clustal alignment of MPI orthologs showing partial conservation in the region mutated in the mpimss7 mutant zebrafish. (D) Kaplan-Meier survival curves showing 50% death by day 13 in embryos produced from an mss7/+ adult incross mating, as compared to 22.7% in WT embryos. *p<0.0001 by two-tailed Fisher’s exact test. (E) Distribution of genotypes in the offspring from incross of heterozygous mpimss7/+ adults at day 13. Genotypes within the same clutch are indicated by the same symbol. (F) Mpi activity in 4 dpf embryos from wt and mss7/+ adult incross matings. p-Value was calculated using two-tailed Student’s t-test.
Figure 3 with 2 supplements
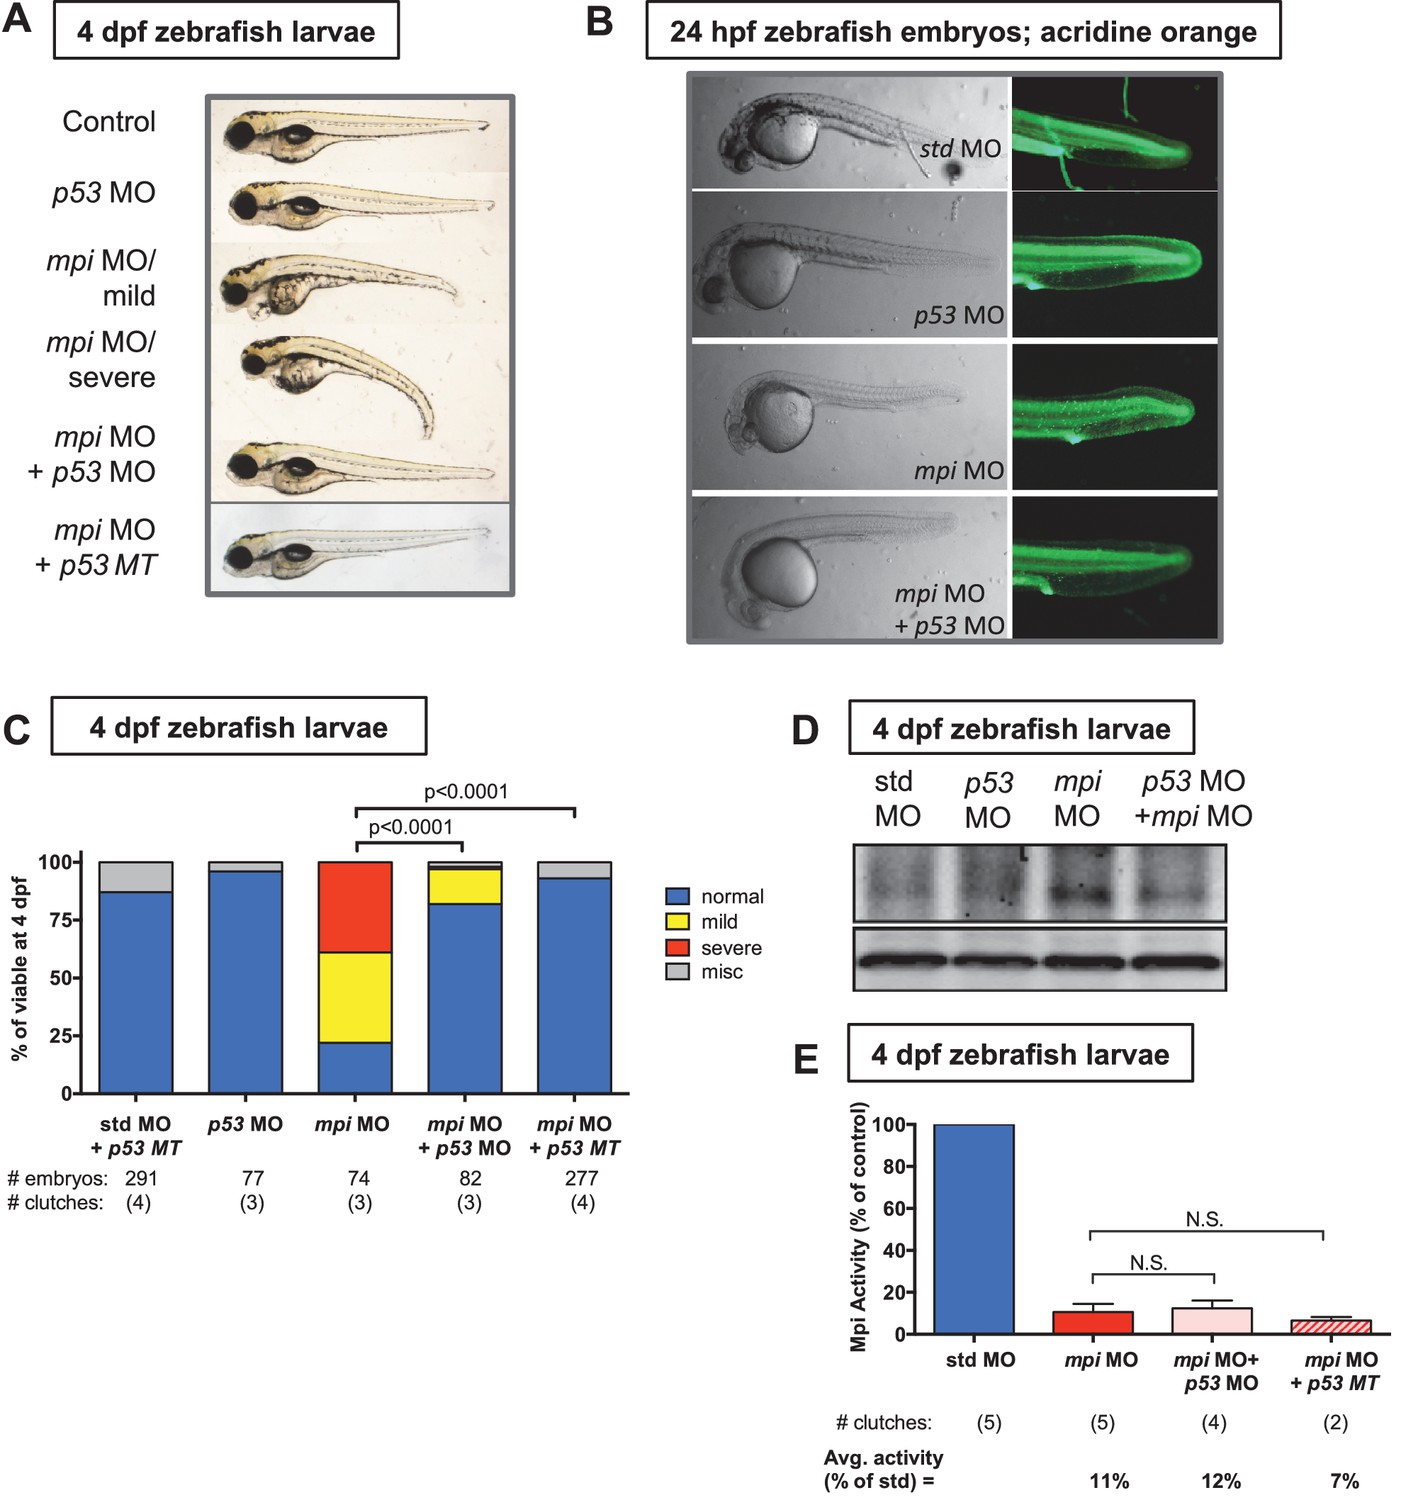
p53 is downstream of Mpi.
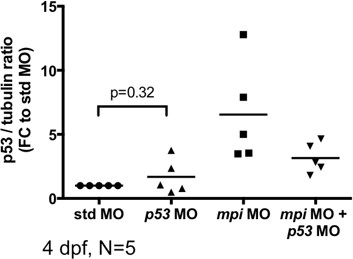
(A) Representative phenotypes of 4 dpf zebrafish larvae following injections of std MO, mpi MO and p53 MO. mpi morphants are characterized by a small head, microphthalmia, pericardial edema, jaw defects and reduced liver size. Examples of normal, mild and severe phenotypes are shown. Co-injection of mpi MO and p53 MO, and injection of mpi MO into p53 MT larvae showed phenotypic rescue of mpi knockdown. (B) The cell death phenotype in mpi morphants, visualized by acridine orange staining, was reversed by co-injection of mpi and p53 morpholino. (C) Quantification of scoring of the phenotypes at 4 dpf, showing that 82% of mpi morphants injected with p53 MO, and 93% of p53 MT injected with mpi MO, were rescued to normal as compared with 22% normal in mpi MO larvae. p-values based on two-tailed Fisher’s exact test. (D) Western blot analysis showing that increase in p53 protein expression in mpi morphants was reduced by co-injection with p53 morpholino. Representative image of four separate clutches. (E) Mpi activity was not affected in either p53 MO co-injected embryos or with mpi MO in the p53 MT. p-Value based on two-tailed paired Student's t-test and Bonferroni correction was applied with alpha = 0.025; N.S. represents p-value>0.05.
Figure 3—figure supplement 1
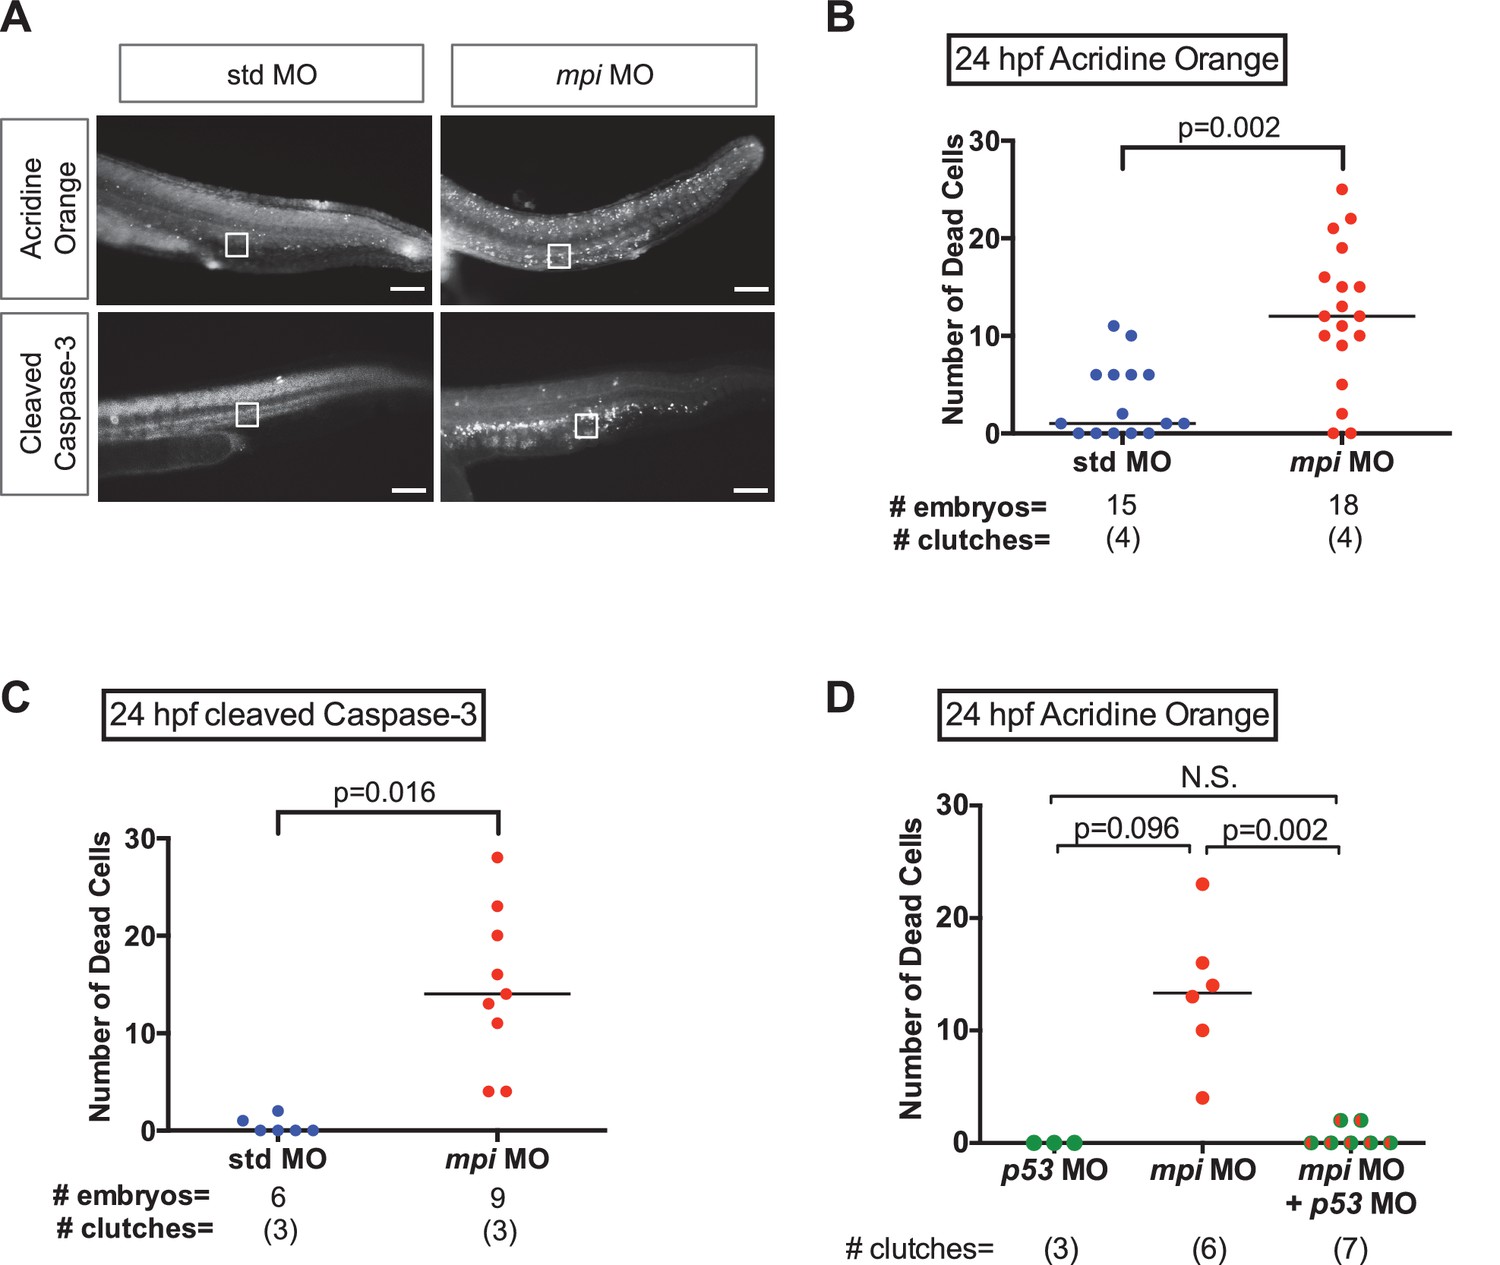
Cell death from loss of Mpi is rescued with p53 depletion.
(A–C) Detection and quantification of apoptotic cell death in 24 hpf embryos injected with std and mpi MO by acridine orange staining observed under GFP (top row), and cleaved Caspase-3 immunofluorescence observed under RFP (bottom row). Scale bar = 100 µM. A standardized area of the tail was used for the quantification. A frame of 75 µm by 75 µm was set and superimposed on the image (white square in image) and positioned from the tip of the anal pore. Using Nikon's NIS-Elements software, cell death was quantified. Dead cells within the standardized area were counted as the total number of dead cells. (D) Quantification of cell death after acridine orange staining of 24 hpf zebrafish embryos co-injected with mpi and p53 MO, compared to each MO alone. The increase in cell death seen in mpi MO was rescued in the co-injected embryos. All p-values based on two-tailed paired Student's t test.
Figure 3—figure supplement 2
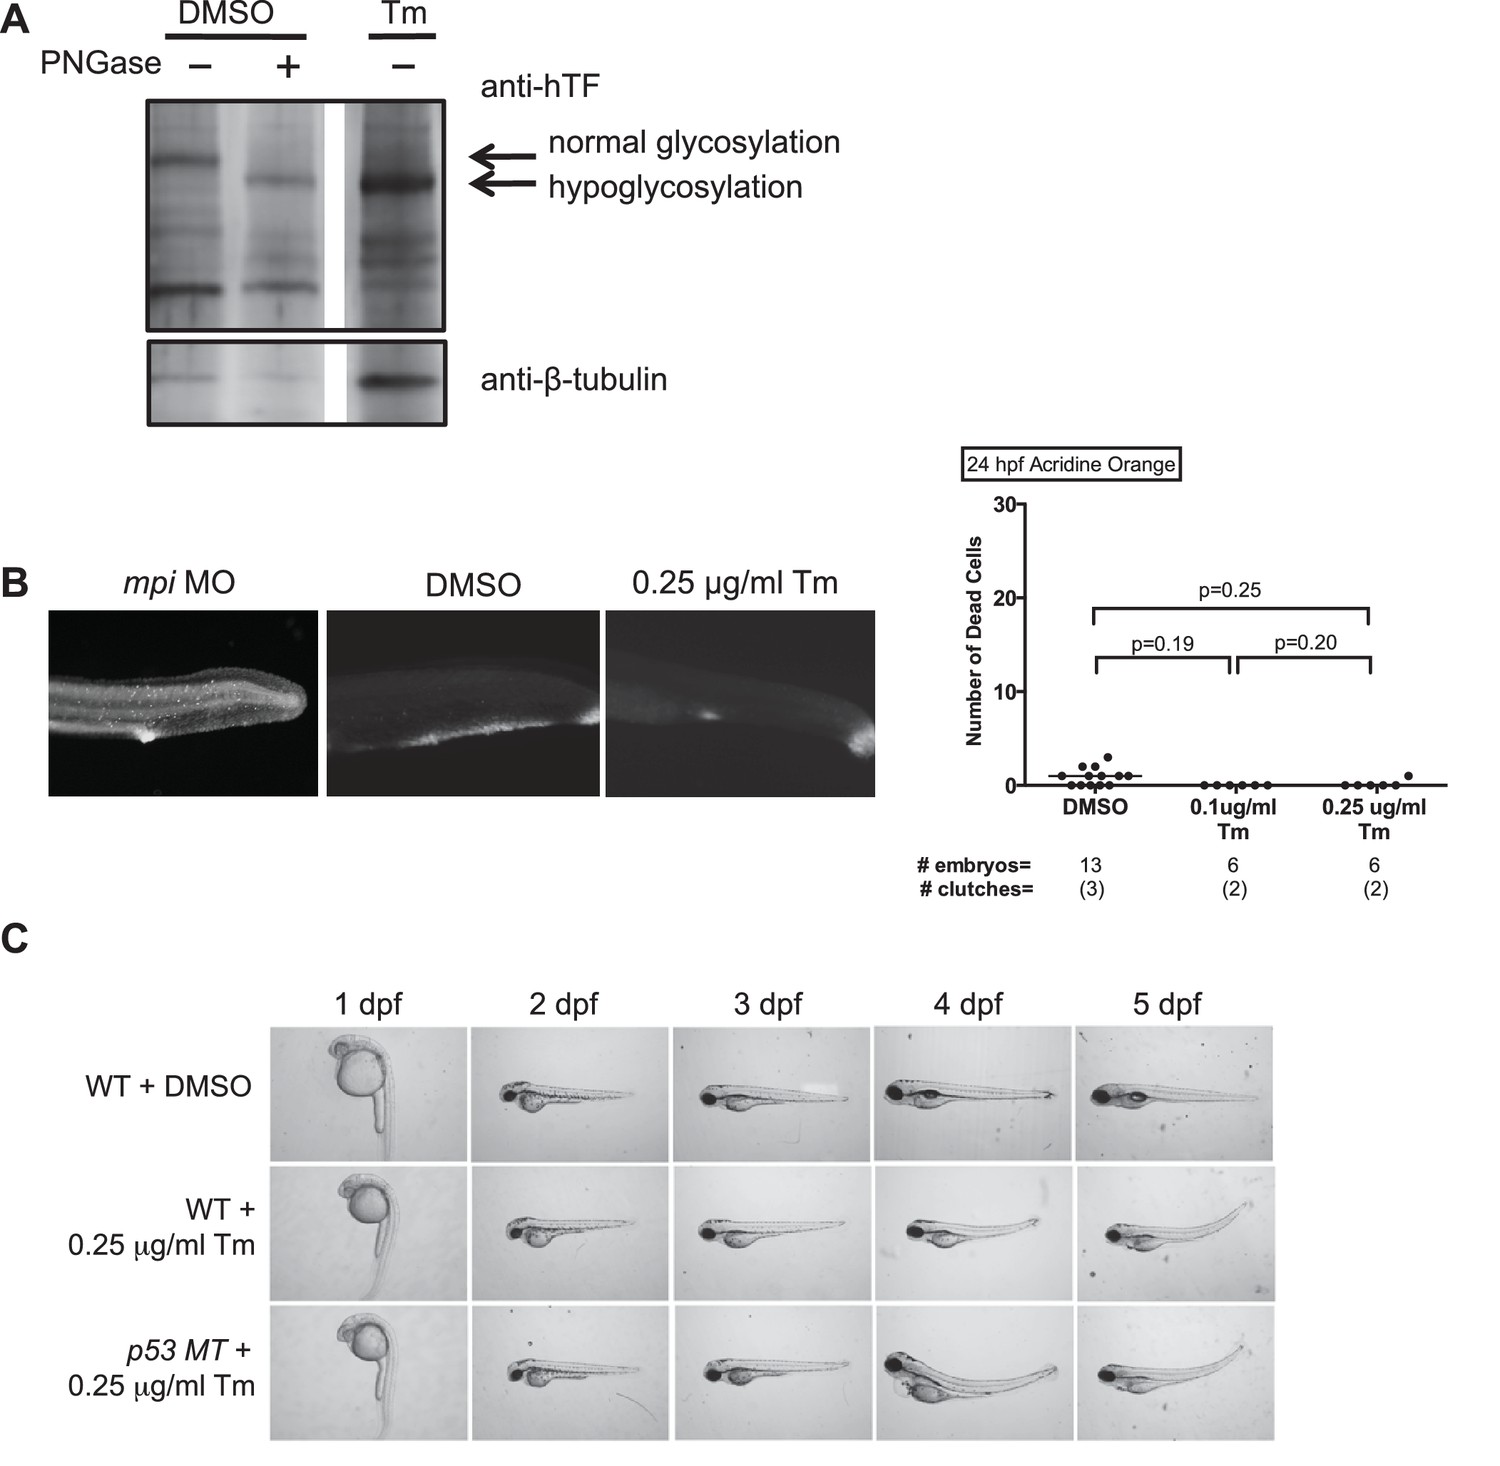
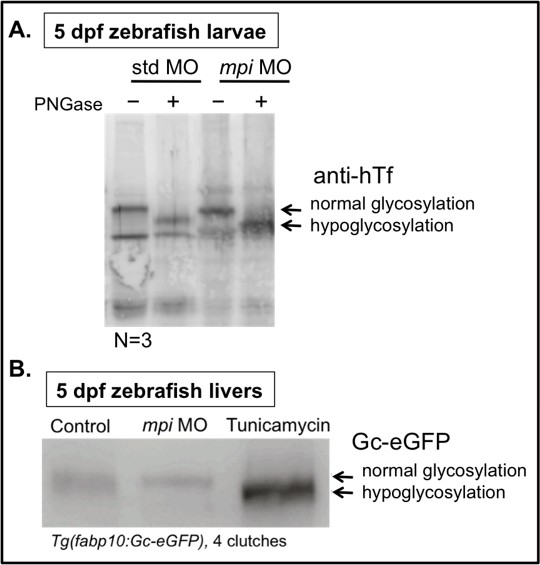
Tm-induced hypoglycosylation does not depend on p53.
(A) Embryos from Tg(fabp10:hTf;cmlc2:EGFP) either treated with DMSO or 0.25 ug/mL Tunicamycin (Tm), and collected at 5 dpf. PNGase F digestion performed to show fully hypoglycosylated moiety. Western blot showing that transferrin (Tf) is hypoglycosylated with Tm treatment. Data representative of three distinct clutches. (B) Acridine orange staining with quantification of cell death (NIS-Elements software) showing minimal cell death in 0.1 or 0.25 µg/ml Tm-treated embryos at 24 hpf (tail shown), as compared to mpi MO. p-Values based on two-tailed paired Student's t test. (C) Time course of morphology of embryos treated with Tm in WT or p53 MT background. Data representative of four distinct clutches.
Figure 4 with 1 supplement
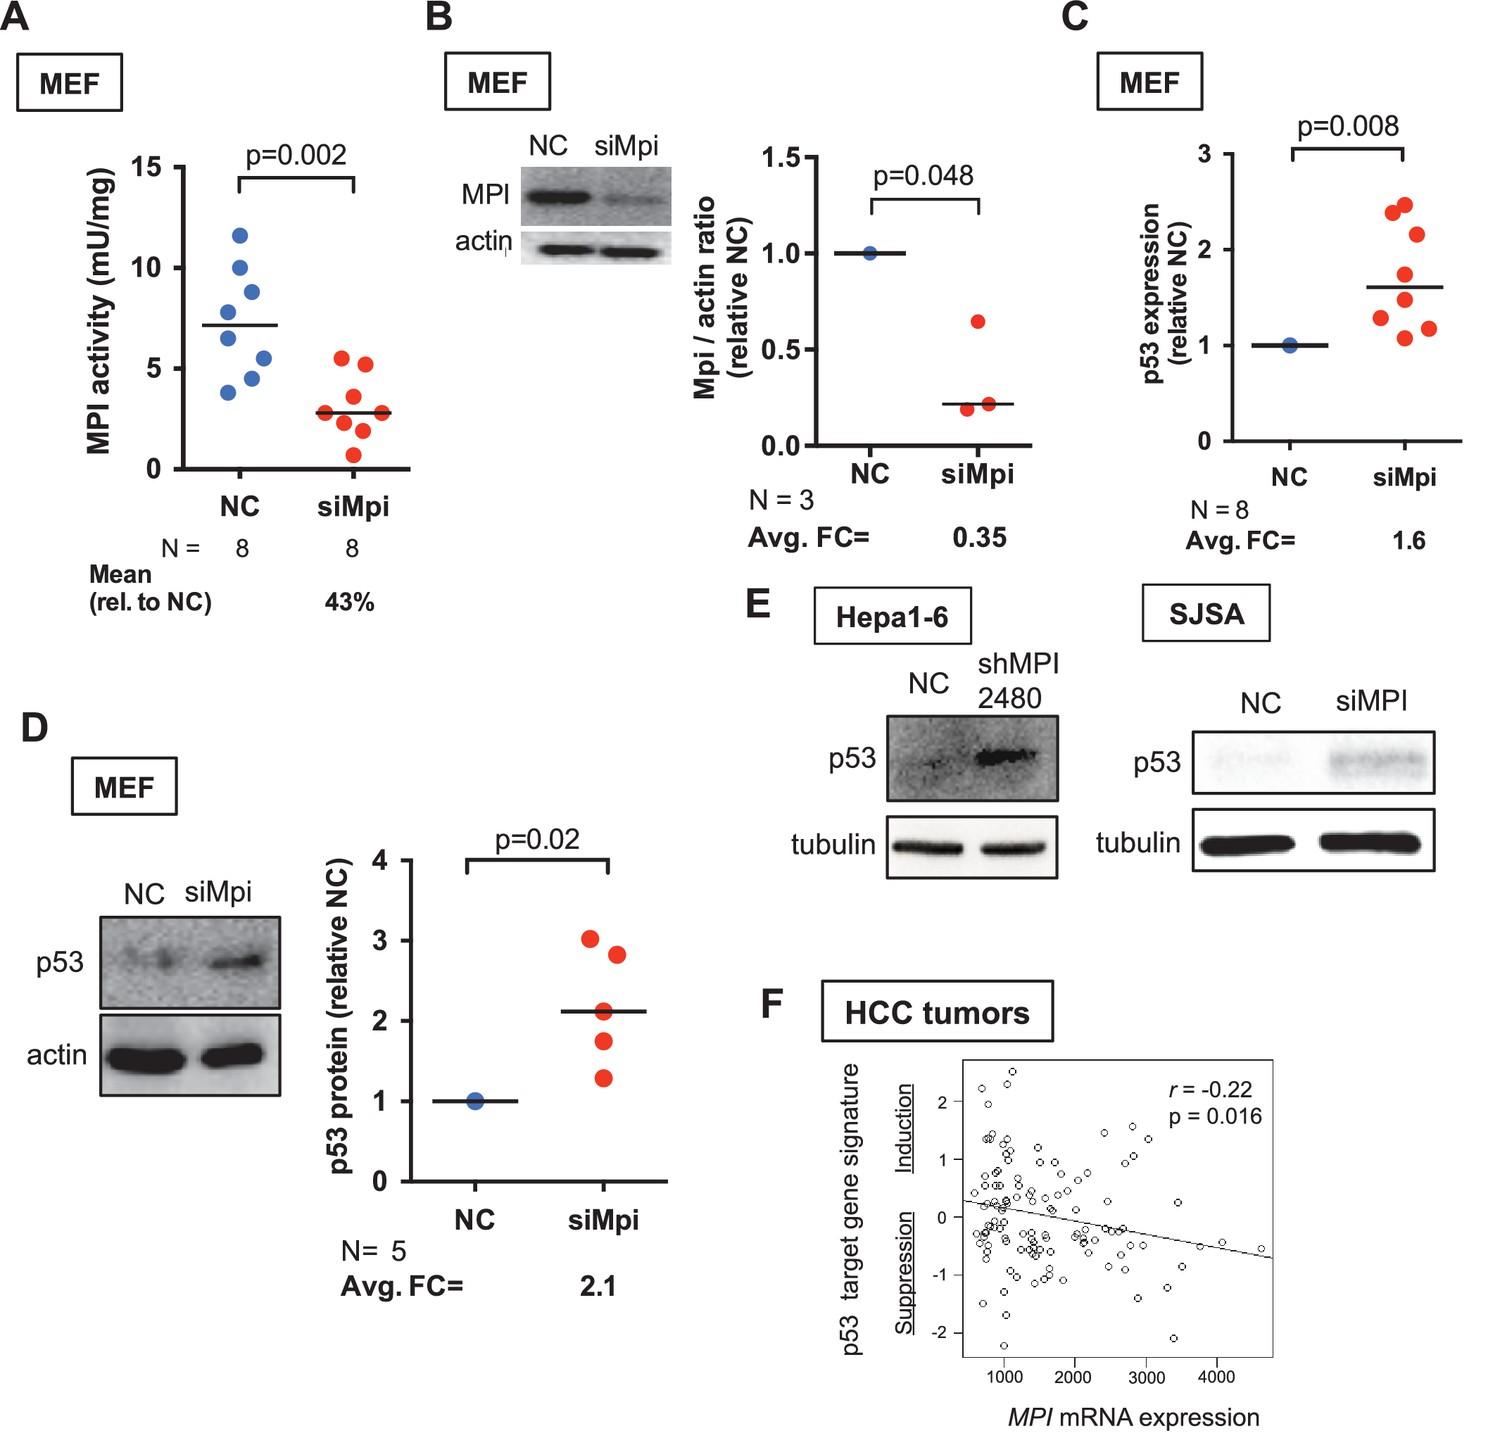
MPI knockdown induced p53 in embryonic and cancer cells.
(A) Efficiency of MPI knockdown shown by reduction in MPI activity in MEFs transfected with siMpi compared to negative control siRNA (NC). Absolute activity units (mU/mg protein) are shown. (B) Western blot analysis showing a significant decrease in MPI protein levels in siMpi MEFs compared to NC cells. Western blots were quantified using densitometry analysis (ImageJ) and normalized to actin. (C) Measurement of p53 mRNA in Mpi knockdown MEFs by qPCR demonstrated significant increase in p53 expression in siMpi compared to NC. The Ct values were normalized relative to the expression of Rps28 gene. Relative fold change was calculated as delta Ct in siMpi compared to NC. (D) Western blot analysis showing an increase in p53 protein levels in siMpi MEFs compared to NC. Western blots were quantified using densitometry analysis (ImageJ), and the results were normalized using actin. Two-tailed paired Student's t-test was applied in panels A-D. (E) Western blot analysis showing an increase in p53 protein levels in cancer cells (Hepa1-6 and SJSA) following MPI knockdown by shRNA or by dsiRNA, respectively, compared to NC. Images are representative of five independent (Hepa1-6) and two independent (SJSA) blots. (F) Transcriptome profiles of 118 human hepatocellular carcinoma (HCC) tumors showing that a p53 target gene signature induction is inversely correlated with MPI expression level with statistical significance. Pearson correlation test was applied.
Figure 4—figure supplement 1
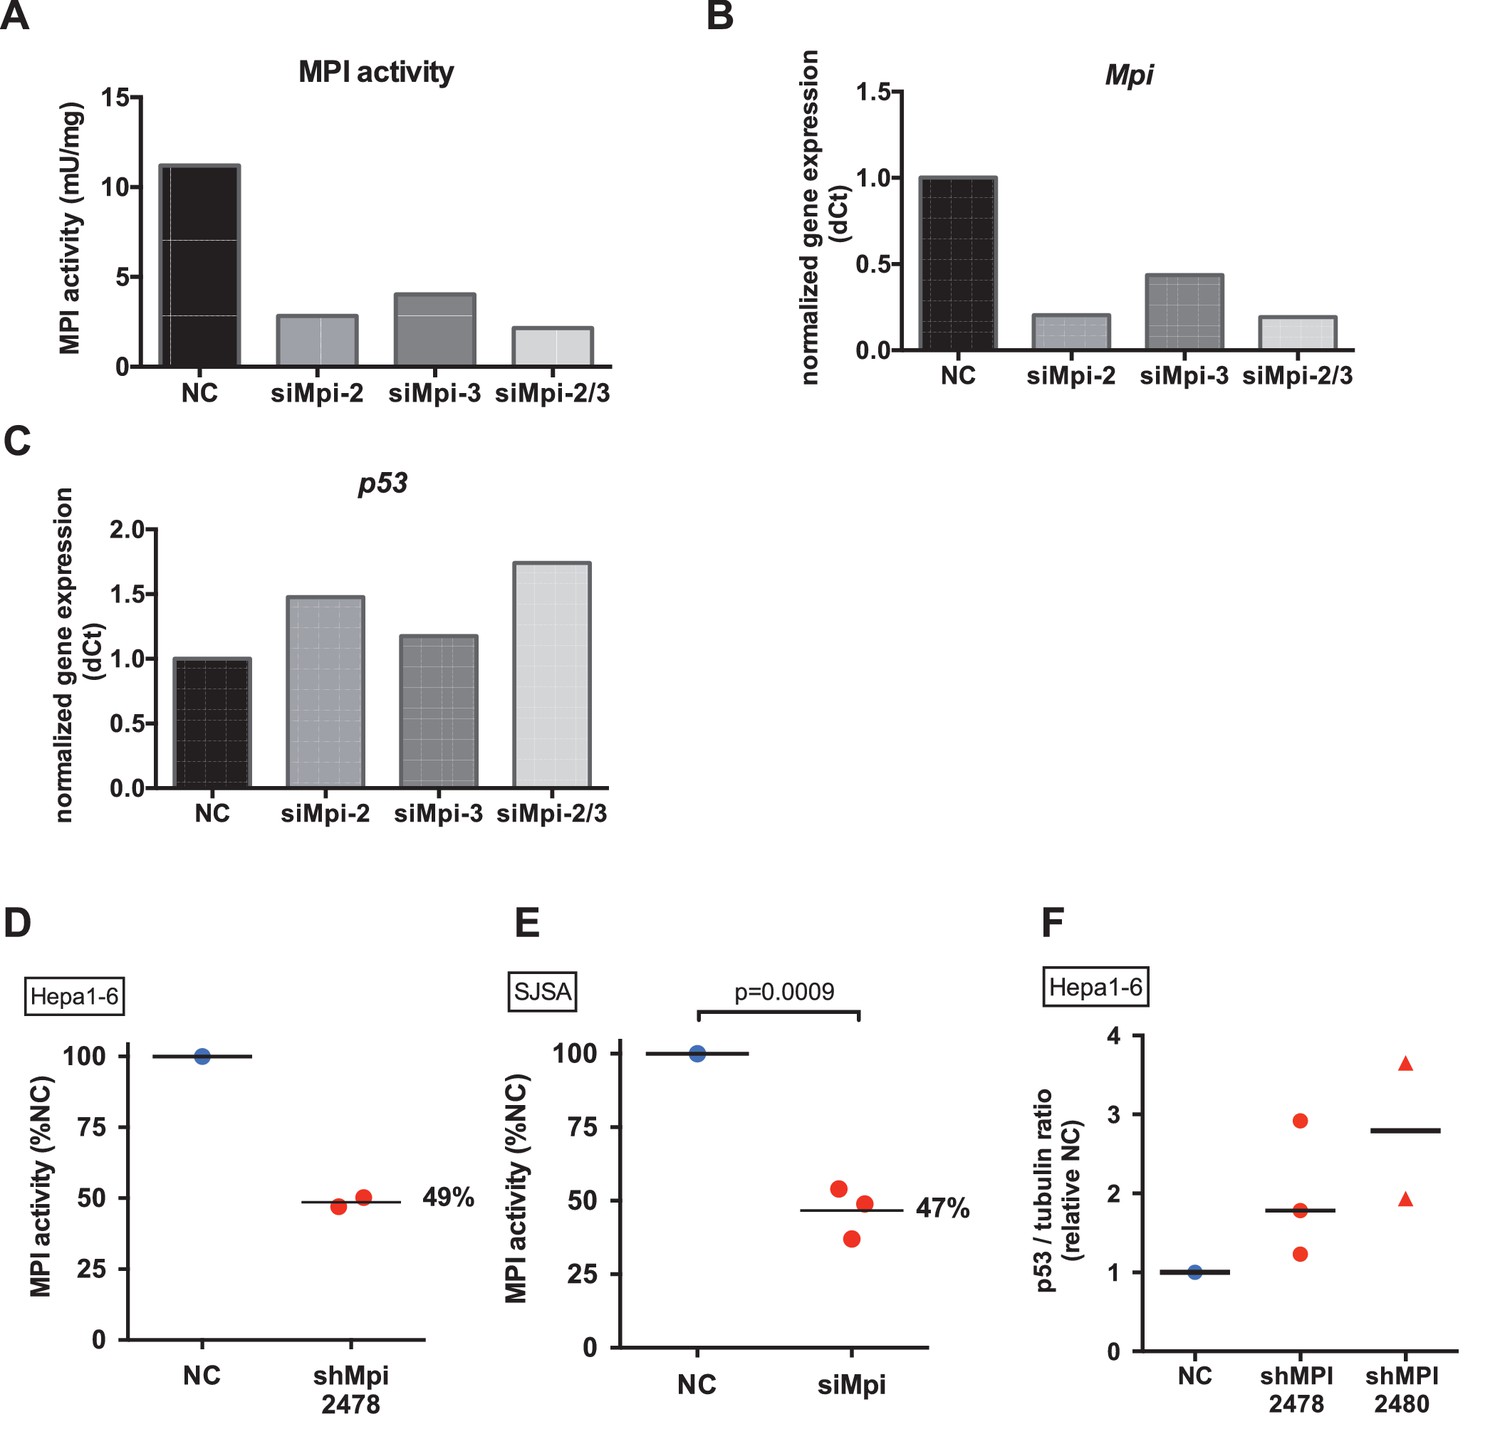
MPI can be efficiently depleted in mammalian cell lines.
(A) Efficiency of siRNA was assessed by MPI enzyme activity using different siRNA duplexes separately or combined (siMpi2, siMpi3, siMpi2/3) in MEFs. siMpi2 showed more efficient knockdown and to a greater extent when co-transfected with siMpi3. (B) Mpi mRNA expression by qPCR analysis in siMpi2, siMpi3, siMpi2/3 transfected cells compared to the negative control (NC) siRNA. (C) p53 expression by qPCR analysis following MPI knockdown by using different siRNA duplexes separately or combined (siMpi2, siMpi3, siMpi2/3) in MEFs. Expression of p53 showed a direct correlation between efficiency of MPI knockdown and upregulation of p53. (D) Efficiency of shRNA-mediated silencing of Mpi (clone shMpi 2478) in Hepa1-6 cell line measured by MPI enzyme activity, showing a decrease in enzymatic activity in shMpi compared to the NC. (E) Efficiency of dsiRNA-mediated silencing in SJSA cell line measured by MPI enzyme activity in siMPI compared to the NC. (F) Western blot quantification of p53/tubulin ratio in shMPI 2478 and shMPI 2480 infection in Hepa1-6 cells. Represented by fold change from negative control shRNA.
Figure 5 with 2 supplements

MPI loss suppresses the Warburg effect in embryonic cells.
(A) Heat map based on RNA-seq data analysis showing downregulation of glycolytic genes in mpi morphants at 24 hpf. Standardized fold change (FC) in mpi morphants in WT and p53 MT was calculated relative to standard control morpholino (std MO)-injected embryos. The color scheme represents gene expression changes in a log2 scale, in the range of −1.5 (blue, decreased) to 1.5 (red, increased). (B) qPCR analysis showed decrease of Pfk and Ldha mRNA levels in siMpi MEFs compared to NC. The Ct values were normalized relative to the expression of Rps28 gene. Relative fold change was calculated as delta Ct in siMpi compared to NC. (C) 2-Deoxyglucose uptake measurement demonstrated a decrease in siMpi MEFs compared to the NC. Normalized relative % change is shown. (D) Measurement of lactate levels in MEFs following siMpi-mediated depletion of Mpi was assessed by lactate assay and showed a significant reduction of lactate in siMpi cells. Results were normalized to MTT assay. Relative amounts of lactate are shown (% of NC). (E) Measurement of lactate levels in 4 dpf zebrafish embryos from mpimss7/+ MT incrosses showed a decrease in lactate production compared to the offspring of the mpi+/+ incrosses. Results were normalized to number of embryos. (F) Measurement of lactate levels in 4 dpf zebrafish embryos injected with std MO or mpi MO showed significant decrease in lactate production in mpi MO-injected embryos compared to std MO injected WT embryos, but no decrease when injected in to p53 MT embryos. Results were normalized to number of embryos. Two-tailed Student's t-test was applied in panels B-F.
-
Figure 5—source data 1
Changes in expression of the genes involved in glycolysis.
Partial dataset of RNA-seq analysis performed in 24 hpf zebrafish embryos injected with std or mpi MO. Log2 fold change (FC) values relative to WT + std MO. The list of showing the changes in expression of the genes involved in glycolysis.
- https://doi.org/10.7554/eLife.22477.015
Figure 5—figure supplement 1
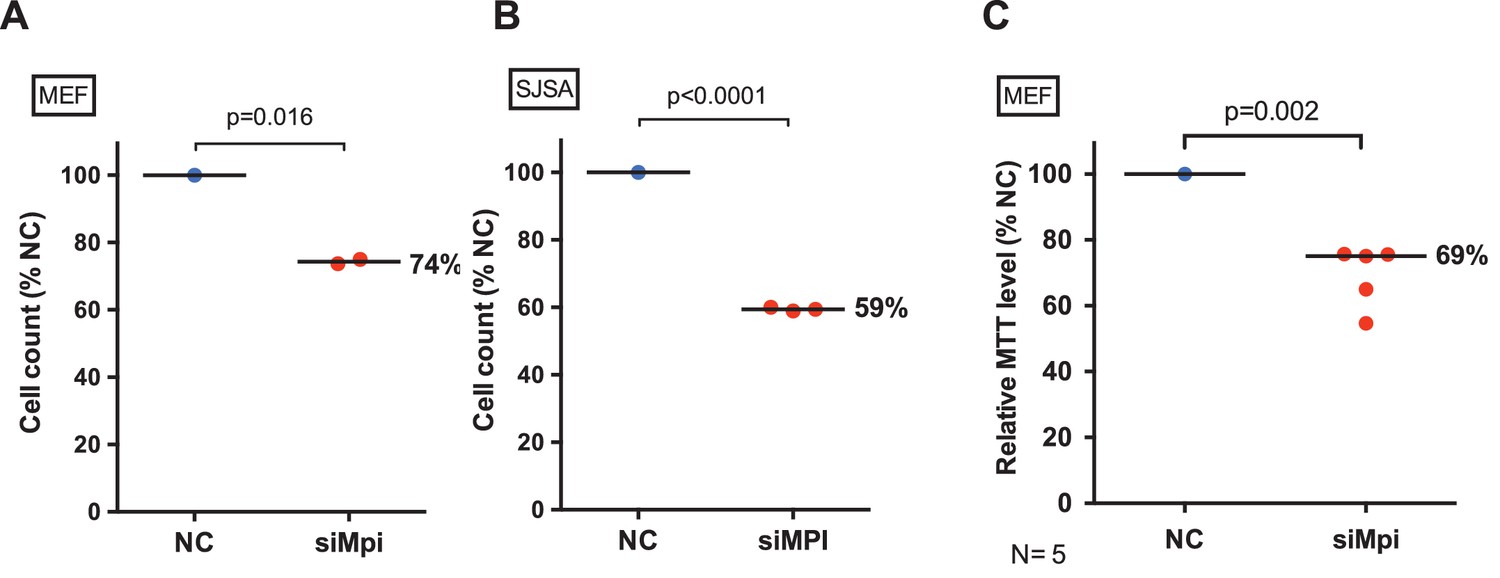
Loss of MPI leads to decrease cell viability in embryonic and cancer cells.
Cell quantification in MEFs (A) and SJSA cells (B) with and without siMPI transfection. (C) Cell proliferation in siMpi MEFs was assessed by MTT assay. Relative amounts of mitochondrial activity are shown (% of NC). p-Value using two-tailed paired Student’s t-test.
Figure 5—figure supplement 2
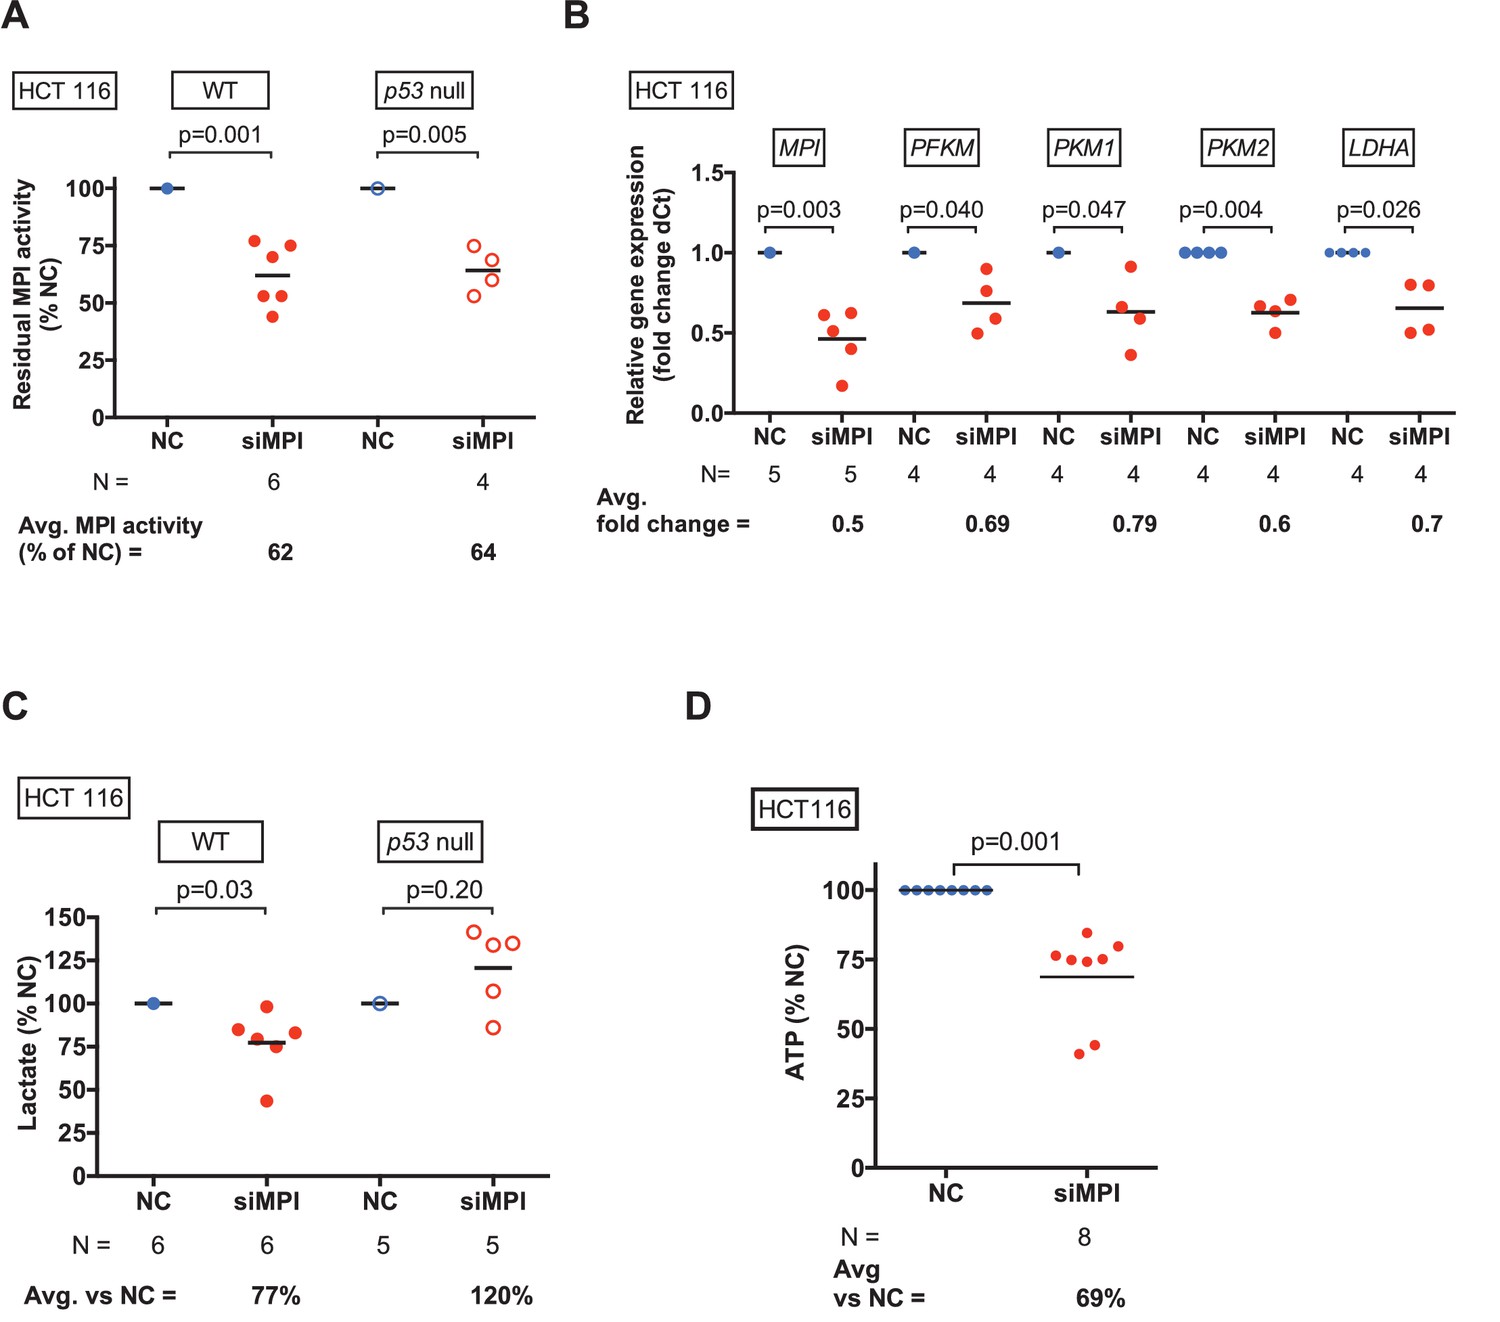
Loss of MPI leads to inhibition of glycolysis in HCT116 cancer cells.
(A) MPI activity after MPI knockdown with siMPI in HCT116 WT and p53 null colon cancer cells compared to those transfected with control siRNA (NC). (B) qPCR demonstrated downregulation of glycolytic genes in HCT116 cells transfected with siMPI compared to NC. The Ct values were normalized to expression of Rps18 gene. Relative fold change was calculated as delta Ct in siMPI compared to NC. (C) Lactate levels measured in WT and p53 null HCT116 cells transfected with siMPI compared to NC. (D) ATP levels measured in HCT116 cells transfected with siMPI or NC showed decreased ATP following MPI silencing in siMPI compared to NC. All p-values calculated using paired two-tailed Student’s t-test.
Figure 6

Loss of MPI stabilizes p53 through activation of the hexosamine biosynthetic pathway.
(A) Measurement of Fru6P levels showed accumulation of Fru6P in siMPI MEFs compared to NC control. Values shown are normalized to total protein. p-Value based on paired ratio two-tailed Student’s t-test. (B) Representative phenotypes of 4 dpf zebrafish larvae following injections of std MO or mpi MO and treated with 20 μM of HBP inhibitor (DON) are shown. Enlarged (left) and group (right) images are shown. (C) Distribution of the morphological phenotypes was quantified in 4 dpf mpi morphants and std MO control injected embryos treated with or without DON. Morphological rescue was observed, as an increase in embryos with normal morphology in the presence of the inhibitor, compared to mpi morphants. Two-tailed Fisher’s exact test with the Bonferroni correction for multiple comparisons, with alpha = 0.017. (D) Mpi activity assay of 4 dpf zebrafish larvae injected with std MO or mpi MO and treated with 20 μM of DON showed that Mpi activity was not significantly affected by DON treatment. Two-tailed Student's t-test was applied with Bonferroni correction for multiple comparisons, with alpha = 0.0125. (E) Representative western blot for p53 protein in 4 dpf zebrafish larvae injected with std MO or mpi MO and treated with 20 μM DON showed a decreased p53 expression in mpi morphants treated with DON, compared to non-treated. DON treatment did not induce increase in p53 in std MO. Representative western blot for three independent clutches. (F) Western blot showing levels of Gfpt1 and p53 in 4 dpf zebrafish embryos injected with either std, mpi, gfpt1, or mpi MO + gfpt1 MO. Quantified relative to tubulin loading control, and compared to std MO. Representative western blot for four independent clutches.
Figure 7
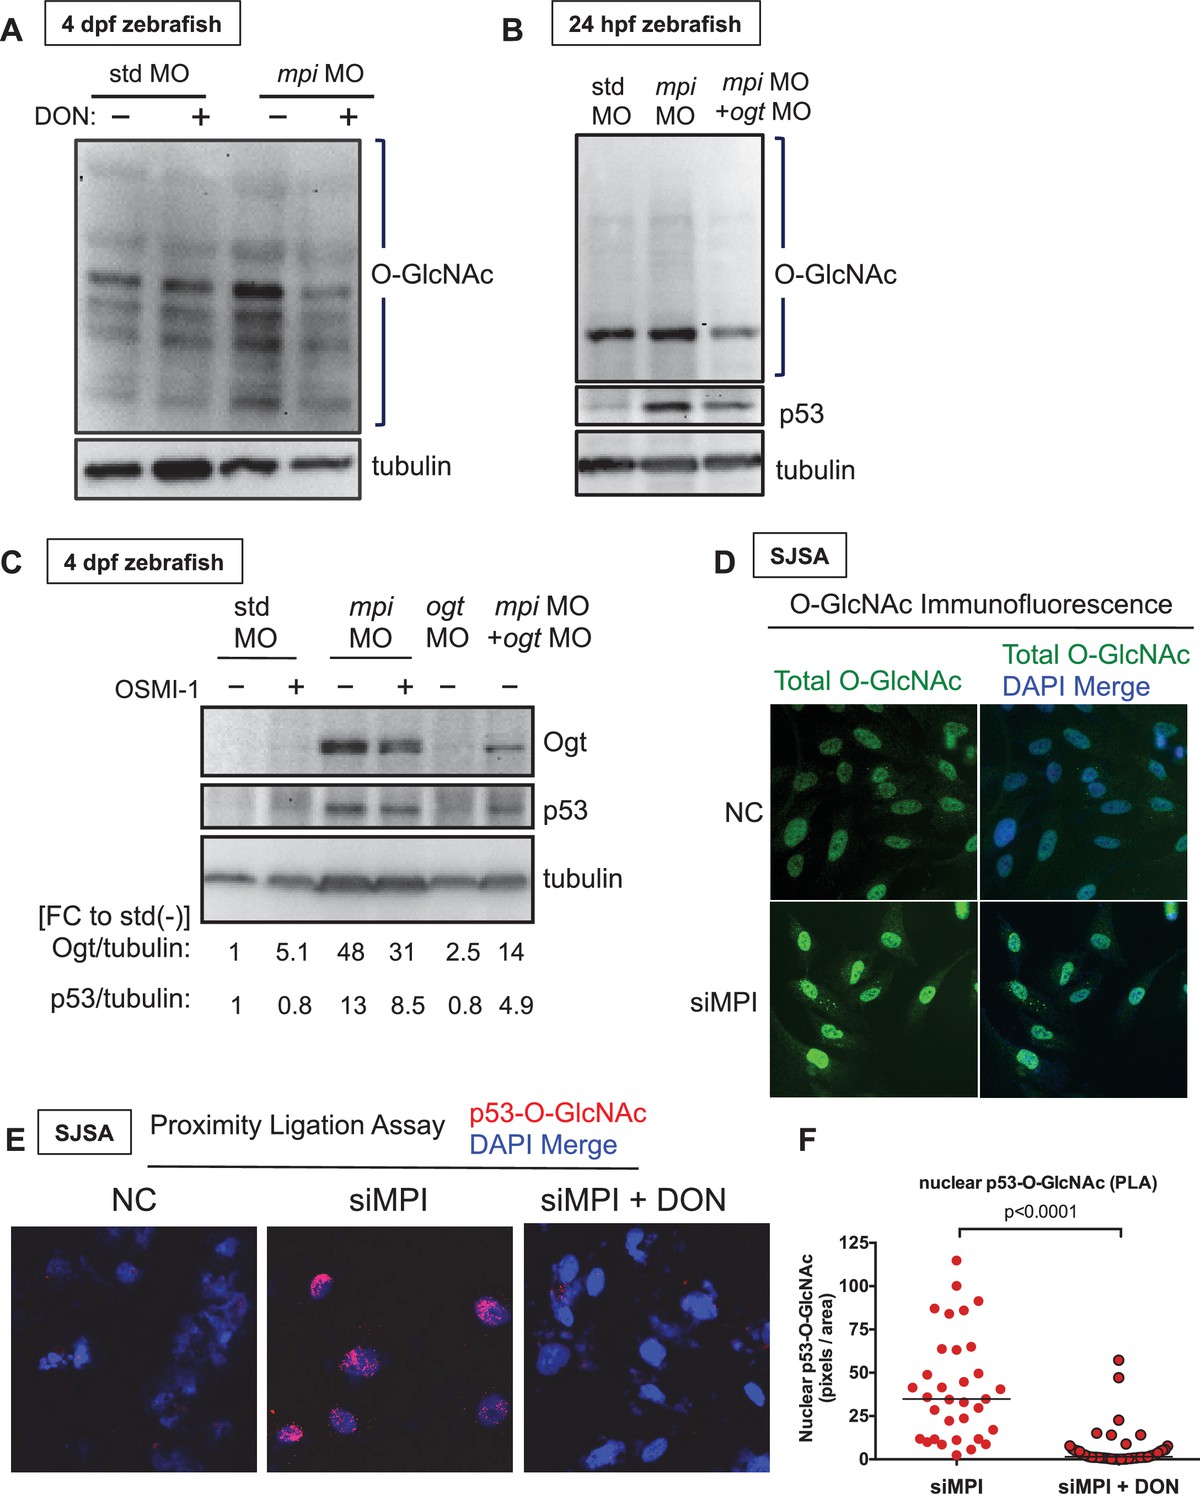
MPI depletion increases p53 O-GlcNAcylation.
(A–B) Western blots of O-GlcNAc levels in std and mpi MO-injected zebrafish with either DMSO, 20 uM DON treatment, or ogt MO co-injection. Tubulin as loading control. (C) Western blot of Ogt and p53 levels in std, mpi and ogt MO with and without 50 uM OSMI-1 treatment. Tubulin used as loading control. Quantification of pixels performed using ImageJ is shown below blots. (D) Images of conventional immunofluorescence staining in SJSA cells following MPI knockdown showed that in siMPI cells there was a increase in total protein. (E–F) PLA showing increased O-GlcNAcylation of p53 with MPI knockdown that is diminished with DON treatment as compared to NC. 20x magnification was used from imaging using Zeiss inverted microscope Axiovert 1A. Image shown is representative of two independent experiments. Quantification using ImageJ software.
Author response image 1
Author response image 2
Author response image 3

Additional files
-
Supplementary file 1
Sequences of the qPCR primers and dsiRNA, shRNA duplexes.
- https://doi.org/10.7554/eLife.22477.020
Download links
A two-part list of links to download the article, or parts of the article, in various formats.
Downloads (link to download the article as PDF)
Open citations (links to open the citations from this article in various online reference manager services)
Cite this article (links to download the citations from this article in formats compatible with various reference manager tools)
MPI depletion enhances O-GlcNAcylation of p53 and suppresses the Warburg effect
eLife 6:e22477.
https://doi.org/10.7554/eLife.22477


