Localised dynactin protects growing microtubules to deliver oskar mRNA to the posterior cortex of the Drosophila oocyte
- University of Cambridge, United Kingdom
- Medical Research Council, Laboratory of Molecular Biology, United Kingdom
- University of Cambridge, Centre for Mathematical Sciences, United Kingdom
Figures
Figure 1
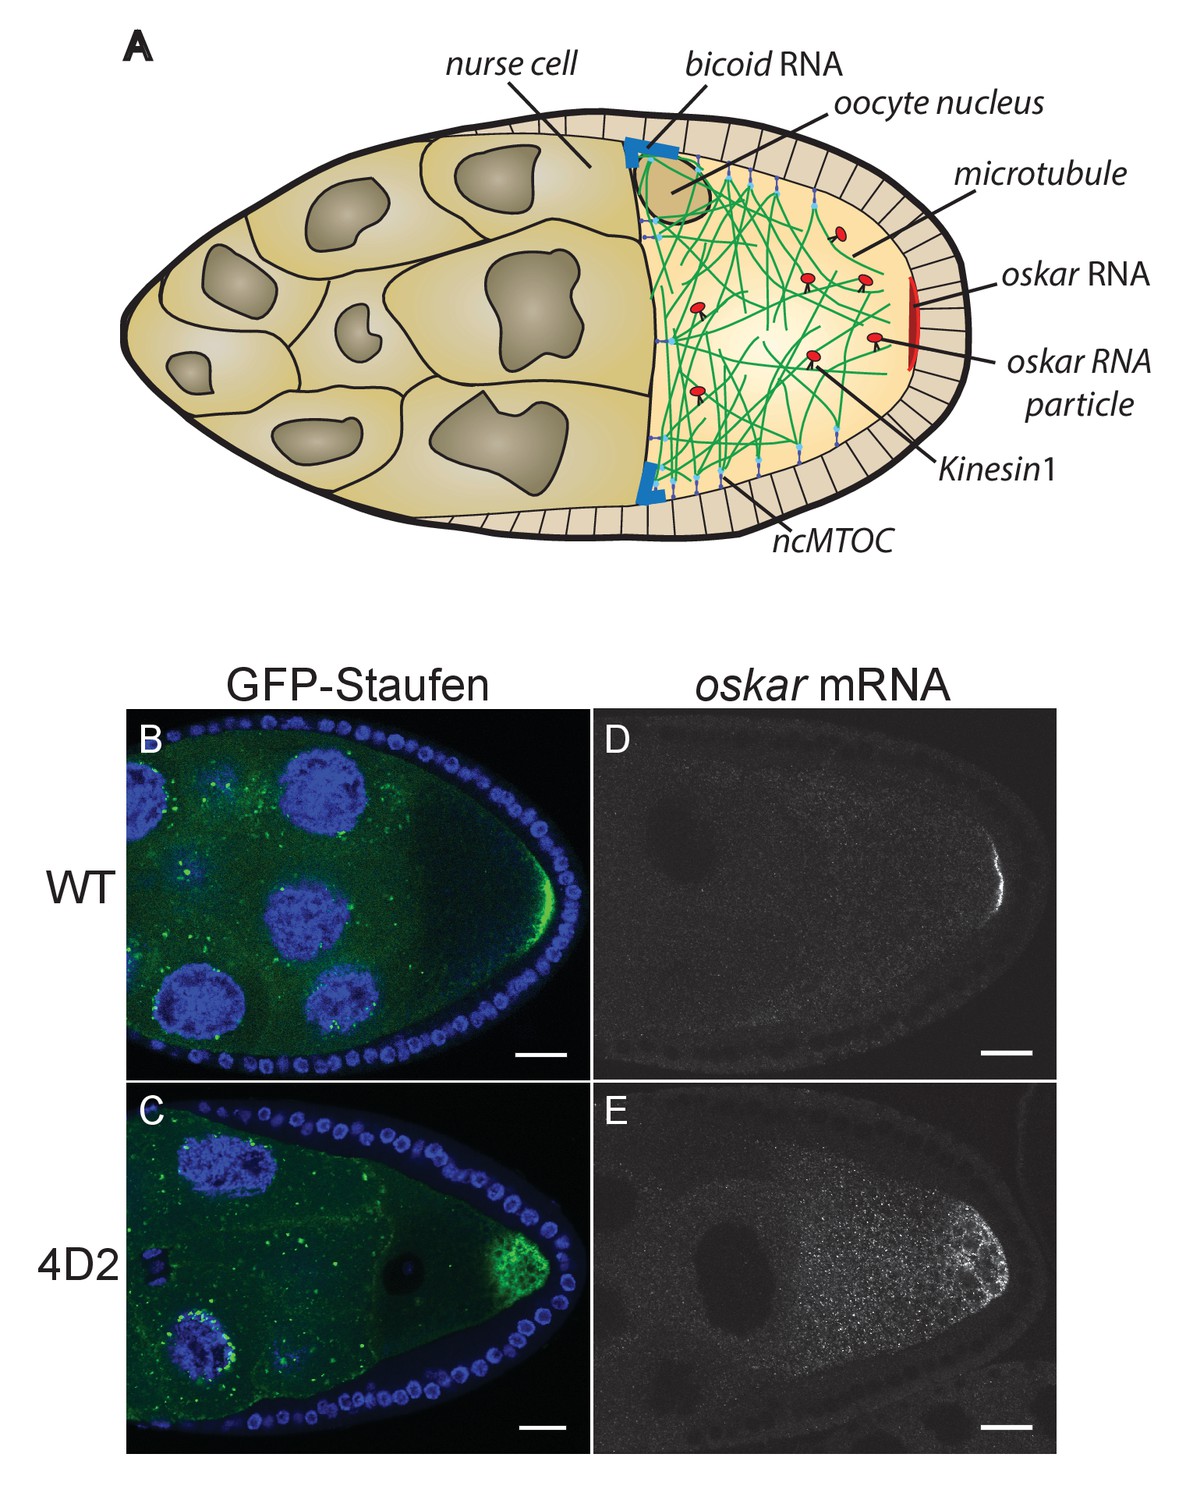
The 4D2 mutation disrupts the localisation of oskar mRNA at the oocyte posterior.
(A) A schematic diagram of a stage 9 Drosophila egg chamber showing oskar mRNA transport. (B–C) Confocal images of stage 9 egg chambers from a wild-type ovary (B) and from a 4D2 homozygous germline clone (C) expressing GFP-Staufen (green) and counterstained with DAPI (blue) to label the nuclei. 31/31 4D2 mutant oocytes showed the same phenotype. (D–E) Confocal images of fluorescent in situ hybridisations (FISH) to endogenous oskar mRNA in a wild-type egg chamber (D) and an egg chamber with a 4D2 homozygous germline clone (E). 10/10 4D2 mutant oocytes showed the same phenotype. Scale bar 20 μm.
Figure 2
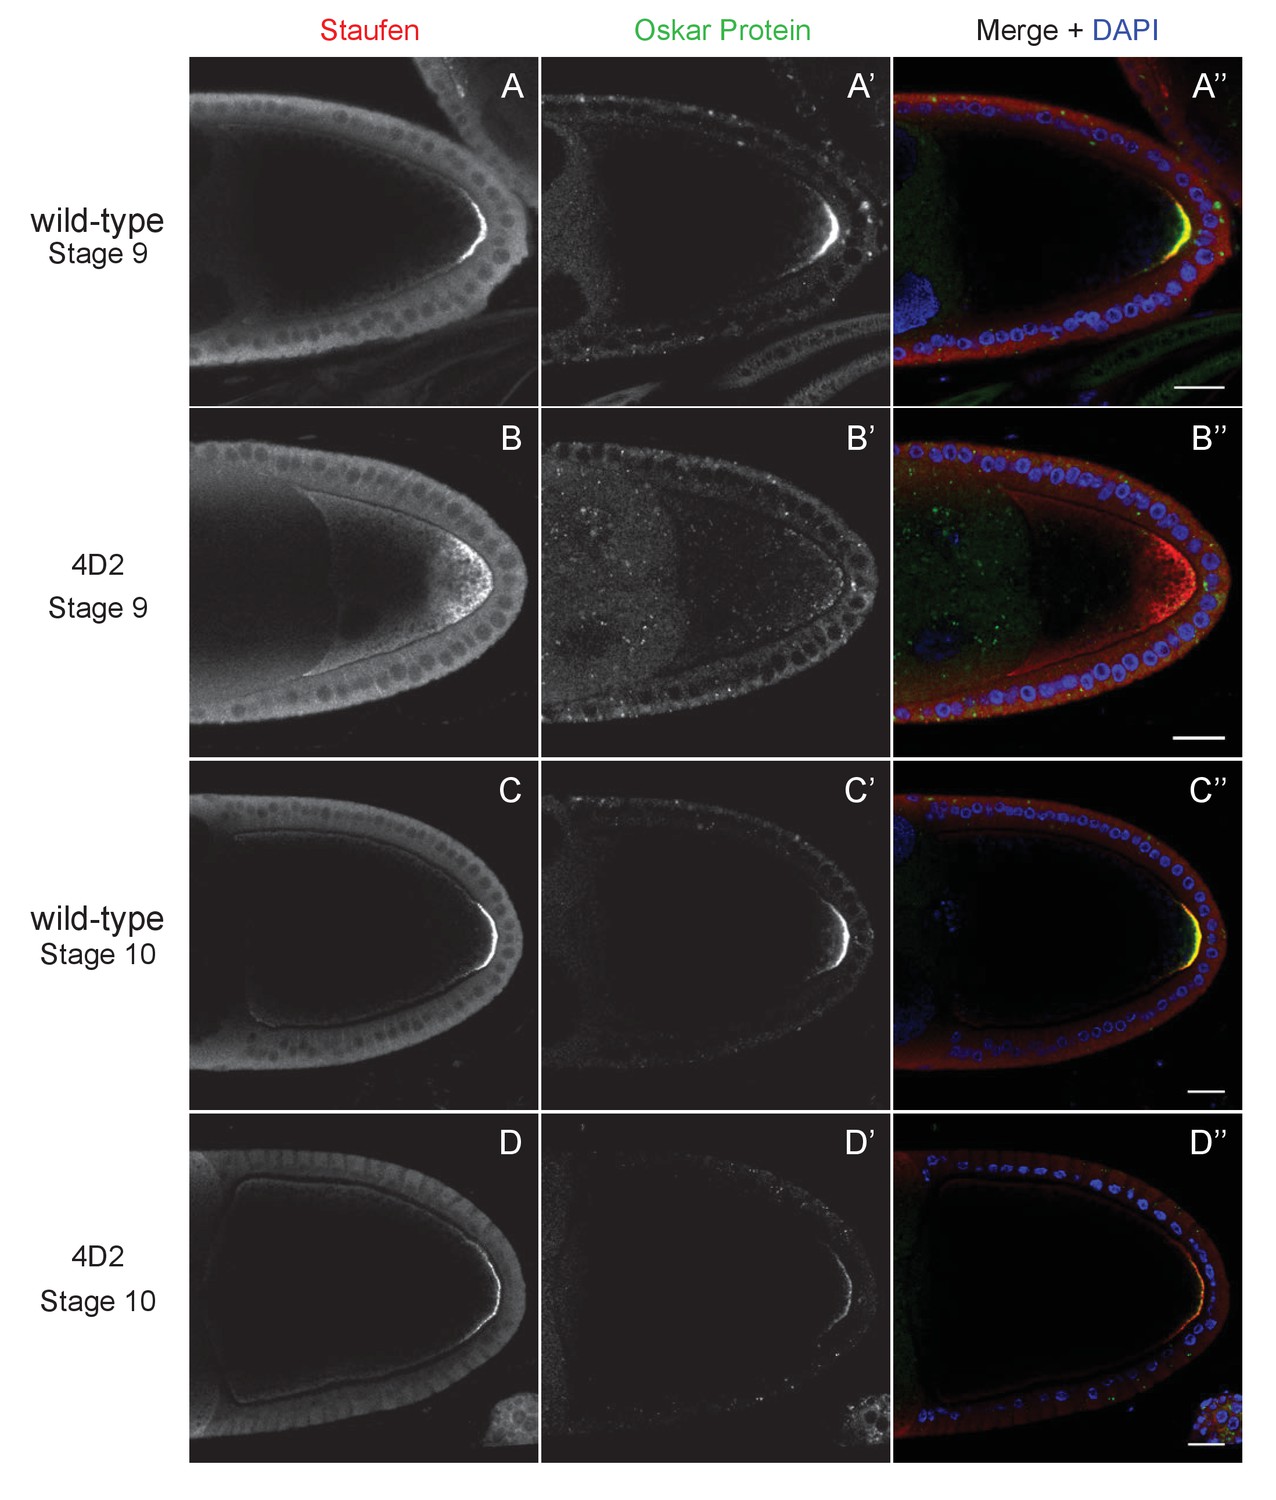
The 4D2 mutation does not affect the anchoring of Staufen and oskar at the posterior cortex.
(A–D) Confocal images of stage 9 (A and B) and stage 10b egg chambers (C and D) from wild-type (A and C) and 4D2 germline clone ovaries (B and D) stained for Staufen (A–D) and Oskar (A’–D’) proteins. The merged images (A”–D”) show Staufen in red, Oskar in green and DNA in blue (DAPI staining). Although Staufen/oskar mRNA complexes are diffusely localised in the posterior cytoplasm, Oskar protein is only made at the posterior cortex. Staufen and Oskar proteins remain anchored at the posterior cortex later in oogenesis. 18/18 stage 9 and 21/21 stage 10 4D2 mutant egg chambers showed the same Staufen and Oskar localisation phenotype. Scale bar 20 μm.
Figure 3 with 2 supplements
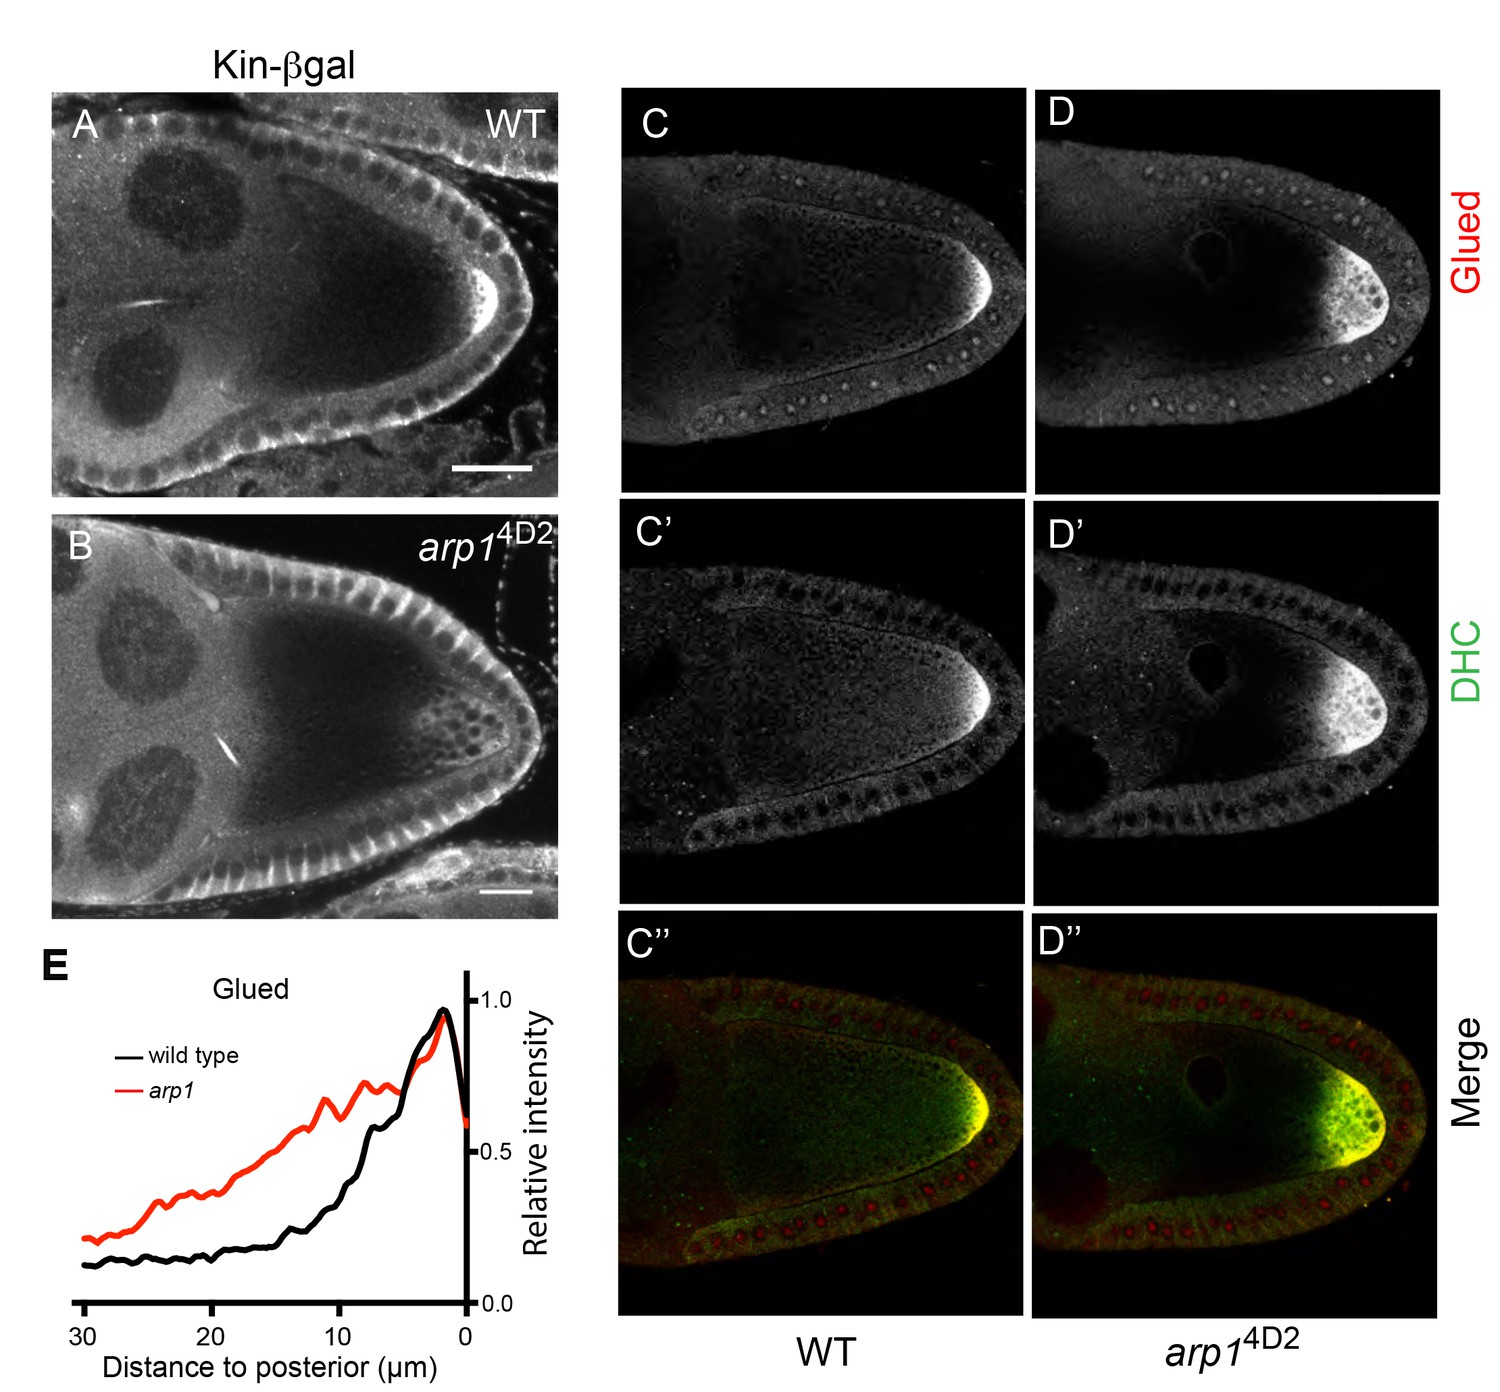
arp14D2 affects the delivery of p150Glued, the dynein heavy chain and kinesin-βgal to the posterior.
(A–B) Wild-type (A) and arp14D2 mutant (B) stage 9 egg chambers stained for kinesin-βgal. (C–D) Wild-type (C–C’’) and arp14D2 (D–D’’) mutant stage 9 egg chambers stained for p150Glued (C–D) and the dynein heavy chain (C’–D’) The merged image (C”–D”) shows the co-localisation of p150Glued (red) and the dynein heavy chain (green). All arp14D2 mutant oocytes showed the same phenotype (11/11, kinesin-βgal; 19/19, dynein and 16/16, Glued) (E) Average fluorescence intensity profiles in wild type (n = 13) and arp14D2 mutant (n = 16) egg chambers stained for p150Glued. p150Glued accumulates in a region extending 15 μm from the posterior cortex in wild type oocytes, but spreads up to 30 μm away from the posterior cortex in arp14D2 mutant oocytes (p<0.0001 by Wilcoxon Rank Sum Test). Scale bar 20 μm.
Figure 3—figure supplement 1
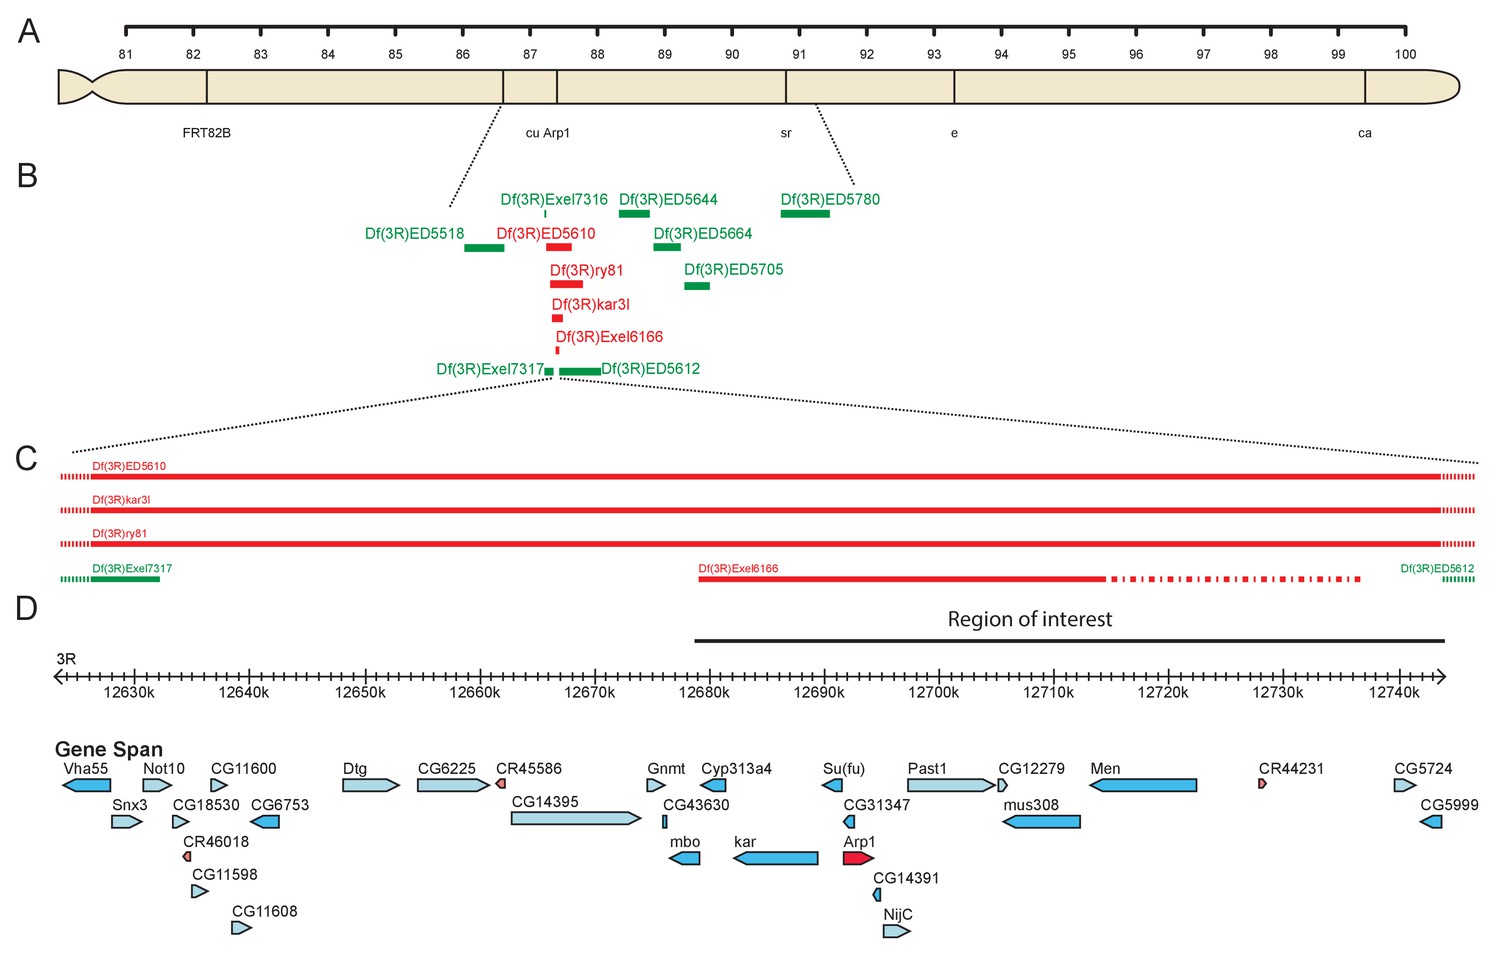
Mapping 4D2 to the Arp1 region.
(A) Diagram of the right arm of chromosome 3 showing the visible markers used for recombination mapping (cu sr e ca) and the position of the Arp1 locus. (B) Diagram showing the extent of the deletions used to map the 4D2 mutation. Deficiencies shown in green complement the lethality of the 4D2 chromosome, whereas those shown in red do not. (C–D) Magnified view of the region of the genome defined by deficiency mapping of the 4D2 mutation. The lethality of 4D2 in trans to Df(3R)Exel6166, but not Df(3R)ED5612 places the mutation in a 66 kb genomic interval (D) containing 15 genes.
Figure 3—figure supplement 2
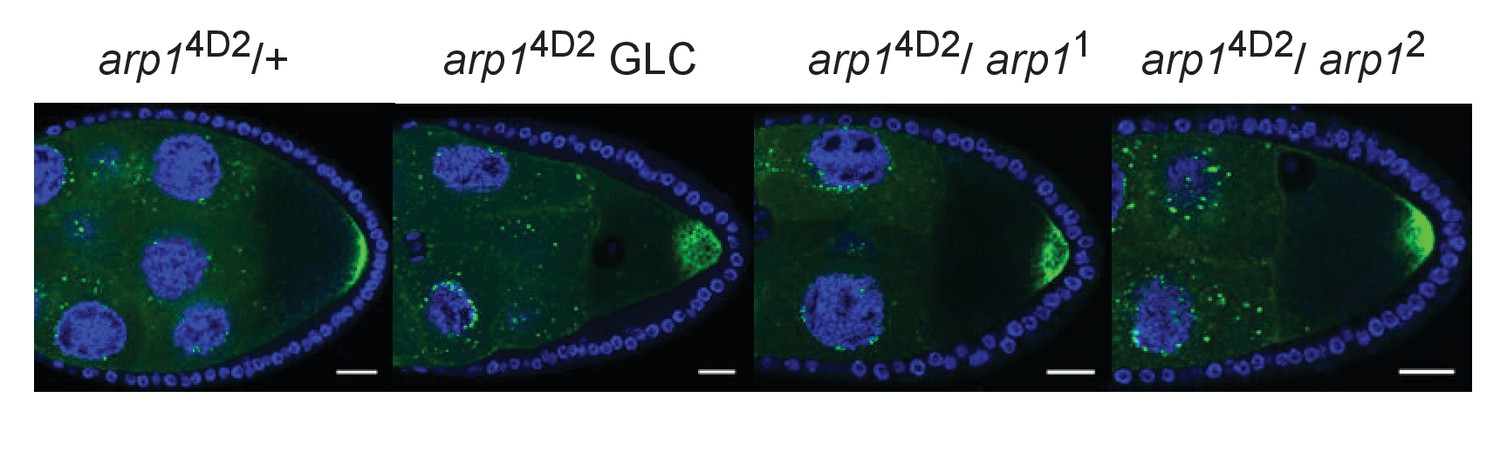
Transheterozygous combinations of arp1 alleles disrupt the localisation of GFP-Staufen to the posterior cortex.
(A–D) Confocal images of GFP-Staufen (green) and DNA (DAPI; blue) in arp14D2/+ (A), an arp14D2 germ line clone (B), arp14D2/ arp11 (C) and arp14D2/ arp12 (D) stage 9 egg chambers. Scale bar 20 μm.
Figure 4
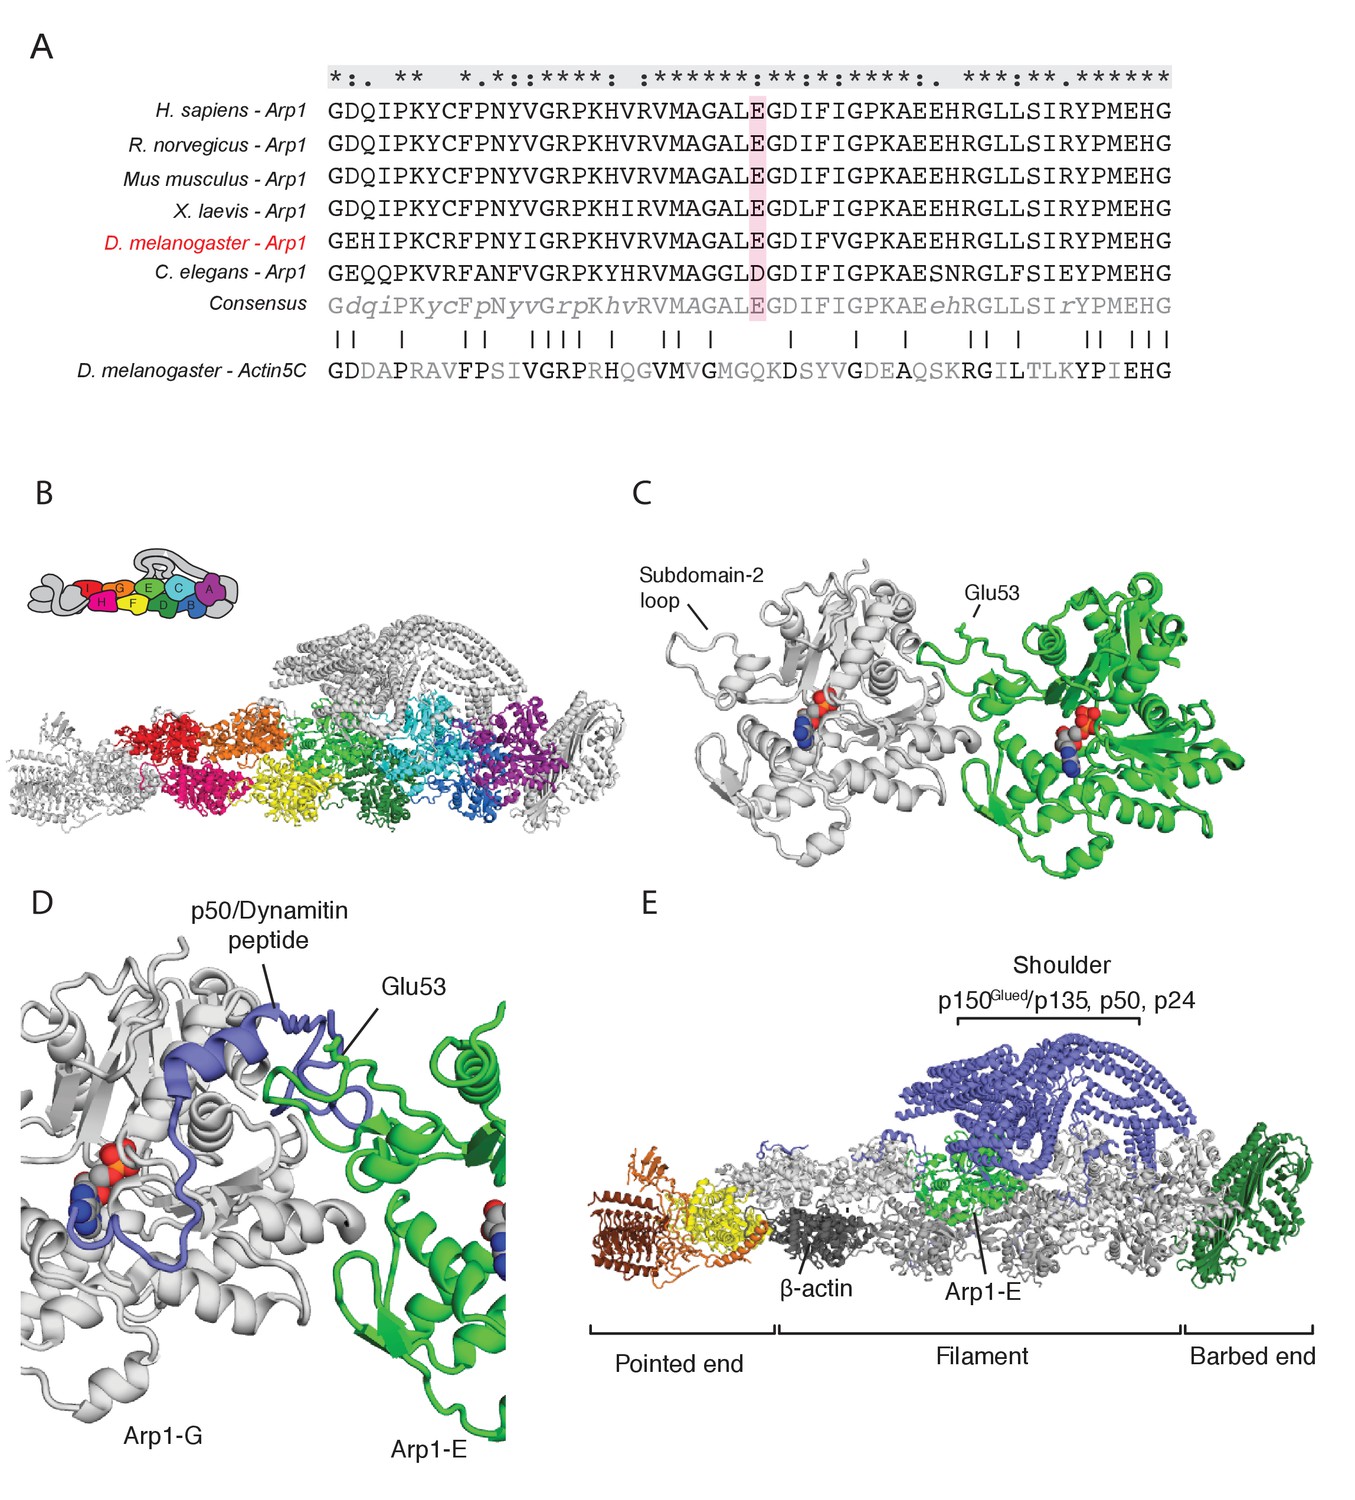
The arp14D2 mutation is predicted to disrupt the interaction between the Arp1 rod and the p150Glued/dynamitin/p24 shoulder domain in the Dynactin complex.
(A) A ClustalX alignment of part of subdomain 2 (amino acids 26–78) in the Arp1 orthologues from different animal species and Drosophila Actin 5C. The orthologues shown are Homo sapiens (human), Rattus norwegicus (rat), Canis familiaris (dog), Xenopus leavis (African clawed toad), Drosophila melanogaster and Caenorhabditis elegans. The pink shading marks the conserved glutamate 53, which is mutated to lysine in the arp14D2 mutant. (B) The structure of dynactin, as determined by Cryo-EM. Eight Arp1 subunits (A, B, C, D, E, F, G, and I) and one actin molecule (H) assemble into two protofilaments that form the rod along the backbone of dynactin. The positions of each subunit are labelled in the drawing at the top and are shown in the same colour in the structure below. (C) A high resolution view of the interface between two Arp1 subunits, showing that E53 does not contribute to the interaction interface, but protrudes laterally. (D) A high resolution view of the interface between Arp1-E subunit and one of the extended peptide domains of p50 dynamitin that anchors the shoulder domain to the Arp1 rod. Glutamate 53 lies at this interface and its substitution by lysine is predicted to disrupt this interaction. (E) A view of the entire dynactin structure showing the positions of Arp1-E (light green) and the p150Glued shoulder domain (blue).
Figure 5
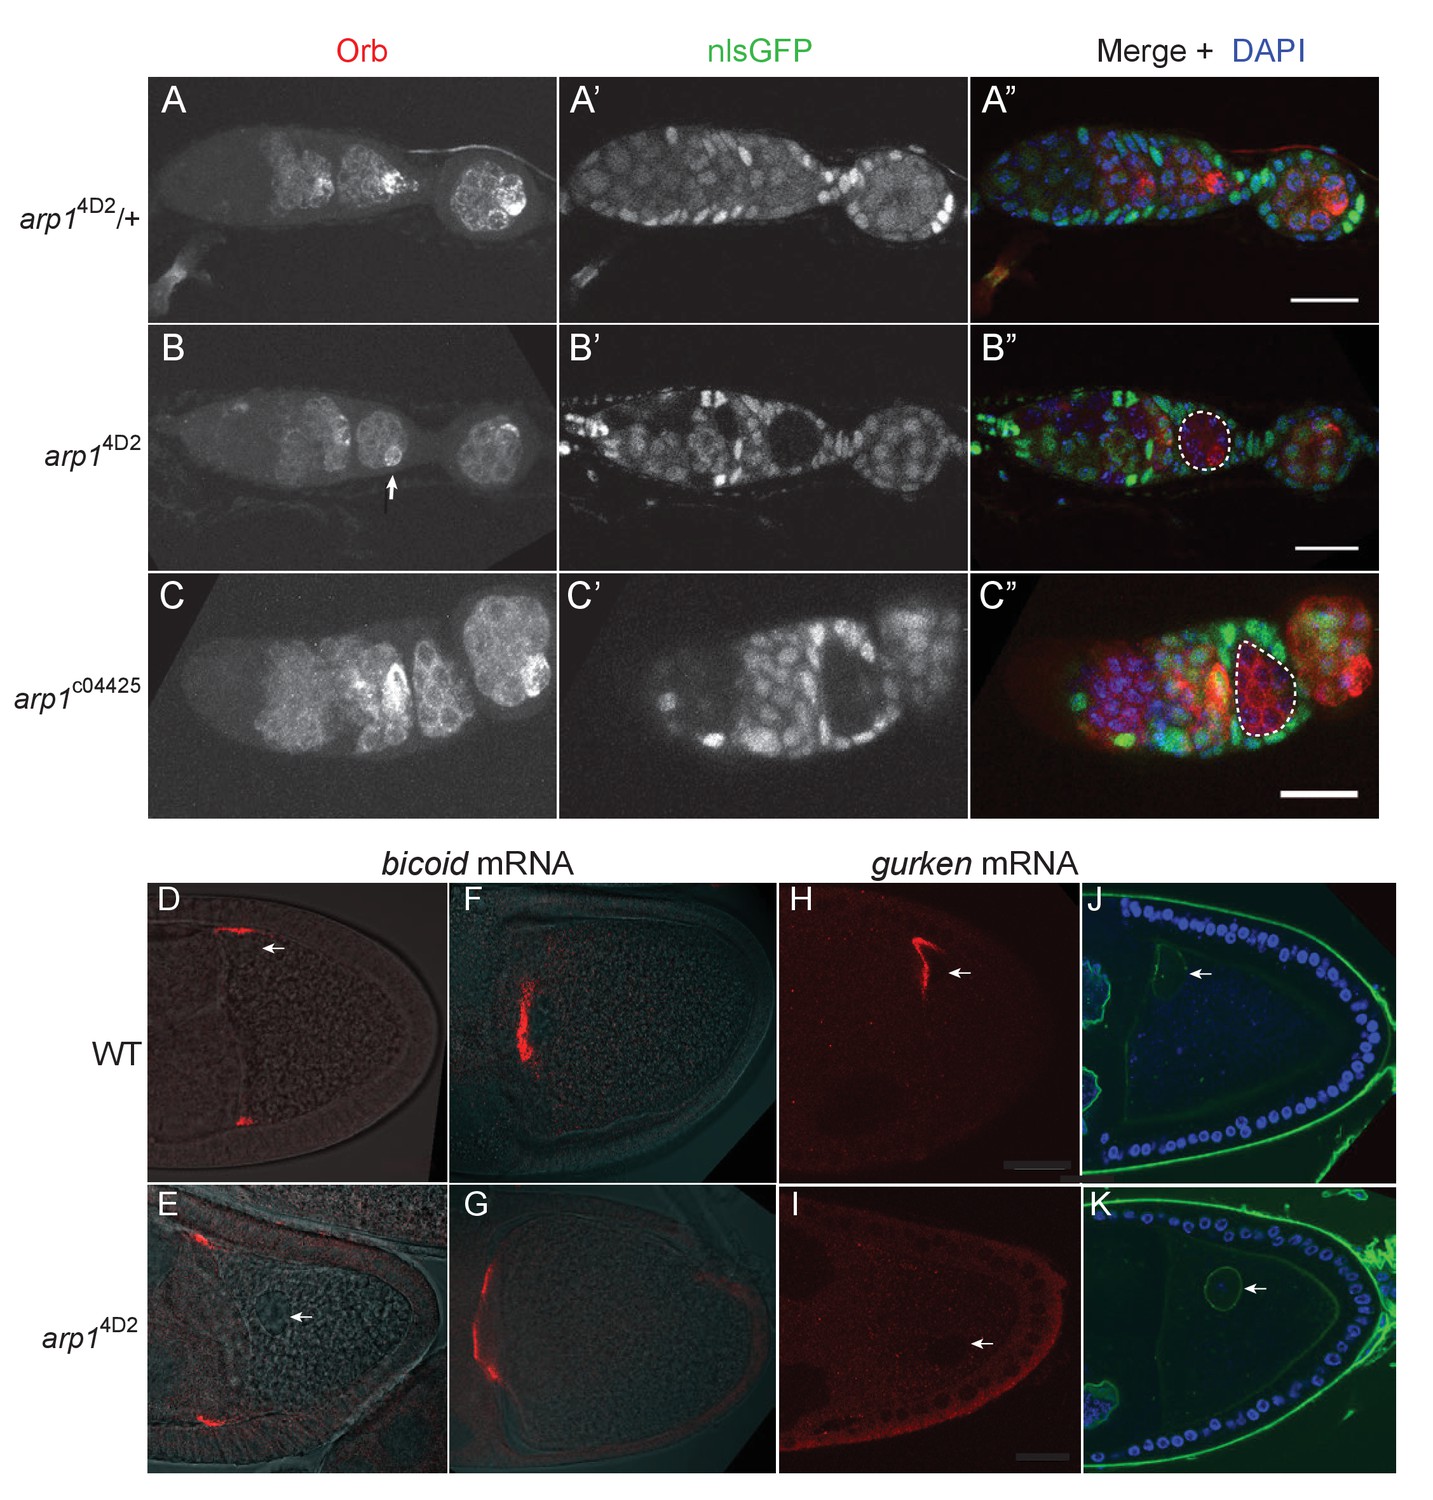
The arp14D2 allele does not disrupt oocyte determination, mRNA transport from the nurse cells to the oocyte or bicoid mRNA localisation.
(A–A”) A confocal image of a germarium from an arp14D2/+heterozygote stained for the oocyte marker Orb (white in A; red in A’) and expressing nls-GFP (white in A’; green in A’). (B–B”) A confocal image of a germarium containing arp14D2 homozygous germline cysts marked by the loss of nls-GFP (B’). The oocyte has been specified normally in the arp14D2 mutant germline cyst in region 3 (indicated by the white dashed circle in B’), as shown by the strong enrichment of Orb in one cell (white arrow in B). (C–C”) A confocal image of a germarium containing germline clones of the null mutation, arp1c04425. Loss of Arp1 prevents oocyte specification, as shown by the uniform distribution of Orb in the homozygous mutant cyst in region 2b (indicated by the white dashed circle in C’). Scale bar 20 μm. (D–E) Confocal images showing the localisation of bicoid mRNA at stage 9 in a wild-type egg chamber (D) and an arp14D2 germline clone. The bicoid mRNA FISH signal (red) is superimposed on a greyscale DIC image of each egg chamber that shows the positions of the cells. bicoid mRNA localises normally to the anterior/lateral corners of the oocyte in the arp14D2 germline clone. White arrows point to the nucleus. 15/15 stage 9 egg chambers mutant for arp14D2 showed normal bicoid mRNA localisation. (F–G) Confocal images showing the localisation of bicoid mRNA at stage 10b in a wild-type egg chamber (F) and an arp14D2 germline clone (G). bicoid mRNA has relocalised to a disc in the centre of the anterior cortex in the arp14D2 germline clone as in wild-type. 11/11 stage 10 egg chambers mutant for arp14D2 showed normal bicoid mRNA localisation. (H–I) Confocal images showing the localisation of gurken mRNA (red; FISH) at stage 9 in a wild-type egg chamber (H) and an arp14D2 germline clone (I). gurken mRNA localises above the oocyte nucleus in the dorsal anterior corner of the oocyte in wild-type, but is not localised in the arp14D2 mutant, which also disrupts the anchoring of the nucleus (white arrow). 14/21 stage nine egg chambers mutant for arp14D2 showed similar gurken mRNA mislocalisation. (J–K) Confocal images of stage 9 wild-type (J) and arp14D2 germline clone (K) egg chambers in which the nuclear envelope is stained with wheat germ agglutinin (green) and DNA with DAPI (blue). The arp14D2 mutant disrupts the anchoring of the nucleus (white arrow) at the dorsal/anterior corner of the oocyte, and it is instead found at random positions within the oocyte cytoplasm. 30/44 stage 9 egg chambers and 53/56 stage 10 egg chambers mutant for arp14D2 showed similar nuclear mislocalisation.
Figure 6
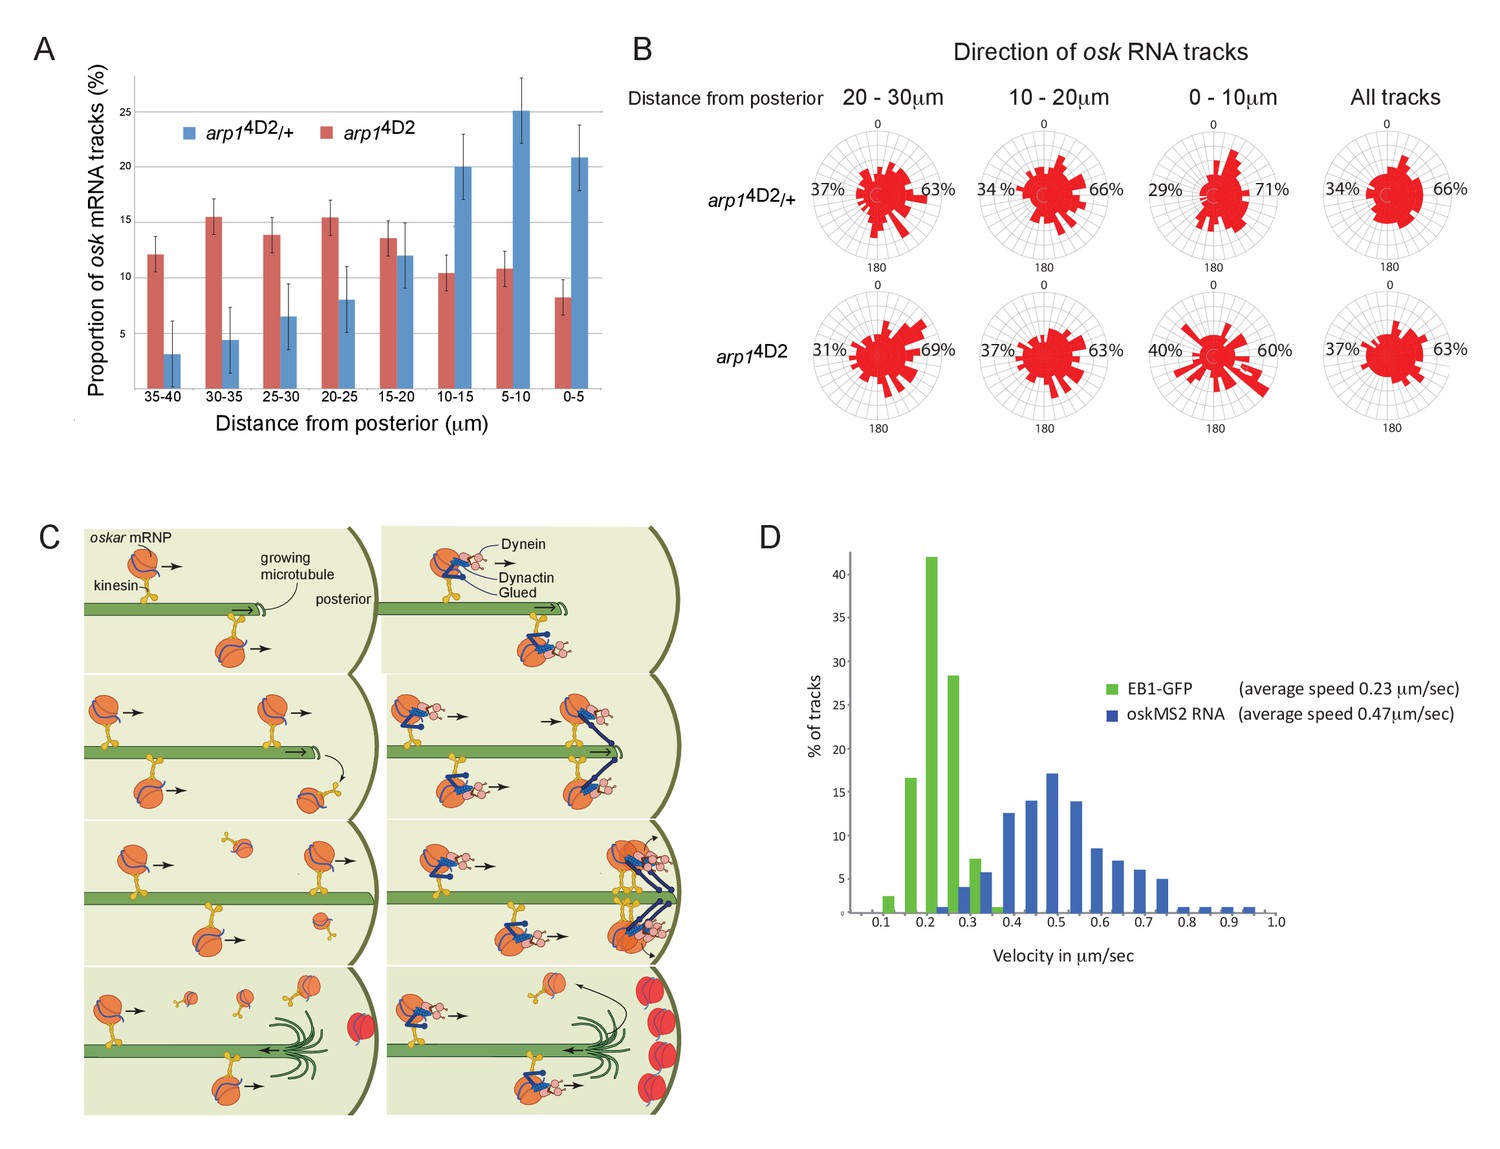
The arp14D2 mutation reduces the frequency and the directional bias of oskar mRNA movements near the posterior of the oocyte.
(A) A graph showing the relative frequency of oskar mRNA movements at different distances from the posterior pole in arp14D2/+ (n = 528 tracks) and arp14D2 mutant oocytes (n = 410). The posterior pole is set as 0 μm and the movements have been binned into 5 μm intervals. There is a strong reduction in the frequency of oskar mRNA movements near to the posterior pole in the arp14D2 mutant compared to wild-type (p<0.001 by the Wilcoxon rank-sum test). Error bars indicate the SD. (B) A circular histogram showing the frequency of oskar mRNA tracks in different directions measured in 10° intervals at the specified distances from the posterior pole. The posterior bias in the direction of oskar mRNA movement increases with proximity to the posterior (n = 1252 tracks), but decreases in the arp14D2 mutant (n = 889 tracks). (C) A diagram showing two models for oskar mRNA delivery to the posterior cortex. In the left model, oskar mRNA/kinesin 1 particles move along microtubules until they reach the plus end, where they fall off. oskar mRNA can therefore only be delivered to the posterior cortex if kinesin reaches the growing plus end of the microtubule at the same time that the microtubule reaches the cortex. In the right model, oskar mRNA/kinesin 1 particles that reach the end of the microtubule remain tethered to the growing plus end by dynactin, through the +TIP activity of p150Glued. oskar mRNPs therefore accumulate at the growing plus end until the microtubule reaches the posterior cortex, where they can be offloaded and anchored. (D) A histogram showing the velocity distributions of growing microtubule plus ends marked by EB1-GFP (green) and oskar mRNPs (blue). The absence of a significant sub-population of oskar mRNPs that move at the same speed as microtubule growth argues against the model in which the RNA tracks the growing microtubule ends.
-
Figure 6—source data 1
The number of oskar mRNA tracks at the specified distances from the posterior pole.
- https://doi.org/10.7554/eLife.27237.015
-
Figure 6—source data 2
Direction of oskar mRNA tracks at the specified distances from the posterior pole.
- https://doi.org/10.7554/eLife.27237.016
Figure 7 with 1 supplement
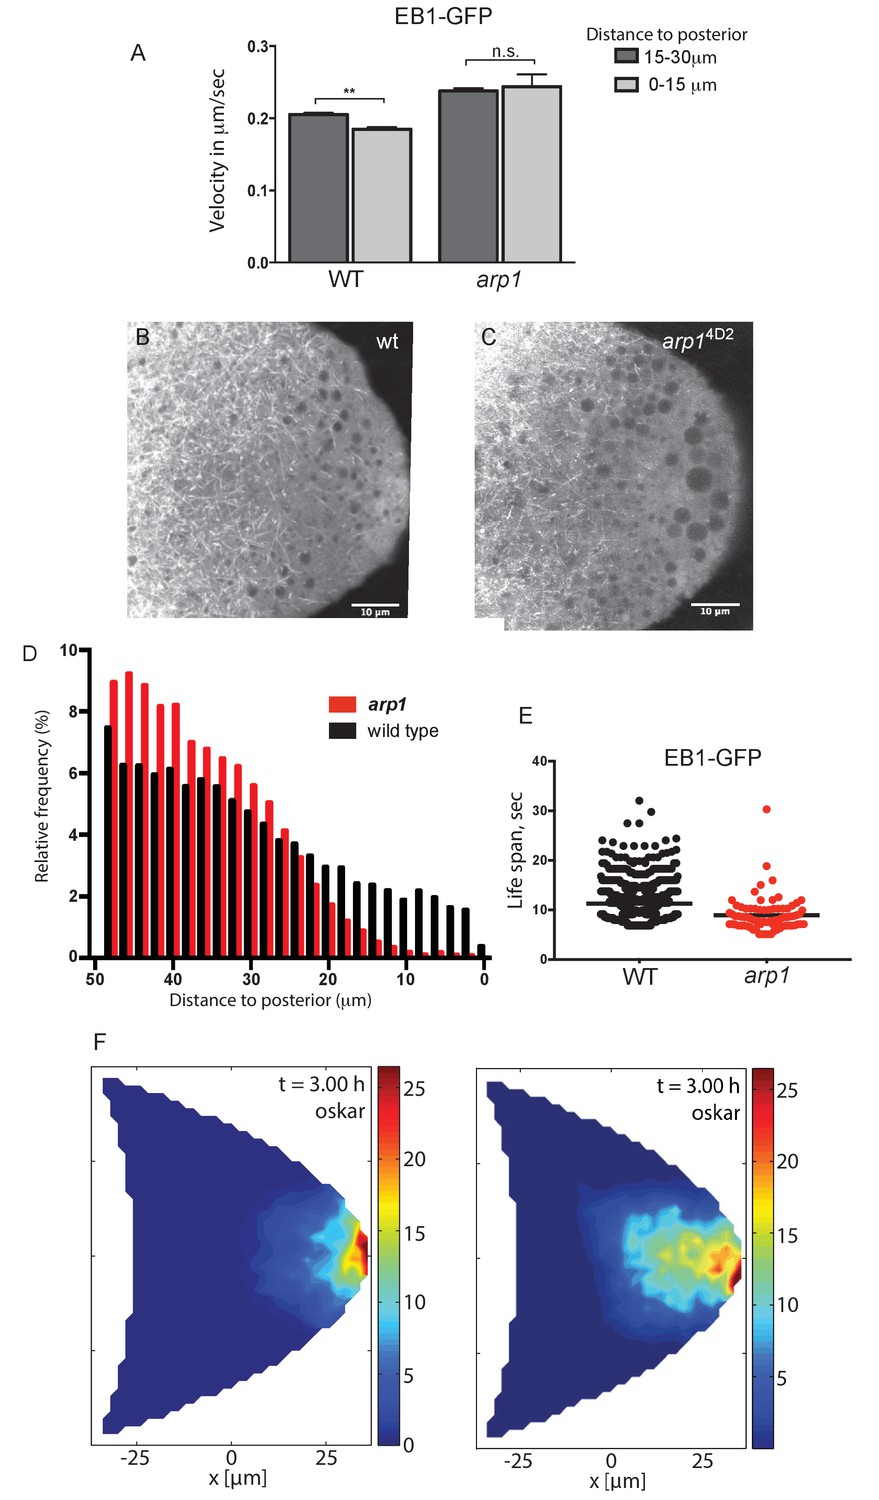
Dynactin is required for microtubule growth to the posterior cortex.
(A) A histogram showing the average velocities (µm/sec) of EB1 comets on growing microtubule plus ends in the centre of the oocyte (15–30 µm from the posterior) and near the posterior cortex (0–15 µm from the cortex) in wild-type (arp14D2/+) and arp14D2 homozygous oocytes. arp14D2/+: 3732 comets in the 15–30 µm region and 2068 comets in 0–15 µm region; arp14D2 homozygotes: 2815 comets in the 15–30 µm region and 221 comets in the 0–15 µm region. The plus ends slow down as they approach the posterior cortex in wild-type (p=0.007 by the paired t test), but fail to slow down in arp14D2, suggesting that the dynactin complex normally restricts the rate of microtubule growth in the posterior cytoplasm. Error bars indicate the SEM. (B–C) EB1 comet tracks in wild-type (B) and arp14D2 homozygous (C) oocytes. The images are merges of 40 frames from time-lapse movies taken at 1.7 s per frame. The tracks therefore represent the growth of microtubule plus ends over 68 s. (D) A histogram showing the relative frequency of EB1 comets at different distances from the posterior cortex in wild-type (black; arp14D2/+) and arp14D2 homozygous (red) oocytes. Very few microtubules extend within 10 μm of the posterior cortex in the arp14D2 mutant (n = 14440 for WT, n = 13062 for arp14D2, p<0.001 by the Wilcoxon rank-sum test). (E) A plot showing the lifespan of growing microtubule plus ends labelled by EB1-GFP near the posterior cortex (0–15 μm from the posterior) in wild type (n = 2058, mean = 11.29, SEM = 0.14) and arp14D2 homozygous oocytes (n = 211, mean = 8.94, SEM = 0.39). p<0.0001 by the unpaired t test. (F) Computer simulations of oskar mRNA transport with diffusion, motor-transport and cytoplasmic flows, showing the distribution of total cargo after three hours in cross section. The left hand panel (reproduced from Figure 3F of Khuc Trong et al. (2015) is a simulation in which the mean target length of the microtubules (ε) is set to 0.5 x the anterior-posterior length of the oocyte. The right panel shows an identical simulation in which the mean target length of the microtubules is reduced to 0.35. The shortening of the microtubules changes the simulated distribution of oskar mRNA from a tight posterior crescent to a more diffuse posterior cloud.
-
Figure 7—source data 1
Velocities of EB1-GFP comets at the specified distances from the posterior pole.
- https://doi.org/10.7554/eLife.27237.019
-
Figure 7—source data 2
Distances of EB1-GFP tracks from the posterior cortex.
- https://doi.org/10.7554/eLife.27237.020
-
Figure 7—source data 3
Lifespan of EB1-GFP comets near the posterior cortex.
- https://doi.org/10.7554/eLife.27237.021
Figure 7—figure supplement 1
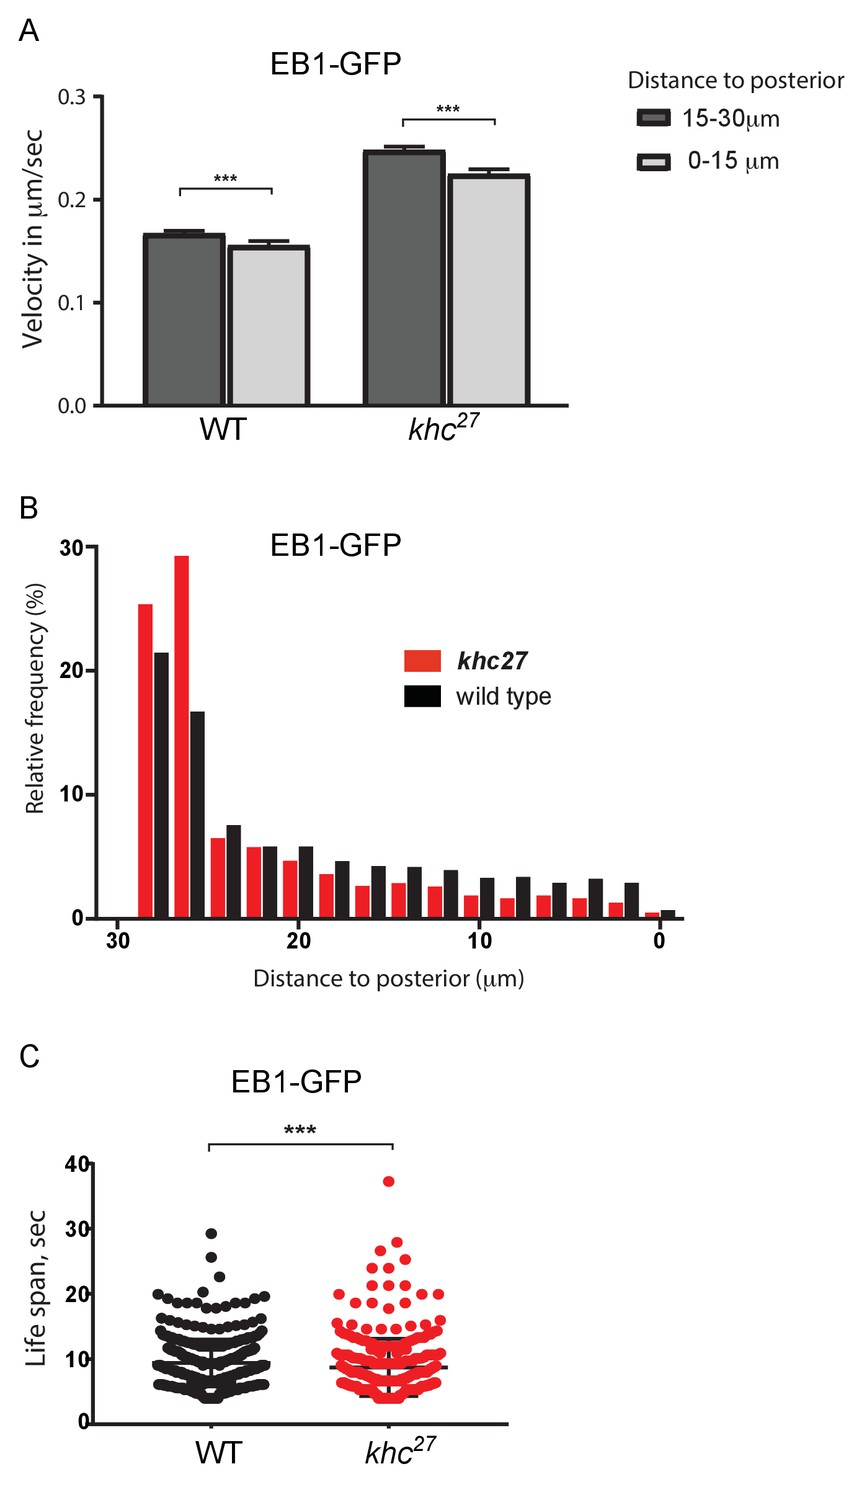
Kinesin 1 is required for microtubule growth to the posterior cortex.
(A) A histogram showing the average velocities (µm/sec) of EB1 comets on growing microtubule plus ends in the centre of the oocyte (15–30 µm from the posterior) and near the posterior cortex (0–15 µm from the cortex) in wild-type (khc27/+) and khc27 homozygous oocytes. khc27/+: 2401 comets in the 15–30 µm region and 1067 comets in 0–15 µm region; khc27 homozygotes: 2960 comets in the 15–30 µm region and 996 comets in the 0–15 µm region. Error bars indicate the SEM. (B) A histogram showing the relative frequency of EB1 comets at different distances from the posterior cortex in wild-type (black; khc27/+) and khc27 homozygous (red) oocytes. Significantly fewer microtubules extend within 20 μm of the posterior cortex in the khc27 mutant (n = 5078 for WT, n = 4409 for khc27, p<0.0001 by the Wilcoxon rank-sum test). (C) A plot showing the lifespan of growing microtubule plus ends near the posterior cortex (0–15 μm from the posterior) labelled by EB1-GFP in wild type (n = 1557, median 9.01) and khc27 homozygous oocytes (n = 1679, median 7.74). p=0.0006 by the Wilcoxon rank-sum test.
Figure 8
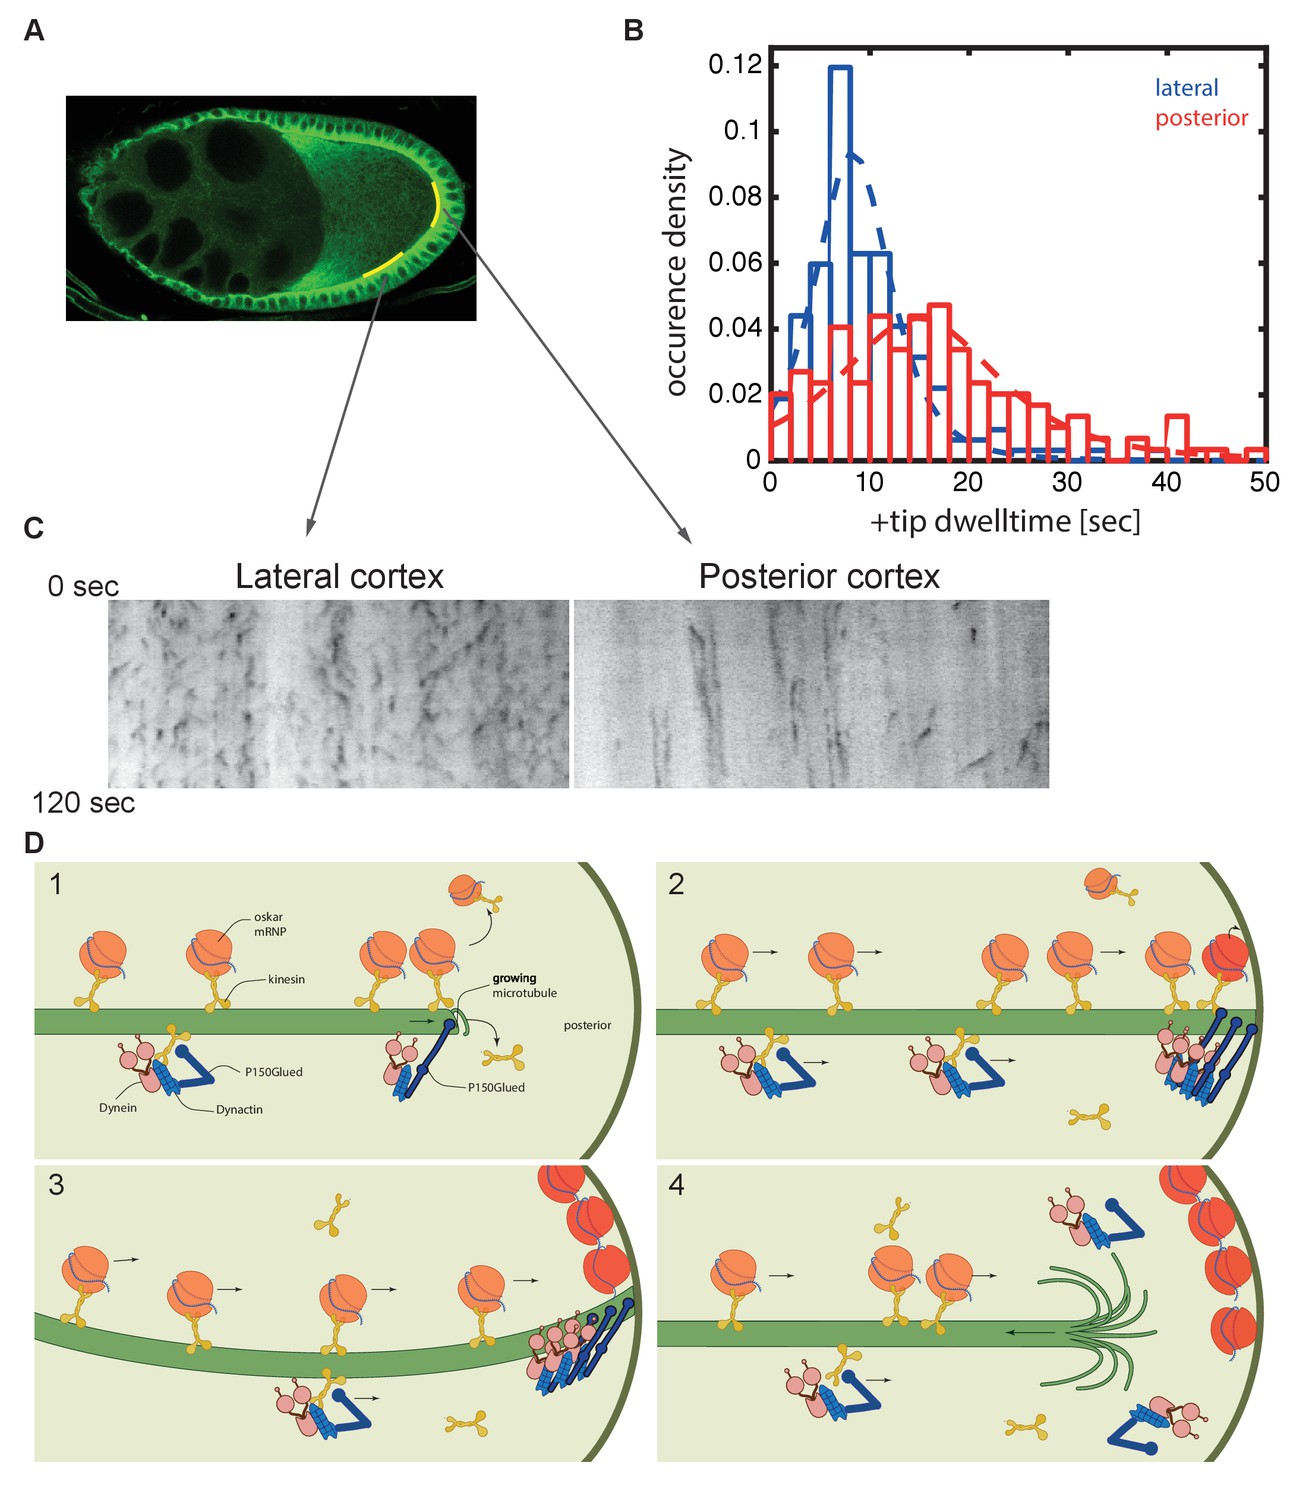
Microtubules continue growing for twice as long at the posterior cortex than at the lateral cortex.
(A) A confocal image of microtubules in a wild-type stage 9 oocyte indicating the regions of the posterior and lateral cortex (yellow lines) from which the kymographs in (C) were collected. (B) A histogram showing the relative frequency of microtubule plus ends (marked by EB1-GFP) at the lateral (blue, n = 159) and posterior (red, n = 148) cortex of the oocyte as a function of their dwell time. (C) Kymographs showing the EB1-GFP signal (black) along regions of the lateral and posterior cortex of the oocyte over a period of 120 s. Static EB1 comets result in vertical lines in the kymographs and represent the plus ends of microtubules that have reached the cortex, but have not yet undergone catastrophe. The length of each vertical line therefore represents the lifetime of the growing microtubule at the cortex. The diagonal EB1–GFP tracks in the lateral kymograph represent microtubules that are growing parallel to the cortex from cortical noncentrosomal microtubule organising centres (ncMTOCs). The diagonal tracks are largely absent from the kymograph of the posterior cortex because it lacks ncMTOCs. (D) A series of diagrams showing oskar mRNA/kinesin 1 complexes and dynein/dynactin/kinesin1 complexes moving along a microtubule that has Dynactin protecting its growing plus end (panel 1). The dynein/dynactin/kinesin1 complex is shown as different from the oskar mRNA/kinesin1 complex because the transport of dynein and dynactin is independent of oskar mRNA localisation (Palacios and St Johnston, 2002). The microtubule continues to grow upon reaching the posterior cortex (panels 2 and 3), allowing multiple oskar mRNA/kinesin1 complexes to move to the plus end and offload onto the cortex, before the microtubule finally undergoes catastrophe and shortens (panel 4).
-
Figure 8—source data 1
Dwell time of EB1-GFP comets at the lateral and posterior cortex
- https://doi.org/10.7554/eLife.27237.023
Figure 9
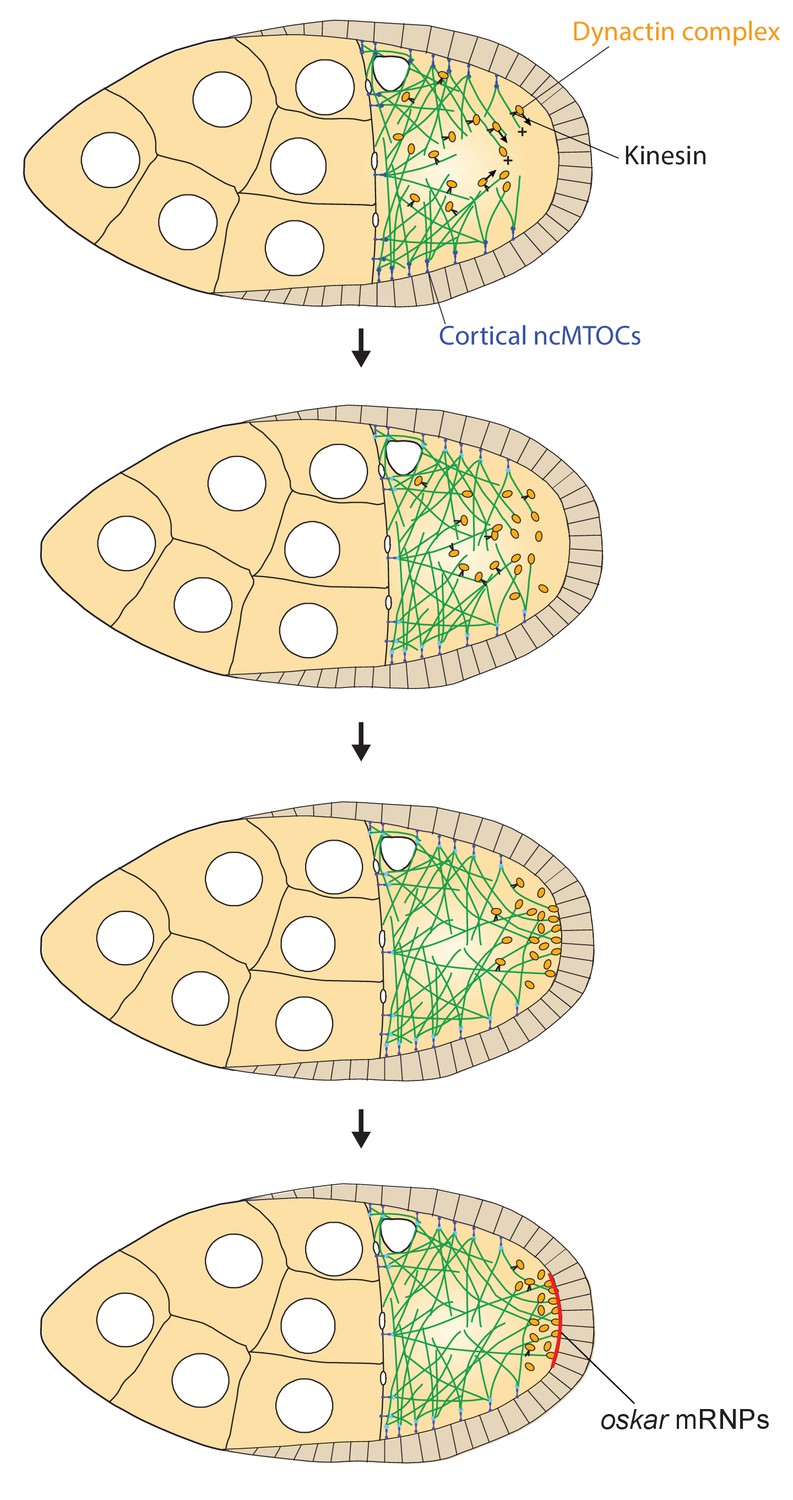
A model of the kinesin1/dynactin/microtubule positive feedback loop that increases the length and directional bias of microtubules near the posterior cortex.
A series of diagrams showing the steps in the positive feedback loop that ensures that microtubules reach the posterior cortex to deliver oskar mRNA. The distribution of cortical ncMTOCs along the anterior and lateral cortex organizes a weakly polarised microtubule network, with more microtubules growing posteriorly than anteriorly. The transport of the dynactin complex along these microtubules by kinesin leads an posterior enrichment of dynactin, where it binds to the growing microtubule plus ends and acts as an anti-catastrophe factor. This causes the microtubules to extend further towards the posterior, which in turn allows kinesin 1 to transport dynactin more posteriorly. This positive feedback eventually results in a high posterior concentration of dynactin and microtubules that extend all of the way to the posterior cortex, thereby allowing the efficient delivery of oskar mRNA.
Tables
Table 1
Quantification of oskar mRNA particle movements.
https://doi.org/10.7554/eLife.27237.010| Phenotype | Average speed, μm/s | Tracks to Posterior, % | Mobile fraction, % |
|---|---|---|---|
| WT | 0.36 ± 0.01 (N=1075) | 65 ± 0.8 (N=989) | 12.0 ± 2.1 (N = 358) |
| arp14D2 | 0.37 ± 0.03 (N=296) | 62 ± 0.7 (N=353) | 15.4 ± 2.5 (N = 361) |
-
Values shown are means plus and minus the SEM. In all cases, the differences between wild-type and the arp1[4D2] mutant were statistically insignificant, p>0.05.
-
Table 1—source data 1
Speed of oskar mRNA particles.
- https://doi.org/10.7554/eLife.27237.011
-
Table 1—source data 2
Direction of oskar mRNA particles.
- https://doi.org/10.7554/eLife.27237.012
-
Table 1—source data 3
Mobile fraction of oskar mRNA particles.
- https://doi.org/10.7554/eLife.27237.013
Additional files
-
Transparent reporting form
- https://doi.org/10.7554/eLife.27237.025
Download links
A two-part list of links to download the article, or parts of the article, in various formats.
Downloads (link to download the article as PDF)
Open citations (links to open the citations from this article in various online reference manager services)
Cite this article (links to download the citations from this article in formats compatible with various reference manager tools)
Localised dynactin protects growing microtubules to deliver oskar mRNA to the posterior cortex of the Drosophila oocyte
eLife 6:e27237.
https://doi.org/10.7554/eLife.27237


