Type III CRISPR-Cas systems can provide redundancy to counteract viral escape from type I systems
- Sukrit Silas

- Patricia Lucas-Elio
- Simon A Jackson
- Alejandra Aroca-Crevillén
- Loren L Hansen
- Peter C Fineran
- Andrew Z Fire
- Antonio Sánchez-Amat
- Stanford University, United States
- Universidad de Murcia, Spain
- University of Otago, New Zealand
Figures
Figure 1 with 1 supplement
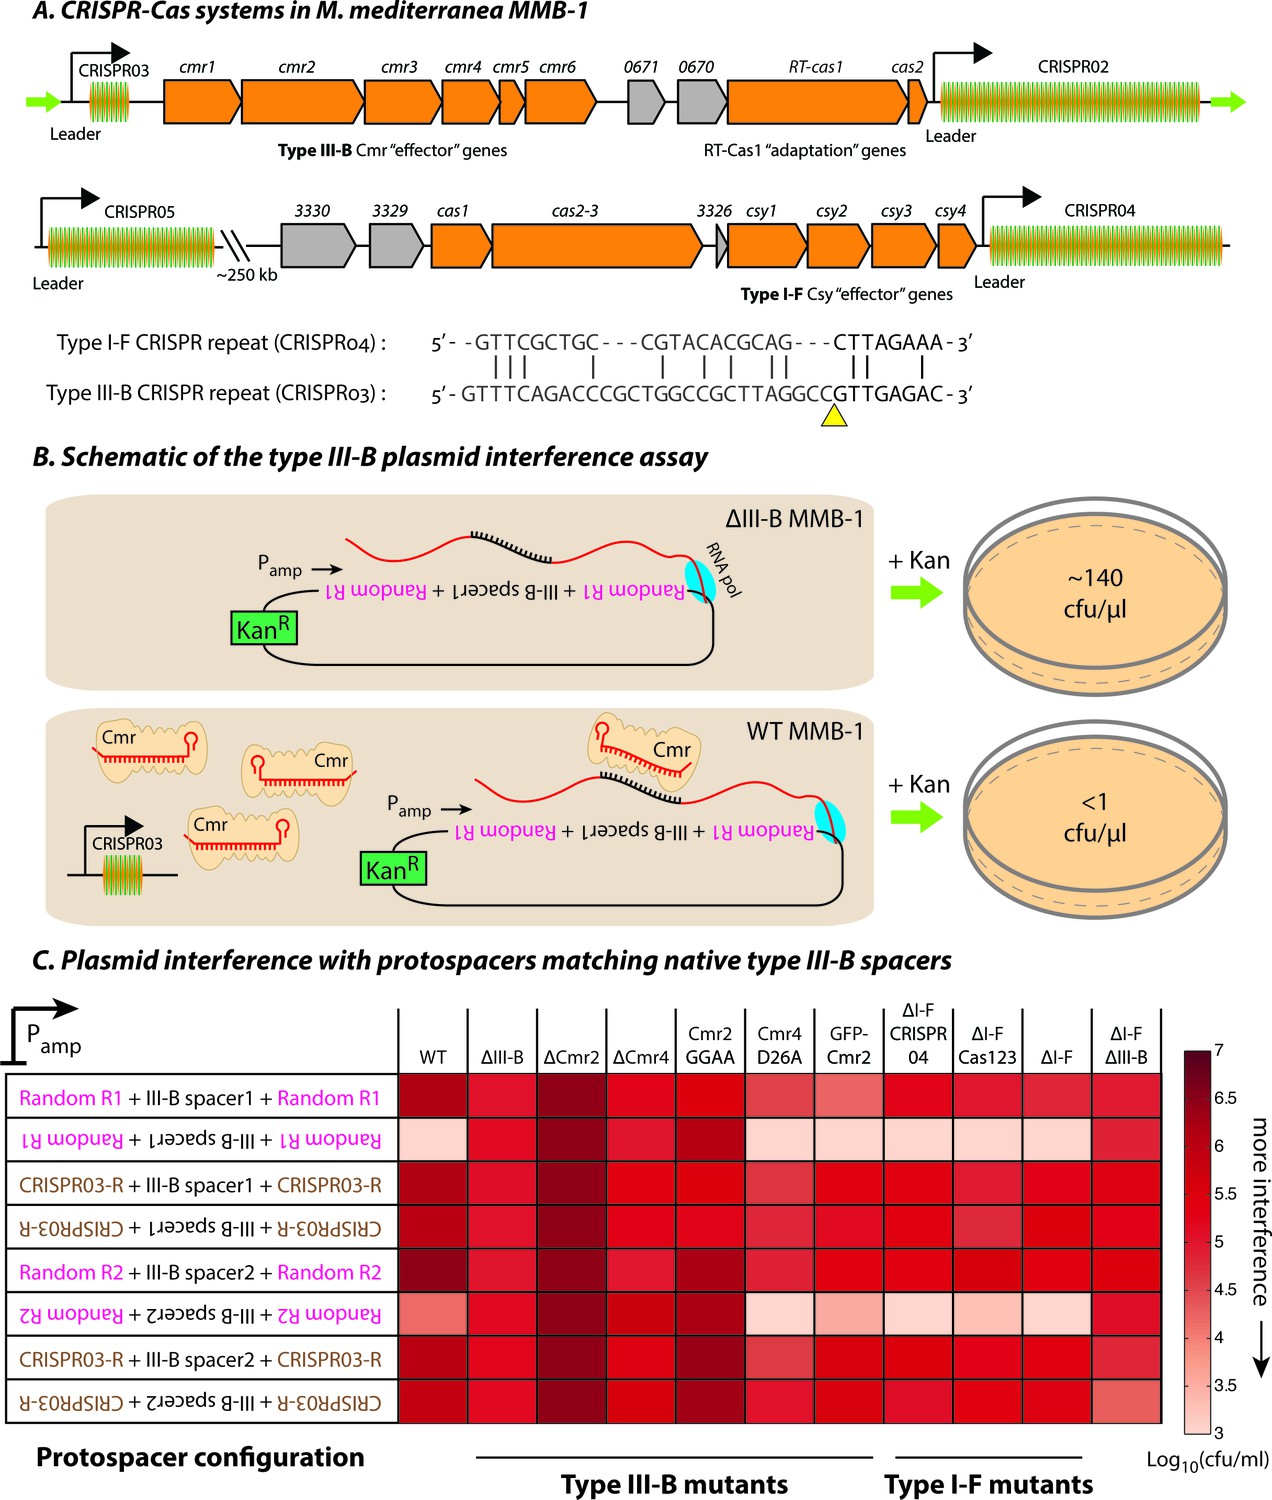
Transcription-dependent plasmid elimination by the M. mediterranea type III-B CRISPR-Cas system.
(A) Schematics of the type III-B (above; adapted from [Silas et al., 2016]) and type I-F (below) CRISPR-Cas systems in M. mediterranea MMB-1. The type III-B operon contains genes encoding the adaptation proteins RT-Cas1 and Cas2, a 6-gene cmr cassette encoding the type III-B effector complex, the 58-spacer CRISPR02 array, the 8-spacer CRISPR03 array, and two genes of unknown function (Marme_0670, 0671). The Cas10 HD nuclease domain, required for DNA interference in some type III-B systems (Elmore et al., 2016), is not evident in the M. mediterranea Cas10 (Cmr2). The entire operon is flanked by two ~200 bp direct repeats (green arrows). The type I-F system contains cas1, cas2-3, four csy genes and a 52 spacer CRISPR04 array. Marme_3330, 3329, and 3326 are ORFs of unknown function. The 37-spacer CRISPR05 array, located ~250 kb away from the type I-F system has a near-canonical type I-F repeat sequence but no neighboring cas genes. An alignment of predicted 5’-crRNA handles (last 8 nt) from type I-F and type III-B CRISPR repeats is shown, with the remaining repeat nucleotides aligned separately (grey) and the crRNA processing sites depicted by the yellow triangle. (B) Overview of the plasmid interference assay using native CRISPR03 spacers. Configurations that allow the protospacer RNA to be targeted by the corresponding endogenous crRNA-Cmr complex lead to plasmid elimination and cell death on selective medium (+Kan). Inactivation of the type III-B CRISPR-Cas system results in plasmid stability and a corresponding increase in transconjugants. Numbers shown correspond to colony forming units per microliter (cfu/μl) measurements from the conjugations depicted. (C) Transcription-dependent plasmid interference in various M. mediterranea mutants using native CRISPR03 spacers. Log-transformed cfu/ml measurements from conjugations of plasmids with different protospacer configurations (relative to Pamp). Random R1 and R2 (pink text) are two different randomized sequences with base composition identical to the type III-B CRISPR repeat (brown text; CRISPR03-R). Upside down text denotes the reverse-complement. The GFP-Cmr2 strain is a control for the process of mutant construction.
-
Figure 1—source data 1
Colony forming units per mL (cfu/ml) counts obtained from conjugations for plasmid interference assays.
Each box represents an independent conjugation. Assay detection limits are reported for conjugations where no viable transconjugants were observed. TMTC denotes the conjugation produced ‘too many [colonies] to count’. The protospacer configuration of each plasmid is represented in the ‘Plasmids’ column. Protospacers matching the first or second spacer sequences from the III-B or I-F arrays were used as indicated. RC denotes that the reverse complement of a particular configuration was used. DR signifies that the protospacer was flanked by CRISPR repeats of the same array as the spacers.
- https://doi.org/10.7554/eLife.27601.004
Figure 1—figure supplement 1

Effect of Cmr2 and Cmr4 active site mutations on protospacer RNA levels during putative type III-B RNA targeting.
Wildtype (WT), Cmr2 GGAA, and Cmr4 D26A strains were transformed with plasmids from the interference assay, and tested for the presence of RNA from the protospacer regions by targeted RNAseq. All plasmid configurations from Figure 1C were tested in the Cmr2 GGAA mutant strain (red). In the presence of functional type III CRISPR-Cas-mediated RNA degradation, a drastic reduction in the RNA levels for the configurations marked with red diamonds would be expected. Based on our data, we cannot distinguish between the possibilities that the M. mediterranea type III-B system lacks RNAse activity altogether, or that the Cmr2 GGAA mutation abolishes RNA degradation. This contrasts with S. epidermidis where the Cmr2 PALM domain is necessary for DNA interference, but not for target RNA cleavage (Samai et al., 2015). The plasmids marked with red diamonds are not stable in WT (green) or the Cmr4 D26A mutant (blue); this precluded us from determining whether these strains displayed RNase activity (n.d.: not determined). Although we do not see evidence for RNA degradation by the M. mediterranea type III-B system, it is conceivable that a Cmr2-dependent RNA-targeting pathway is present.
Figure 2 with 2 supplements
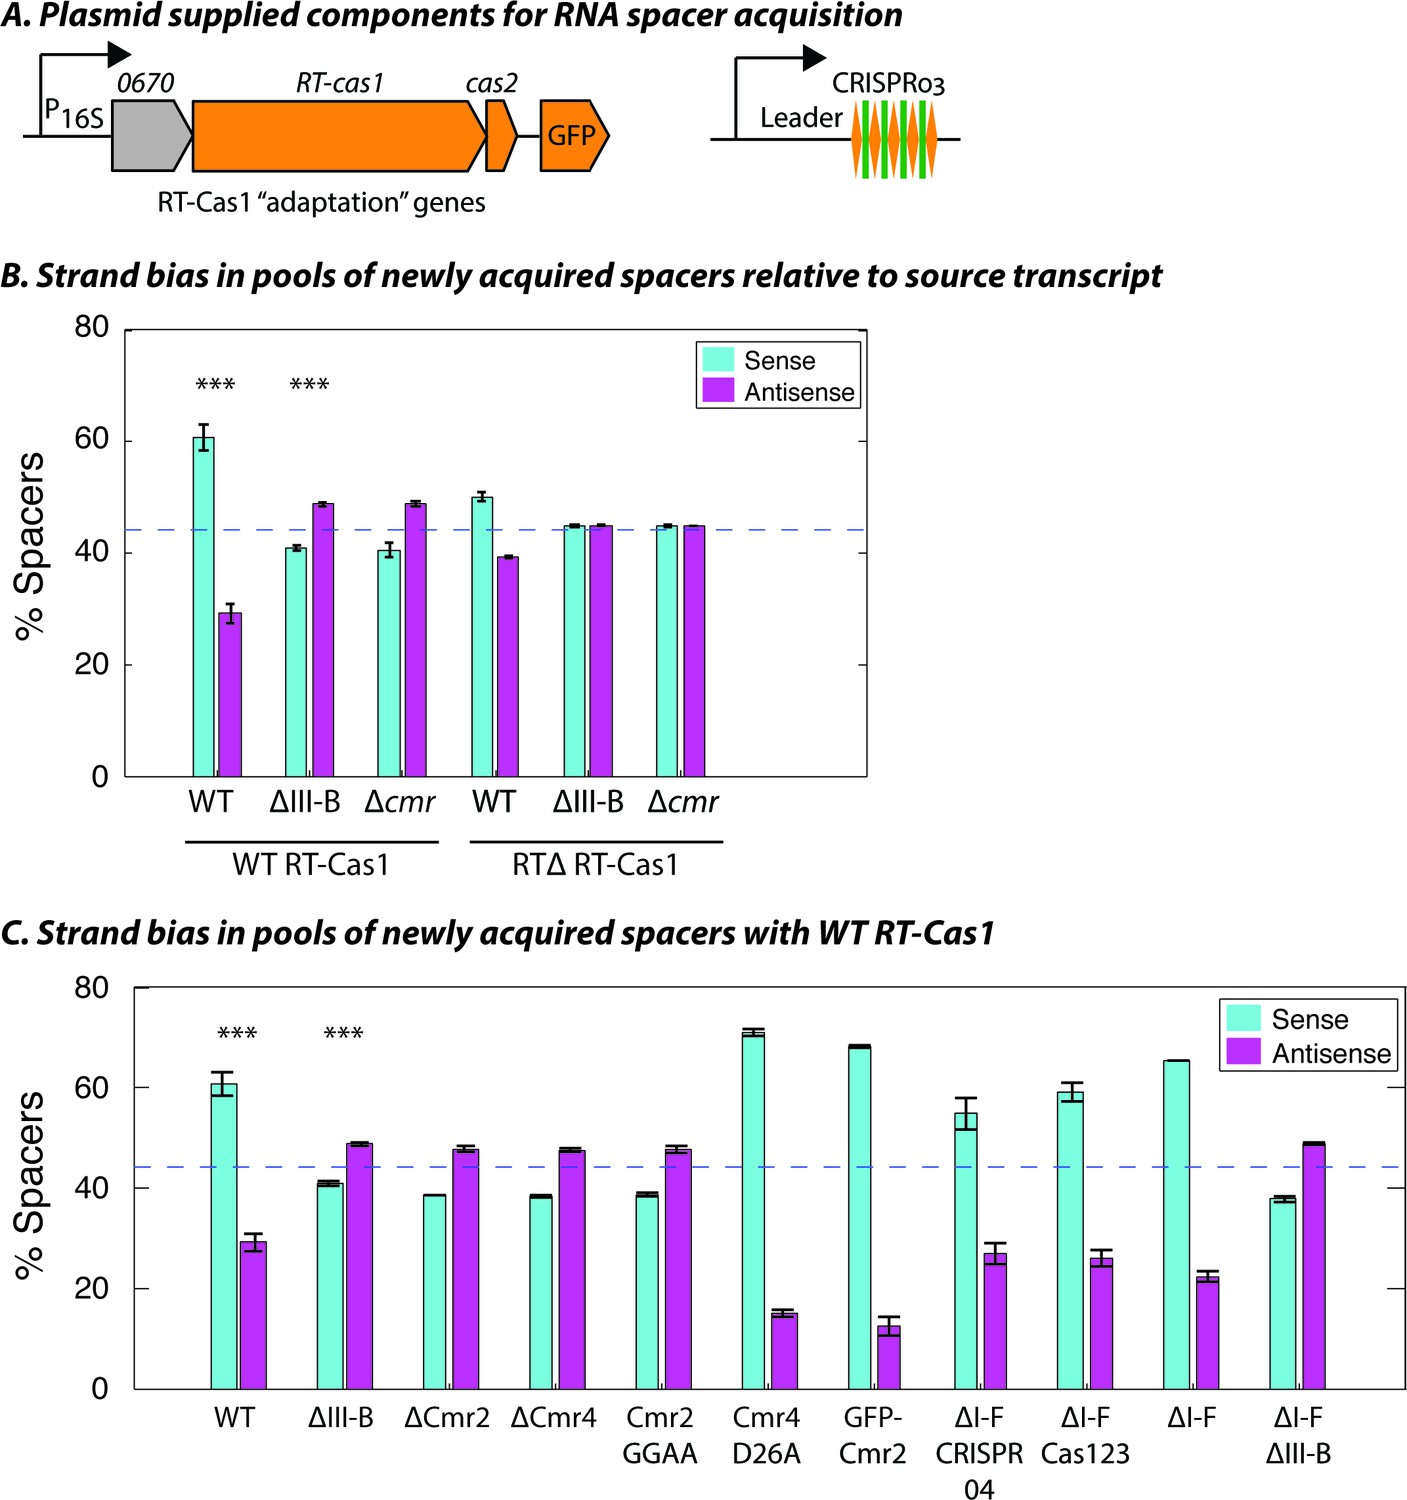
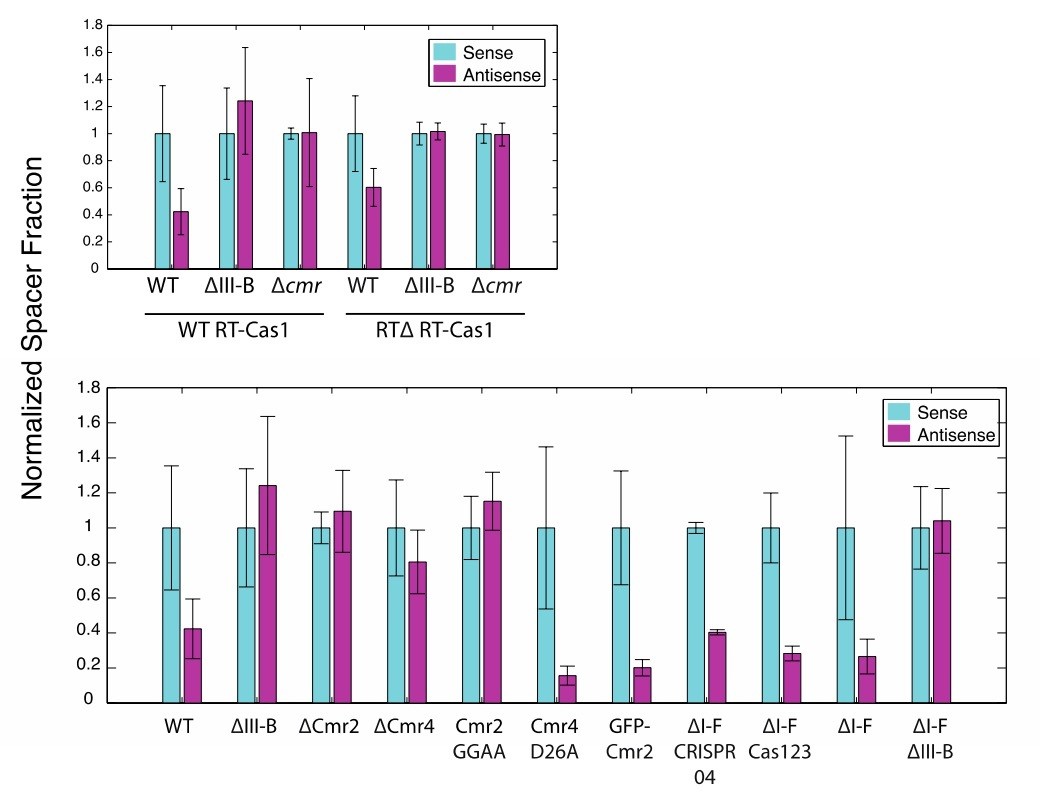
Interference-dependent strand bias in newly acquired spacers.
(A) Arrangement of the type III-B CRISPR adaptation genes encoding Marme_0670, RT-Cas1, and Cas2 on a pKT230 broad-host-range vector under control of the putative 16S rRNA promoter (Adapted from [Silas et al., 2016]). (B) Proportion of newly acquired spacers isolated from CRISPR03 mapping to sense and antisense strands of host genes. Strains with the entire type III-B CRISPR-Cas operon deleted (ΔIII-B), the six cmr genes deleted (Δcmr), or wildtype (WT) were tested with overexpression of WT or RT-deleted (RTΔ) versions of RT-Cas1. (C) Strand bias measurements of new spacers in additional mutants with overexpression of WT RT-Cas1. Data for WT and ΔIII-B strains redrawn from (B) for comparison. (B–C) As the WT-to-∆III-B comparison was most critical, these two measurements were repeated in eight samples for each genotype, with bars for standard error of the mean (SEM) shown. Other measurements were repeated twice, with bars indicating range. Blue dashed lines denote the expectation of no bias (no bias would yield ~44.3% [not 50%] because spacers mapping to regions outside of annotated genes [~11.4% of the total genome] provide us with no basis for strand assignment). Asterisks denote statistical testing was performed for the WT and ∆III-B datasets (p<0.001; T-test).
Figure 2—figure supplement 1
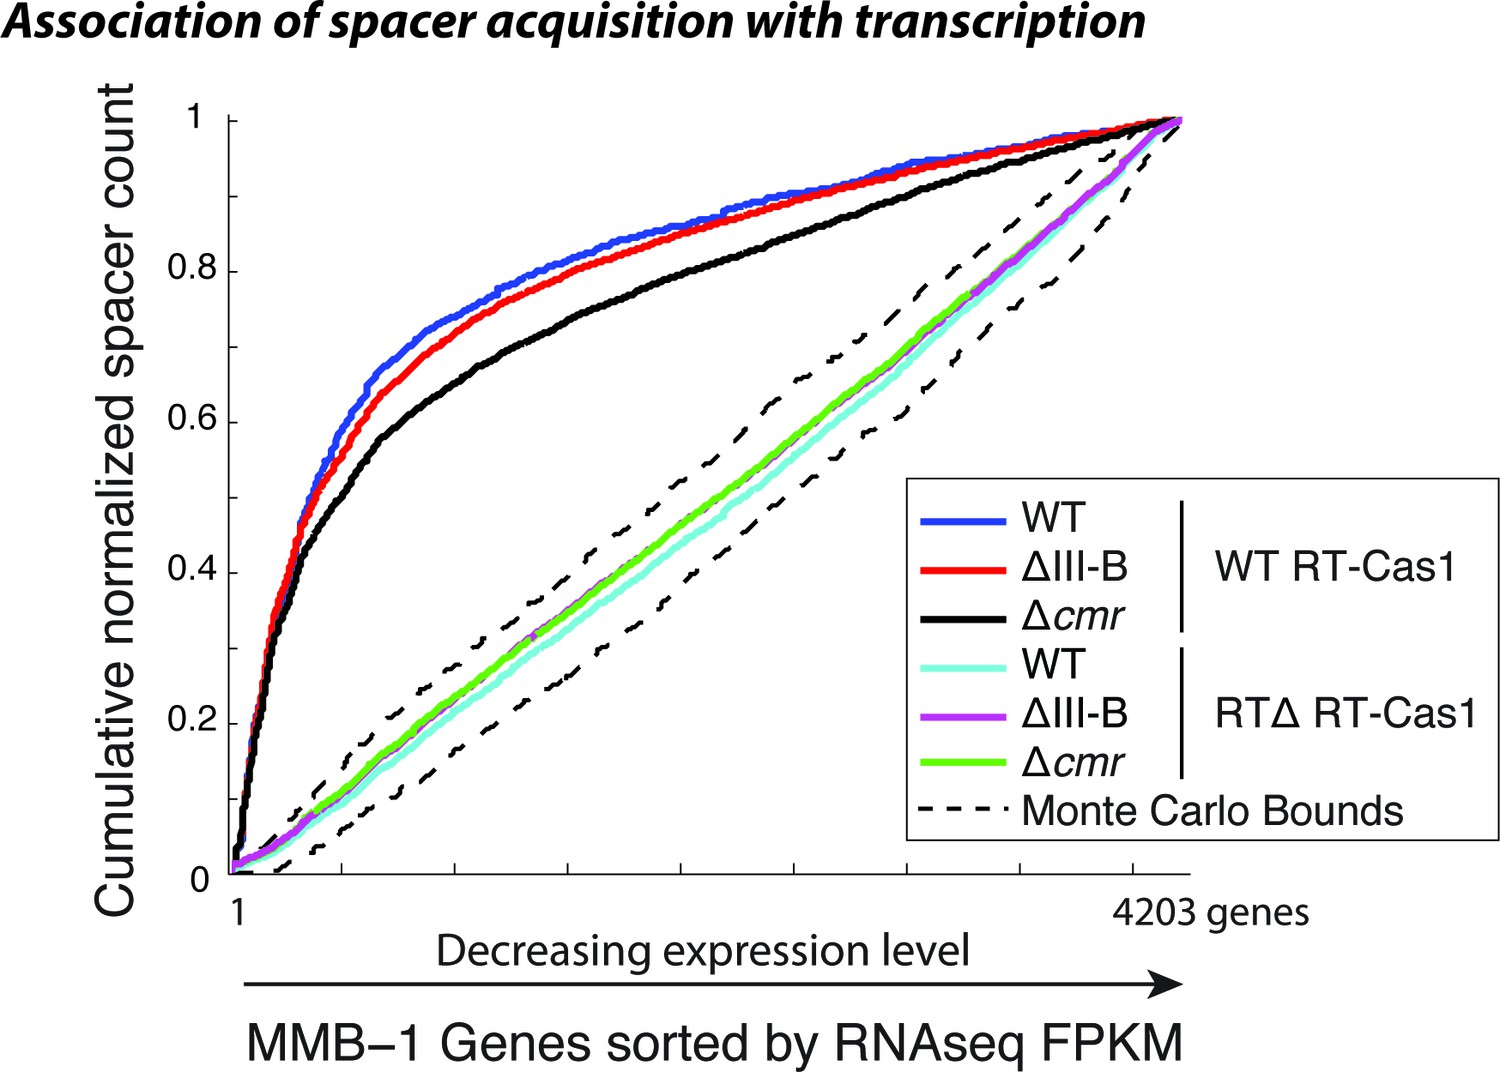
Spacer acquisition in the absence of type III-B interference.
Cumulative normalized distribution of spacers in (A) among M. mediterranea genes sorted by RNAseq FPKM (fragments per kb per million reads), with genes ordered by decreasing expression level. Each dataset includes spacers from two separate transconjugants. Numbers of recovered spacers analyzed were as follows: 4093 WT, 21629 ∆III-B, 7341 ∆cmr with WT RT-Cas1, and 20780 WT, 43587 ∆III-B, 55026 ∆cmr with RT∆ RT-Cas1. The linear relationships observed in the presence of RTΔ RT-Cas1 indicate no correlation between spacer acquisition and mRNA transcription levels, which is consistent with spacer acquisition from DNA. Spacers acquired with WT RT-Cas1 show preferred acquisition from highly expressed genes, indicative of spacer acquisition from RNA substrates. Dashed black lines show the range of values from a Monte-Carlo simulation with random assortment (no transcription-related bias).
Figure 2—figure supplement 2
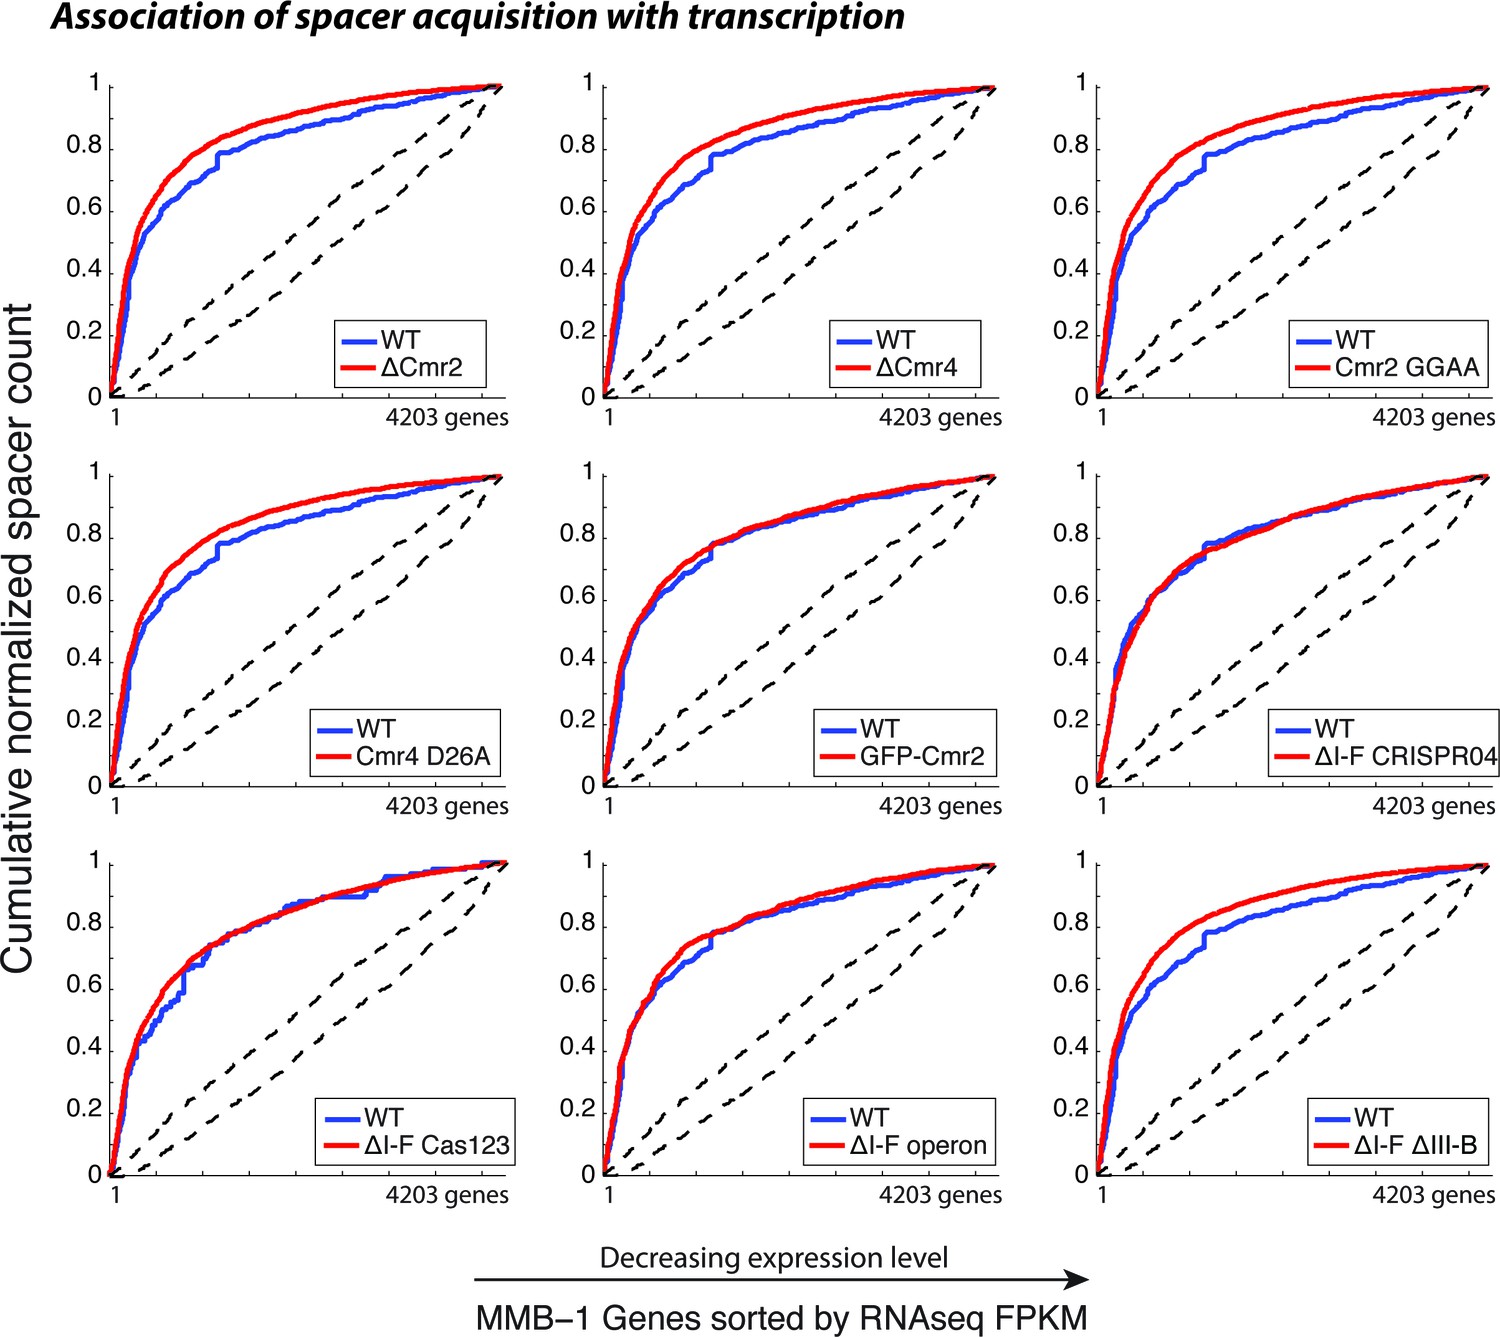
CRISPR spacer acquisition in M. mediterranea mutants.
Cumulative normalized distribution of spacers in (A) among M. mediterranea genes sorted by RNAseq FPKM (fragments per kb per million reads), with genes ordered by decreasing expression level. Each dataset includes spacers from two separate transconjugants. Numbers of recovered spacers analyzed were as follows: 785 WT, 9311 ∆cmr2, 11963 ∆cmr4, 10727 Cmr2:GGAA, 6173 Cmr4:D26A, 3757 GFP-Cmr2, 4398 ∆I-F CRISPR04, 1599 ∆I-F operon, and 16517 ∆I-F∆III-B. The ∆I-F Cas123 mutant was tested in a separate experiment with 137 WT and 12845 ∆I-F Cas123 spacers recovered. Spacers acquired in the presence of WT RT-Cas1 (blue) show preferred acquisition from highly expressed genes, indicative of spacer acquisition from RNA, and are plotted in each panel for comparison. Dashed black lines show the range of values from a Monte-Carlo simulation with random assortment (no transcription-related bias).
Figure 3 with 1 supplement
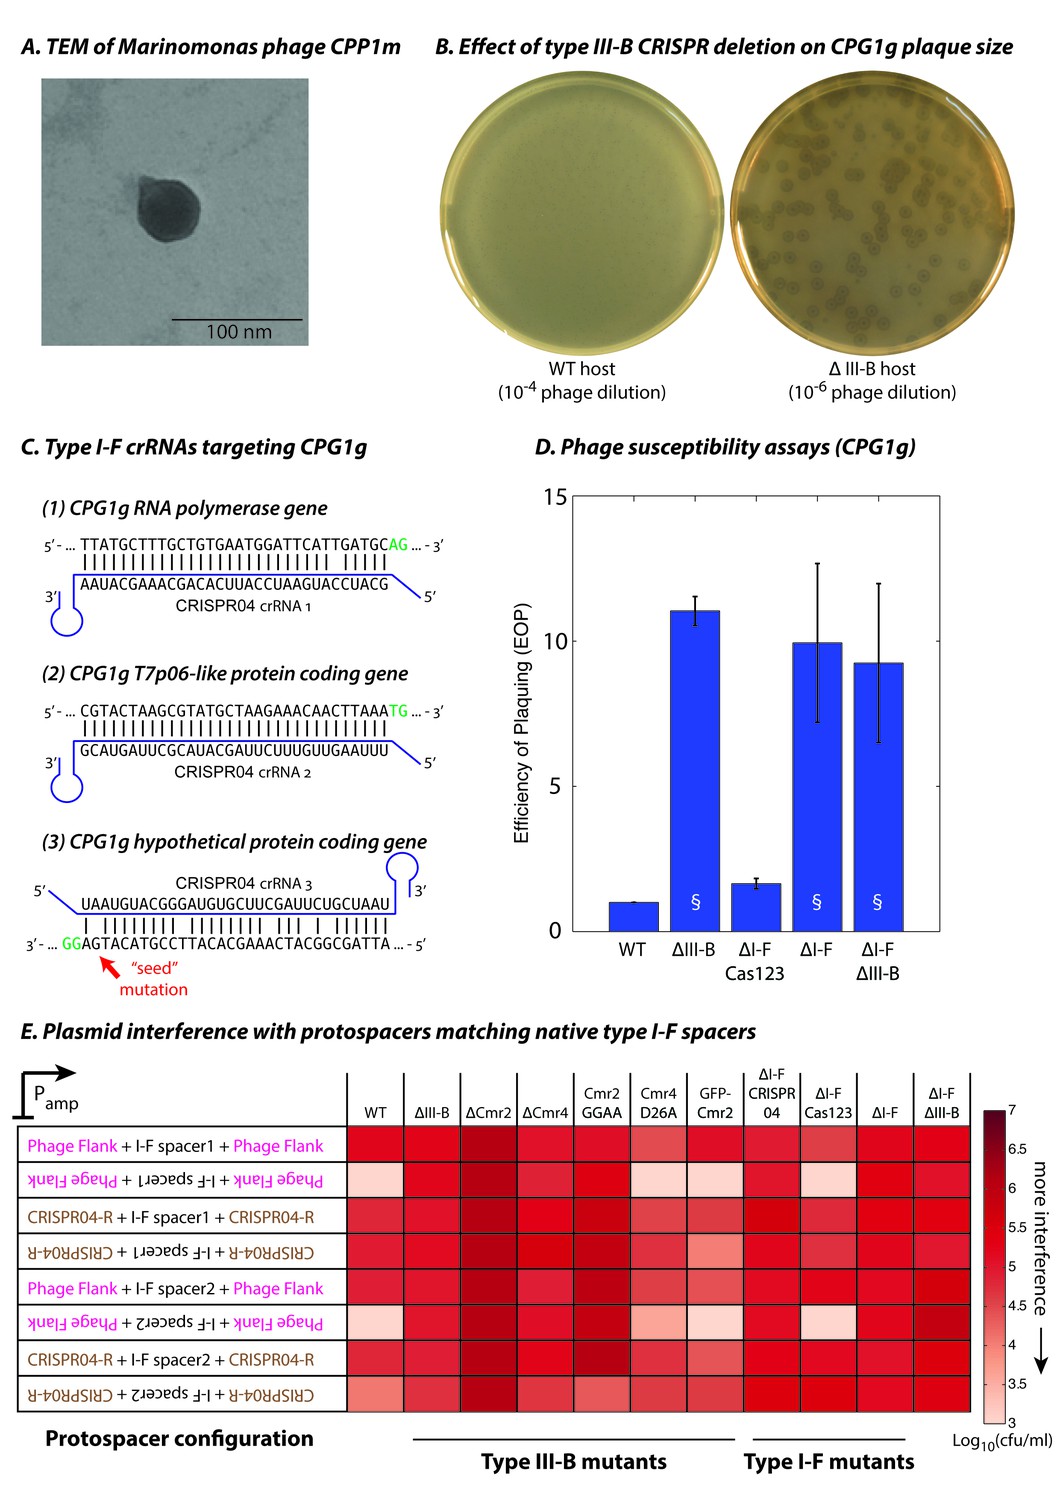
Phage-derived type I-F spacers are utilized by type III-B interference machinery.
(A) Transmission electron micrograph (TEM) of phage CPP1m stained with uranyl acetate. (B) CPG1g plaques on lawns of WT (left) and ΔIII-B (right) strains. (C) The type I-F CRISPR04 array contains spacers with near-perfect 32 bp matches to portions of the CPG1g RNA polymerase and the T7p06-like genes, and a third spacer with 5 mismatches (including a mutation in the ‘seed’ region) to a target in a gene encoding a hypothetical protein. CPG1g bases at the positions of the canonical type I-F PAM are highlighted in green. crRNAs from both near-perfect spacers 1 and 2 would be complementary to the putative phage mRNAs, while the mismatched 3rd spacer would yield crRNAs unable to bind targeted phage mRNA (denoted by inverted alignment). (D) Susceptibility of M. mediterranea mutants to CPG1g. Efficiency of plaquing is calculated as the fold change in counts of plaque forming units (PFU) relative to WT. Bars indicate results from 2 independent trials. § denotes enlarged plaques. (E) Transcription-dependent plasmid interference in various M. mediterranea mutants using native CRISPR04 spacers. Log-transformed cfu/ml measurements from conjugations of plasmids with various protospacer configurations. Type I-F spacer-matching sequences are flanked either by 28 bp of phage-derived sequence (pink text), or by 28 bp type I-F CRISPR repeats (brown text; CRISPR04-R). Upside down text denotes the reverse-complement.
-
Figure 3—source data 1
Colony forming units per mL (cfu/ml) counts obtained from conjugations for plasmid interference assays.
Each box represents an independent conjugation. Assay detection limits are reported for conjugations where no viable transconjugants were observed. TMTC denotes the conjugation produced ‘too many [colonies] to count’. The protospacer configuration of each plasmid is represented in the ‘Plasmids’ column. Protospacers matching the first or second spacer sequences from the III-B or I-F arrays were used as indicated. RC denotes that the reverse complement of a particular configuration was used. DR signifies that the protospacer was flanked by CRISPR repeats of the same array as the spacers.
- https://doi.org/10.7554/eLife.27601.010
Figure 3—figure supplement 1
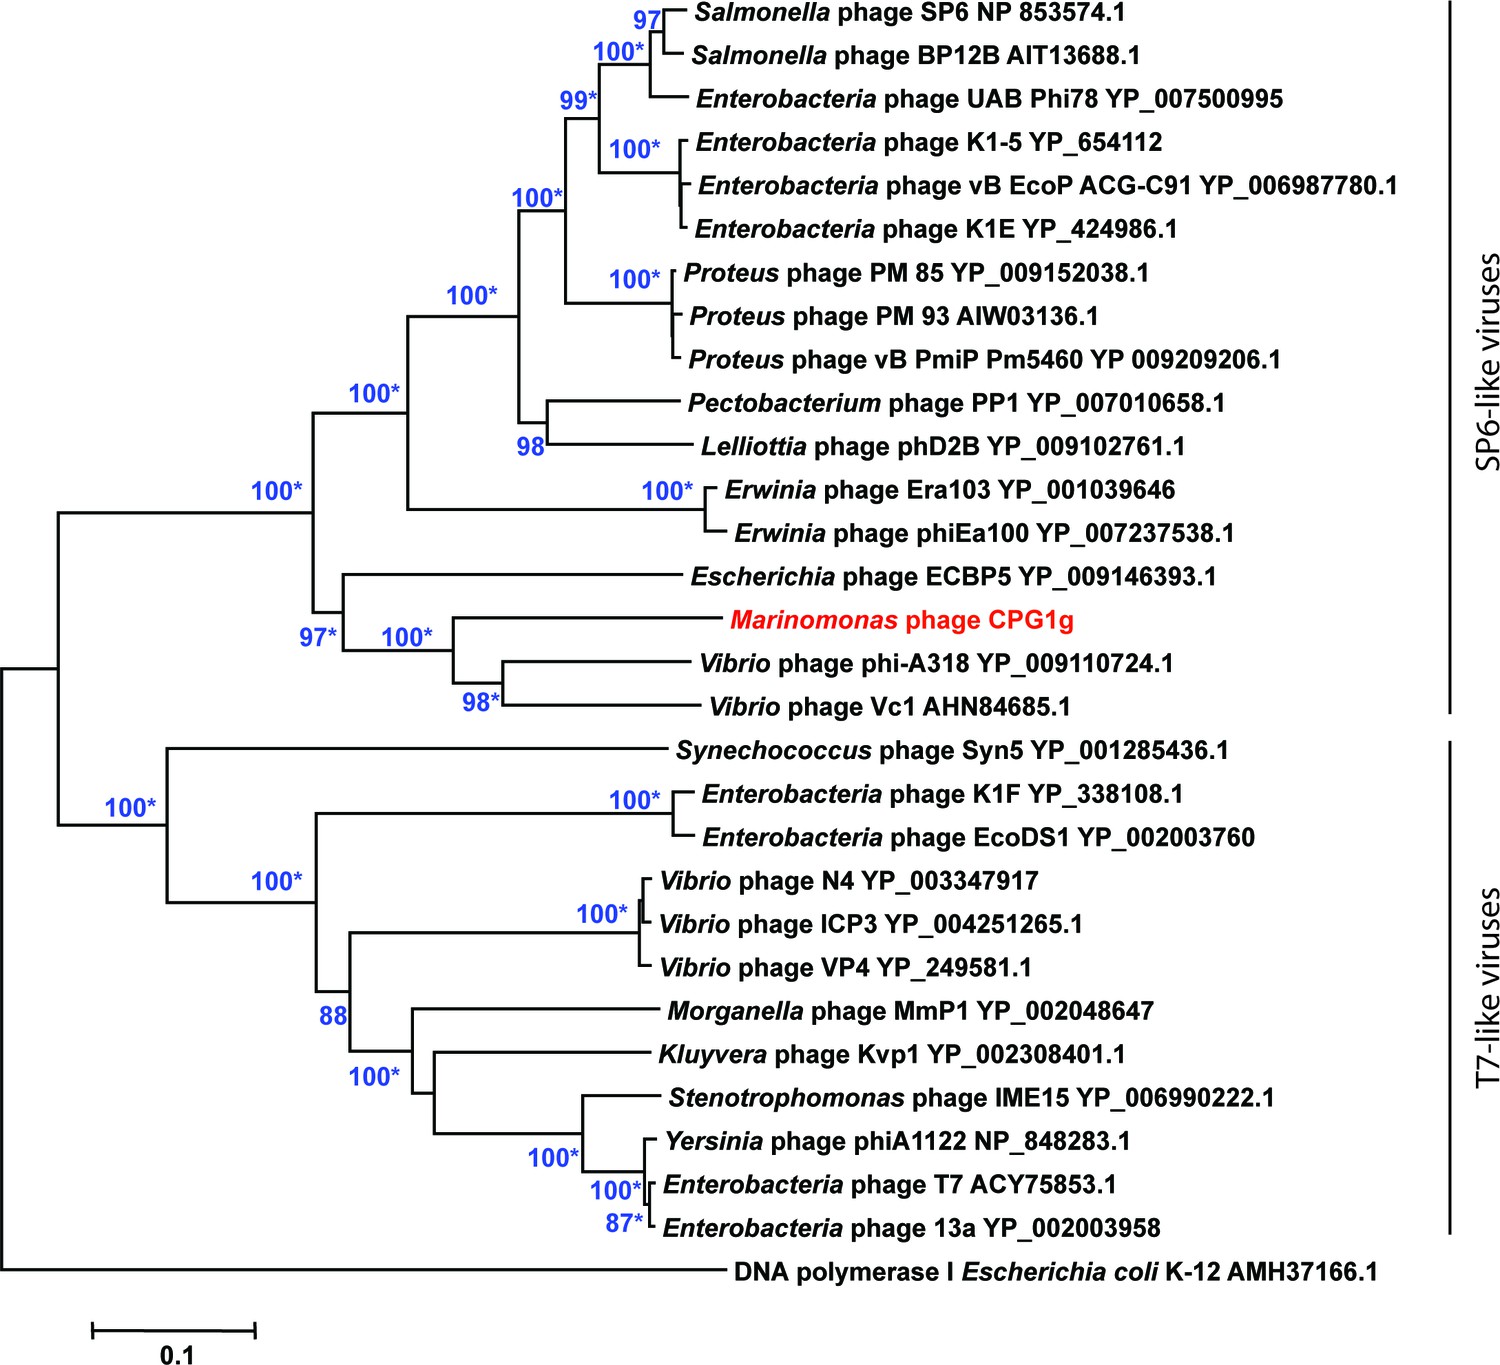
Phylogenetic relationships of phage DNA polymerases.
Neighbor-joining tree computed using phage DNA polymerase protein sequences. Numbers at branches indicate bootstrap values >70%. Asterisks indicate that the branches also have bootstrap values >70% in Maximum-Likelihood trees. Escherichia coli DNA polymerase I was used as an outgroup.
Figure 4 with 1 supplement
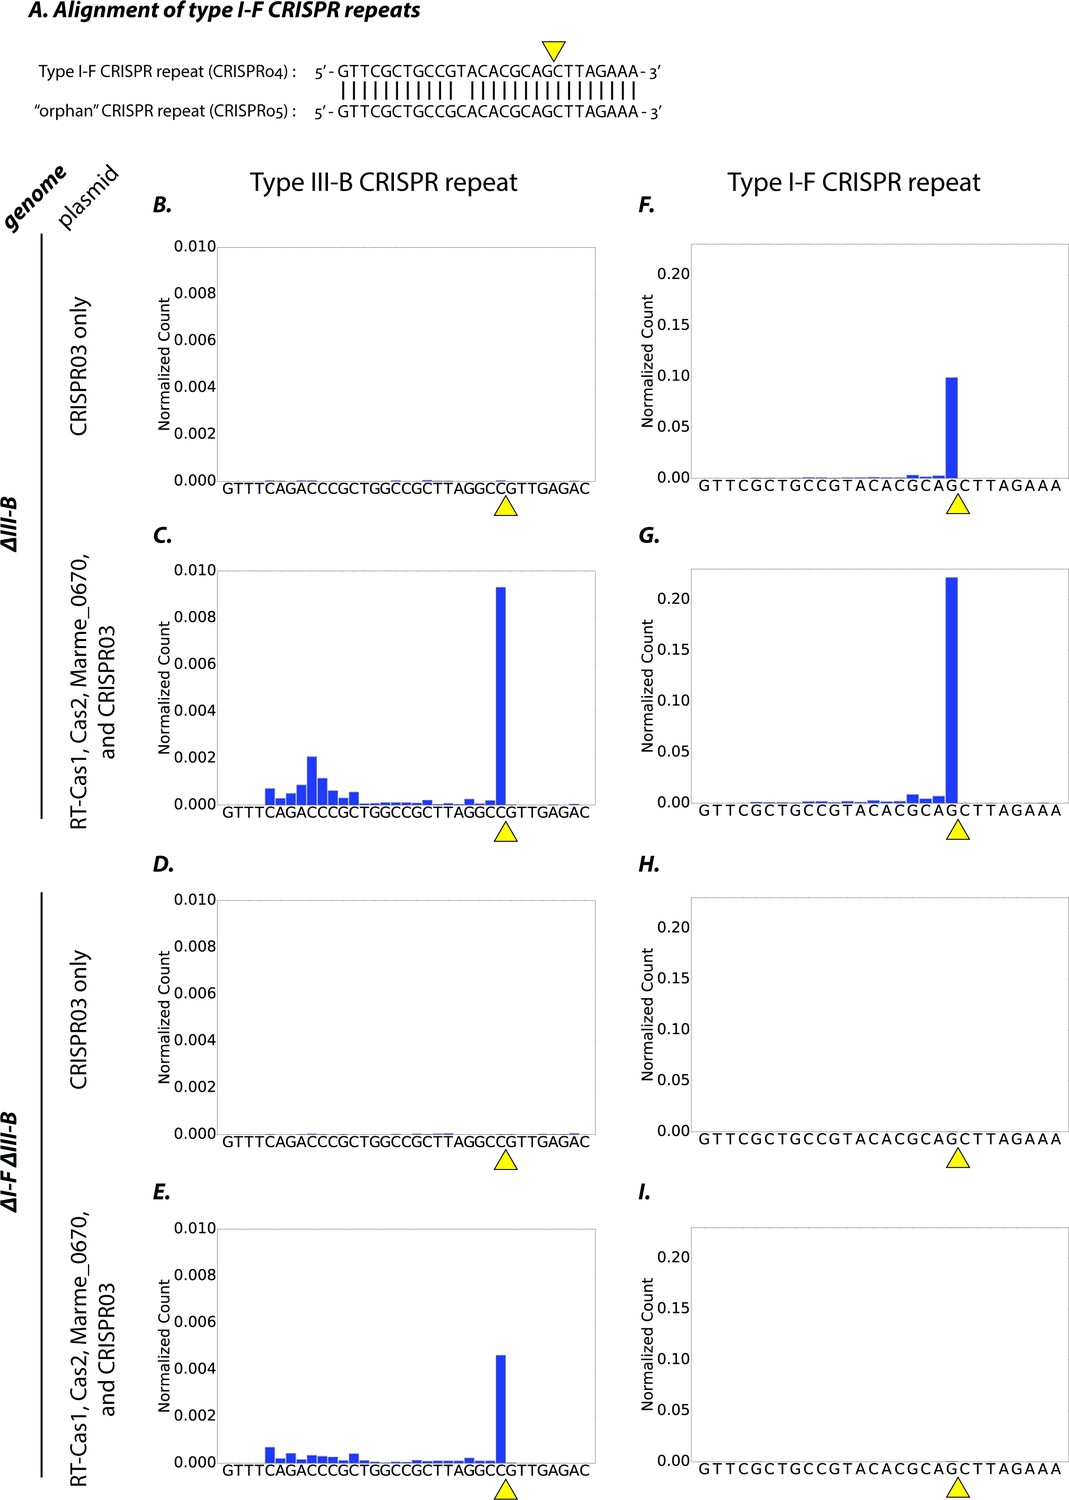
Type I-F and type III-B pre-crRNA processing in M. mediterranea.
(A) Alignment of type I-F CRISPR repeat sequences from CRISPR04 and CRISPR05 (see Figure 1A). Yellow triangle marks the expected pre-crRNA processing site 8 nt upstream of 3’ end of the CRISPR04/05 direct repeat sequence. (B–I) Processed crRNA levels assayed by high throughput small RNA sequencing. Each dataset includes RNA sequences from two separate transconjugants. The presence of a distinct 3’ end sequence in the population of CRISPR repeat containing RNAs indicates site-specific cleavage and processing of pre-crRNA. Counts are normalized to Isoleucine tRNA levels (consistently the most abundant species encountered). Type III-B adaptation components – RT-Cas1, Cas2, Marme_0670 genes and the CRISPR03 array – were supplied in (C, E, G, I), whereas only the CRISPR03 array was supplied in (B, D, F, H). The genetic background of the host strain is indicated in the figure. The CRISPR04 repeat sequence is shown in (F–I) for simplicity, but read counts from both type I-F CRISPR arrays are included in the figures.
Figure 4—figure supplement 1
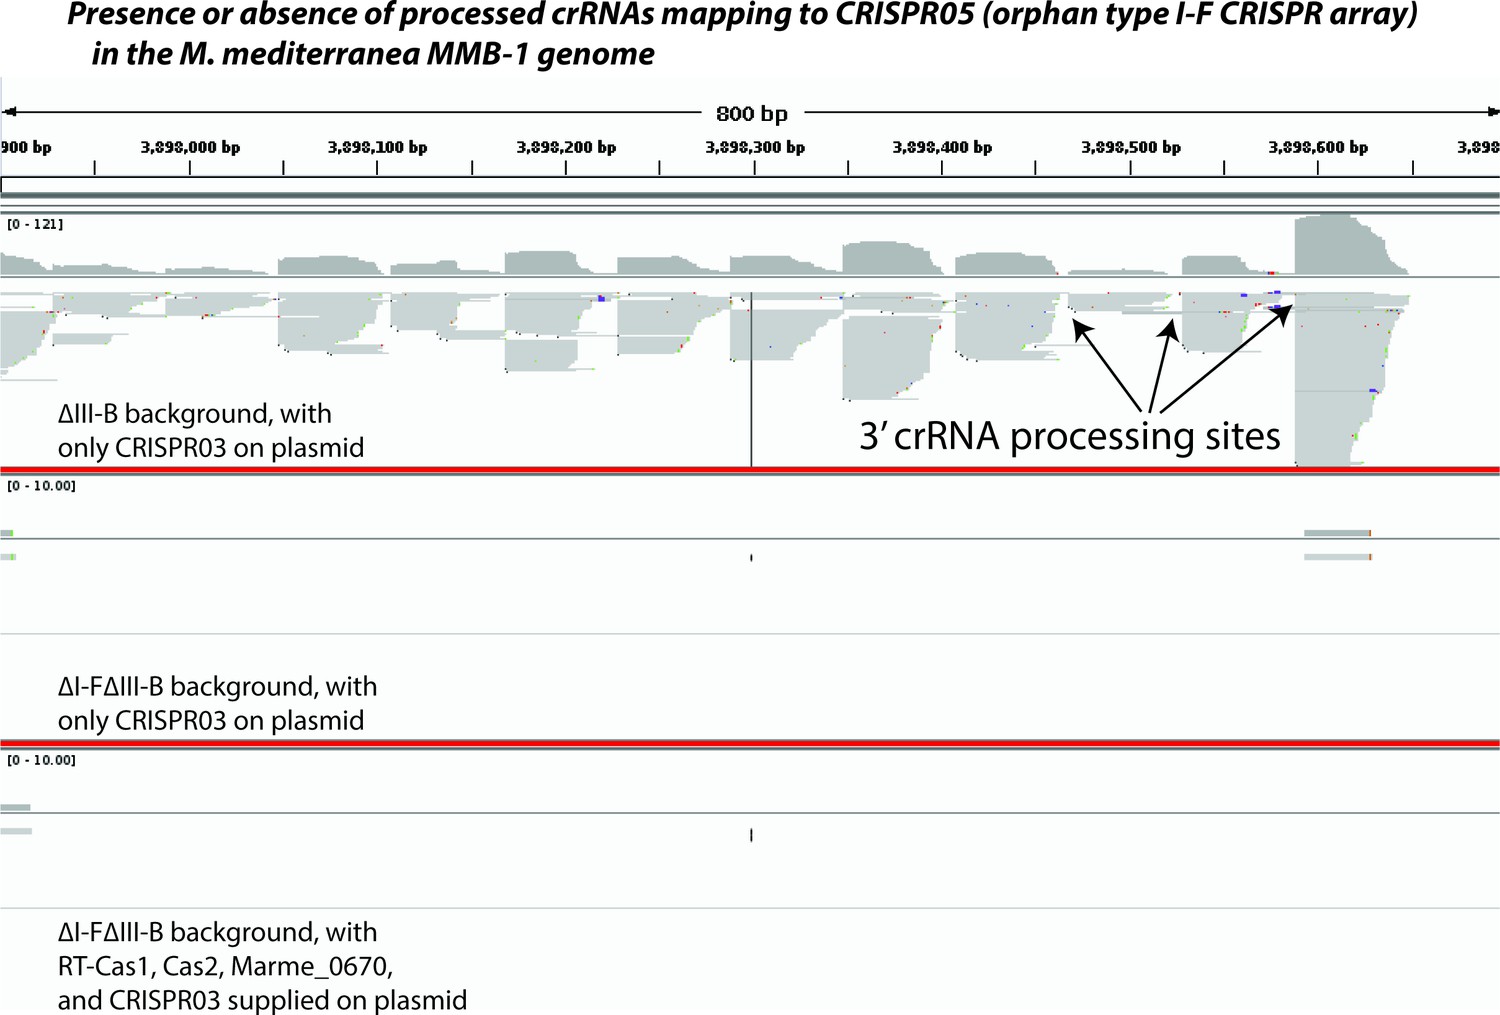
Type I-F pre-crRNA from the orphan array is not processed in the absence of type I-F factors.
Screenshot from Integrated Genome Viewer (IGV) showing an 800 bp portion of the orphan type I-F CRISPR05 array in the M. mediterranea MMB-1 genome (chromosomal coordinates 3,897,900–3,898,700). Small RNAs were selected and sequenced using a protocol that preserves strand information, controls for PCR amplification bias, and faithfully reports the 3’ ends of source RNA molecules. Sequencing reads were mapped to the entire genome. Screenshot depicts pileups of reads mapping uniquely to the CRISPR05 region from three different experiments separated by thick red lines (corresponding to Figure 4F,H and I respectively). ∆III-B denotes removal of the entire type III-B operon; additionally, the entire I-F operon (including the linked CRISPR04 array) is removed in the ∆I-F∆III-B background. Plasmid-supplied type III-B factors are listed in each panel. CRISPR05 was left intact in all strains. A few crRNA processing sites are highlighted by arrows.
Figure 5 with 1 supplement
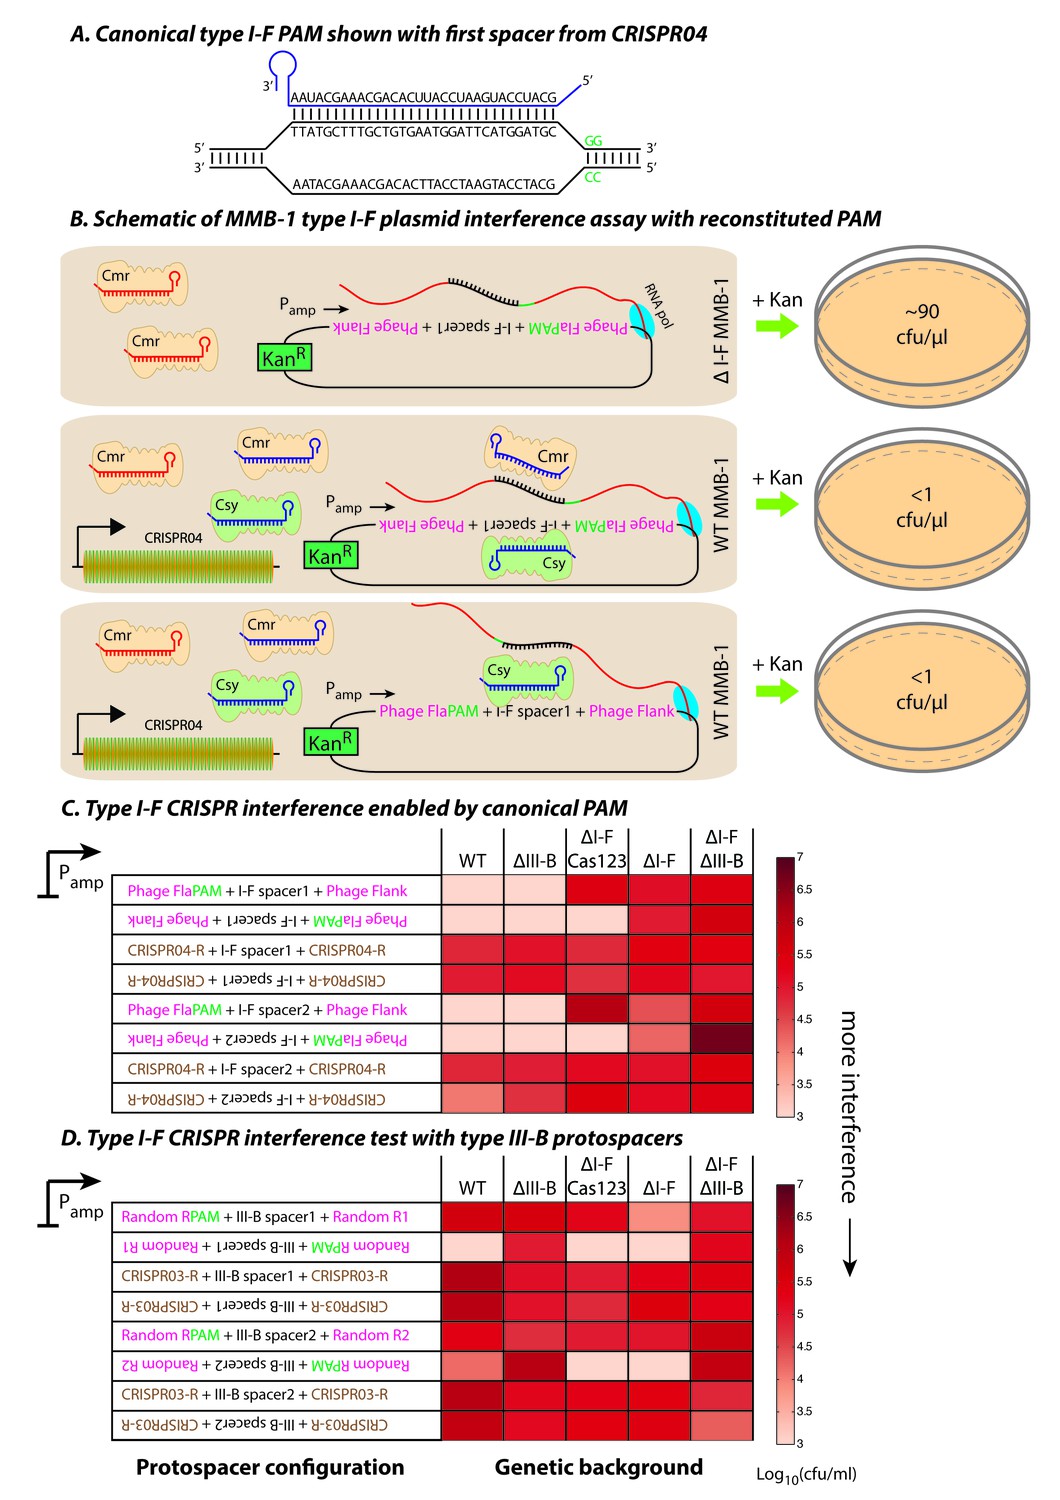
Contrasting determinants for self/non-self discrimination with a single crRNA.
(A) Schematic of crRNA corresponding to the first spacer of CRISPR04 bound to protospacer DNA containing the canonical type I-F GG PAM. (B) Experimental outline of the plasmid interference assay using native CRISPR04 spacer sequences with reconstituted canonical (GG) PAMs. Both orientations of the protospacer DNA would be targeted by Csy-bound type I-F crRNA (blue), leading to plasmid loss independent of the direction of transcription. A configuration that would allow the protospacer RNA to be targeted by the Cmr-bound type I-F crRNA would also lead to plasmid instability. Conversely, deletion of the type I-F CRISPR-Cas system removes the CRISPR04 array, and would result in viable transconjugants despite the presence of Cmr-bound type III-B crRNA (red). Numbers shown correspond to cfu/μl measurements from the conjugations depicted. (C–D) Log-transformed cfu/ml measurements from conjugations of plasmids with different protospacer configurations. Upside down text denotes the reverse-complement. (C) Plasmid interference using native CRISPR04 spacers and GG PAM. The type I-F spacer-matching sequences are flanked either by 28 bp phage derived sequence (pink text) with reconstituted GG PAMs (green text), or by 28 bp type I-F CRISPR repeats (brown text; CRISPR04-R). (D) Plasmid interference using native CRISPR03 spacers and GG PAM. Type III-B spacer-matching sequences are flanked by Random R1 and R2 sequences (pink text) from Figure 2C with two bases preceding the protospacer converted to GG PAM (green text), or by the type III-B CRISPR repeat (brown text; CRISPR03-R). Data for CRISPR04-R and CRISPR03-R controls redrawn from Figures 3E and 2C, respectively.
-
Figure 5—source data 1
Colony forming units per mL (cfu/ml) counts obtained from conjugations for plasmid interference assays.
Each box represents an independent conjugation. Assay detection limits are reported for conjugations where no viable transconjugants were observed. TMTC denotes the conjugation produced ‘too many [colonies] to count’. The protospacer configuration of each plasmid is represented in the ‘Plasmids’ column. Protospacers matching the first or second spacer sequences from the III-B or I-F arrays were used as indicated. RC denotes that the reverse complement of a particular configuration was used. DR signifies that the protospacer was flanked by CRISPR repeats of the same array as the spacers. PAM signifies that the type I-F GG PAM sequence was restored. Plasmids for Figure 5C and D in boldface represent data that were reproduced from Figures 1C and 3E.
- https://doi.org/10.7554/eLife.27601.015
Figure 5—figure supplement 1
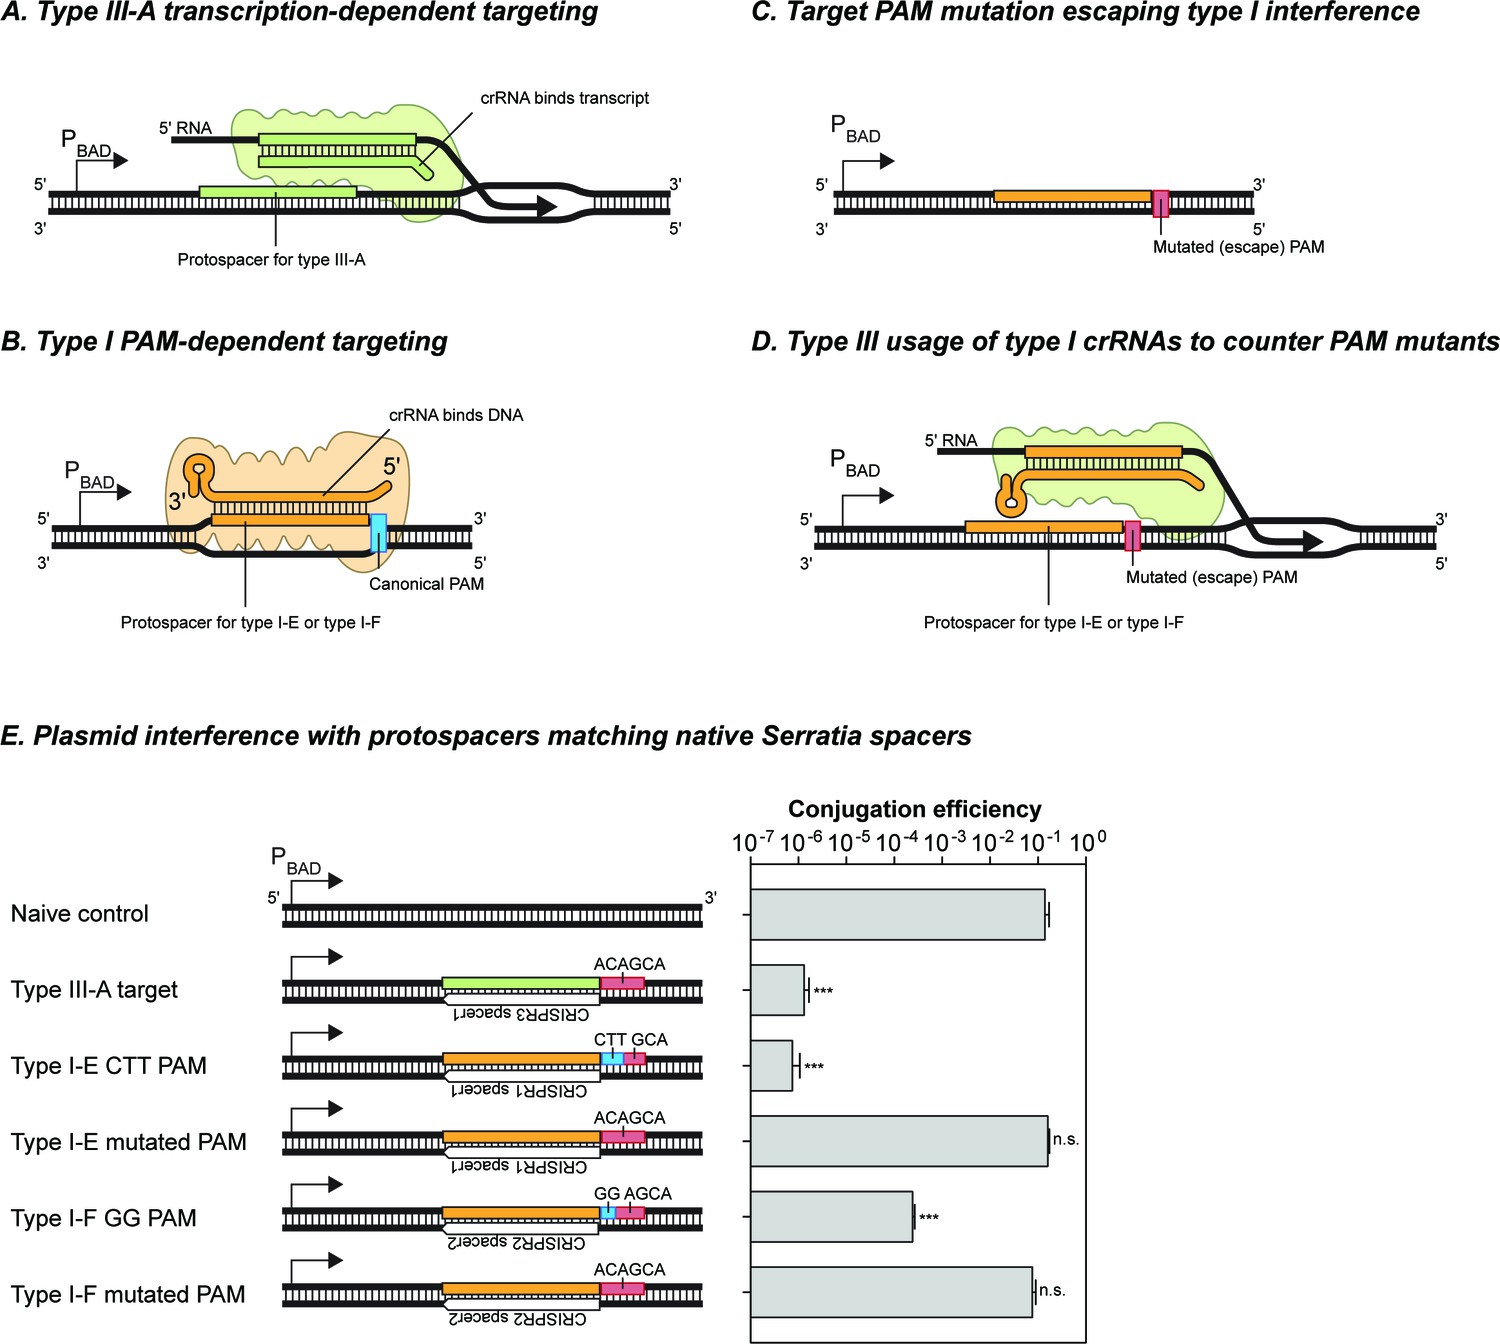
The Serratia type III-A system does not detectably utilize crRNAs from either of its type I-E or type I-F systems.
(A) Schematic of target recognition by the type III-A system using type III-A crRNAs. A protospacer sequence (reverse complement of the spacer) is expressed from the arabinose-inducible PBAD promoter. The crRNA bound to the type III-A interference complex binds the nacent RNA transcript and results in transcription-dependent DNA interference. (B) Schematic of target recongition by the type I-E and type I-F sytems. The crRNA-Cas complex recognises the canonical PAM sequence and inititates R-loop formation between the crRNA and target DNA strand. (C) Target variants with mutations in the PAM sequence evade type I interference. In the absence of a canonical PAM the binding affinity of the crRNA-Cas complex is perturbed. (D) Schematic of the hypothetical redundancy provided by type III systems to prevent the success of variants that escape type I interferenve by PAM mutations. The type III interference complex (green) binds a type I crRNA and uses it for transcription-dependent DNA interference. (E) Interference activity observed using plasmids containing different target sequences. The protospacer sequences were placed downstream of the PBAD promoter, and transcription was induced by addition of arabinose. Bars represent the SEM of 3 samples, asterisks denote statistical significance between the naïve control and specified plasmids (T-test on log-transformed conjugation efficiency values, ***p<0.001). n.s. signifies non-significant difference (p>0.05).
Figure 6
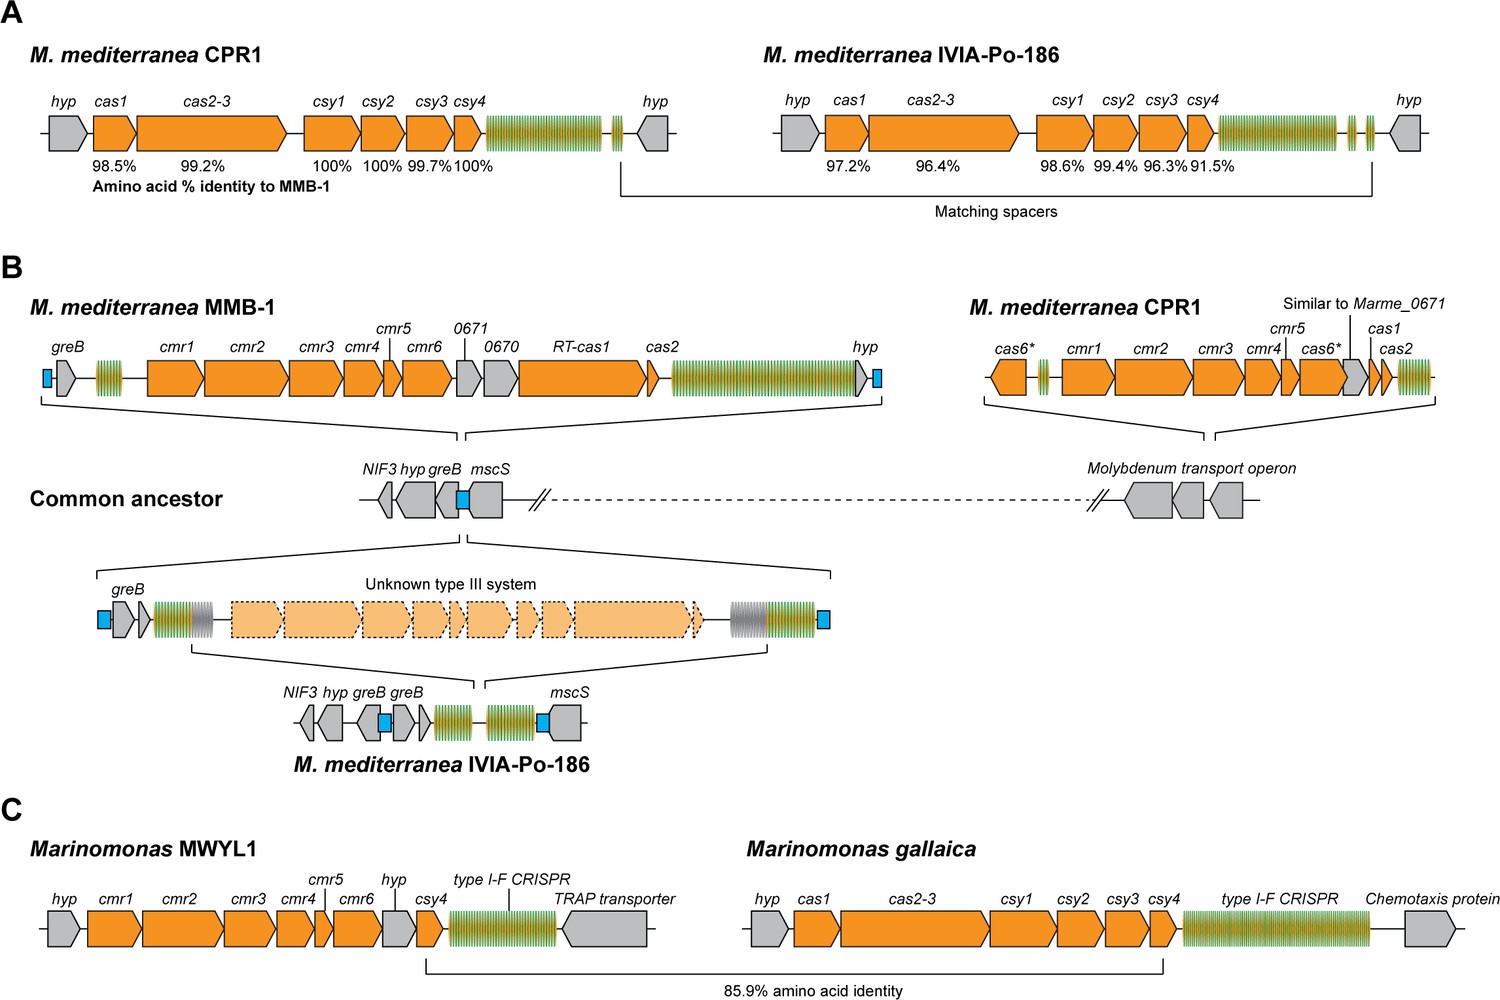
Arrangements of type I-F and type III-B CRISPR-Cas systems in Marinomonas.
(A) Schematic of the type I-F CRISPR-Cas loci in M. mediterranea CPR1 and IVIA-Po-186. The numbers below genes indicate % protein sequence identity to corresponding homologs in M. mediterranea MMB-1. (B) Schematic of the type III-B loci in the M. mediterranea strains that we sequenced. A hypothetical common ancestor lacking any type III-B systems is shown. The M. mediterranea MMB-1 type III-B system is integrated between the greB and mscS genes. The same genomic locus contains a degraded CRISPR array in M. mediterranea IVIA-Po-186, possibly as a result of recombination between CRISPRs of an ancestral type III-B operon at this site. A different type III-B system is found in M. mediterranea CPR1, integrated within the molybdenum transport operon. The greB-mscS regions in M. mediterranea IVIA-Po-186 and CPR1 were confirmed by PCR and sanger sequencing. (C) The Marinomonas sp. MWYL1 genome contains a chimeric CRISPR-Cas system with cmr genes encoding the type III-B effector complex and the type I-F pre-crRNA processing enzyme Cas6f, along with a type I-F CRISPR array. The most similar homolog of the Marinomonas sp. MWYL1 Cas6f (Csy4) is encoded in the M. gallaica type I-F system.
Figure 7 with 2 supplements
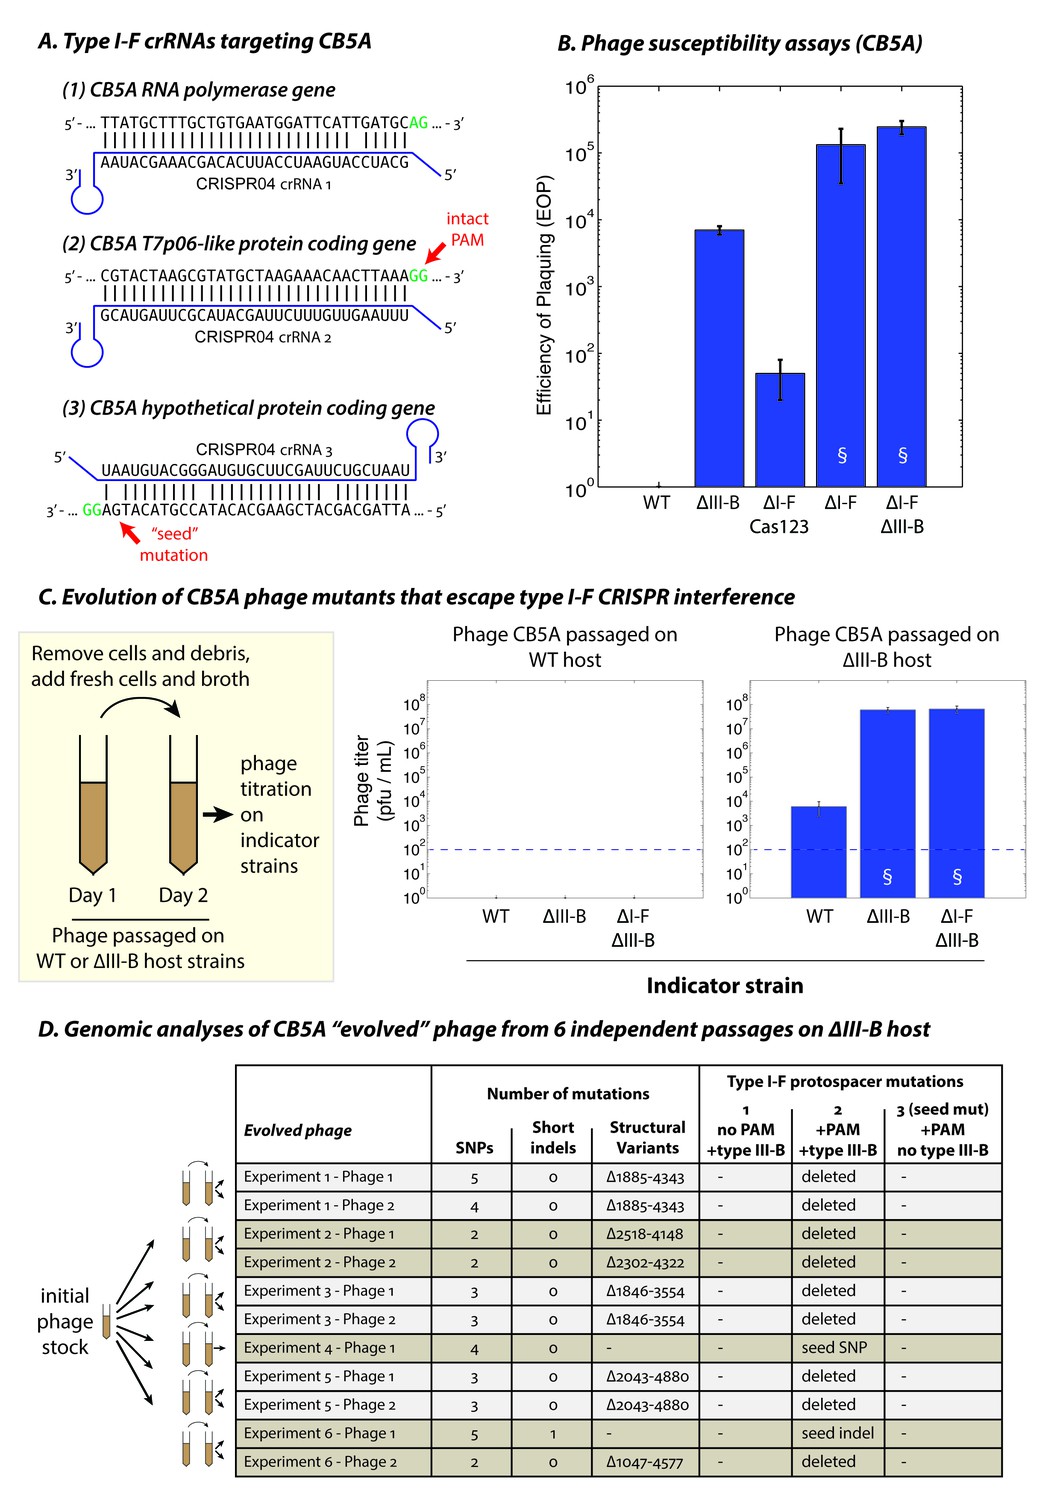
The type III-B system suppresses proliferation of phage mutants that escape type I-F defenses.
(A) The type I-F CRISPR04 array contains spacers with near-perfect 32 bp matches to targets in the CB5A RNA polymerase and the T7p06-like genes, and a third spacer with 3 mismatches (including a mutation in the ‘seed’ region) to a target in a gene encoding a hypothetical protein. CB5A bases at the positions of the canonical type I-F PAM are highlighted in green. The intact type I-F PAM (GG) at the second protospacer site is highlighted. crRNAs from both near-perfect spacers 1 and 2 would be complementary to the putative phage mRNAs, while the mismatched 3rd spacer would yield crRNAs unable to bind targeted phage mRNA (denoted by inverted alignment). (B) Susceptibility of M. mediterranea mutants to CB5A. Efficiency of plaquing (EOP) is calculated as the fold change in counts of plaque forming units (PFU) relative to WT. CB5A titers on the WT host (defined here as EOP = 1) could only be obtained at phage concentrations near the assay detection limit (100 pfu/mL). Bars indicate results from 2 independent trials. § denotes enlarged plaques. (C) Cultures of the WT and ∆III-B strains of M. mediterranea MMB-1 were inoculated with phage CB5A, and phage populations were sub-cultured the next day with fresh host cells. Phage titers were determined on WT, ∆III-B, and ∆I-F∆III-B indicator strains using the Most Probable Number method (Kott, 1966). Titers of phage populations passaged on WT and ∆III-B strains are from 3 and 6 independent experiments, respectively. § denotes enlarged plaques. Asterisks denote statistically significant differences relative to the phage titers on the WT strain (p<0.001; T-test). Phage stocks generated by passaging on WT host did not show any infectivity, even when used undiluted. Assay detection limit is indicated by dashed blue lines. (D) Whole genome sequencing assessment of the mutational landscape of 11 isolates of ‘escape’ phage from 6 evolution experiments with the ∆III-B host. The numbers of single nucleotide polymorphisms (SNPs), short insertions or deletions (indels), and large insertions, deletions, or rearrangements (structural variants) are shown. Precise chromosomal breakpoints of deletions (denoted by ∆start-end) are indicated. Corresponding mutations in the type I-F protospacer regions are also listed. Protospacers are numbered according to (A); the presence of a PAM, and the compatibility of the protospacer with type III-B interference (i.e. whether the type I-F crRNA is complementary to the phage mRNA) are indicated in the column headers for reference.
-
Figure 7—source data 1
Percent Identity and Similarity comparisons of protein products of homologous genes from phages CPG1g and CB5A.
A score of X/Y in the last column implies that a CB5A protein is X% identical and Y% similar to its cognate CPG1g protein. Chromosomal start and end positions in the CPG1g genome are noted next to the CPG1g gene accessions. A short description of the putative gene product is also included.
- https://doi.org/10.7554/eLife.27601.020
Figure 7—figure supplement 1
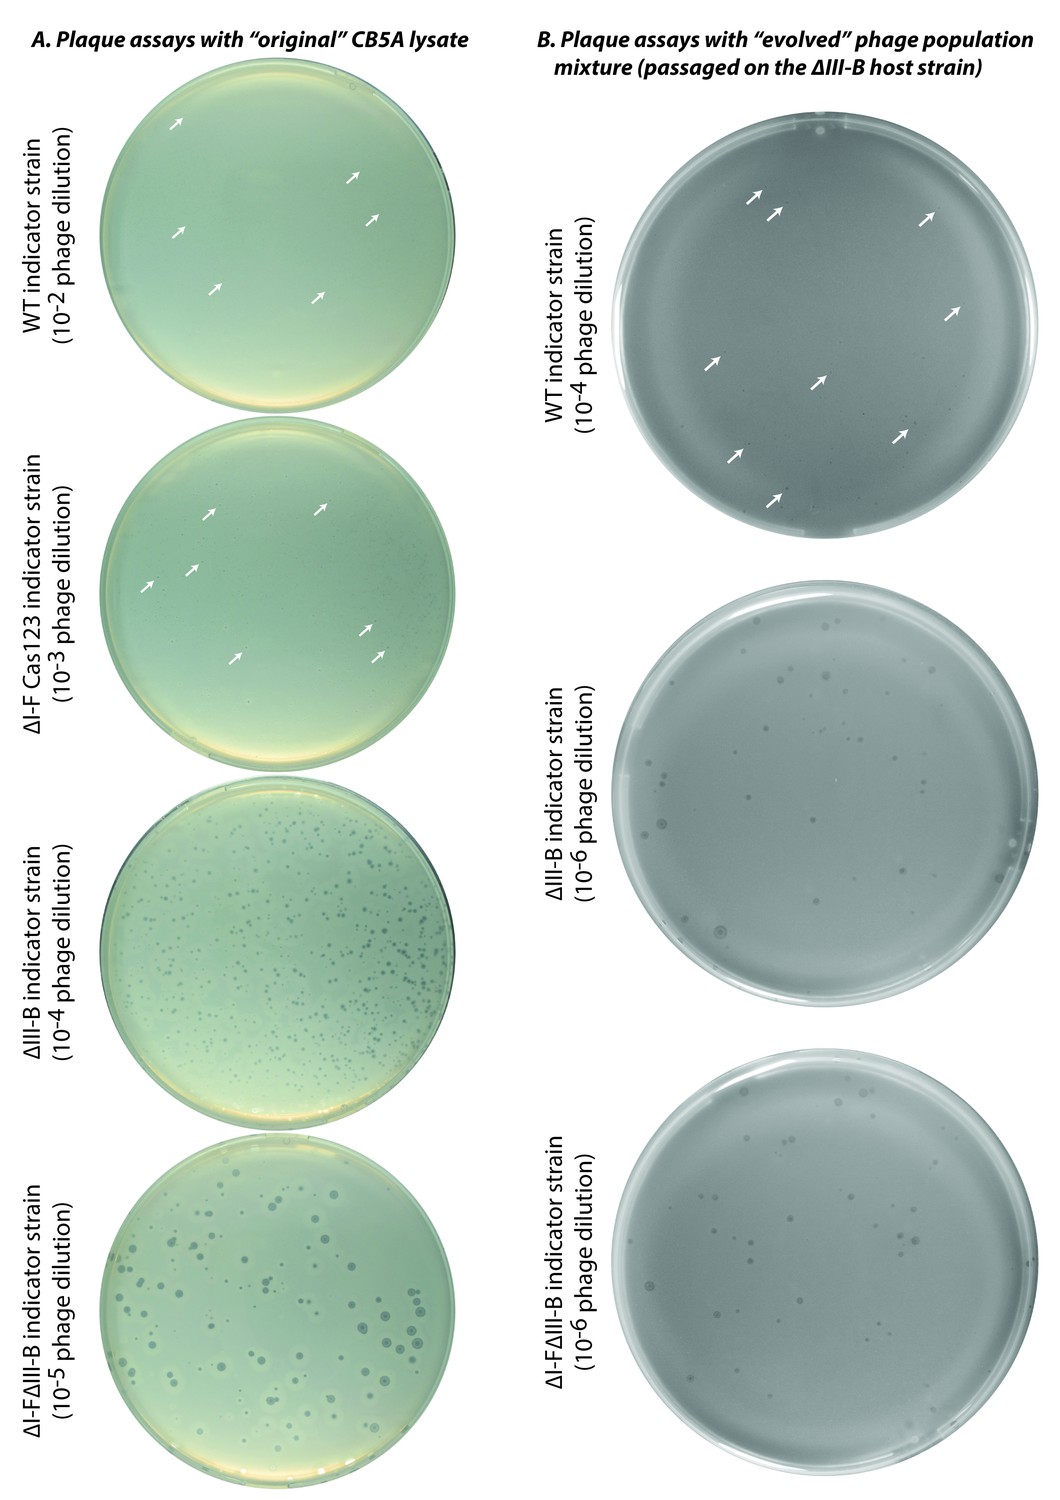
Plaque assays with ‘original’ and ‘evolved’ CB5A phage populations.
Infectivity assessments of (A) the initial CB5A stock and (B) an evolved phage population from passaging on the ∆III-B host were made with various M. mediterranea indicator strains. Dilution factors of phage lysates are indicated in parentheses. The original CB5A phage stock produces small plaques on the WT host only at the highest tested phage concentration. White arrows highlight a few small plaques for guidance. For reference, the ∆I-F Cas123 strain is deficient in type I-F CRISPR-Cas interference, the ∆III-B strain lacks the type III-B CRISPR-Cas operon, and the ∆I-F∆III-B strain contains no CRISPR-Cas interference components of either type.
Figure 7—figure supplement 2
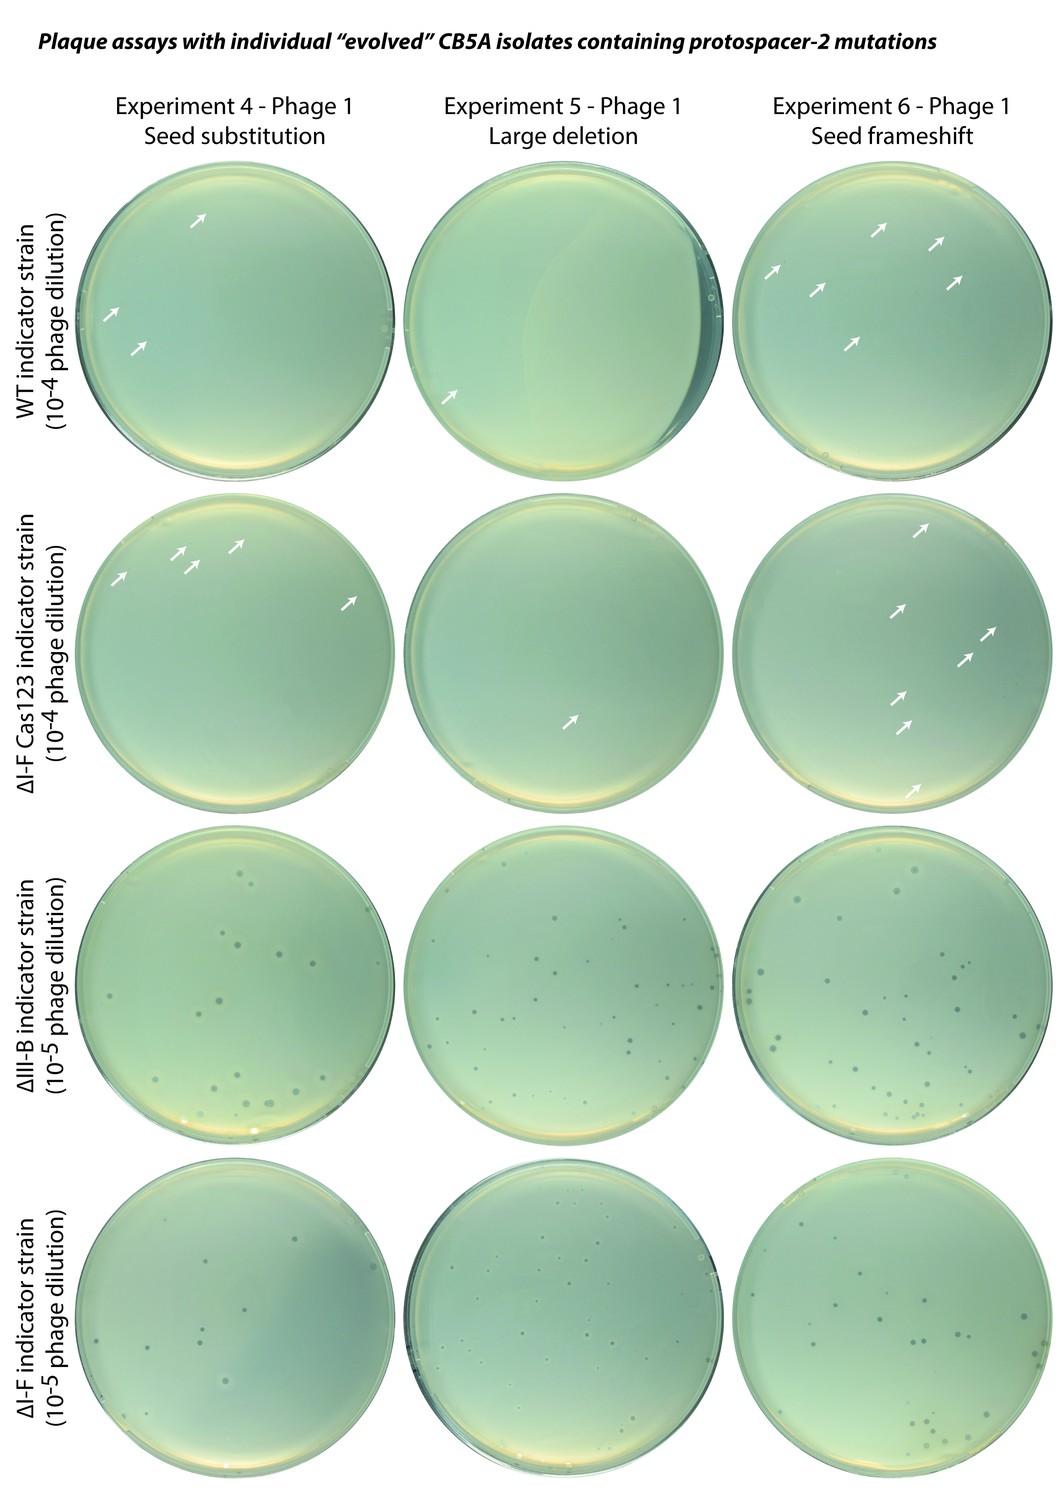
Plaque assays with ‘evolved’ CB5A phage isolates.
Infectivity assessments of individual ‘evolved’ phages obtained by passaging on the ∆III-B host. Indicator strains are listed for each row; dilution factors of phage lysates are indicated in parentheses. A few small plaques are highlighted by white arrows. For reference, the ∆I-F Cas123 strain is deficient in type I-F CRISPR-Cas interference, the ∆III-B strain lacks the type III-B CRISPR-Cas operon, and the ∆I-F strain lacks the type I-F CRISPR-Cas locus (including the CRISPR04 array), and therefore contains no spacers matching the phage genome.
Author response image 1
(As in Figure 2) Proportion of newly acquired spacers isolated from CRISPR03 mapping to sense and antisense strands of plasmid-borne genes.
Additional files
-
Supplementary file 1
Summary of all high-throughput sequencing data generated for this study.
- https://doi.org/10.7554/eLife.27601.021
-
Supplementary file 2
Sequences of the plasmids used in this study.
Names of plasmids used for interference assays specify whether the protospacers match spacers from the type III-B or I-F CRISPR arrays. RC denotes that the reverse complement of a particular configuration was used. DR signifies that the protospacer was flanked by CRISPR repeats of the same array as the spacers.
- https://doi.org/10.7554/eLife.27601.022
-
Transparent reporting form
- https://doi.org/10.7554/eLife.27601.023
Download links
A two-part list of links to download the article, or parts of the article, in various formats.
Downloads (link to download the article as PDF)
Open citations (links to open the citations from this article in various online reference manager services)
Cite this article (links to download the citations from this article in formats compatible with various reference manager tools)
Type III CRISPR-Cas systems can provide redundancy to counteract viral escape from type I systems
eLife 6:e27601.
https://doi.org/10.7554/eLife.27601


