Germ cell connectivity enhances cell death in response to DNA damage in the Drosophila testis
- University of Michigan, United States
Figures
Figure 1 with 3 supplements
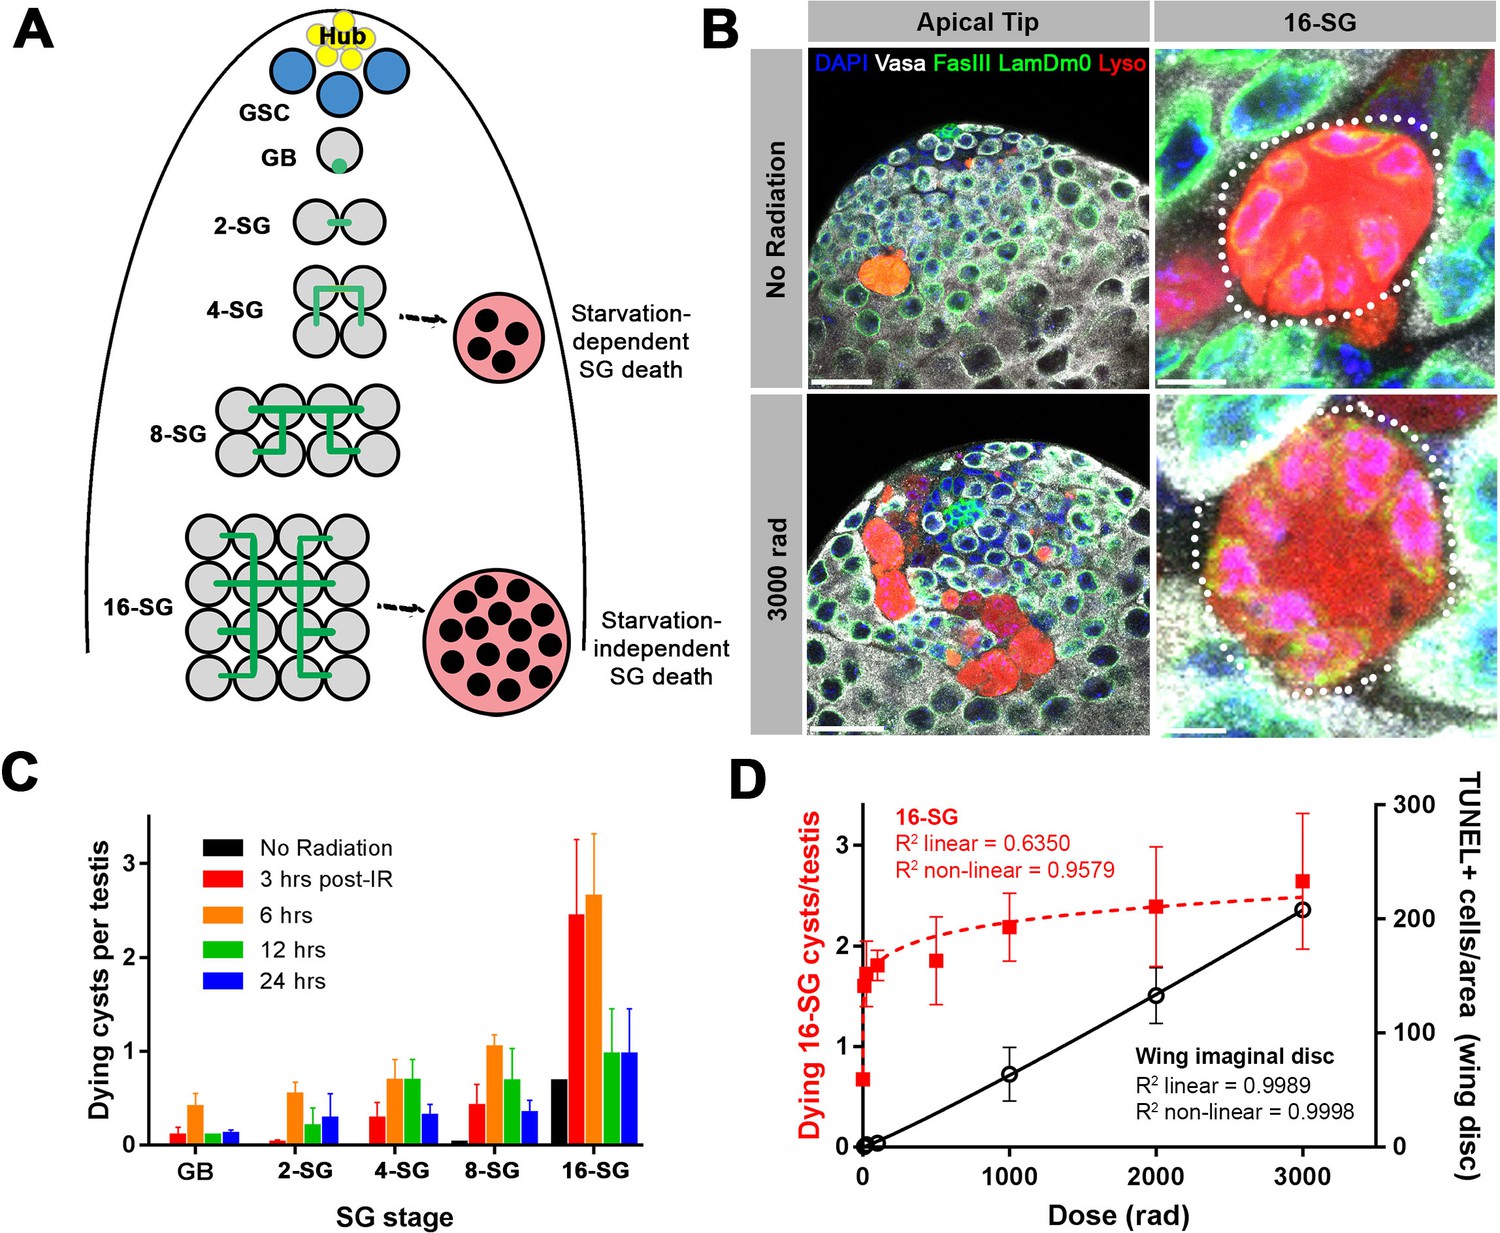
A high level of SG death in response to ionizing radiation.
(A) Illustration of SG development and germ cell death in the Drosophila testis. (B) An example of the testis apical tip (left panels) with dying SGs marked by Lysotracker staining in control and irradiated flies. High magnification images of dying 16-SGs (dotted outline) are shown in right panels. Lysotracker (red), Vasa (white), FasIII and Lamin Dm0 (green), and DAPI (blue). Bars: 25 µm (left panels), 5 μm (right panels). (C) Quantification of dying SG cysts by stage from 3 to 24 hr after 3000 rad (Mean ±SD). n ≥ 17 testes, repeated in triplicate. It should be noted that the SG death frequency was scored as ‘number of dying SG cysts at each stage per testis’. We have shown that the number of SG cysts is consistently ~5–6 cysts per stage per testis (Yang and Yamashita, 2015), justifying the use of ‘number of dying SG cysts/testis’ as a proxy for frequency of SG cyst death. (D) Number of Lysotracker-positive 16-SG cysts (red) and TUNEL-positive wing imaginal disc cells (black) 6 hr post-irradiation as a function of radiation dose (Mean ±SD). n ≥ 17 testes, and n ≥ 3 wing discs, repeated in triplicate. Best fit lines shown determined by non-linear regression.
Figure 1—figure supplement 1
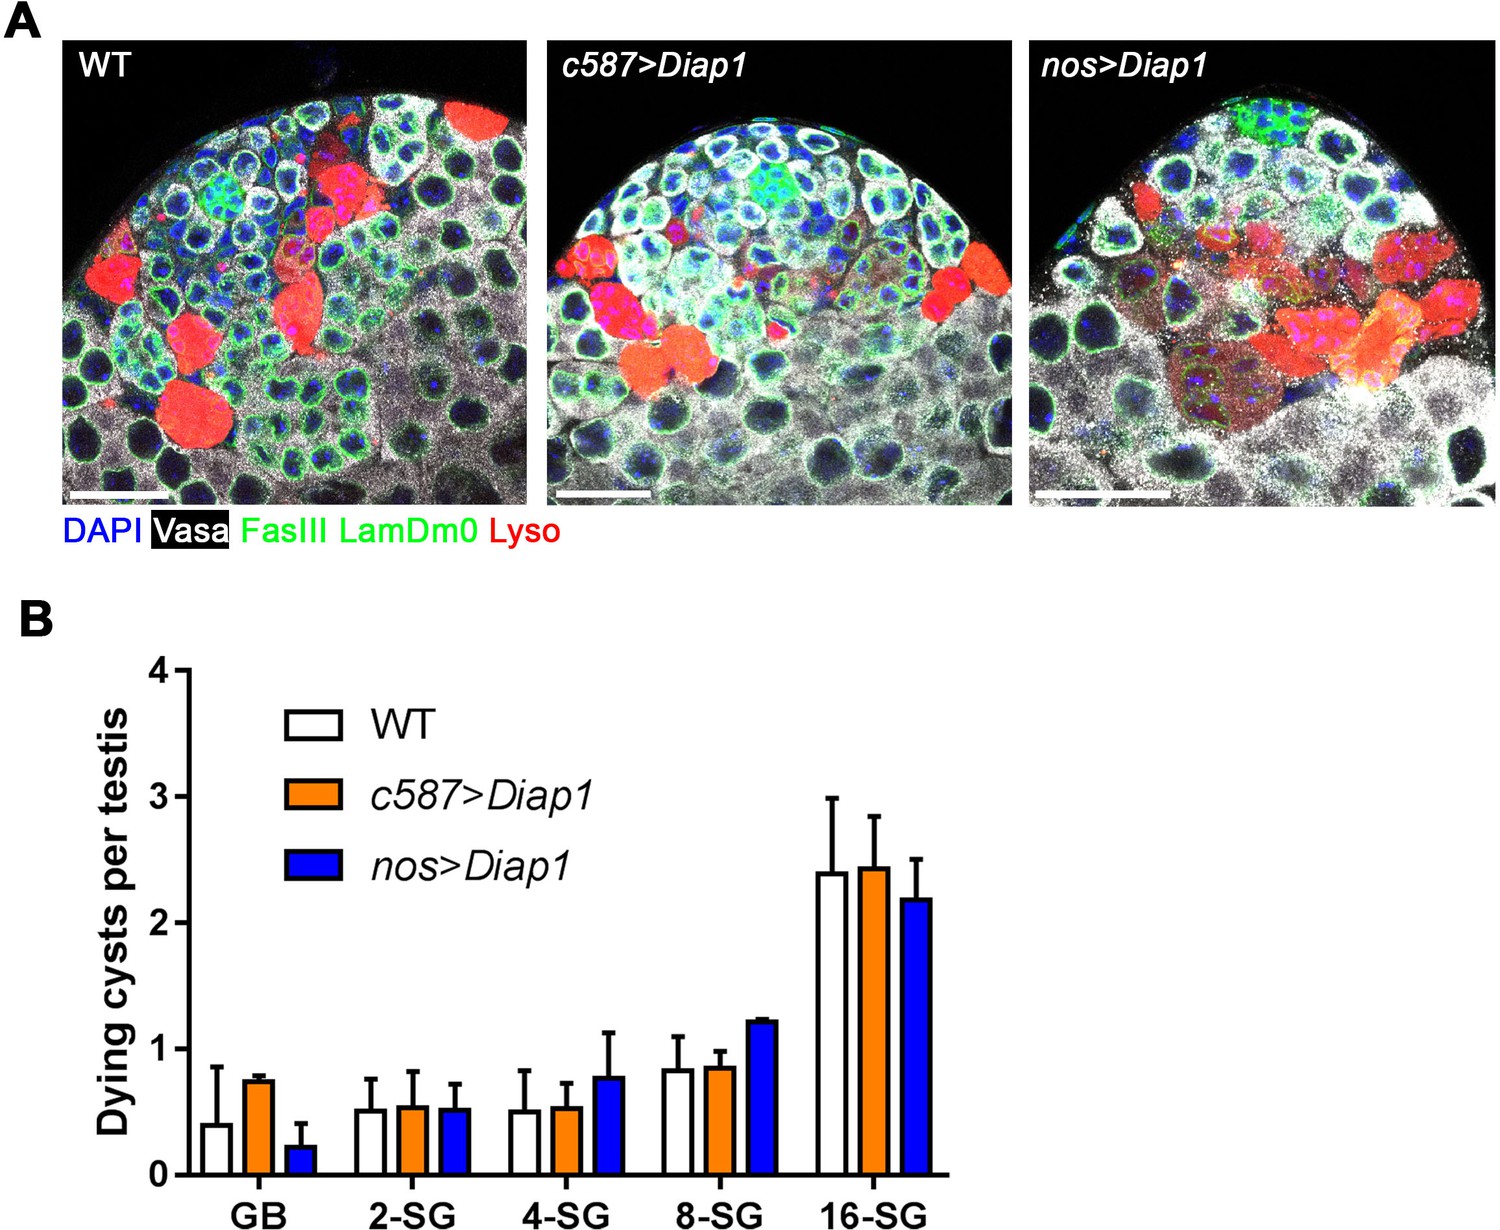
Radiation-induced SG cyst death is independent of somatic cyst cell apoptosis.
(A) Representative images of testes apical tips from wild type, c587-gal4 > UAS-Diap1 (cyst cell apoptosis suppression), and nos-gal4 > UAS-Diap1 (SG apoptosis suppression) expressing flies six hours after 2000 rad. Lysotracker (red), Vasa (white), FasIII and Lamin Dm0 (green), DAPI (blue). Bars: 25 µm. (B) Quantification of dying SG cysts by stage from above (Mean ±SD), testes sample n ≥ 15 repeated in triplicate for each. No significant differences at any SG stage between wild type vs. c587-gal4 > UAS-Diap1, or nos-gal4 > UAS-Diap1 (p-value *<0.05 t-test).
Figure 1—figure supplement 2
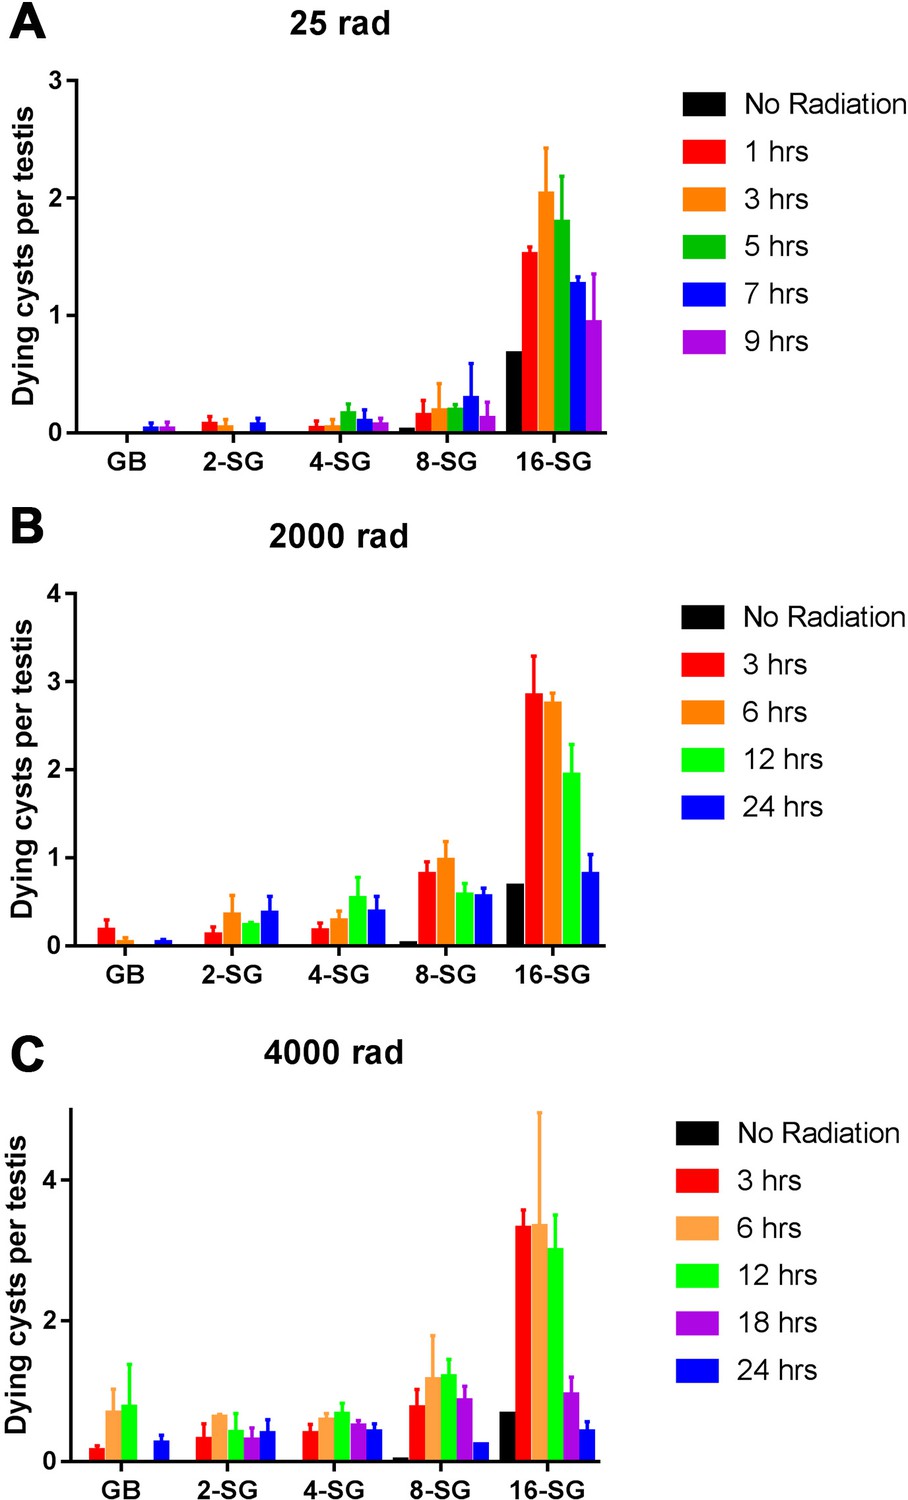
SG death in response to ionizing radiation.
Quantification of SG death by stage and time following varying doses of ionizing radiation. (A) 25 rad (n = 66 testes), (B) 2000 rad (n = 84 testes), (C) 4000 rad (n = 68 testes).
Figure 1—figure supplement 3
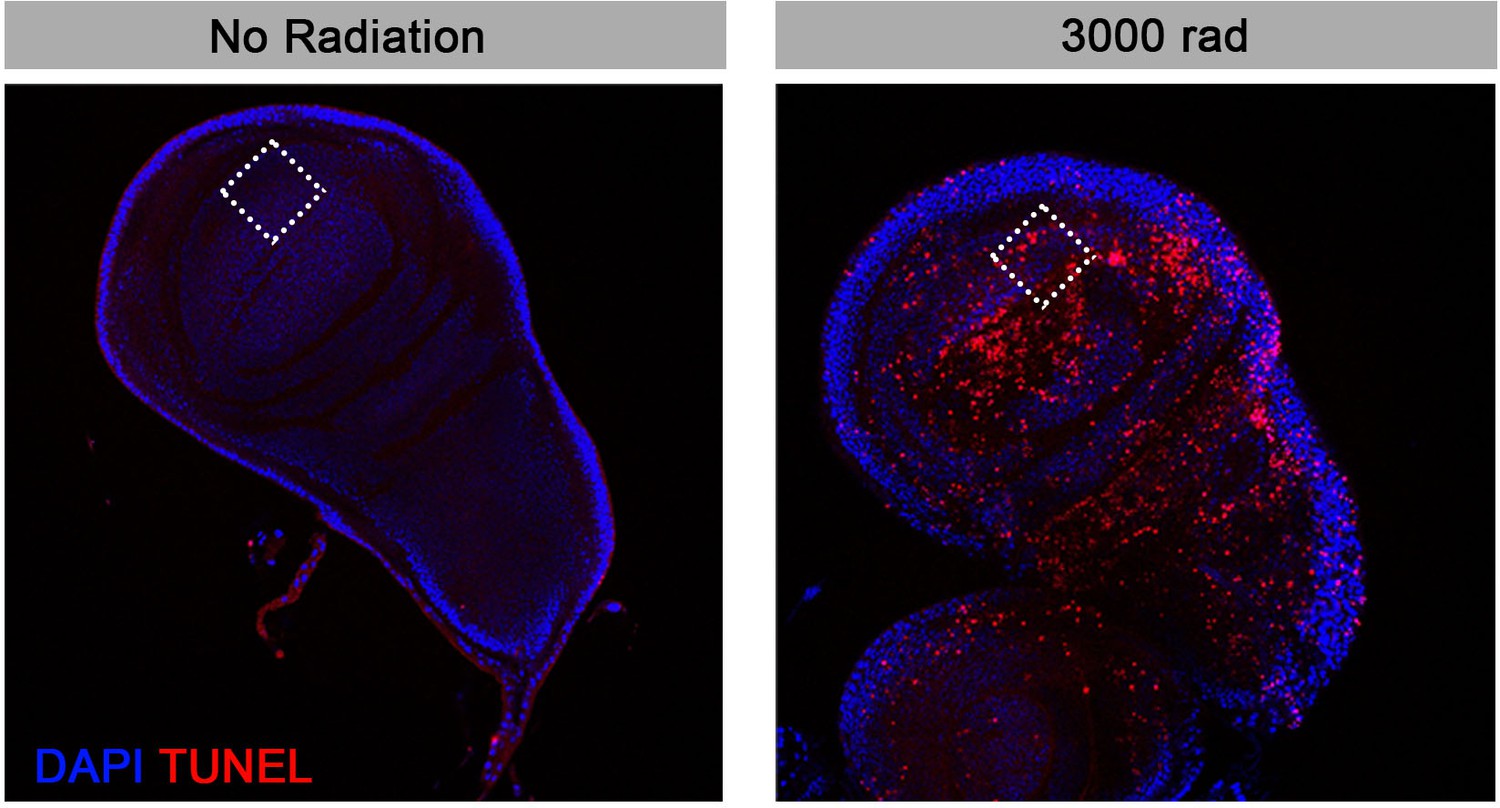
TUNEL staining to detect somatic cell death in response to ionizing radiation.
TUNEL-positive foci were quantified in a defined 50 μm2 field (dotted square) through entire z-sections in the anterior-ventral compartment of the wing imaginal discs from L3 larvae.
Figure 2 with 2 supplements
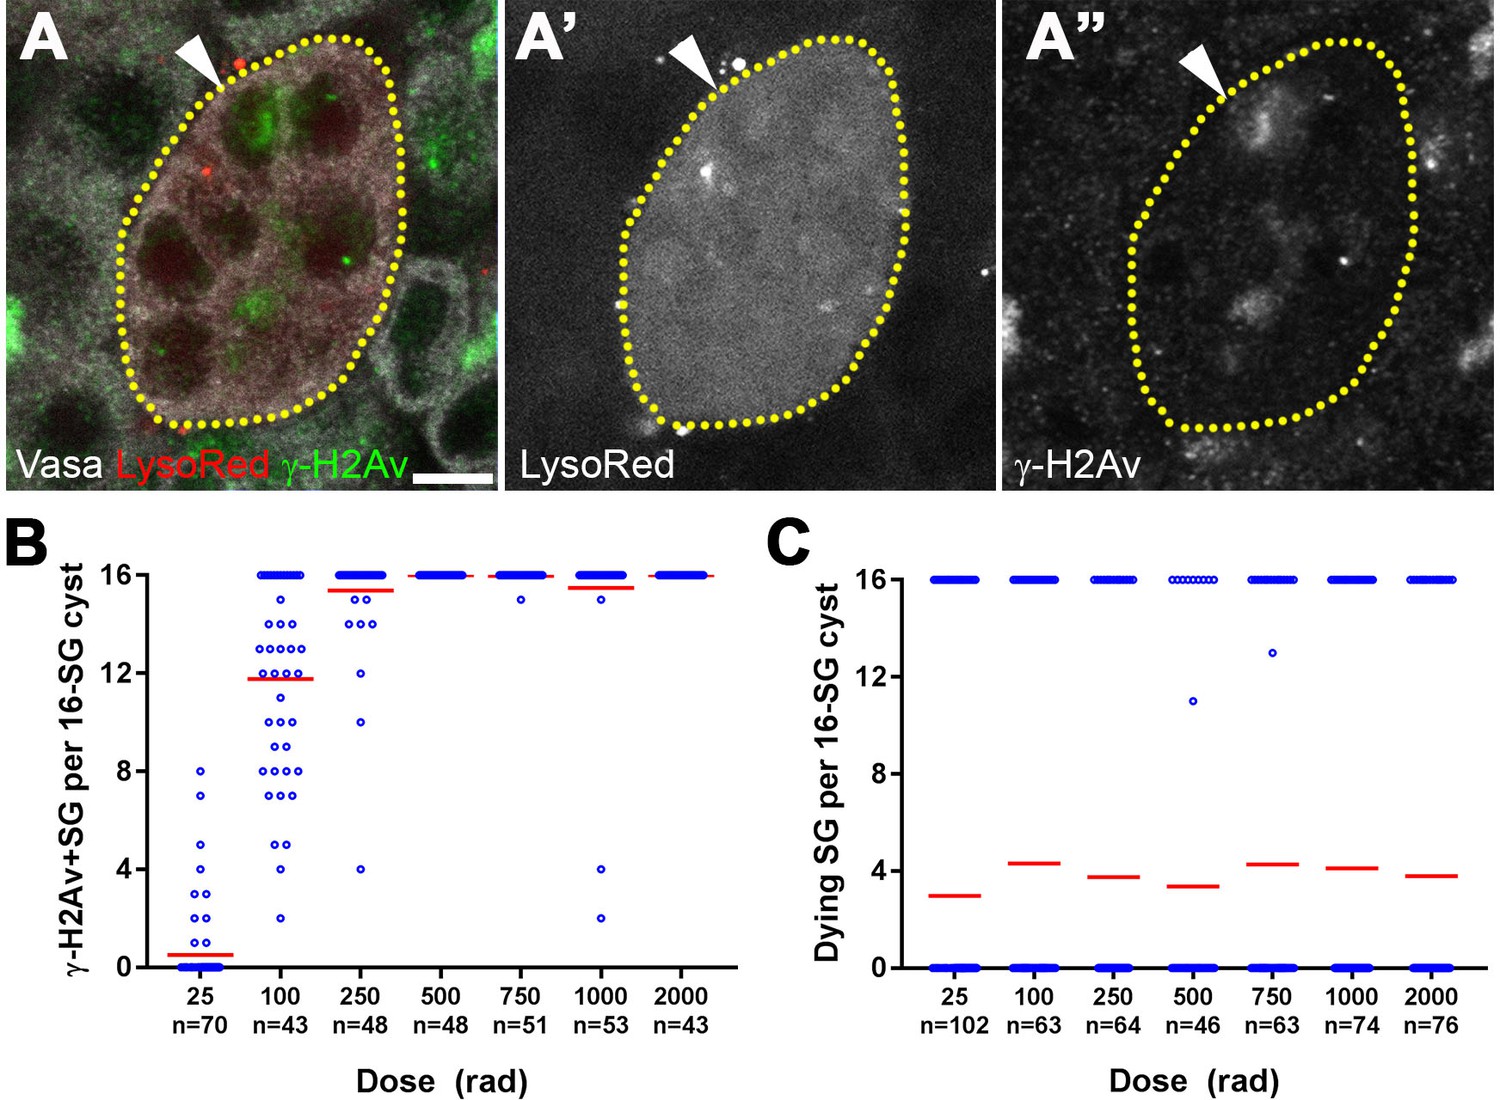
All SGs within a cyst die even when only a fraction of cells exhibit detectable DNA damage.
(A) An example of a dying 16-SG cyst (yellow dotted outline) with only a subset of SGs containing detectable DNA damage (arrowhead). γ-H2Av (green), Lysotracker (red), Vasa (white). Bar: 5 µm. (B) Number of γ-H2Av-positive cells within each 16-SG cyst at various radiation doses. Blue circles, individual data points. Red line, mean. n = number of 16-SG cysts scored. (C) Number of Lysotracker-positive cells within each 16-SG cyst. Blue circles, individual data points. Red line, mean. n = number of 16-SG cysts scored.
Figure 2—figure supplement 1
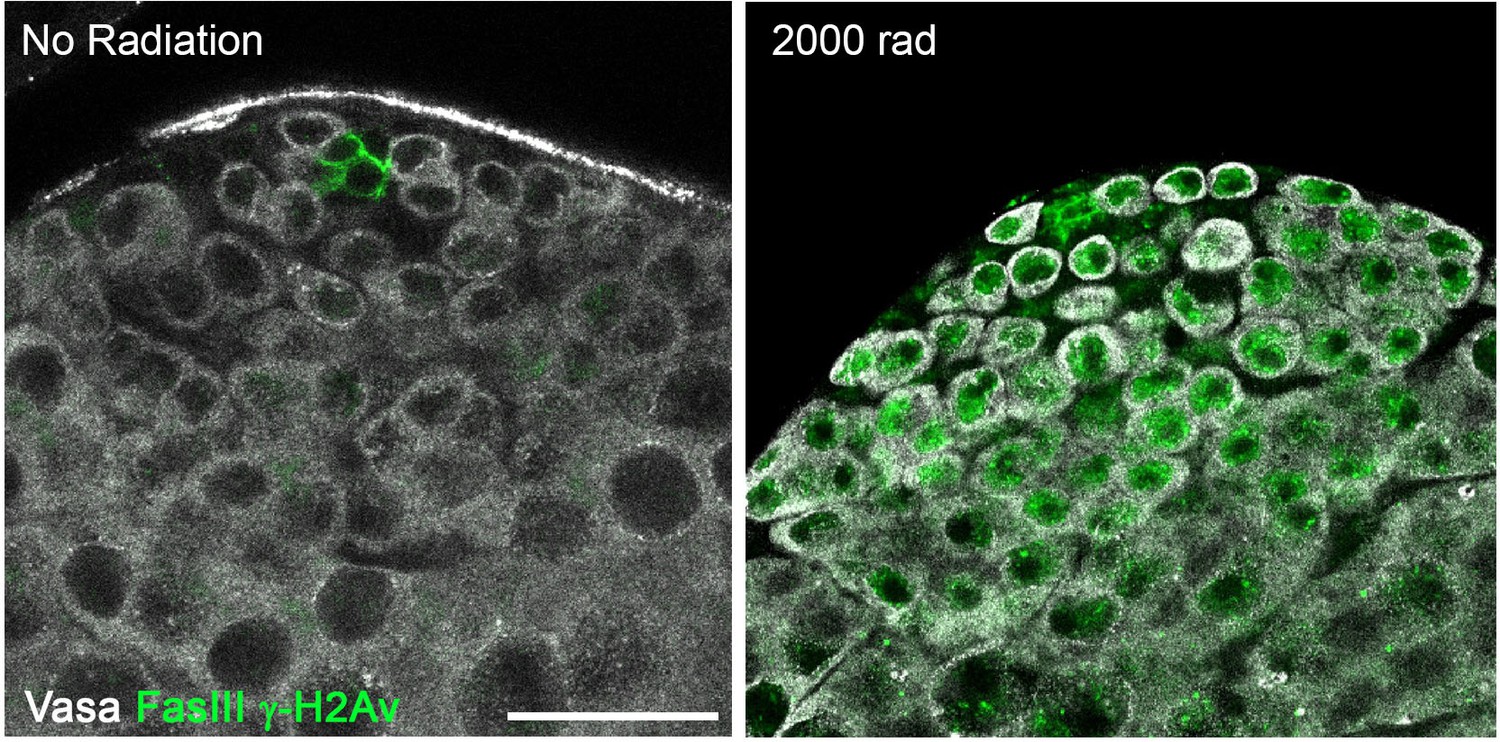
γ-H2Av can be strongly detected in germ cells following irradiation.
Representative images of testes apical tips from unirradiated and irradiated flies. Vasa (white), FasIII and γ-H2Av (green). Bar: 25 µm.
Figure 2—figure supplement 2

All SG stages show gradual accumulation of γ-H2Av-positive cells with increasing radiation.
Number of γ-H2Av-positive cells per cyst at increasing radiation doses in (A) germline stem cells (B) gonialblasts (C) 2-SG (D) 4-SG (E) 8-SG. Red line, mean. n = number of 16-SG cysts scored.
Figure 3 with 3 supplements
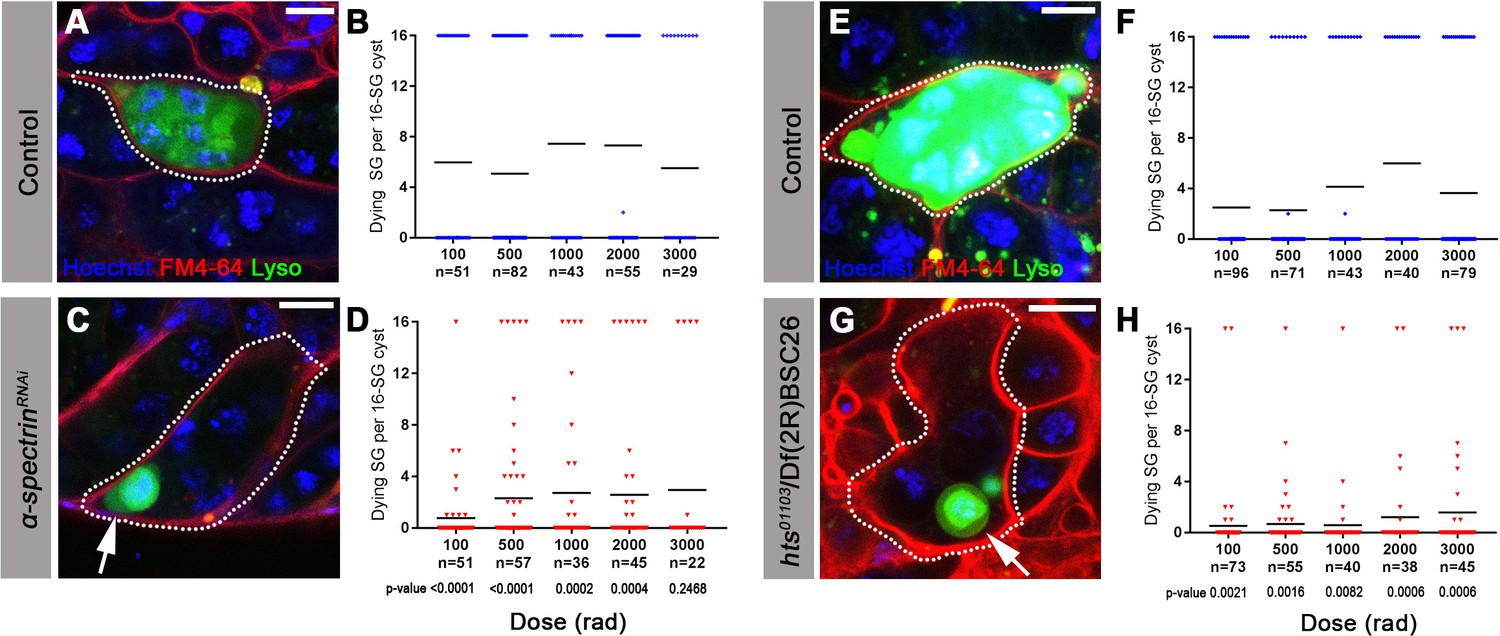
The fusome is required for synchronized all-or-none SG death within a cyst.
(A) A Lysotracker-positive 16-SG cyst (green, dotted outline) in unfixed control testes, with cyst borders marked by FM4–64 (red) and SG nuclei marked by Hoechst 33342 (blue). Bar: 7.5 µm. (B) Number of Lysotracker-positive cells within each 16-SG cyst of control testes at varying radiation doses. Black line, mean. n = number of 16-SG cysts scored. (C) A 16-SG cyst (dotted outline) in nos-gal4 >UAS-α-spectrinRNAi testes containing a single Lysotracker-positive SG (arrowhead). Bar: 10 μm. (D) Number of Lysotracker-positive cells within each 16-SG cyst of nos-gal4 >UAS-α-spectrinRNAi testes at varying radiation doses. Black line, mean. n = number of 16-SG cysts scored. P-values (comparing the corresponding radiation doses between control and mutant) determined by chi-squared test (See methods). (E, F) hts01103/+ control testes. Bar: 5 μm. (G, H) hts01103/Df(2R)BSC26 mutant testes. Bar: 7.5 μm.
Figure 3—figure supplement 1
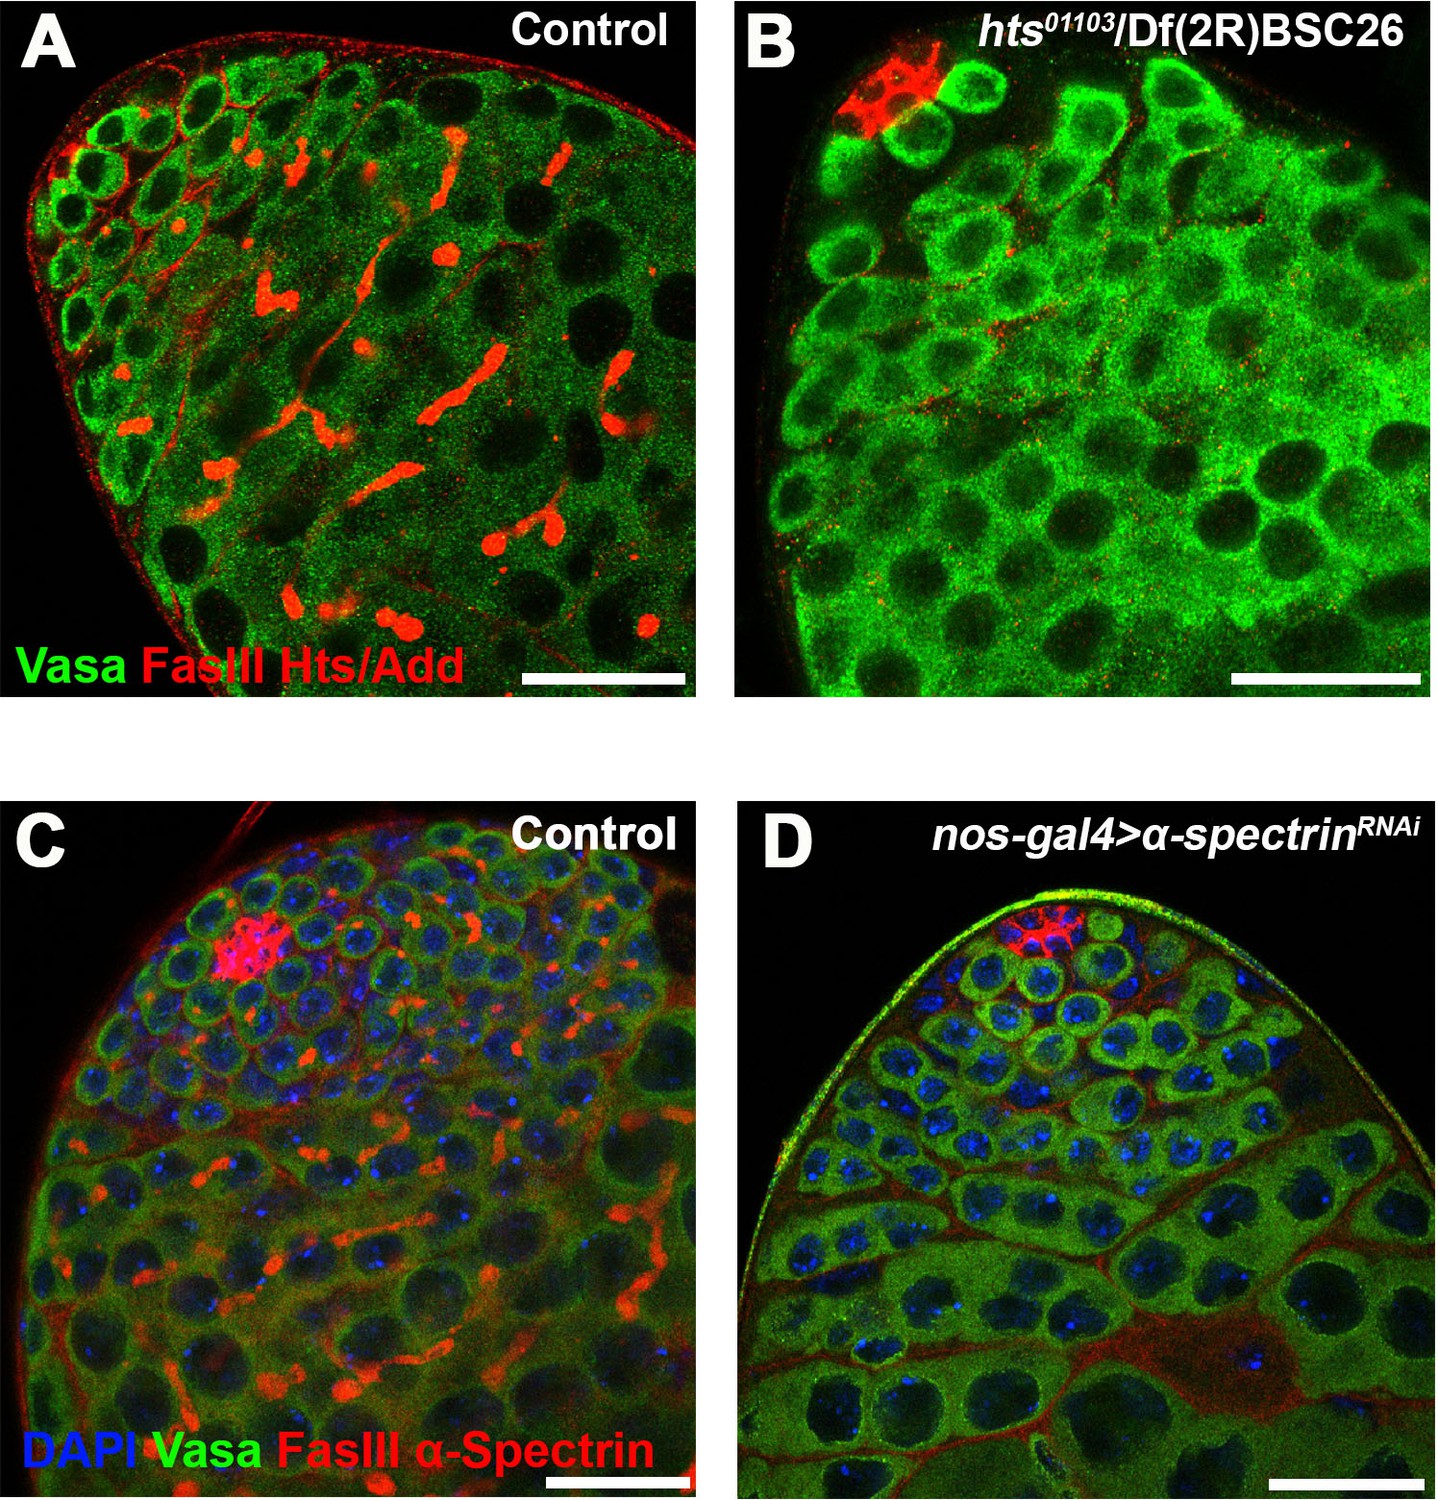
Validation of fusome elimination in hts mutant and α-spectrinRNAi testes.
(A, B) Hts/Adducin staining (red) in control (A) and hts01103/Df(2R)BSC26 mutant (B) testes. Red: Hts/Add and FasIII. Green: Vasa (germ cells). Bars: 25 µm. Note that hts mutation eliminates fusome staining (leaving FasIII staining of the hub cells). (C, D) α-Spectrin staining (red) in control (C) and nos-gal4 >UAS spectrinRNAi (D) testes. α-Spectrin and FasIII (red), Vasas (green), DAPI (blue).
Figure 3—figure supplement 2
SG ring canals are maintained in fusome mutants.
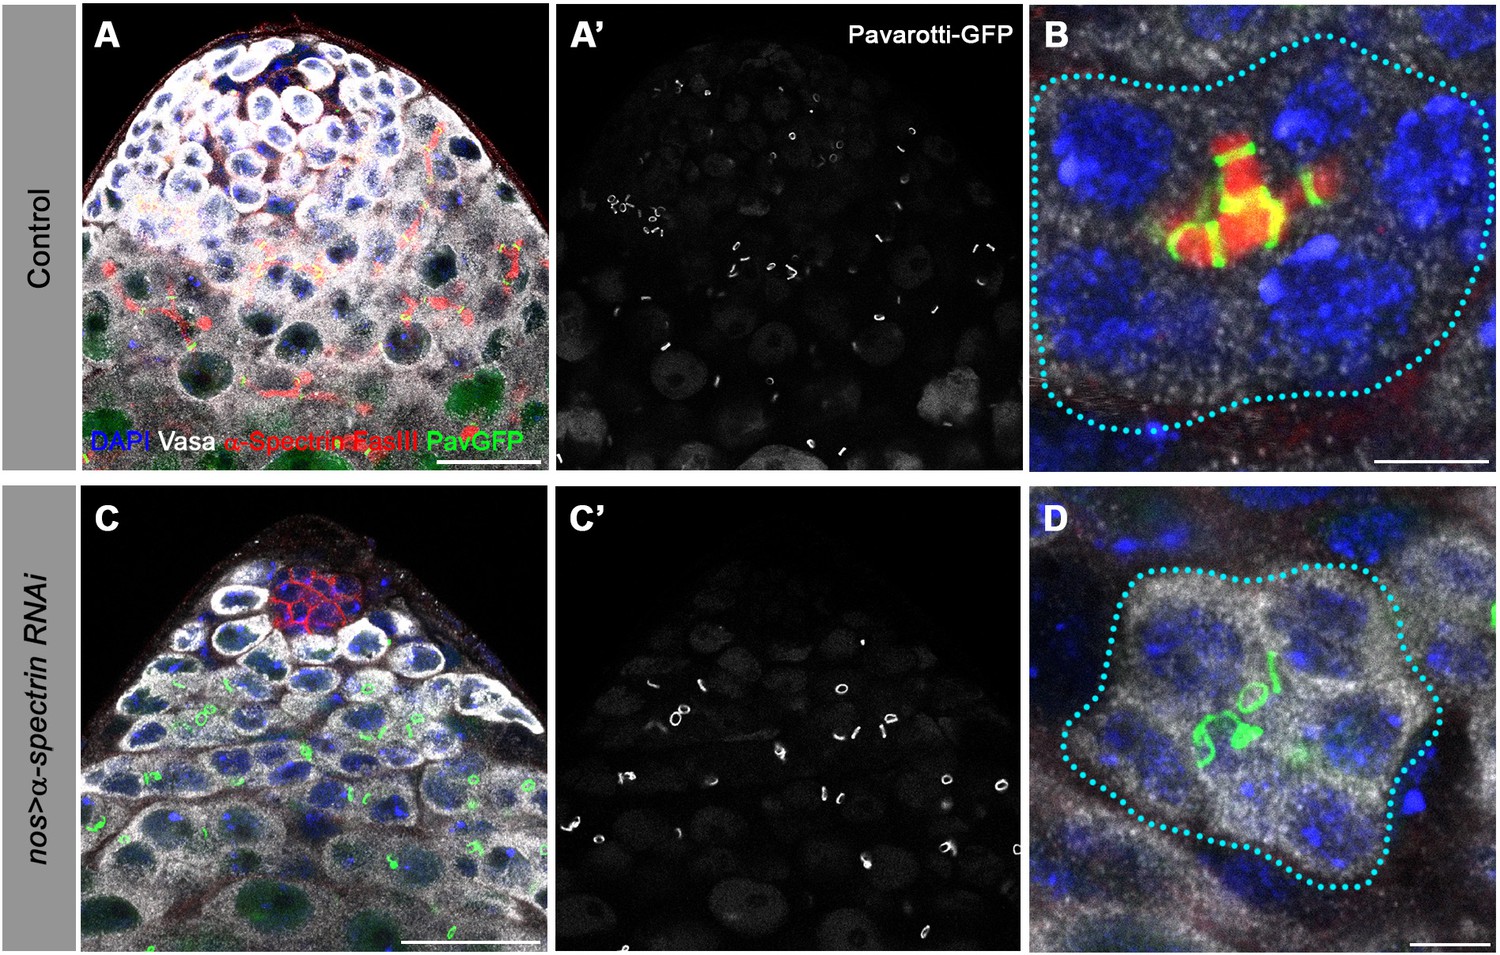
Apical tip of testes from (A) control and (C) nos-gal4 >UAS spectrinRNAi flies stained for DAPI (blue), Vasa (white), FasIII and α-Spectrin (red), and Pavarotti-GFP (green). Bars: 25 μm. SG cysts from (B) control and (D) nos-gal4 >UAS spectrinRNAi flies. Bars: 5 μm.
Figure 3—figure supplement 3
Follicle cell death in response to irradiation.
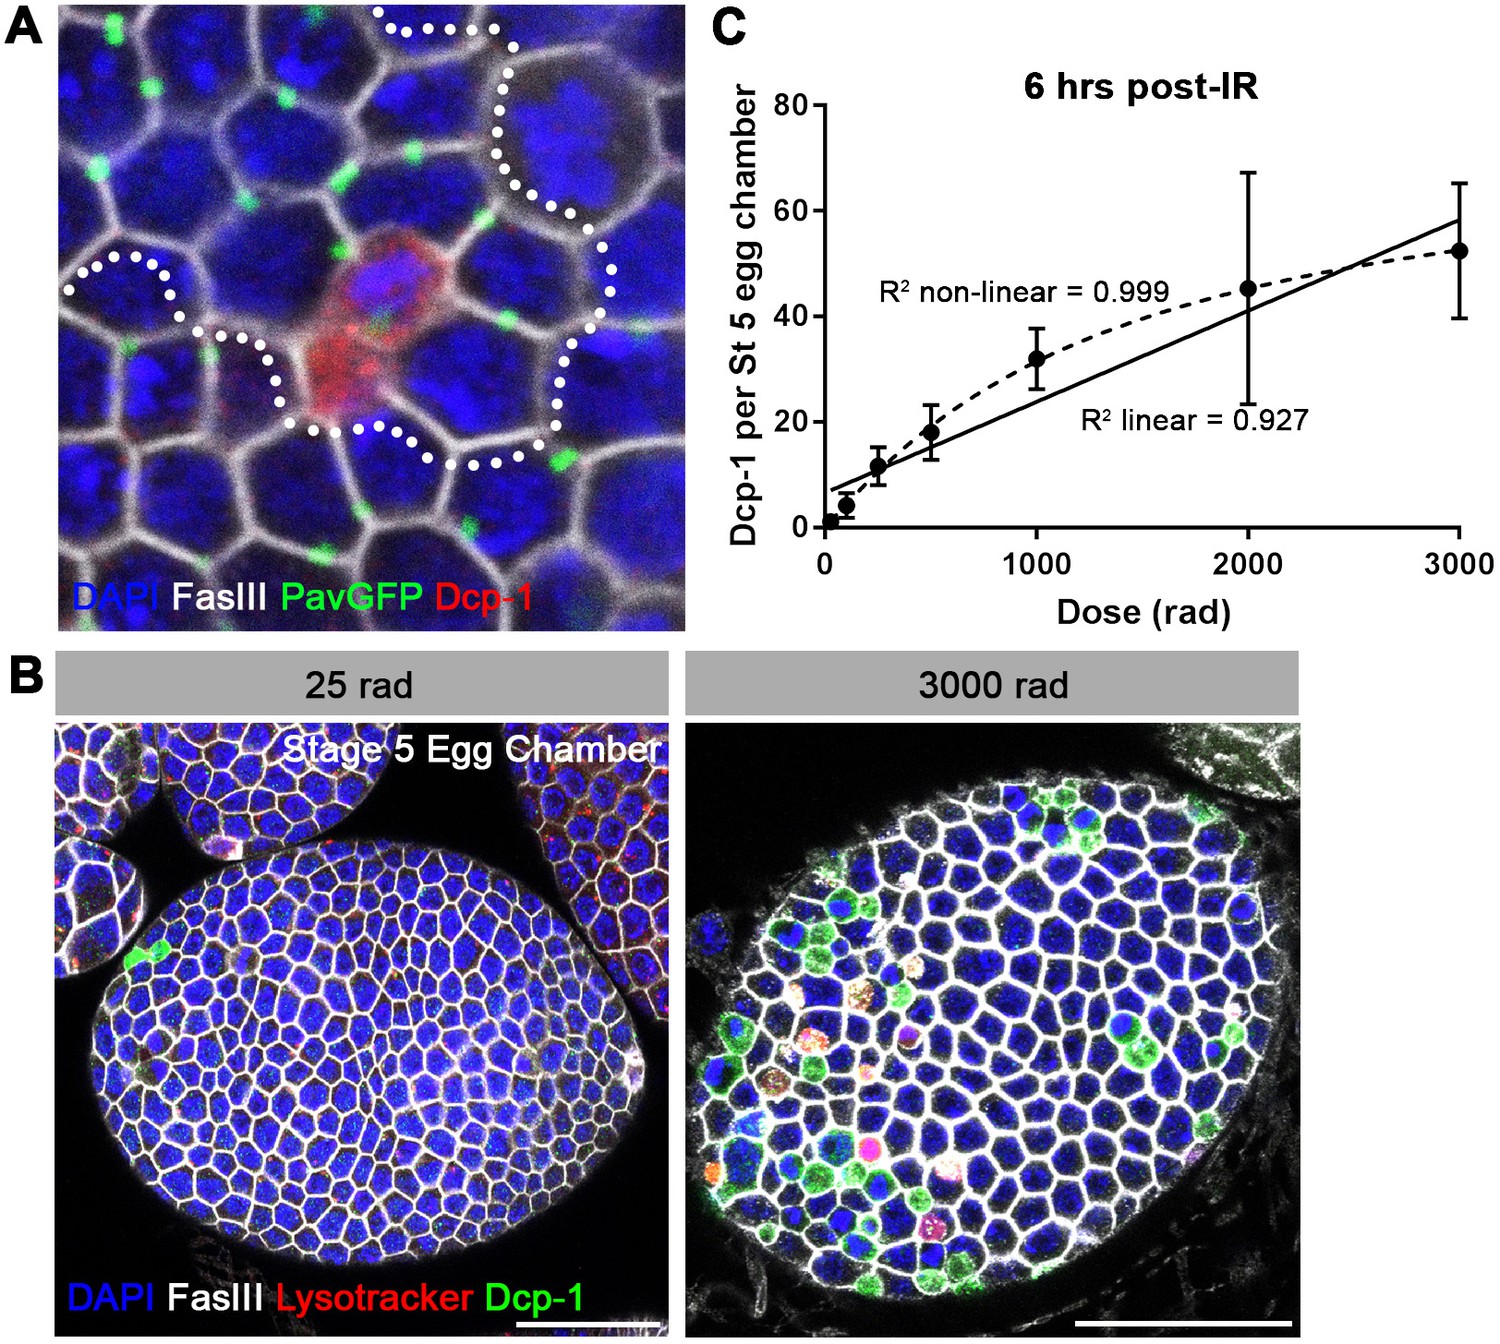
(A) Dcp-1 staining (red) in interconnected ‘clone’ of follicle cells (dotted outline). The boundary of follicle cell clone was determined by following the connectivity visualized by Pavarotti-GFP (green) (McLean and Cooley, 2013a). DAPI (blue), FasIII (white). Bar: 5 μm. (B) Cleaved caspase Dcp-1 staining (green) in stage 5 egg chambers at 6 hr following low or high dose radiation. Lysotracker (red), DAPI (blue), FasIII (white). Bars: 25 μm. Note that follicle cells die via apoptosis, exhibiting cleaved caspase signal. Lysotoracker did not overlap with cleaved caspase, and was not distributed evenly in the cytoplasm as is the case for germ cell death. Thus, lysotracker signal in follicle cells might represent phagocytosis to engulf dead follicle cells. (C) Number of Dcp-1-positive follicle cells in stage 5 egg chambers 6 hr post-irradiation as a function of radiation dose (Mean ±SD). n ≥ 6 egg chambers, repeated in triplicate. Although the data fits to a non-linear model (R2 == 0.999) slightly better than a linear model (R2 = 0.927), follicle cell death does not exhibit steep increase in cell death at low doses (≤100 rad).
Figure 4

The mitochondrial proteins HtrA2/Omi and Endonuclease G are required for all-or-none SG death.
(A) SG cysts (dotted outlines) in OmiΔ1/OmiDf1 mutant testes containing individual Lysotracker-positive SGs (arrows). Hoechst 33342 (blue), FM 4–64 (red), Lysotracker (green). Bar: 10 µm. (B) Number of Lysotracker-positive SGs in each 16-SG cyst in OmiΔ1/OmiDf1, OmiΔ1/+, and wild type testes. Black line, mean. n ≥ 43 cysts per dose. (C) 16-SG cyst (dotted outline) in EndoGMB07150/Df(3R)BSC699 testes containing individual Lysotracker-positive SGs. Hoechst 33342 (blue), FM 4–64 (red), Lysotracker (green). Bar: 10 µm. (D) Number of Lysotracker-positive SGs in each 16-SG cyst in EndoGMB07150/Df(3R)BSC699 and EndoGMB07150/+ testes. Black line, mean. n ≥ 37 cysts per dose.
Figure 5 with 2 supplements
p53 and mnk/chk2 suppress SG death but do not regulate the all-or-none mode of SG death.
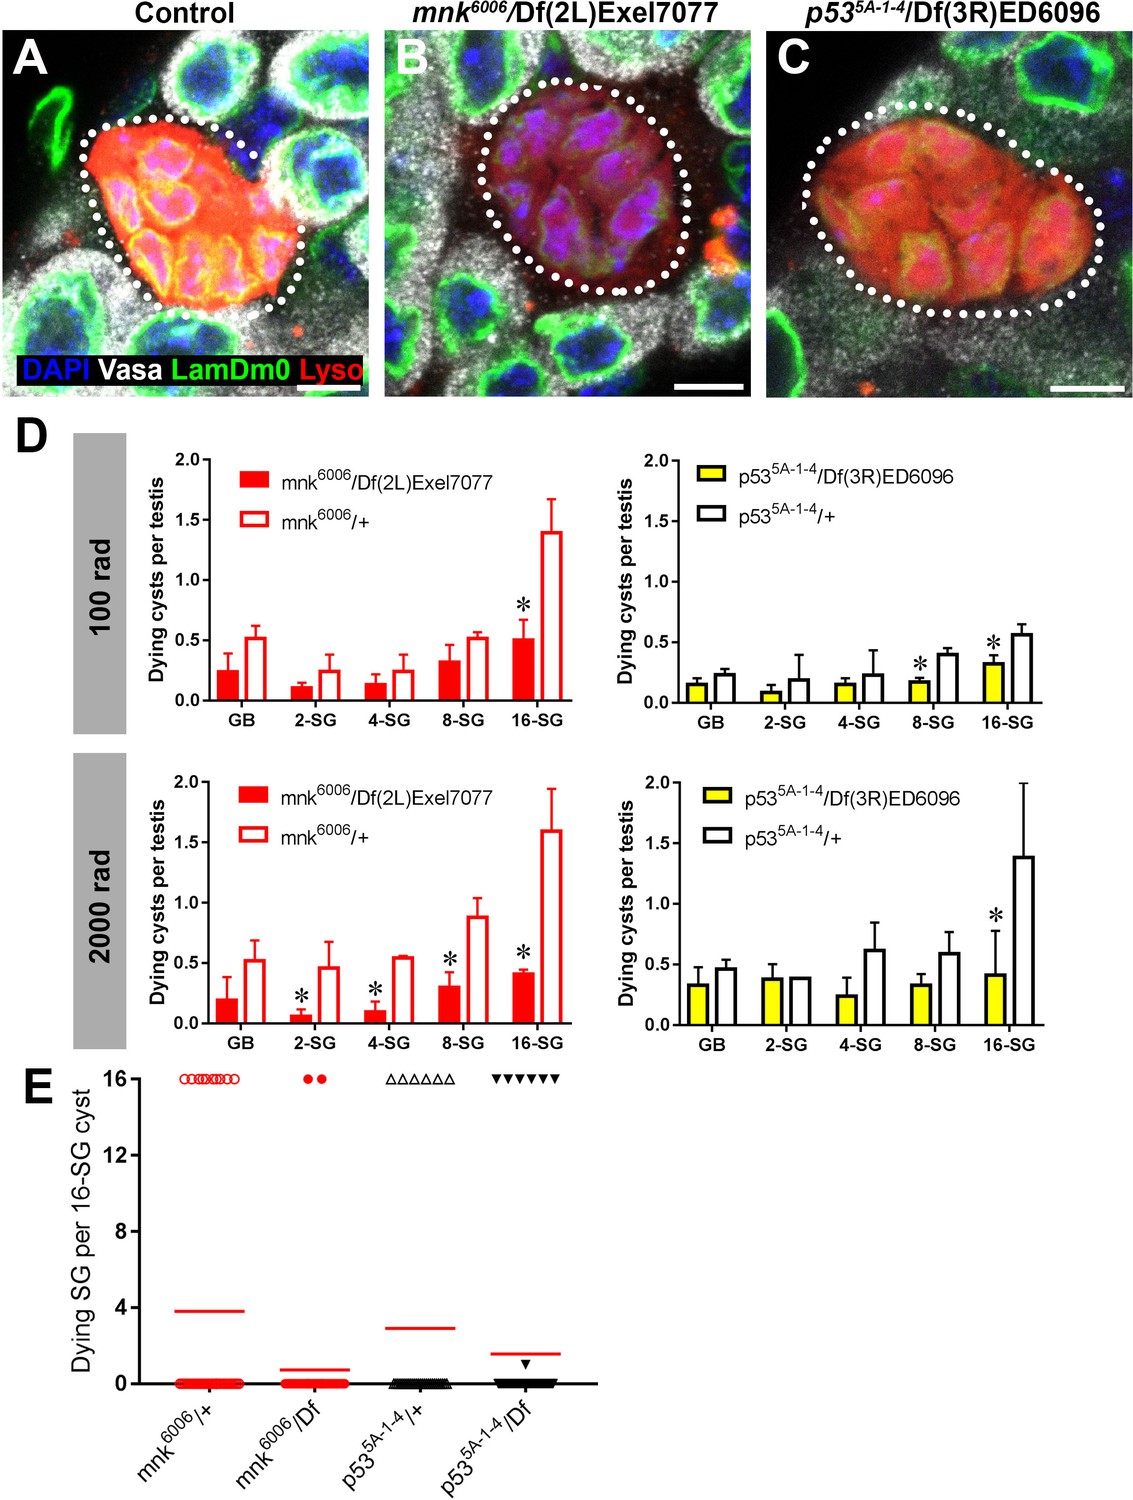
(A–C) Examples of dying 16-SGs (dotted outline) in wild-type (A), mnk6006/Df(2L)Exel7077 mutant (B), and p535A-1-4/Df(3R)ED6096 mutant (C) testes. Lysotracker (red), Lamin Dm0 (green), DAPI (blue) and Vasa (white). Bars: 5 µm. (D) SG cyst death by stage in mnk/chk2 and p53 mutants 6 hr after irradiation with 100 rad and 2000 rad (Mean ±SD, p-value *<0.05 t-test). Fixed, stained samples were used for scoring. Testes sample n ≥ 11 for each genotype, repeated in triplicate. (E) Number of Lysotracker-positive SG per 16-SG cyst in mnk/chk2 and p53 mutants following 100 rad. Red line, mean. Unfixed samples stained with Lysotracker, FM 4–64, and Hoechst 33342 were used for scoring.
Figure 5—figure supplement 1

Expression of Mnk/Chk2 in response to ionizing radiation.
Testes from unirradiated flies (A), flies irradiated with 100 rad (B-D), or with 4000 rad (E-G), stained for Mnk/Chk2 (red), Vasa (white), Hts (green), and DAPI (blue). Bars: 25 µm. Mnk/Chk2 was detected only after a high dose of radiation, predominantly in the somatic cyst cells surrounding the Vasa-positive germ cells.
Figure 5—figure supplement 2
Expression of p53 reporter in response to ionizing radiation.
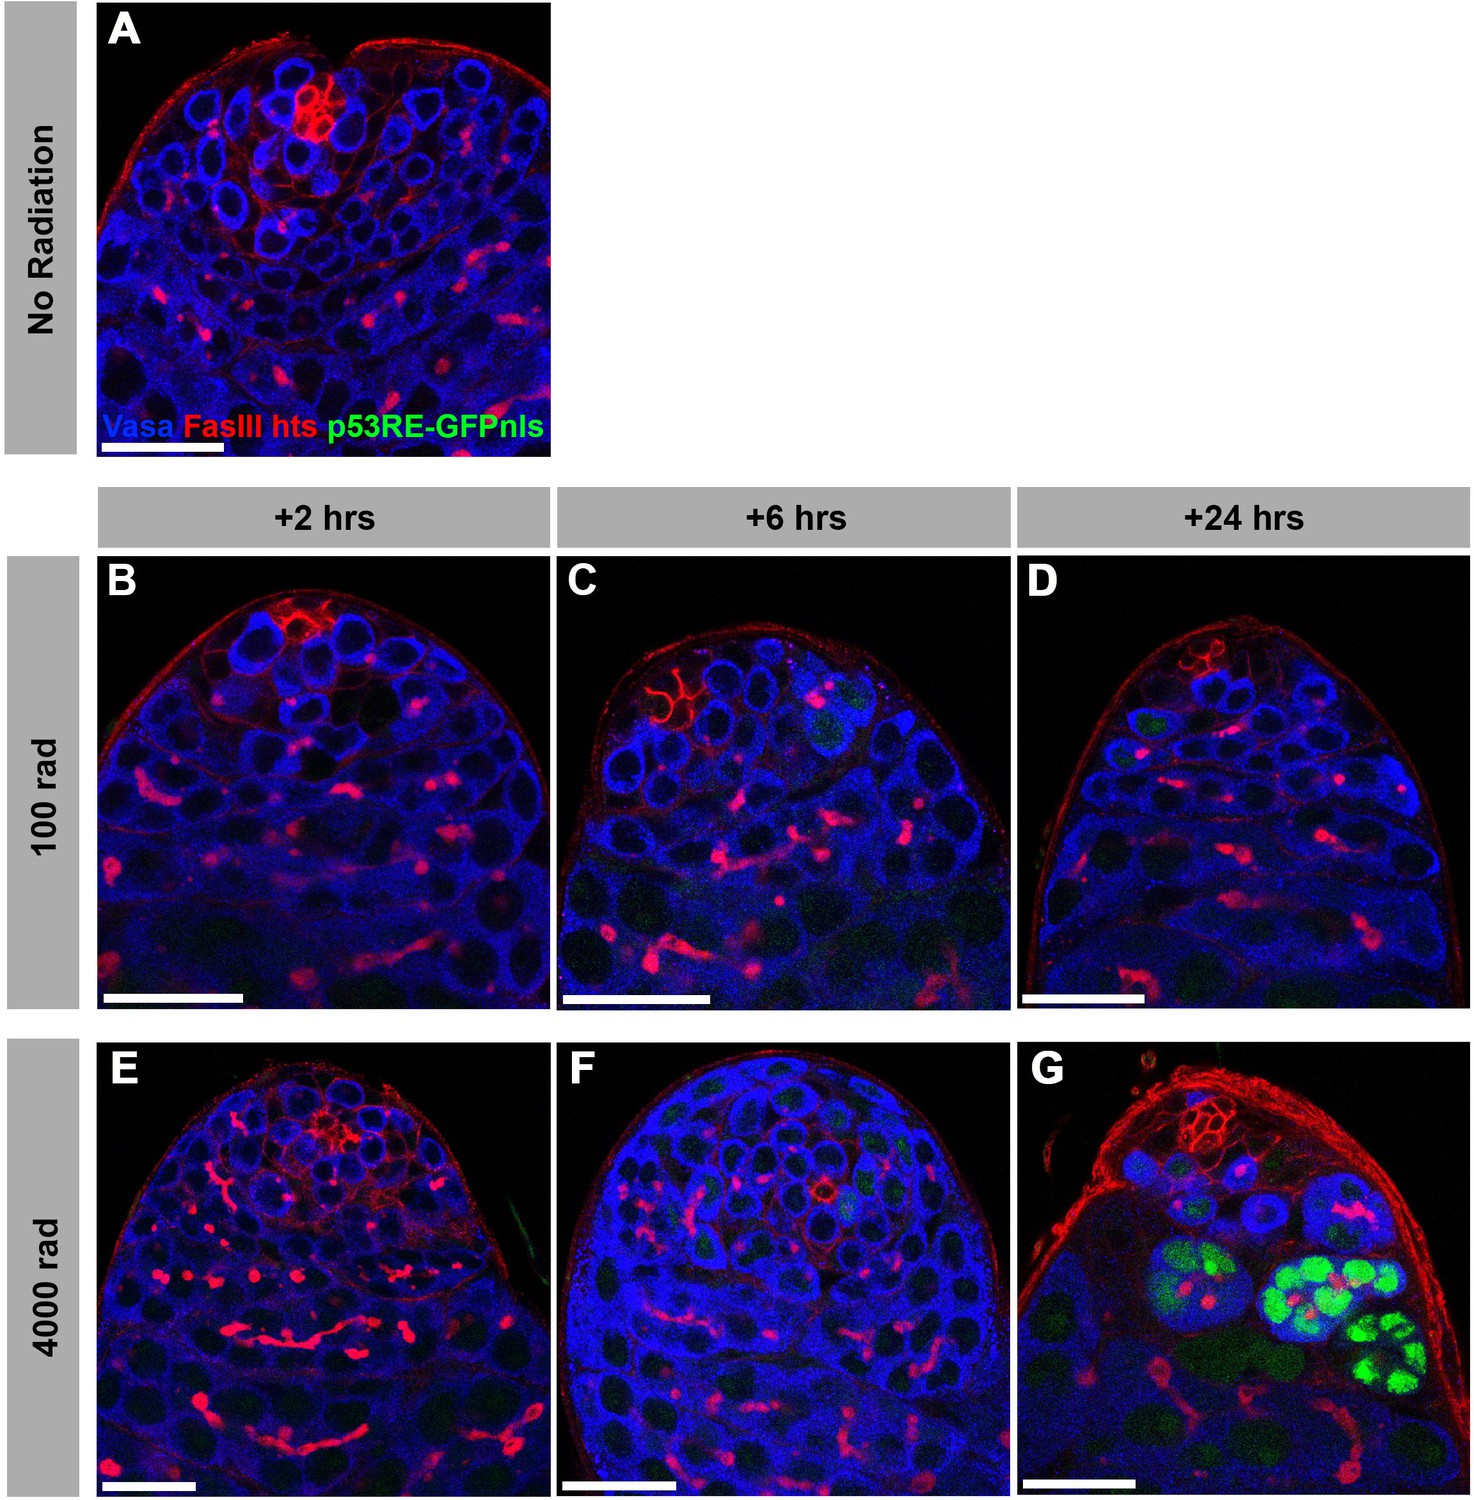
Testes from unirradiated flies (A), flies irradiated with 100 rad (B-D), or with 4000 rad (E-G), stained for p53RE-GFPnls (green), Vasa (blue), Hts/Adducin and FasIII (red). Bars: 25 µm. p53RE-GFPnls was only detectable 24 hr following irradiation at a high dose (4000 rad).
Figure 6
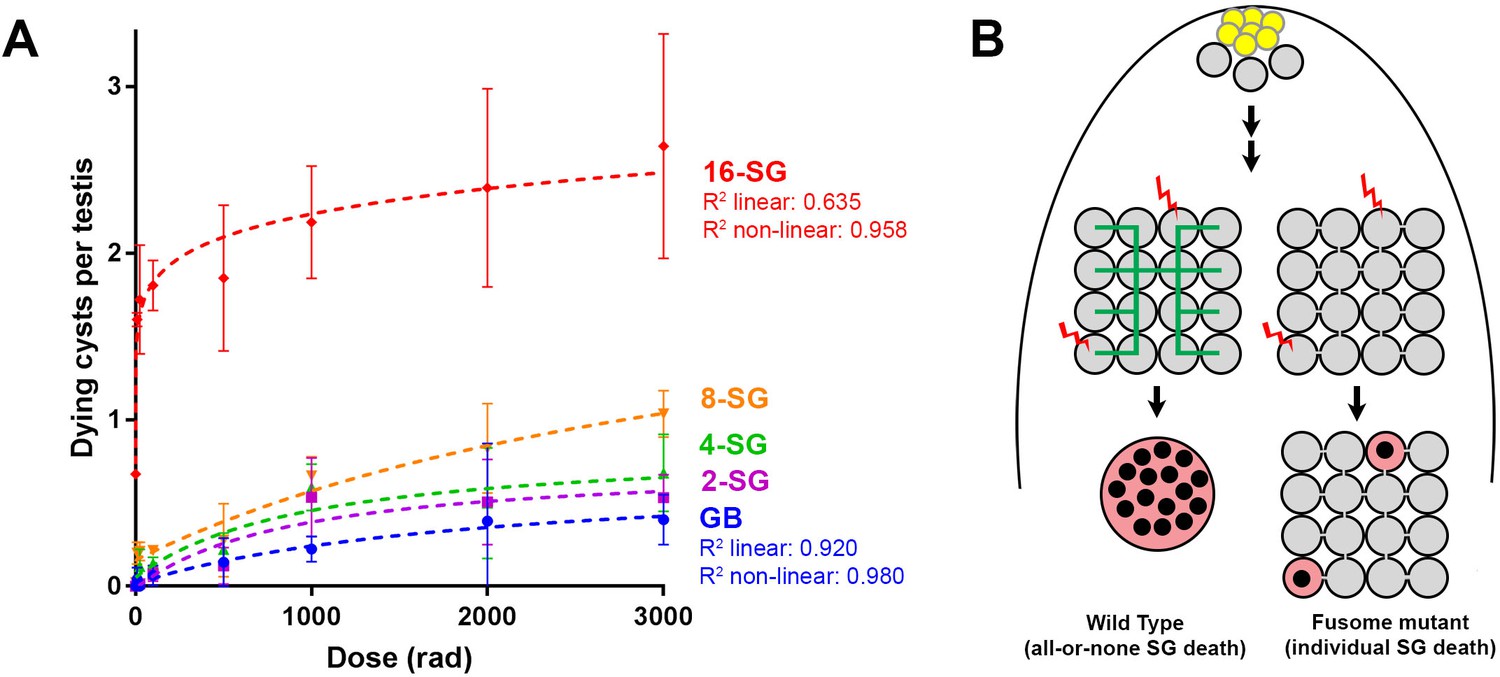
Increasing connectivity confers higher sensitivity to DNA damage.
Dose-dependent SG death in 2-, 4-, 8-, and 16-SG cysts (Mean ±SD). Best fit lines shown determined by non-linear regression. n ≥ 17 testes, repeated in triplicate. (A) (B) Model of SG death enhanced by connectivity.
Additional files
-
Transparent reporting form
- https://doi.org/10.7554/eLife.27960.021
Download links
A two-part list of links to download the article, or parts of the article, in various formats.
Downloads (link to download the article as PDF)
Open citations (links to open the citations from this article in various online reference manager services)
Cite this article (links to download the citations from this article in formats compatible with various reference manager tools)
Germ cell connectivity enhances cell death in response to DNA damage in the Drosophila testis
eLife 6:e27960.
https://doi.org/10.7554/eLife.27960


