Ubiquitination-dependent control of sexual differentiation in fission yeast
- CNRS, UMR7592, Université Paris-Diderot, Sorbonne Paris Cité, France
- Université Paris-Saclay, France
- CNRS, UMR9198, Université Paris-Diderot, Sorbonne Paris Cité, France
Figures
Figure 1 with 1 supplement
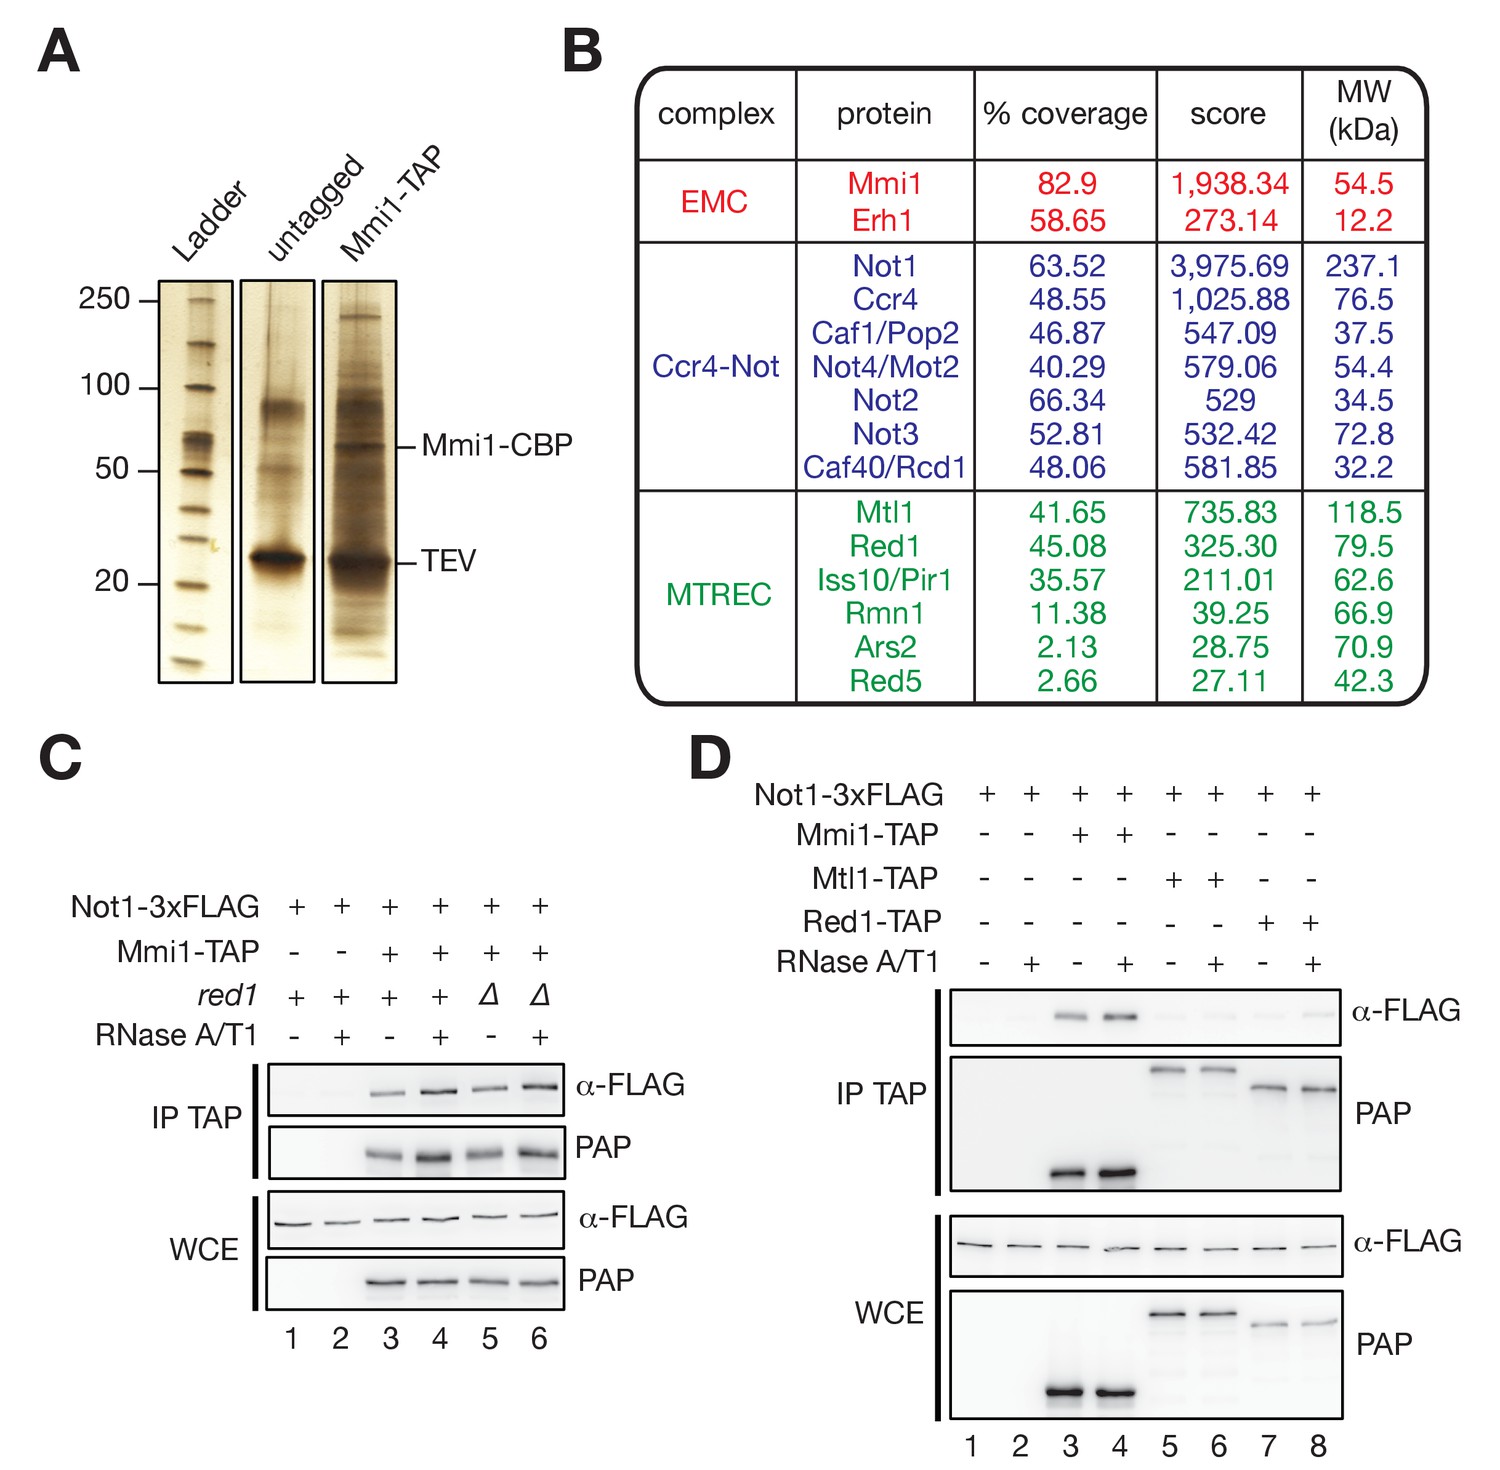
The RNA-binding protein Mmi1, but not MTREC, associates with the Ccr4-Not complex in vivo.
(A) Silver-stained SDS polyacrylamide gel showing proteins co-eluting with TAP-tagged Mmi1 in minimal medium (EMM0.5X) after one-step affinity purification. Extracts were treated with RNaseA/T1 before immunoprecipitation and TEV cleavage. As a control, extracts from cells expressing untagged protein were used. The positions of the bait protein (Mmi1-CBP) and TEV are indicated. (B) Results of liquid chromatography-tandem mass spectrometry (LC-MS/MS) analysis of Mmi1-TAP associated proteins. The percentage of sequence coverage, scores (i.e. significance of the identified peptides represented as the -log10 of the Posterior Error Probability provided by the Percolator algorithm) and molecular weights are indicated. (C) Western blot showing that Not1-3xFLAG co-immunoprecipitates with Mmi1-TAP in minimal medium (EMM0.5X) in an RNA- and Red1-independent manner. (WCE) Whole Cell Extract; (IP) Immunoprecipitation. (D) Western blot showing that Not1-3xFLAG co-immunoprecipitates with Mmi1-TAP in minimal medium (EMM0.5X), but not with Mtl1-TAP and Red1-TAP. (WCE) Whole Cell Extract; (IP) Immunoprecipitation.
-
Figure 1—source data 1
Complete lists of Mmi1 protein partners in wt and mot2∆ cells.
Shown are lists of proteins co-purified with Mmi1-TAP in the presence or the absence of RNAses in wild type and mot2∆ cells. An untagged strain was used as a negative control. Protein scores (as provided by the Percolator algorithm), percentages of sequence coverage, numbers of peptides, numbers of peptide spectrum matches (PSM) as well as the sequence, q-value, Posterior Error Probability (PEP) and ion score for each peptide identified are indicated. Rows corresponding to the Mmi1 and Erh1 subunits of the EMC complex, subunits of the Ccr4-Not and MTREC complexes as well as Mei2 are highlighted in red, blue, green and yellow, respectively.
- https://doi.org/10.7554/eLife.28046.004
Figure 1—figure supplement 1
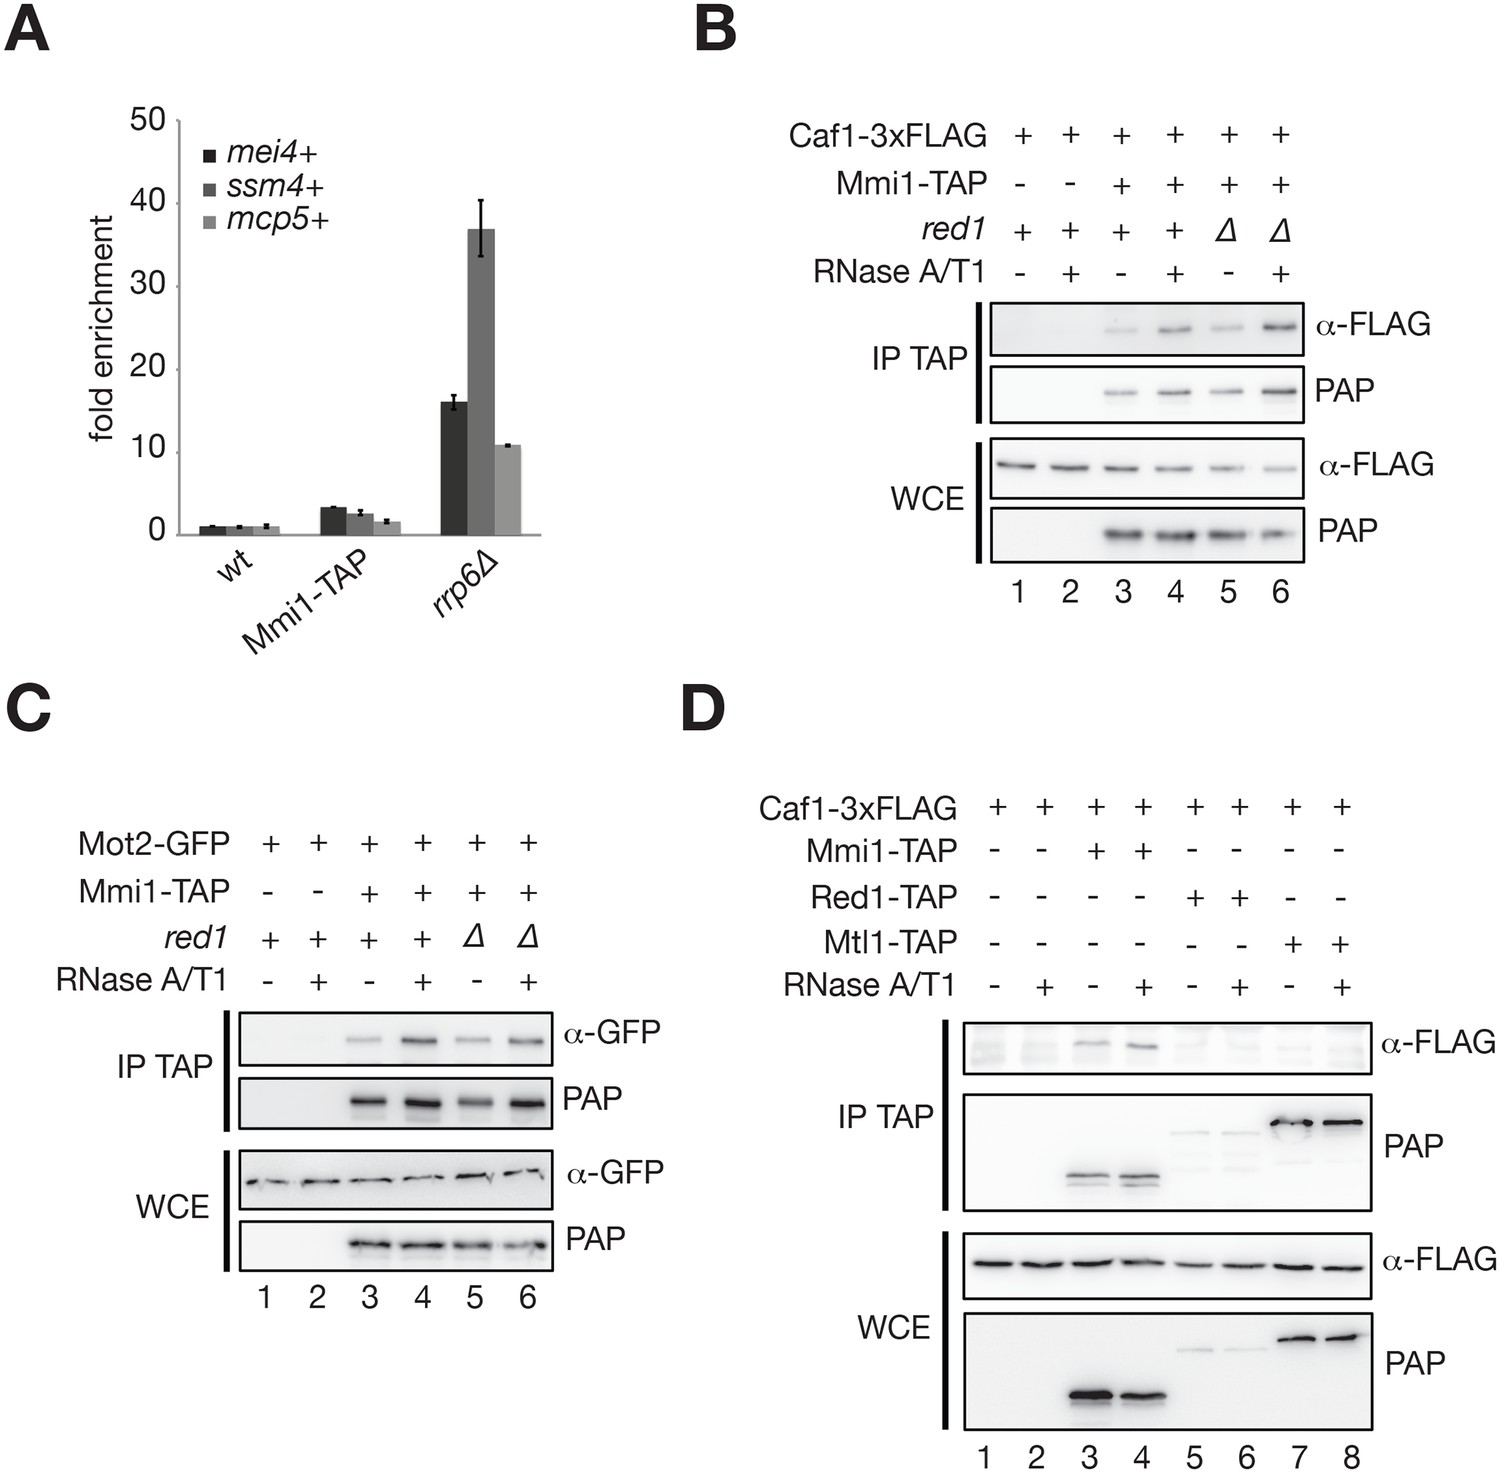
The RNA-binding protein Mmi1, but not MTREC, associates with the Ccr4-Not complex in vivo.
(A) RT-qPCR analysis of the mei4+, ssm4+ and mcp5+ meiotic transcripts in Mmi1-TAP cells grown in minimal medium (EMM0.5X). Signals were normalized to act1+ mRNA levels and expressed relative to the wild type strain. A strain deleted for Rrp6 was used as a control. Error bars represent the standard deviation from three independent experiments. Note that Mmi1-TAP cells display minor accumulation of meiotic transcripts. (B), (C) Western blots showing that Caf1-3xFLAG (B) and Mot2-GFP (C) co-immunoprecipitate with Mmi1-TAP in minimal medium (EMM0.5X) in an RNA- and Red1-independent manner. (D) Western blot showing that Caf1-3xFLAG co-immunoprecipitates with Mmi1-TAP in rich medium (YE), but not with Mtl1-TAP and Red1-TAP.
Figure 2 with 1 supplement
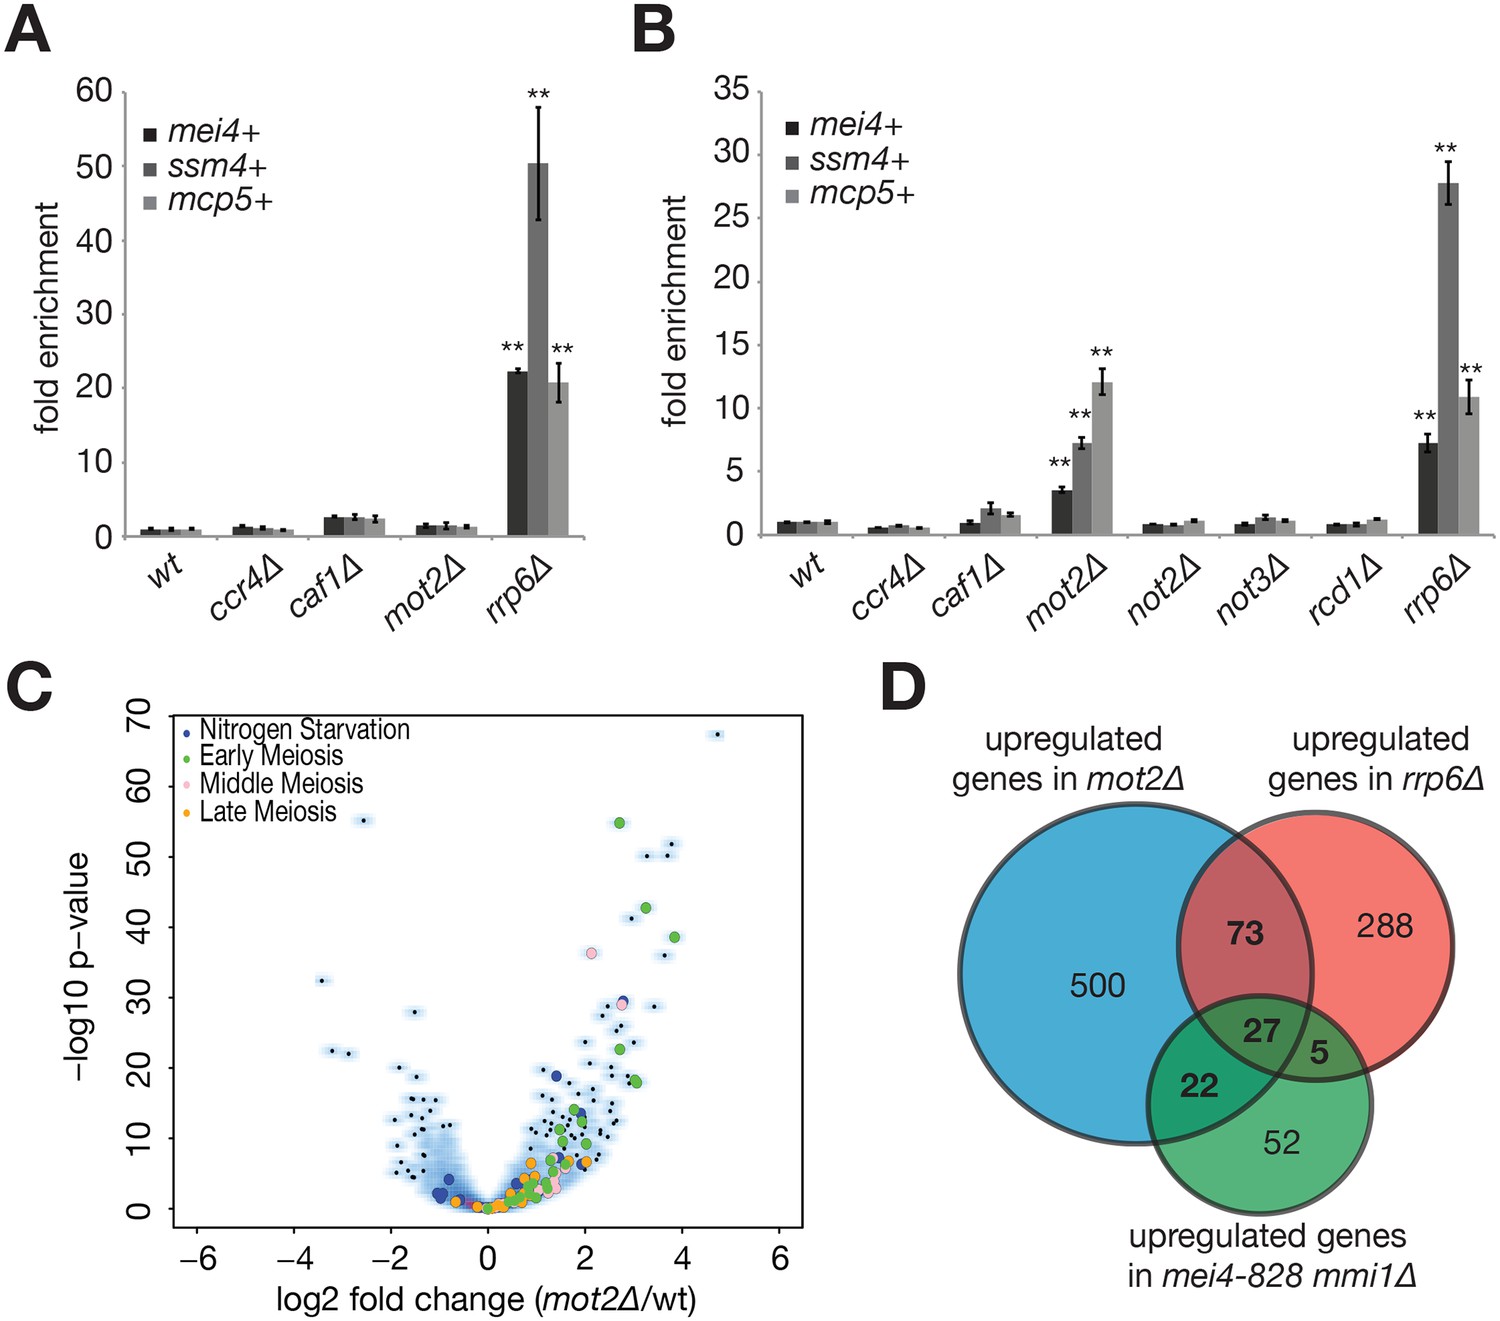
The E3 ubiquitin ligase Mot2 is required for meiotic mRNAs suppression.
(A) RT-qPCR analysis of the mei4+, ssm4+ and mcp5+ meiotic transcripts in cells grown in rich medium (YE) and deleted for Ccr4, Caf1, Mot2 or Rrp6. Signals were normalized to act1+ mRNA levels and expressed relative to the wild type strain. Error bars represent the standard deviation from at least three independent experiments. Stars denote statistical significance relative to wild type cells (t-test p-values: mei4+ = 2.4E-5; ssm4+ = 7.84E-3; mcp5+ = 5.88E-3). (B) RT-qPCR analysis of the mei4+, ssm4+ and mcp5+ meiotic transcripts in cells grown in minimal medium (EMM0.5X) and deleted for all non-essential Ccr4-Not subunits (i.e. all but Not1) or Rrp6 as a control. Signals were normalized to act1+ mRNA levels and expressed relative to the wild type strain. Error bars represent the standard deviation from at least three independent experiments. Stars denote statistical significance relative to wild type cells (t-test p-values for mot2∆ and rrp6∆ strains: mei4+ = 2.28E-3 and 4.34E-3; ssm4+ = 1.74E-3 and 1.34E-3; mcp5+ = 2.26E-3 and 5.83E-3). (C) Comparison of the mot2∆ (duplicate) and wild type (triplicate) transcriptomes in minimal medium (EMM0.5X). Volcano plot shows the fold change (log2) on the x axis and the P-value distribution (-log10 P value) on the y axis for the transcripts identified in RNA-seq analysis. Each dot represents one transcript and the colour code refers to the different functional categories of Mmi1 targets, as described in Hiriart et al. (2012). (D) Venn diagram showing the overlap of transcripts stabilized in mot2∆ and rrp6∆ strains and compared to Mmi1 targets (Hiriart et al., 2012). The R package «SuperExactTest» (Wang et al., 2016) was used to calculate the p-values of intersects: mot2∆ ∩ rrp6∆ = 6.98E-24; mot2∆ ∩ mmi1∆ = 4.4E-25; mmi1 ∆ ∩ rrp6∆ = 1.63E-16; mot2∆ ∩ rrp6∆ ∩ mmi1∆ = 4.85E-40.
-
Figure 2—source data 1
Analysis of RNA-sequencing data.
Shown are genes with a 1.5 fold increase (0.58496250072 on a log2 scale) in expression in mutants relative to the wild type and a p-value<5E-2, the overlap between mot2∆ and rrp6∆ strains, and functional categories of genes upregulated in mot2∆ cells.
- https://doi.org/10.7554/eLife.28046.007
Figure 2—figure supplement 1
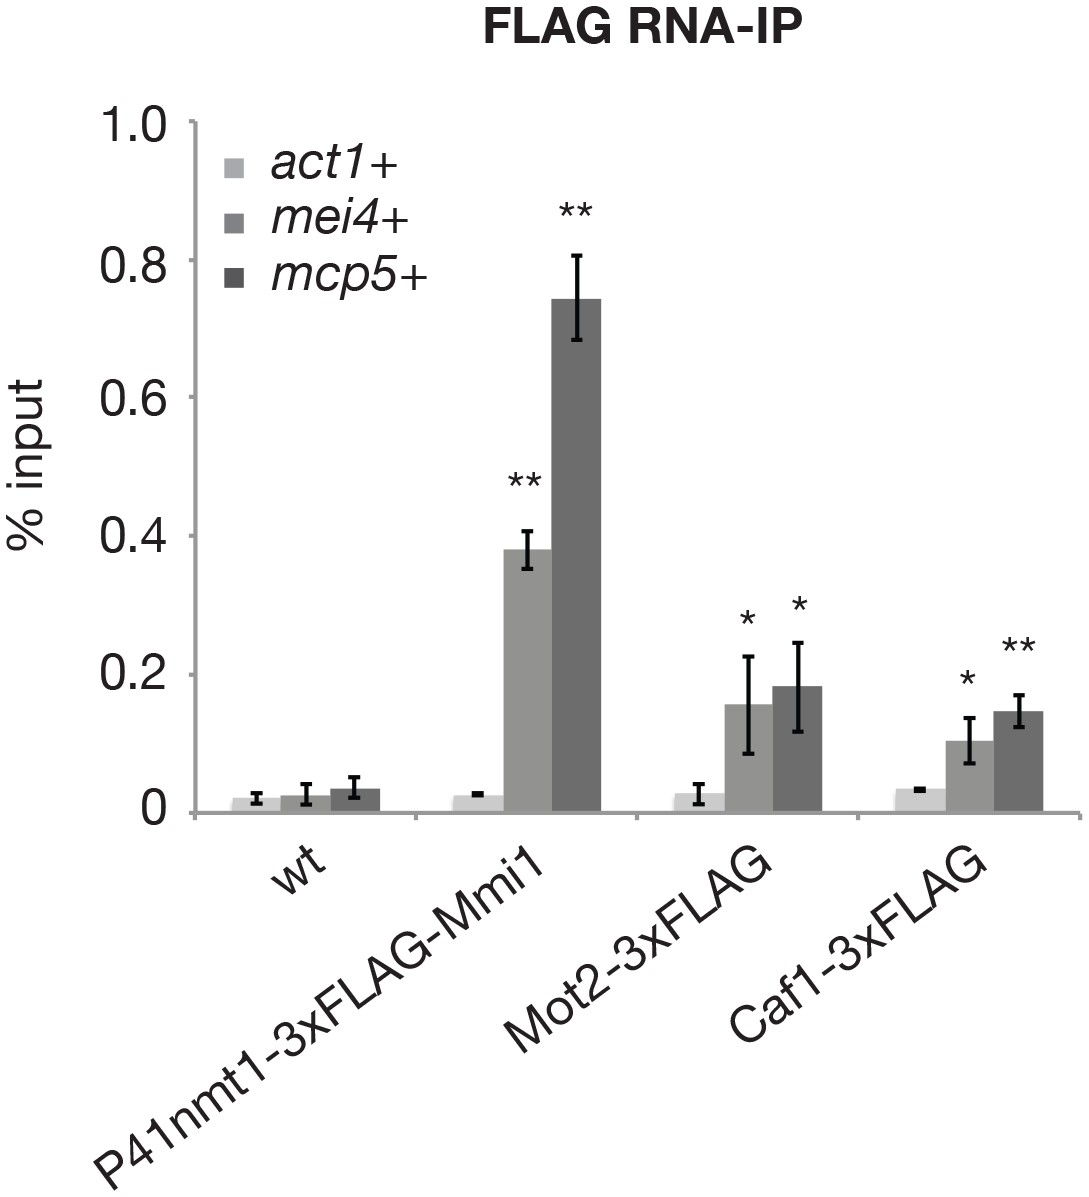
The E3 ubiquitin ligase Mot2 binds to meiotic mRNAs.
RNA-immunoprecipitation experiments in wild type cells. Shown are the enrichments (% input) of act1+, mei4+ and mcp5+ transcripts upon pulldown of 3xFLAG-tagged Mmi1, Mot2 and Caf1. Error bars represent the standard deviation of three or four independent immunoprecipitations from biological duplicates. Stars denote statistical significance (t-test p-values for 3xFLAG-tagged Mmi1, Mot2 and Caf1 strains: mei4+ = 2.3E-4, 3.2E-2 and 3.7E-2; mcp5+ = 1.5E-3, 1.7E-2 and 3.5E-3).
Figure 3 with 1 supplement
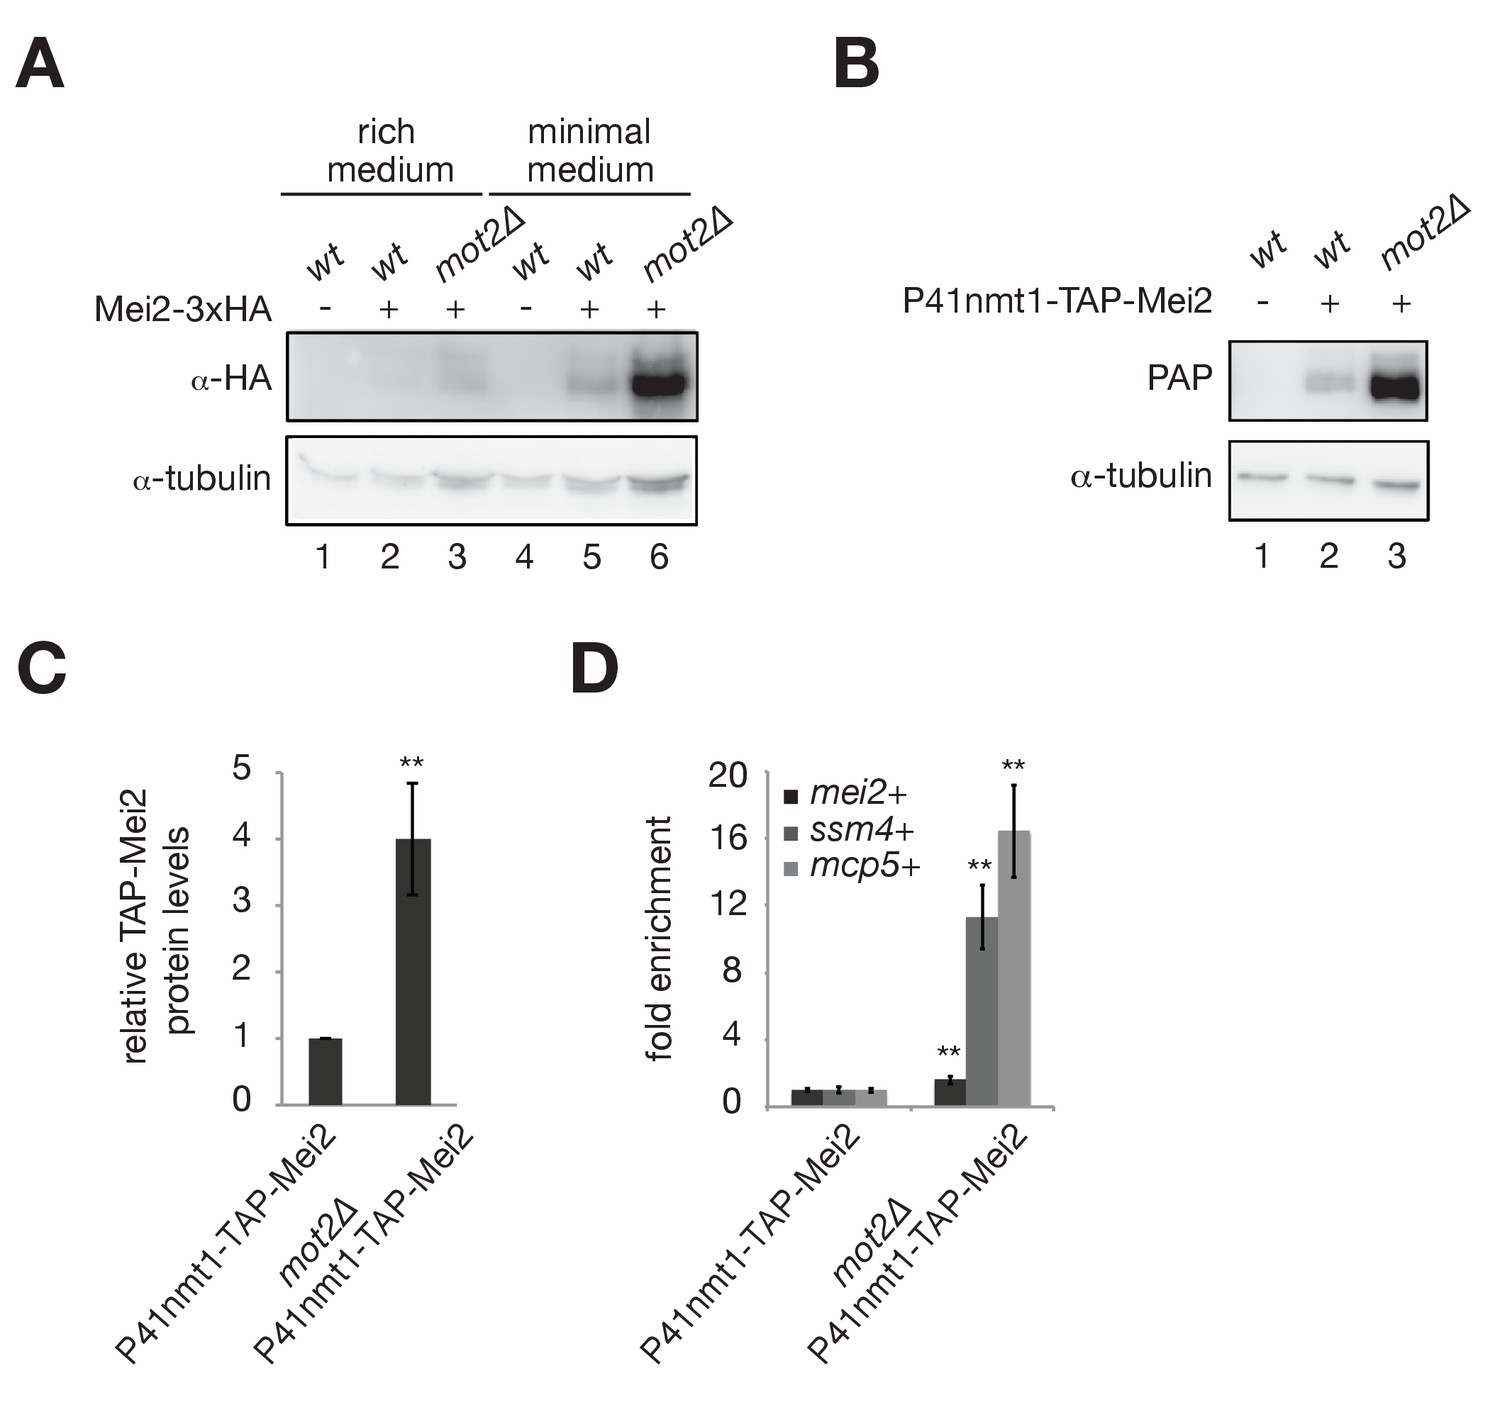
The E3 ubiquitin ligase Mot2 negatively affects the levels of the Mmi1 inhibitor Mei2.
(A) Western blot showing total Mei2-3xHA levels in wt and mot2∆ cells grown at 30°C to mid-log phase in rich (YE) and minimal (EMM0.5X) media. An anti-tubulin antibody was used as a loading control. (B) Western blot showing total TAP-Mei2 levels expressed from the P41nmt1 promoter in wt and mot2∆ cells grown in minimal medium (EMM0.5X). An anti-tubulin antibody was used as a loading control. (C) Quantification of TAP-Mei2 protein levels, normalized to tubulin and expressed relative to wt cells. Error bars represent the standard deviation from five independent experiments. Stars denote statistical significance (t-test p-value=1.38E-3). (D) RT-qPCR analysis of mei2+, ssm4+ and mcp5+ transcripts in wt and mot2∆ strains expressing Mei2 from the P41nmt1 promoter. Cells were grown in minimal medium (EMM0.5X). Signals were normalized to act1+ mRNA levels and expressed relative to the P41nmt1-TAP-Mei2 strain. Error bars represent the standard deviation from four independent experiments. Stars denote statistical significance (t-test p-values: mei2+ = 8.5E-3; ssm4+ = 1.53E-3; mcp5+ = 1.49E-3).
Figure 3—figure supplement 1
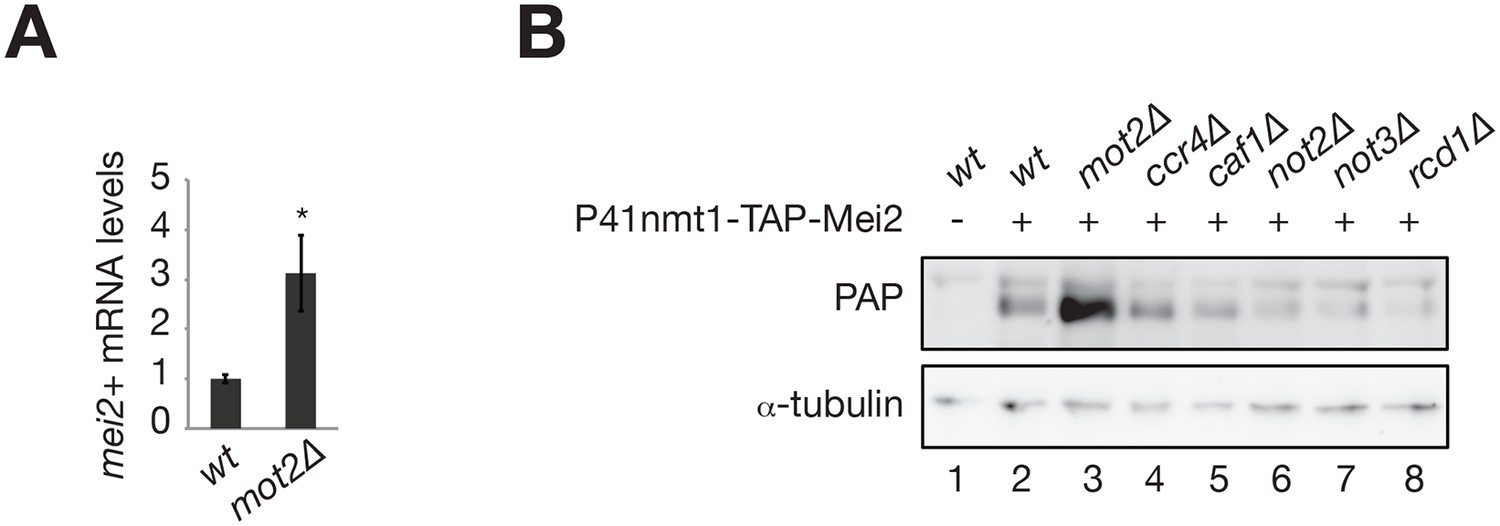
The E3 ubiquitin ligase Mot2 negatively affects the levels of the Mmi1 inhibitor Mei2.
(A) RT-qPCR analysis of mei2+ mRNAs levels in wt and mot2∆ cells grown in minimal medium (EMM0.5X). Signals were normalized to act1+ mRNA levels and expressed relative to the wild type strain. Error bars represent the standard deviation from at least three independent experiments. The star denotes statistical significance relative to wild type cells (t-test p-value=1.1E-2). (B) Western blot showing total TAP-Mei2 levels expressed from the P41nmt1 promoter in minimal medium (EMM0.5X) in wild type cells and strains deleted for non-essential subunits of the Ccr4-Not complex (i.e. all but Not1). An anti-tubulin antibody was used as a loading control.
Figure 4 with 1 supplement
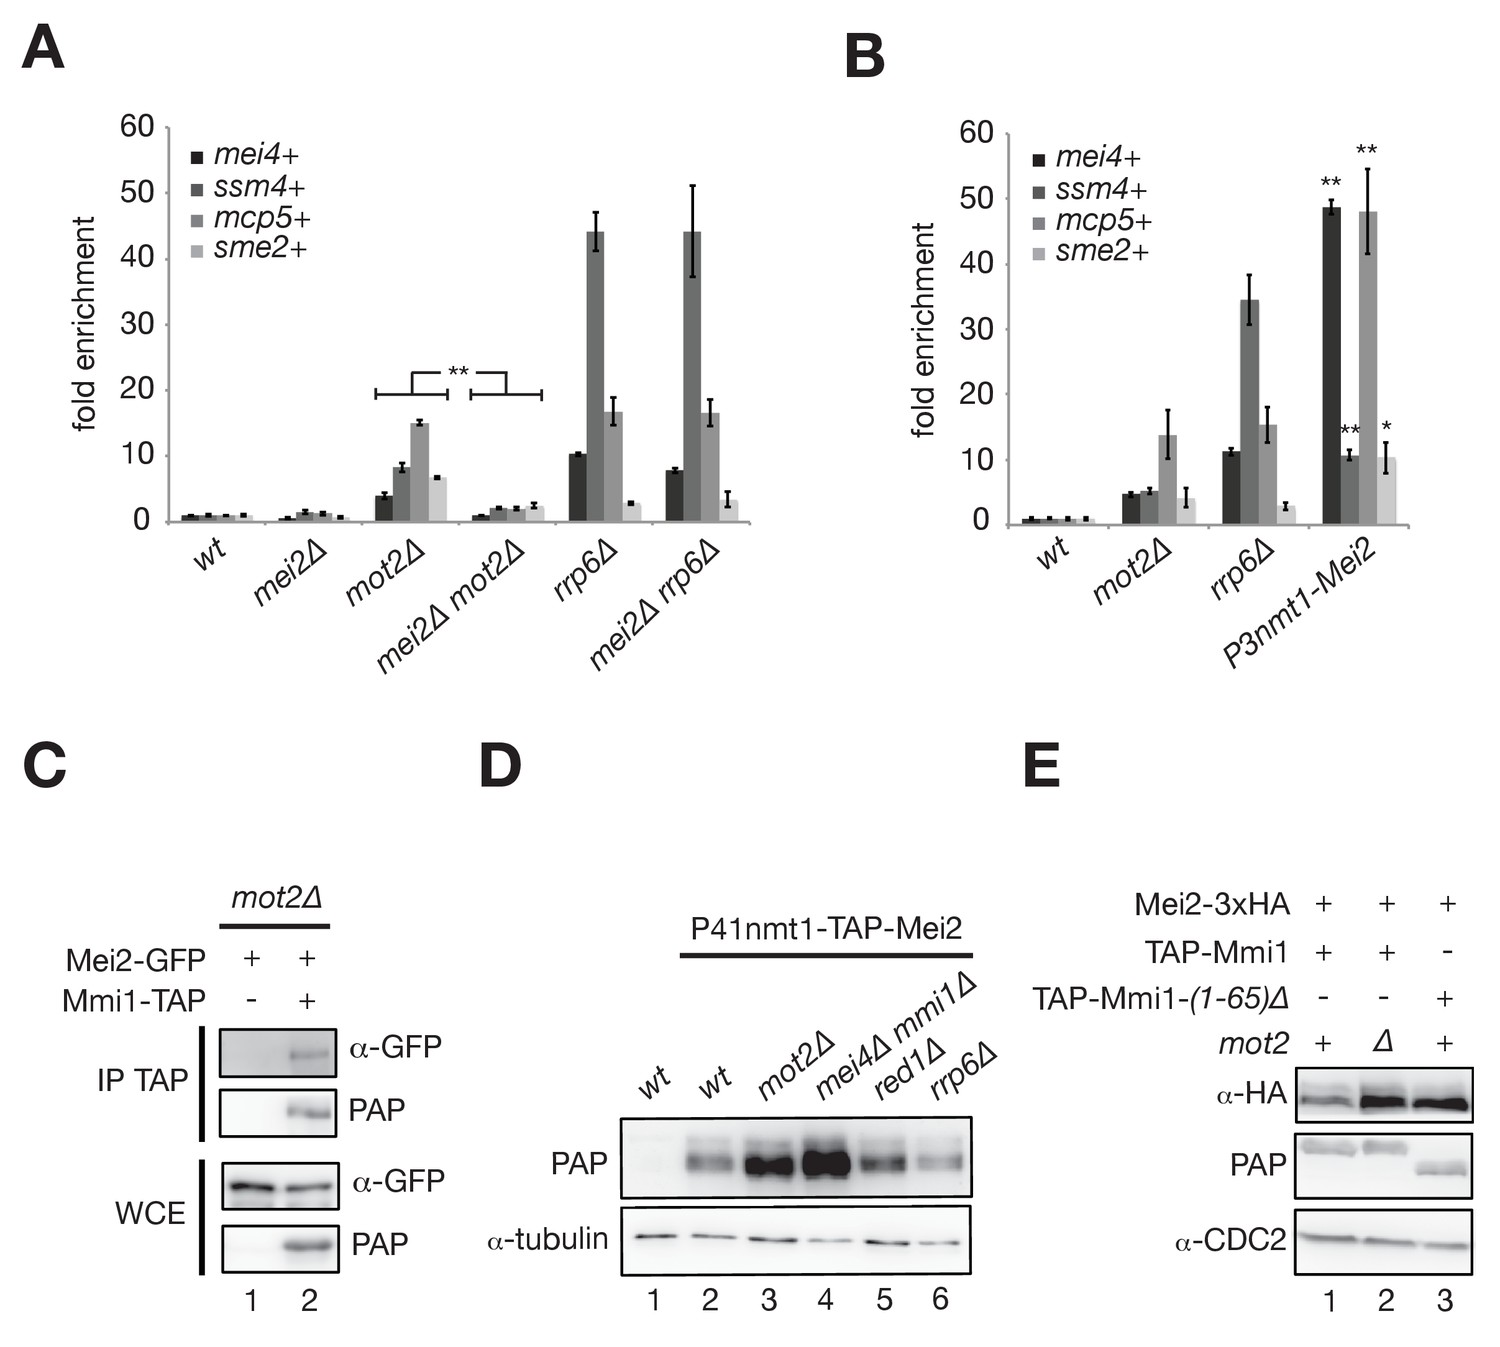
Mot2 functions with Mmi1 to limit the accumulation of Mei2 and meiotic mRNAs.
(A), (B) RT-qPCR analyses of meiotic transcripts in cells of the indicated genetic backgrounds and grown in minimal medium (EMM0.5X). Shown is the fold enrichment of RNAs levels normalized to act1+ transcripts and expressed relative to the wild type strain. Error bars represent the standard deviation from three independent experiments. (A) Pairwise comparisons of four meiotic transcripts in mot2∆ versus mei2∆ mot2∆ mutants give p-values<7.3E-3. (B) Stars denote statistical significance relative to wild type cells (t-test p-values: mei4+ = 1.29E-4; ssm4+ = 1.9E-3; mcp5+ = 6.3E-3; sme2+ = 2.04E-2). (C) Western blot showing that Mei2-GFP co-immunoprecipitates with Mmi1-TAP upon RNaseA/T1 treatment in mot2∆ cells grown in minimal medium (EMM0.5X). (D), (E) Western blots showing total Mei2 levels (P41nmt1-TAP-Mei2 in (D) or Mei2-3xHA in (E)) in cells of the indicated genetic backgrounds and grown in minimal medium (EMM0.5X). Anti-tubulin and anti-CDC2 antibodies were used as loading controls in panels (D) and (E), respectively.
Figure 4—figure supplement 1
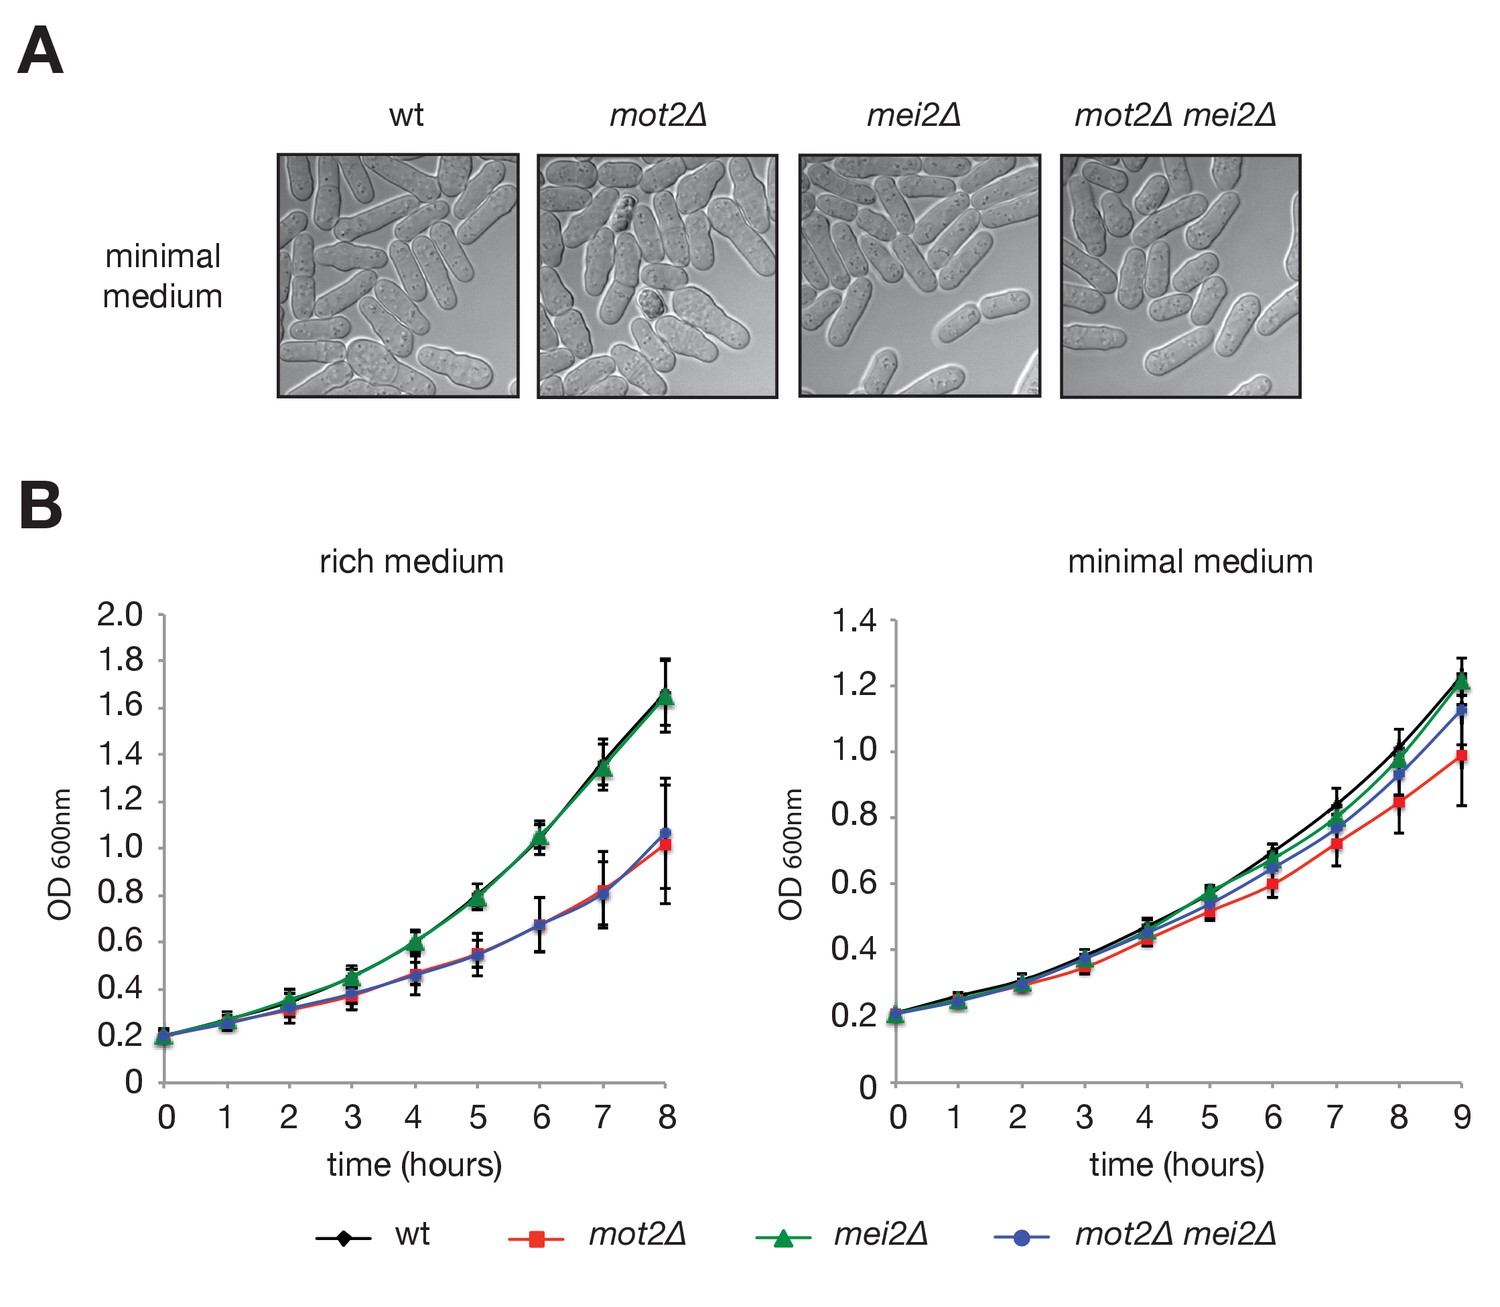
Phenotypic characterization of the mot2∆ mutant.
(A) Phase contrast images of exponentially growing wild type, mot2∆, mei2∆ and mot2∆ mei2∆ cells cultured in minimal medium (EMM0.5X). (B) Cells of the indicated genotypes were grown in rich (YE; left panel) and minimal (EMM0.5X; right panel) media, and the optical density (OD600nm) was measured over time.
Figure 5 with 1 supplement
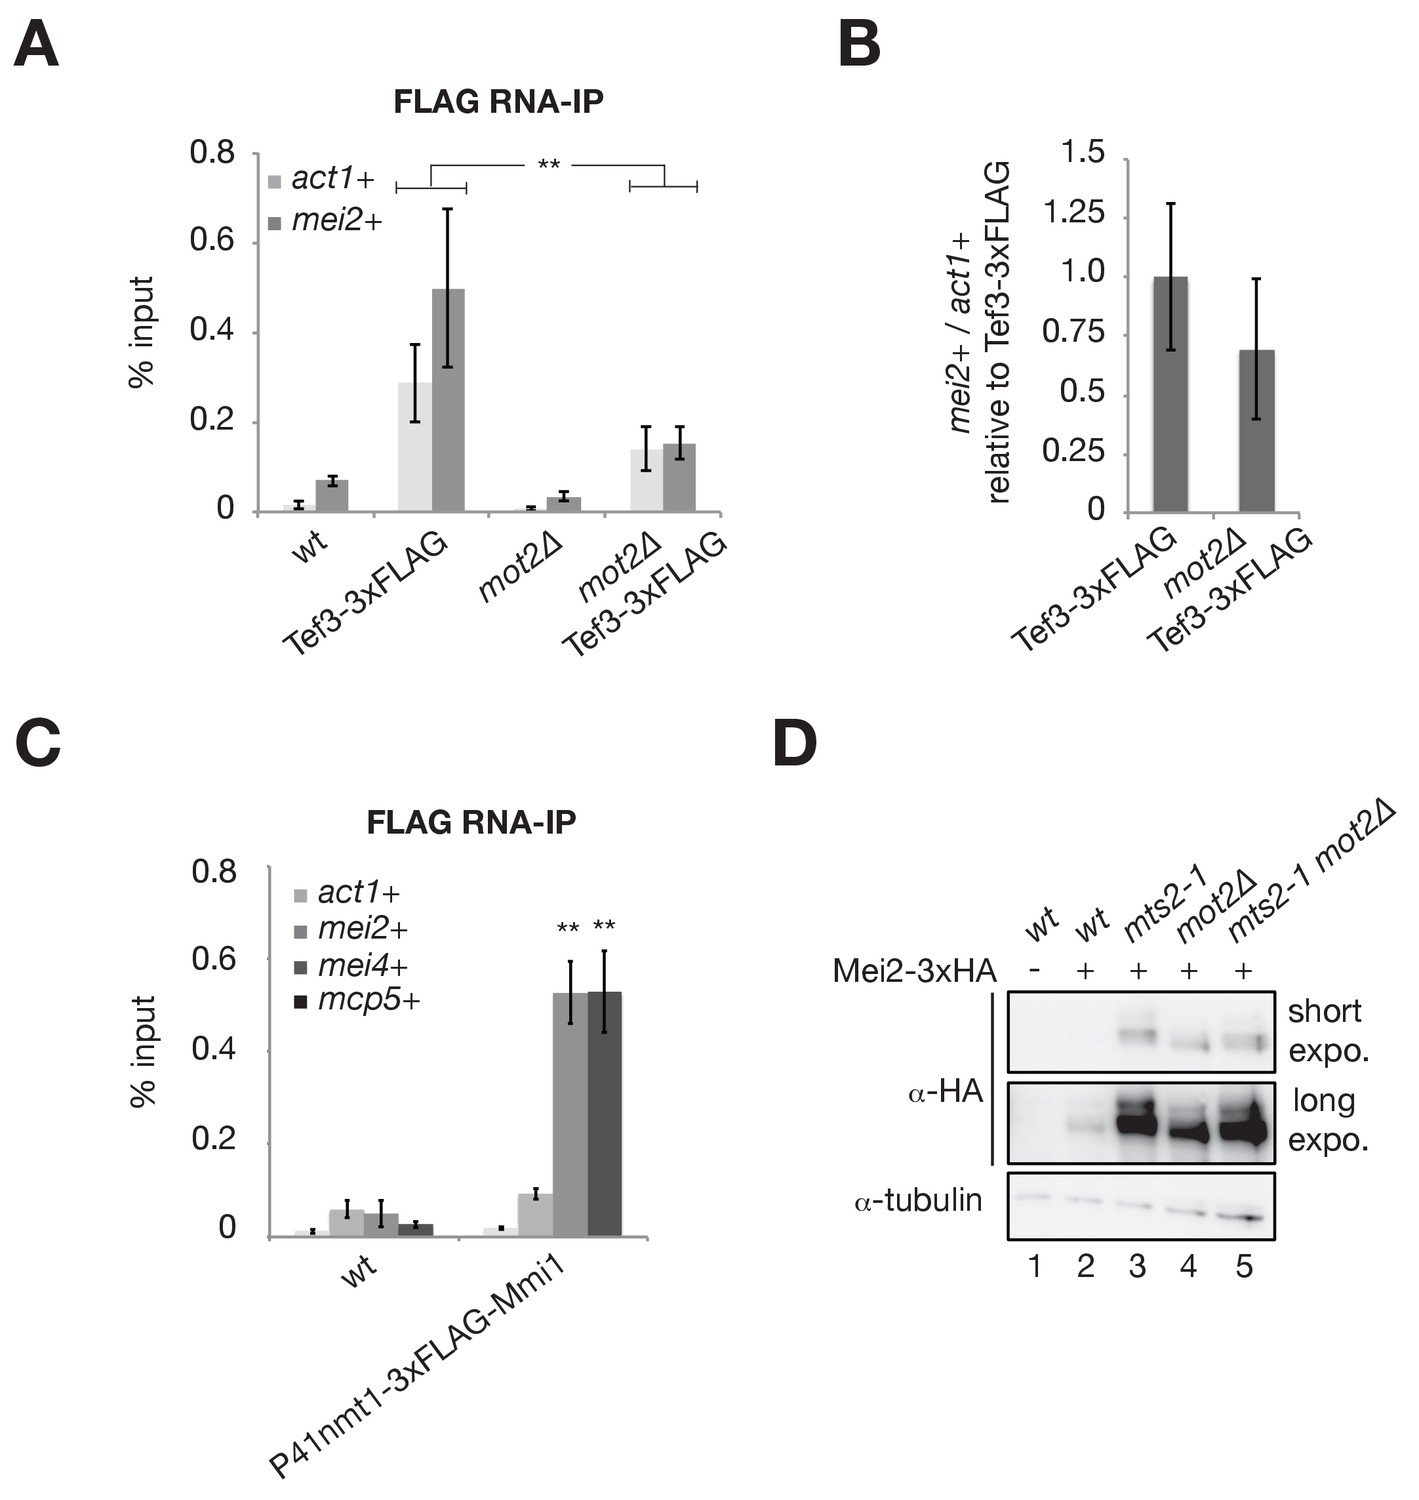
Mot2 and Mmi1 do not repress mei2+ mRNA translation.
(A) RNA-immunoprecipitation experiments in wild type and mot2∆ cells. Shown are the enrichments (% input) of act1+ and mei2+ mRNAs upon pulldown of the 3xFLAG-tagged translation elongation factor Tef3. Error bars represent the standard deviation of six independent immunoprecipitations from at least three biological replicates. Stars denote statistical significance between samples (t-test p-values: act1+ = 6.87E-3; mei2+ = 4.26E-3). (B) Quantification of mei2+ mRNA levels normalized to act1+ transcripts and expressed relative to the wild type tagged strain (Tef3-3xFLAG). Error bars represent the standard deviation of six independent immunoprecipitations from at least three biological replicates. (C) RNA-immunoprecipitation experiments in wild type cells. Shown are the enrichments (% input) of act1+, mei2+, mei4+ and mcp5+ transcripts upon pulldown of 3xFLAG-tagged Mmi1. Error bars represent the standard deviation of four independent immunoprecipitations from three biological replicates. Stars denote statistical significance (t-test p-values: mei4+ = 1.87E-4; mcp5+ = 1.35E-3). (D) Western blot showing total Mei2-3xHA levels in cells of the indicated genetic backgrounds grown in minimal medium (EMM0.5X) following a temperature shift at 37°C for 1 hr. Shown are short and long exposures for the anti-HA immunoblotting. An anti-tubulin antibody was used as a loading control.
Figure 5—figure supplement 1
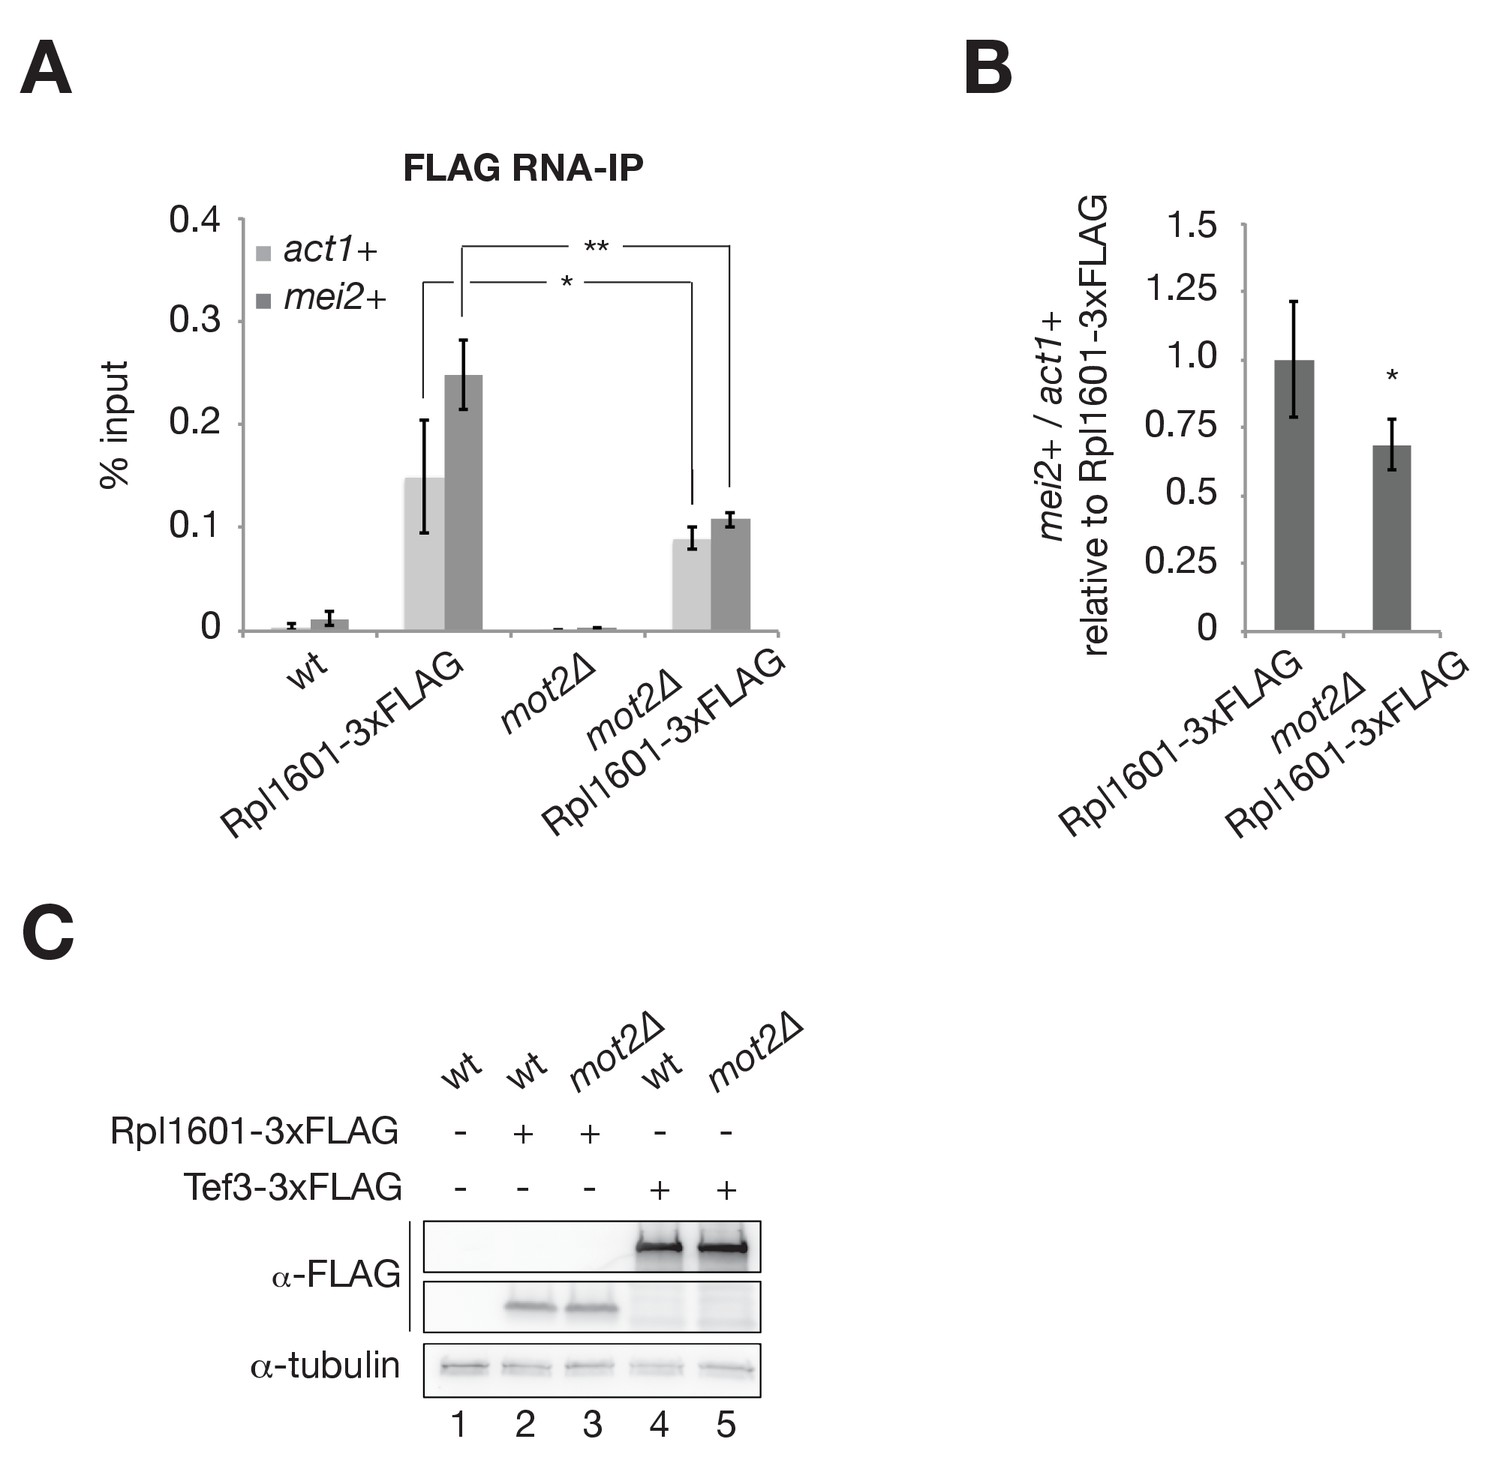
Mot2 does not repress mei2+ mRNA translation.
(A) RNA-immunoprecipitation experiments in wild type and mot2∆ cells. Shown are the enrichments (% input) of act1+ and mei2+ mRNAs upon pulldown of the 3xFLAG-tagged 60S ribosomal subunit Rpl1601. Error bars represent the standard deviation of six independent immunoprecipitations from at least three biological replicates. Stars denote statistical significance between samples (t-test p-values: act1+ = 4.29E-2; mei2+ = 1.08E-4). (B) Quantification of mei2+ mRNA levels normalized to act1+ transcripts and expressed relative to the wild type tagged strain (Rpl1601-3xFLAG). Error bars represent the standard deviation of six independent immunoprecipitations from at least three biological replicates. The star denotes statistical significance between samples (t-test p-value=1.39E-2). (C) Western blot showing that total levels of Rpl1601 and Tef3 are not affected by the deletion of mot2+. 3xFLAG-tagged proteins were detected with an anti-FLAG antibody and an anti-tubulin antibody was used as a loading control.
Figure 6 with 2 supplements
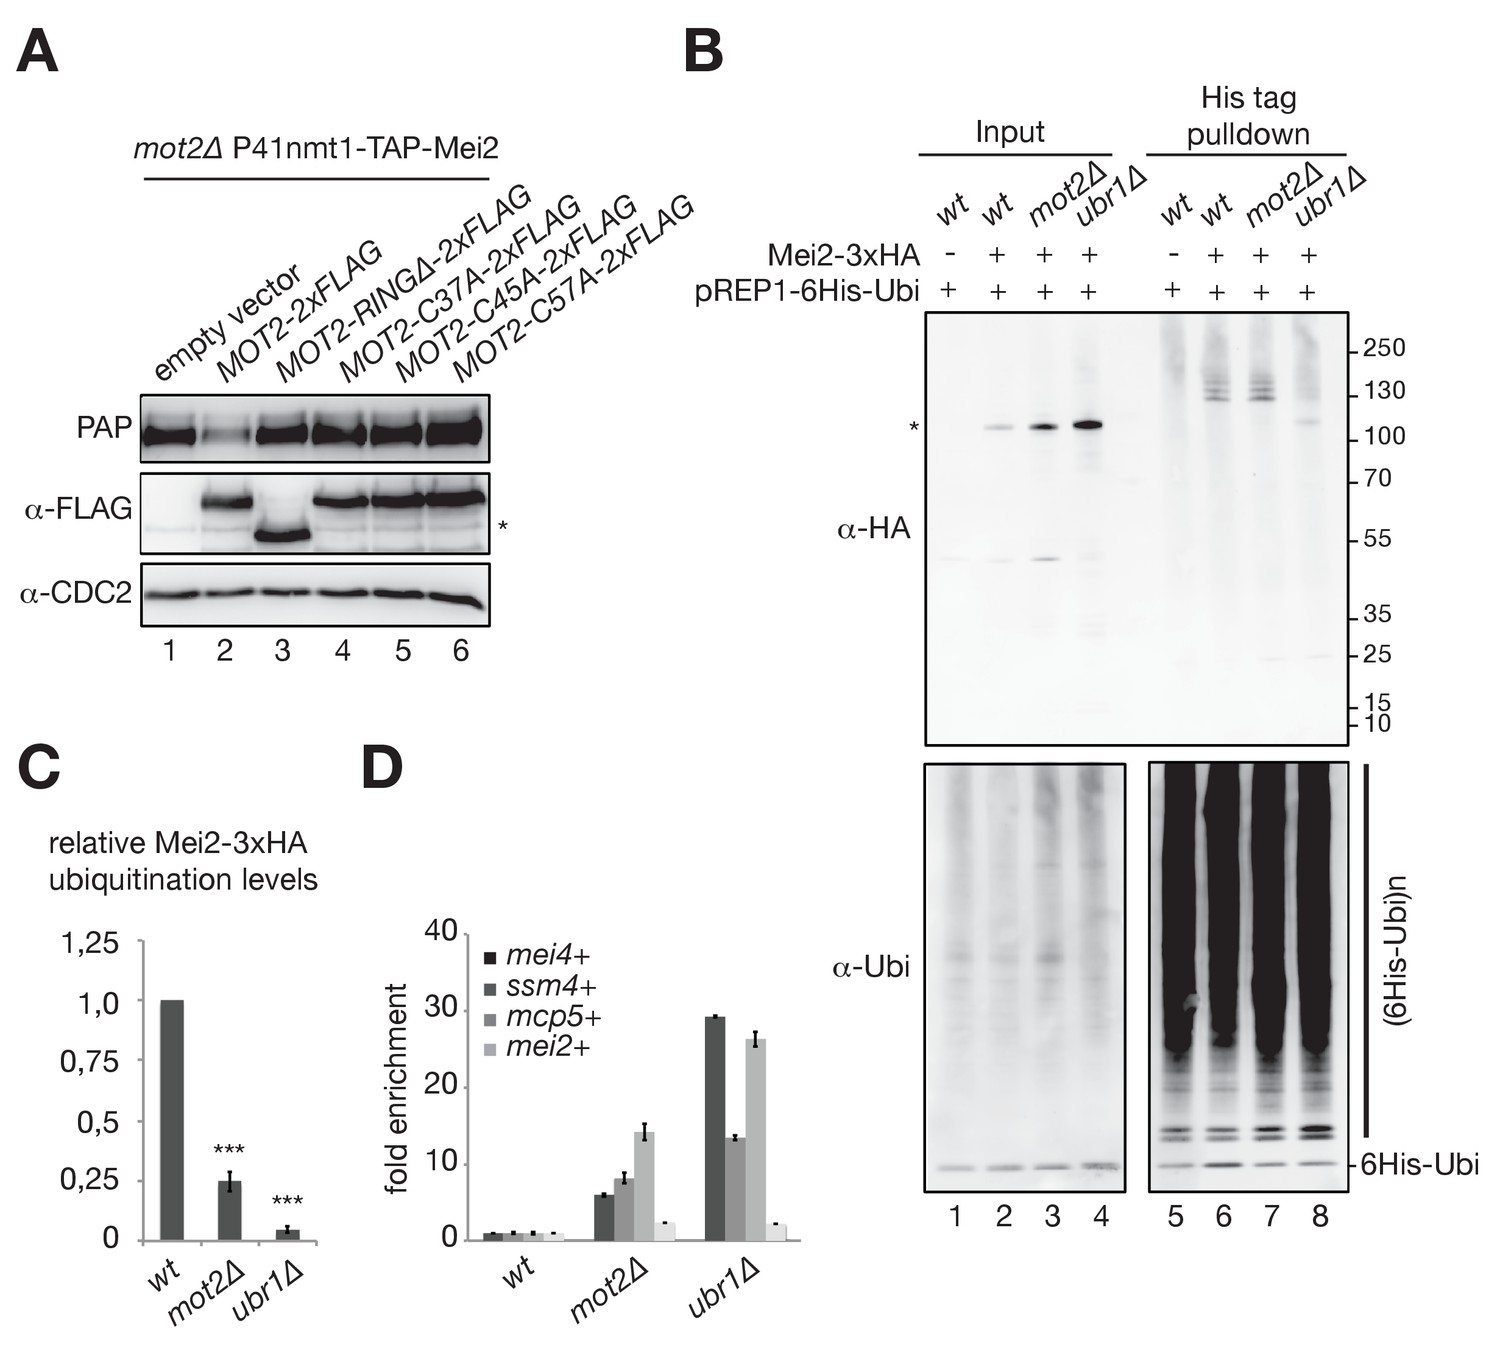
The E3 ubiquitin ligase activity of Mot2 is required for repressing Mei2 during vegetative growth.
(A) Western blot showing total TAP-Mei2 levels expressed from the P41nmt1 promoter in cells of the indicated genetic backgrounds and grown in minimal medium lacking leucine (EMM-LEU0.5X). An anti-FLAG antibody was used to detect Mot2 variants expressed from the pREP41 vector. An anti-CDC2 antibody was used as loading control. The star denotes a non-specific band. (B) In vivo ubiquitination of Mei2-3xHA in wt, mot2∆ and ubr1∆ cells expressing 6His tagged-ubiquitin in minimal medium (EMM-LEU0.5X). Total and ubiquitinated Mei2 as well as ubiquitin conjugates were analyzed by immunoblotting using anti-HA and anti-ubiquitin antibodies respectively. An untagged wild type strain was used as negative control. The star denotes unmodified Mei2 molecules. (C) Quantification of Mei2 ubiquitinated species relative to total protein levels and expressed relative to Mei2-3xHA wild type cells. Error bars represent the standard deviation from five independent experiments. Stars denote statistical significance relative to Mei2-3xHA wild type cells (t-test p-values=2.29E-6 for mot2∆, and 5.64E-9 for ubr1∆). (D) RT-qPCR analysis of meiotic transcripts in wt, mot2∆ and ubr1∆ cells. Shown is the fold enrichment of RNAs levels normalized to act1+ transcripts and expressed relative to the wild type strain. Error bars represent the deviation from the mean of biological duplicates.
Figure 6—figure supplement 1
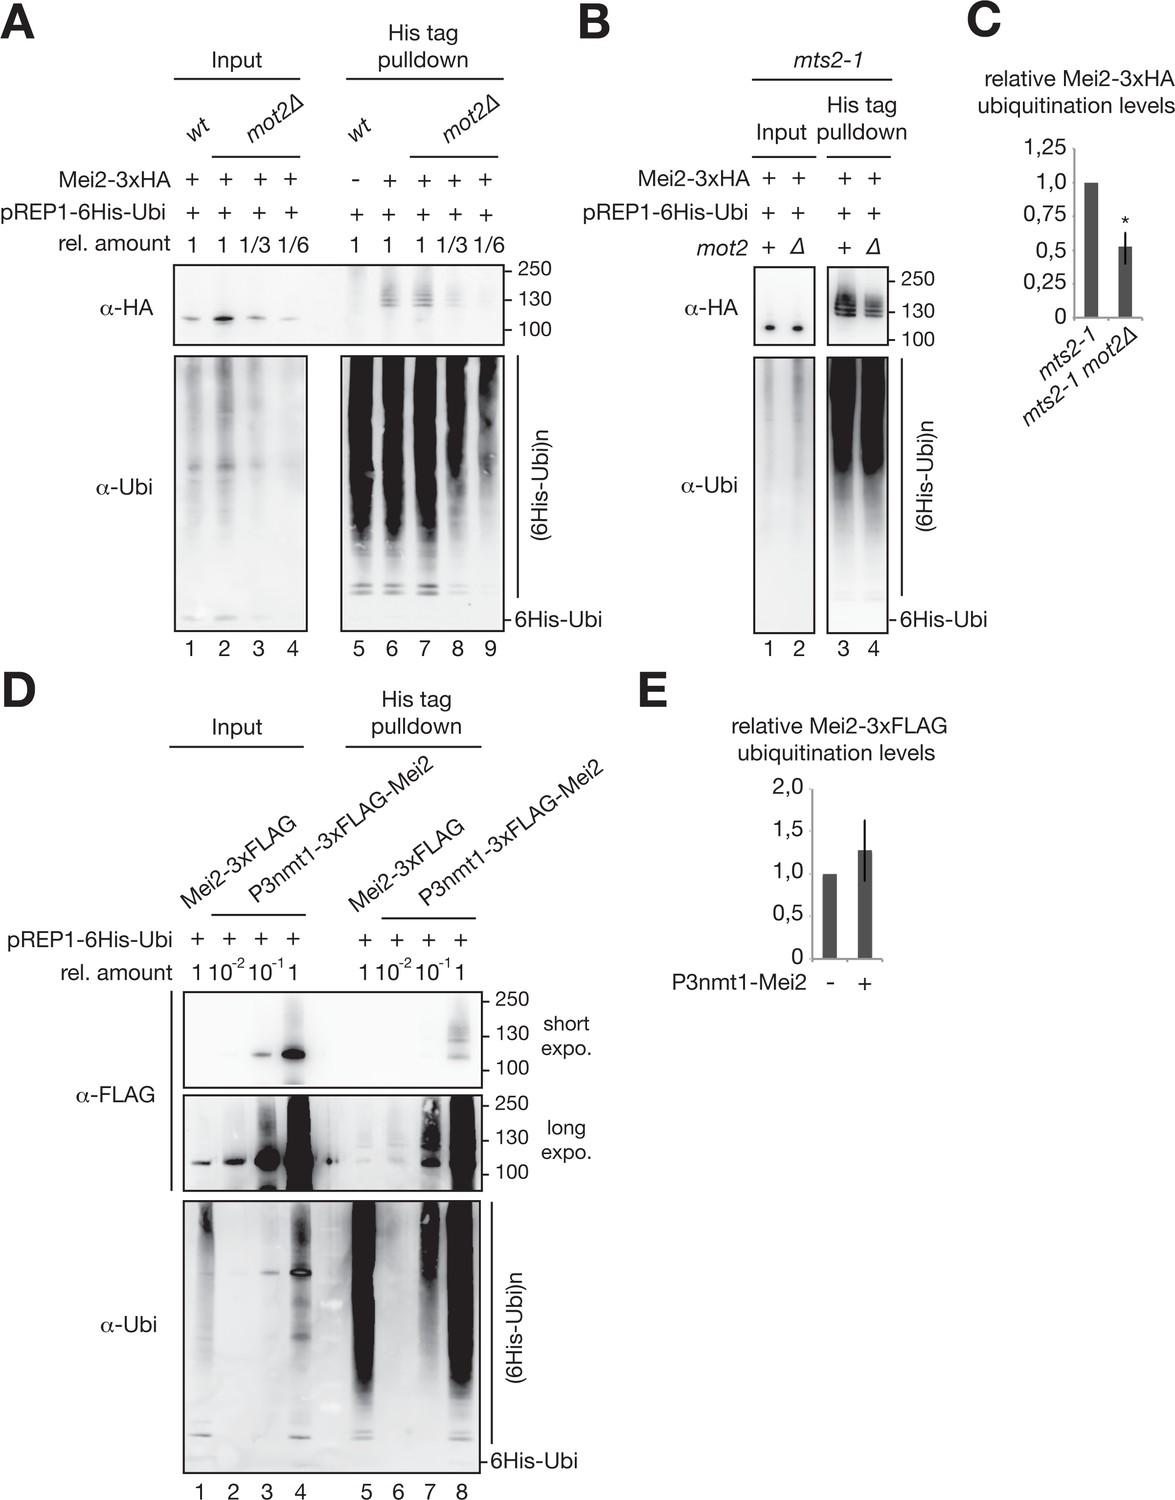
Contribution of Mot2 to the ubiquitination of Mei2.
(A) In vivo ubiquitination of Mei2-3xHA in wt and mot2∆ cells as described in Figure 6B. Samples of the mot2∆ mutant were serial diluted to estimate the levels of ubiquitinated Mei2 species when similar amounts of total Mei2 are used from the two strains. (B) In vivo ubiquitination of Mei2-3xHA as described in Figure 6B but in mts2-1 and mts2-1 mot2∆ cells grown in EMM-LEU0.5X at 28°C before a temperature shift at 37°C for 1 hr. (C) Quantification of Mei2 ubiquitinated species relative to total protein levels and expressed relative to mts2-1 cells. Error bars represent the standard deviation from three independent experiments. Stars denote statistical significance relative to the mts2-1 Mei2-3xHA strain (t-test p-value=1.89E-2). (D) In vivo ubiquitination of 3xFLAG-tagged Mei2 as described in Figure 6B but in cells expressing endogenous levels of the protein (e.g. Mei2-3xFLAG) or overexpressing it (e.g. P3nmt1-3xFLAG-Mei2). Total and ubiquitinated Mei2, as well as ubiquitin conjugates were analyzed using anti-FLAG and anti-ubiquitin antibodies respectively. Shown are short and long exposures for the anti-FLAG immunoblotting. (E) Quantification of Mei2 ubiquitinated species relative to total protein levels and expressed relative to Mei2-3xFLAG wild type cells. Error bars represent the deviation from the mean of biological duplicates.
Figure 6—figure supplement 2
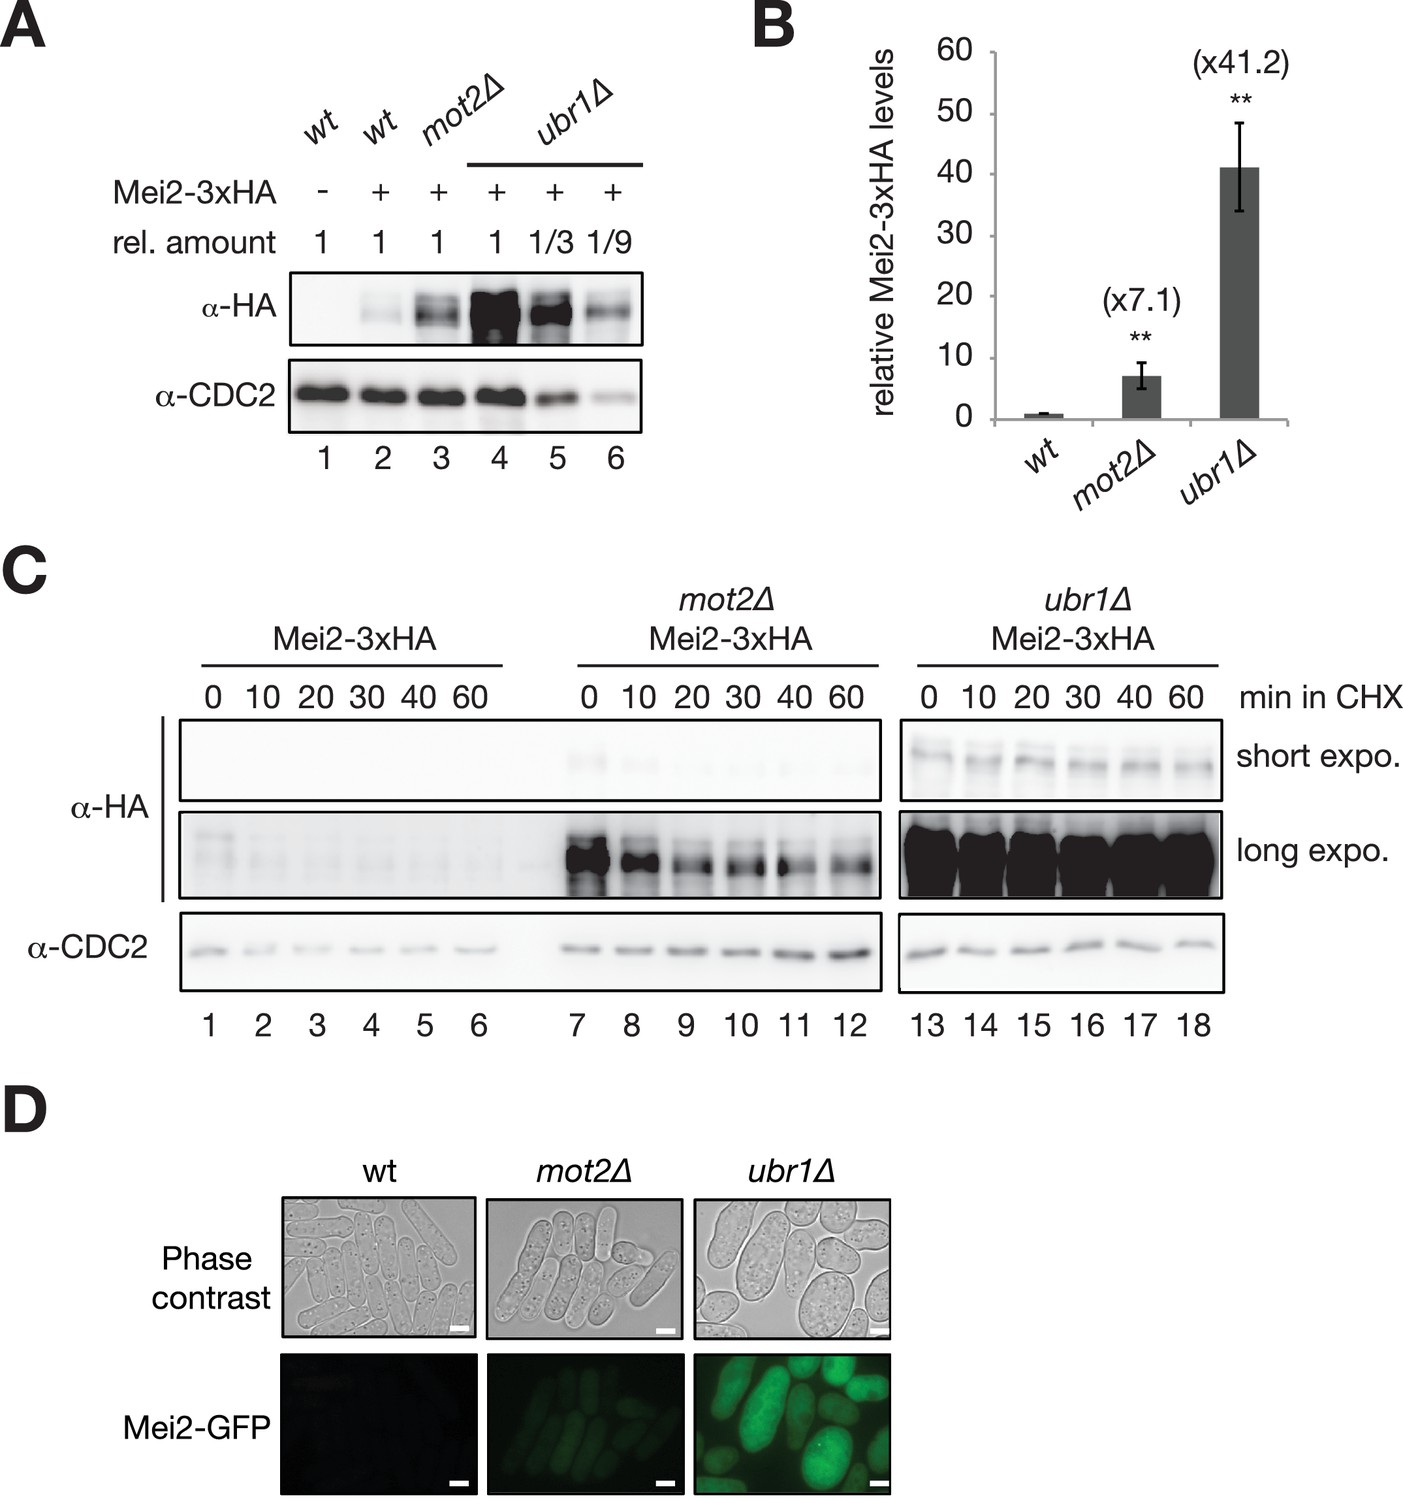
Both Mot2 and Ubr1 limit the accumulation of Mei2.
(A) Representative Western blot showing total Mei2-3xHA levels in wt, mot2∆ and ubr1∆ cells grown in minimal medium (EMM0.5X) at 30°C. Mei2 was detected using an anti-HA antibody and an anti-CDC2 antibody was used as a loading control. (B) Quantification of total Mei2-3xHA levels, normalized to CDC2 and expressed relative to wild type cells. Error bars represent the standard deviation from five independent experiments. Stars denote statistical significance relative to Mei2-3xHA wild type cells (t-test p-values=2.66E-3 for mot2∆, and 2.25E-4 for ubr1∆). (C) Cycloheximide chase experiment of Mei2-3xHA in wt, mot2∆ and ubr1∆ cells. Cells were grown in minimal medium (EMM0.5X) at 30°C and harvested at the indicated time points following addition of 100 µg/mL cycloheximide. Mei2 was detected by immunoblotting using an anti-HA antibody and an anti-CDC2 antibody was used as a loading control. (D) Live cell microscopy of GFP-tagged Mei2 in wt, mot2∆ and ubr1∆ cells. Cells were grown in minimal medium (EMM0.5X) and imaged by phase contrast and with a GFP filter. Scale bars = 5 µm.
Figure 7
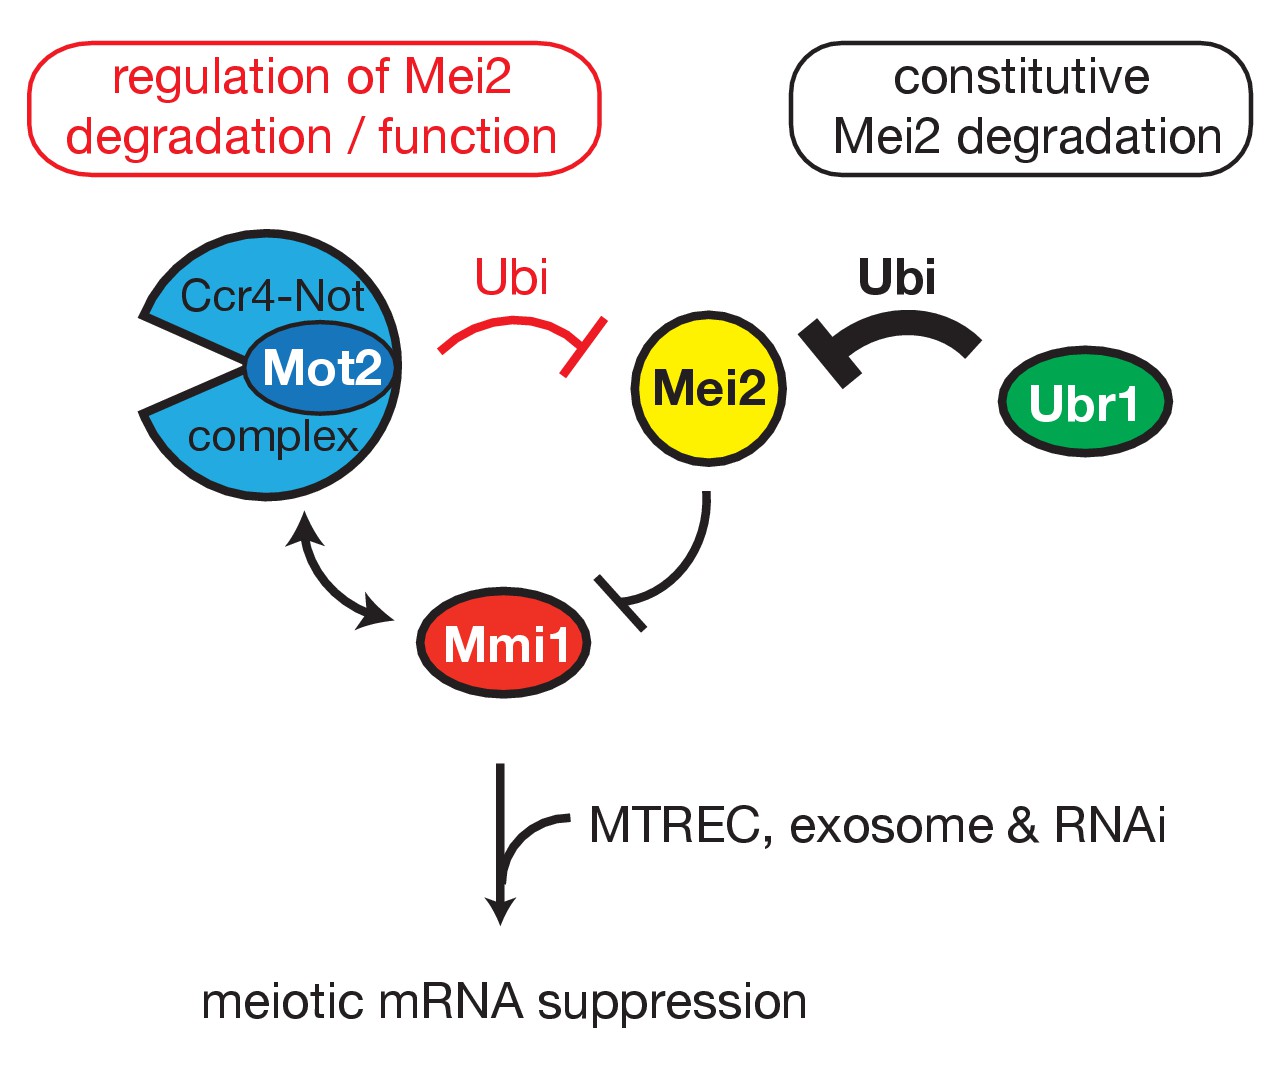
Model.
Shown is the regulatory circuit whereby Mmi1 recruits Mot2, likely in the context of Ccr4-Not, to ubiquitinate its own inhibitor Mei2. The E3 ubiquitin ligase Ubr1 is involved in the constitutive pathway of Mei2 turnover. Both Mot2 and Ubr1 contribute to maintain low levels of Mei2, thereby preserving the activity of Mmi1 and sustaining meiotic mRNAs suppression in vegetative cells.
Author response image 1
Kinetics of 35S-methionine uptake in budding and fission yeasts.
S. cerevisiae (BY4742) and S.pombe wild type cells were grown to exponential phase (OD = 0.3 and 0.45) in YNB (Yeast Nitrogen Base, 2% glucose) and EMMO.5X media, respectively. 50 µCi 35S-methionine (EasyTag L-[35S]-methionine, NEG709A005MC, PerkinElmer) were added to 5 mL cultures and cells were collected using 0.2 µm filters at the following time points: 30 sec, 10 min, 20 min, 40 min and 60 min. Filters and aliquots of media depleted for cells were counted using a liquid scintillation counter (WALLAC 1409 DSA, Perkin Elmer) to determine the % of 35S-methionine uptake (filled lines) and the % of 35S-methionine remaining in the culture media (dashed lines). Blue and red curves refer to S. cerevisiae and S. pombe respectively.
Additional files
-
Supplementary file 1
S. pombe strains used in this study.
- https://doi.org/10.7554/eLife.28046.018
-
Supplementary file 2
Oligonucleotides used in this study.
- https://doi.org/10.7554/eLife.28046.019
-
Transparent reporting form
- https://doi.org/10.7554/eLife.28046.020
Download links
A two-part list of links to download the article, or parts of the article, in various formats.
Downloads (link to download the article as PDF)
Open citations (links to open the citations from this article in various online reference manager services)
Cite this article (links to download the citations from this article in formats compatible with various reference manager tools)
Ubiquitination-dependent control of sexual differentiation in fission yeast
eLife 6:e28046.
https://doi.org/10.7554/eLife.28046


