The structural basis for dynamic DNA binding and bridging interactions which condense the bacterial centromere
- University of Bristol, United Kingdom
- Centro Nacional de Biotecnologia, Consejo Superior de Investigaciones Cientificas, Spain
- Newcastle University, United Kingdom
- University of Antwerp, Belgium
- University of Sheffield, United Kingdom
- University of Leeds, United Kingdom
Figures
Figure 1 with 1 supplement
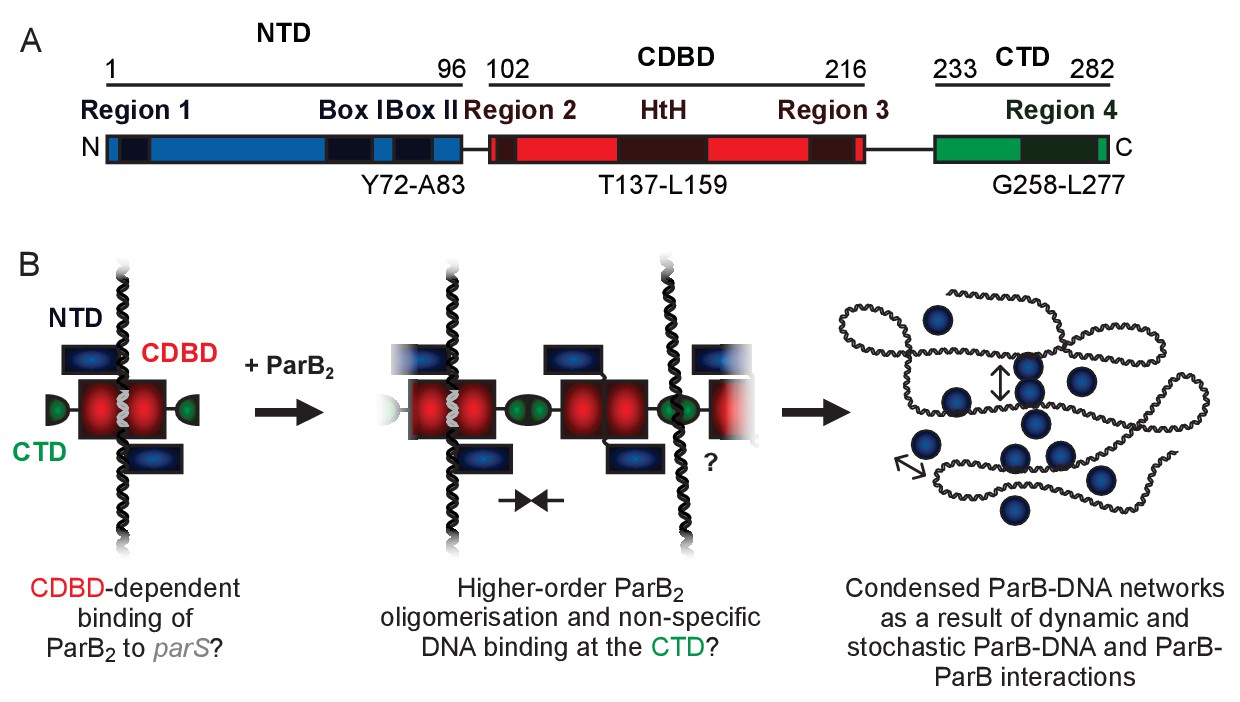
A hypothetical model for ParB-mediated condensation of the origin of replication region.
(A) Domains and regions as identified in (Bartosik et al., 2004; Kusiak et al., 2011). (B) ParB is thought to be anchored at parS (grey) via the HtH motif found in the CDBD (red). ParB protomers self-associate via poorly defined interactions and also make non-specific contacts with DNA segments, leading to the formation of ParB networks. In this work we have investigated the potential role of the CTD (green) in mediating ParB oligomerisation and non-specific DNA binding.
Figure 1—figure supplement 1
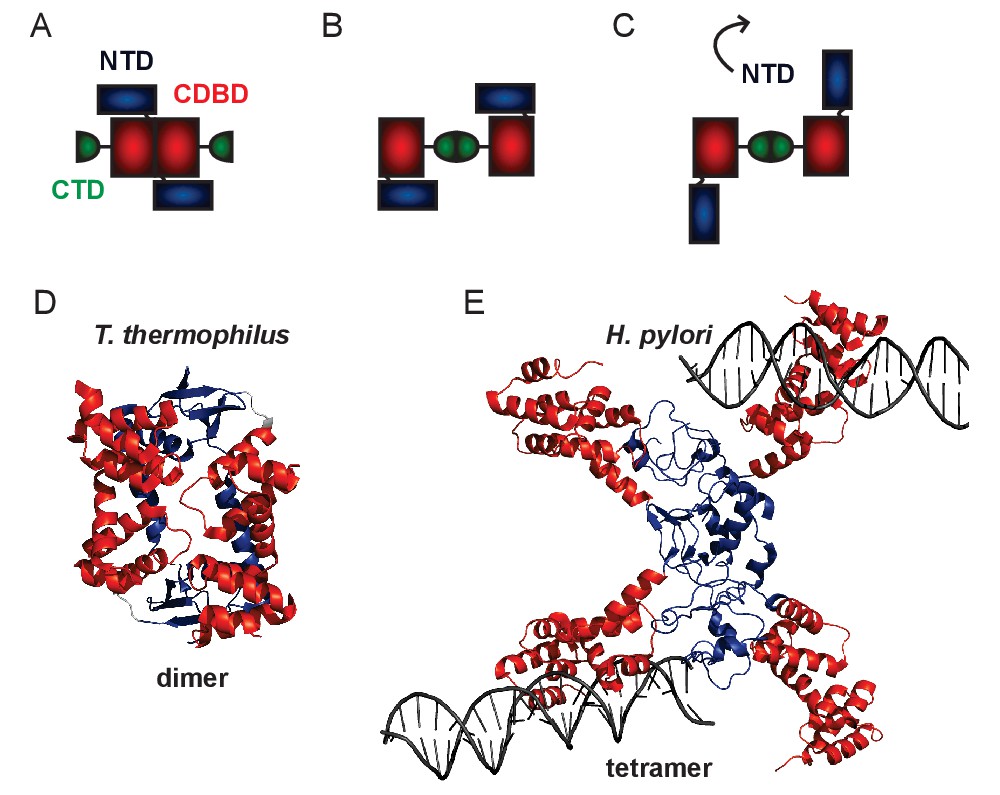
Structural models for genomic ParB.
(A–C) Schematics of different domain arrangements for dimeric B. subtilis ParB. Whilst it is known that ParB is dimeric in solution, the primary dimerisation interface is unclear and possibly condition-dependent. Structural evidence suggests that this could occur between the N-terminal and central DNA-binding domains or between the C-terminal domains. Additional structural evidence suggests that the NTD may flip away from the CDBD to form higher order ParB oligomers via a tetrameric interface. (D) Crystal structure of a dimer of the NTD and CDBD of T. thermophilus ParB (PDB entry IVZ0) (Leonard et al., 2004). (E) Crystal structure of a tetramer of the NTD and CDBD of H. pylori ParB bound to two parS-containing 24 bp dsDNA (PDB entry 4UMK) (Chen et al., 2015). The structures are colour-coded as in the primary structure diagram (Figure 1, main text).
Figure 2 with 1 supplement
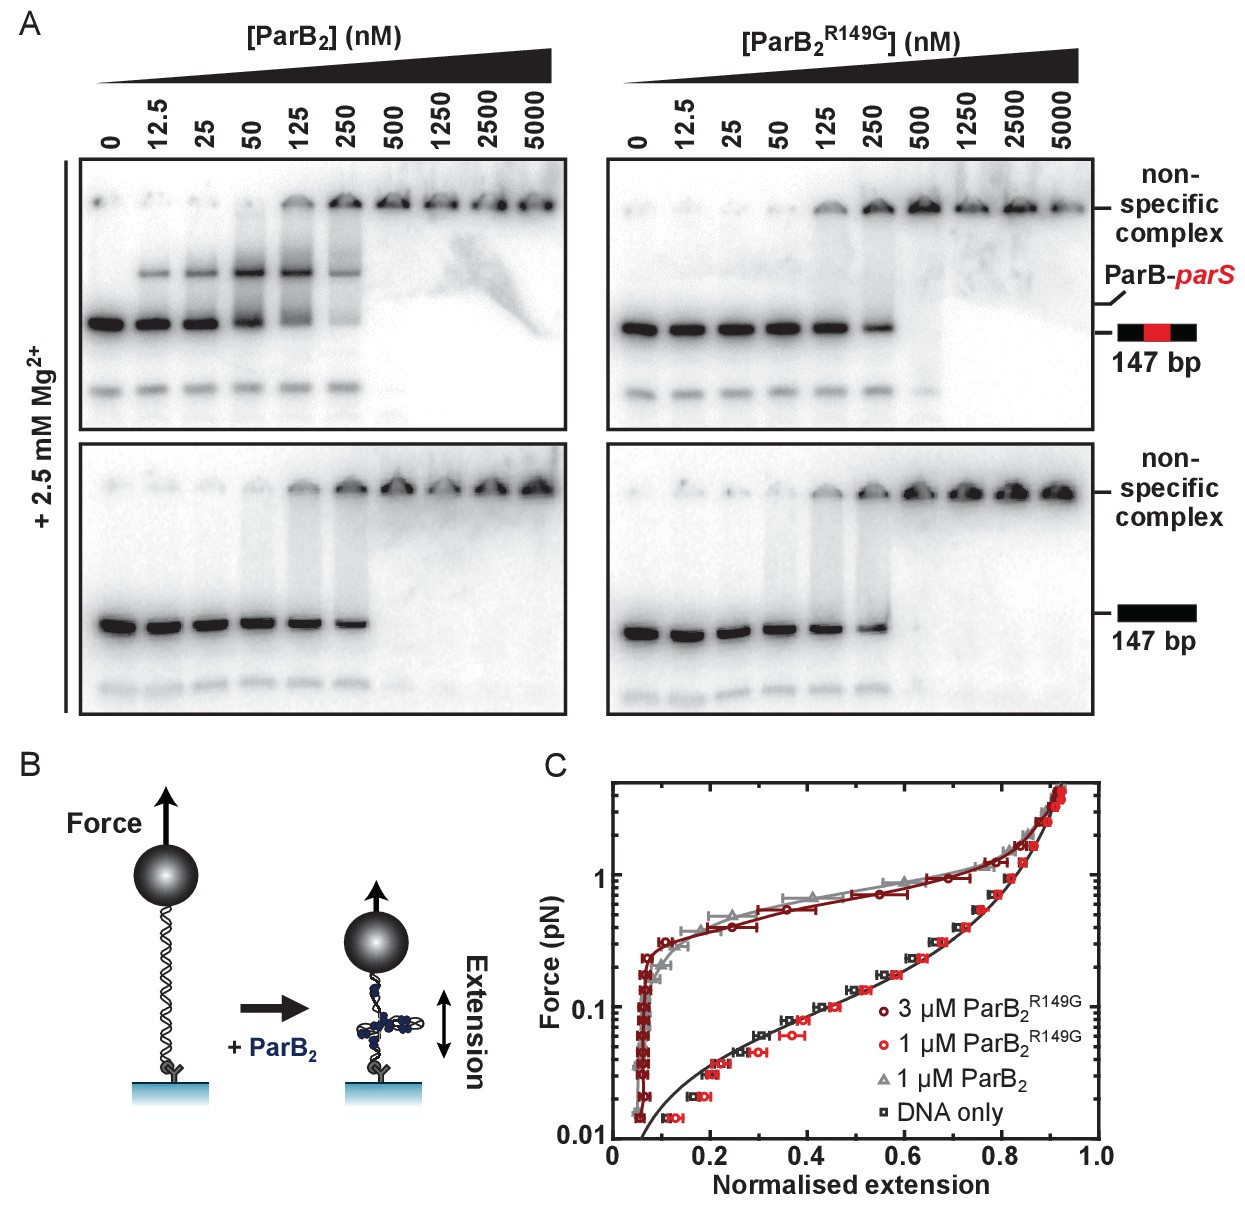
The R149 residue within the HtH motif is essential for specific binding to parS, but not required for non-specific binding and condensation.
(A) Representative TBM-EMSAs for wild type ParB and ParBR149G monitoring binding of parS-containing or non-specific 147 bp dsDNA. (B) Schematic of the magnetic tweezer assay used to monitor ParB-dependent DNA condensation. (C) Mean force-extension curves for parS-containing DNA molecules in the presence of wild type ParB and ParBR149G. Non-condensed DNA data is fitted to the worm-like chain model. Solid lines in condensed data are guides for the eye. Errors are the standard error of the mean of measurements on different molecules (N ~15–35 molecules).
Figure 2—figure supplement 1
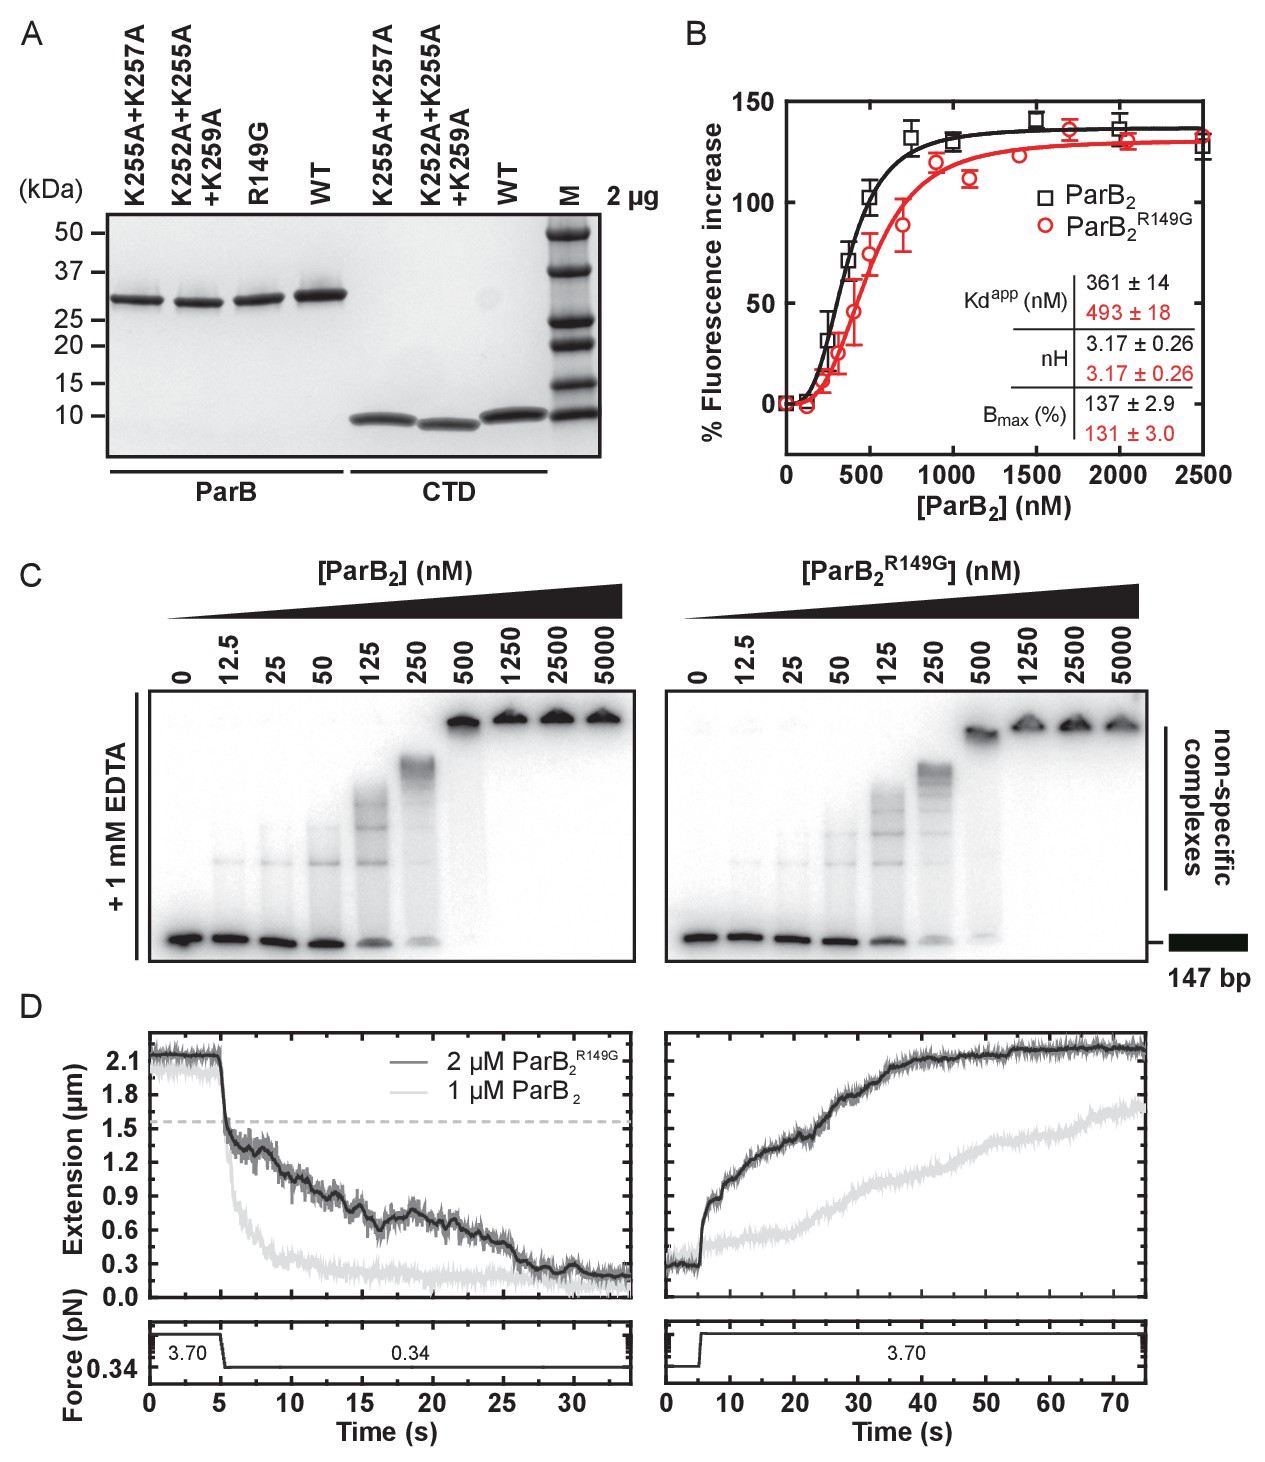
The R149 residue within the HtH motif is not required for non-specific binding and condensation.
(A) SDS-PAGE of wild type ParB and mutant protein preparations. (B) Non-specific DNA binding isotherms for wild type ParB and ParBR149G measured using a PIFE assay. The data were fitted to the Hill equation. Error bars represent the standard errors from three independent experiments. Standard errors of fitted parameters were calculated in GraphPad Prism. (C) TBE-EMSAs for wild type ParB and ParBR149G binding 147 bp DNA. (D) Left panel: representative condensation traces for wild type ParB and ParBR149G, monitored by magnetic tweezers. At a 3.70 pN stretching force, ParB was introduced to single DNA tethers. Following incubation, force was reduced to 0.34 pN to induce condensation. Expected DNA extension under 0.34 pN and in the absence of ParB is indicated by the dashed line. Right panel: representative force-induced decondensation traces for wild type ParB and ParBR149G.
Figure 3 with 1 supplement
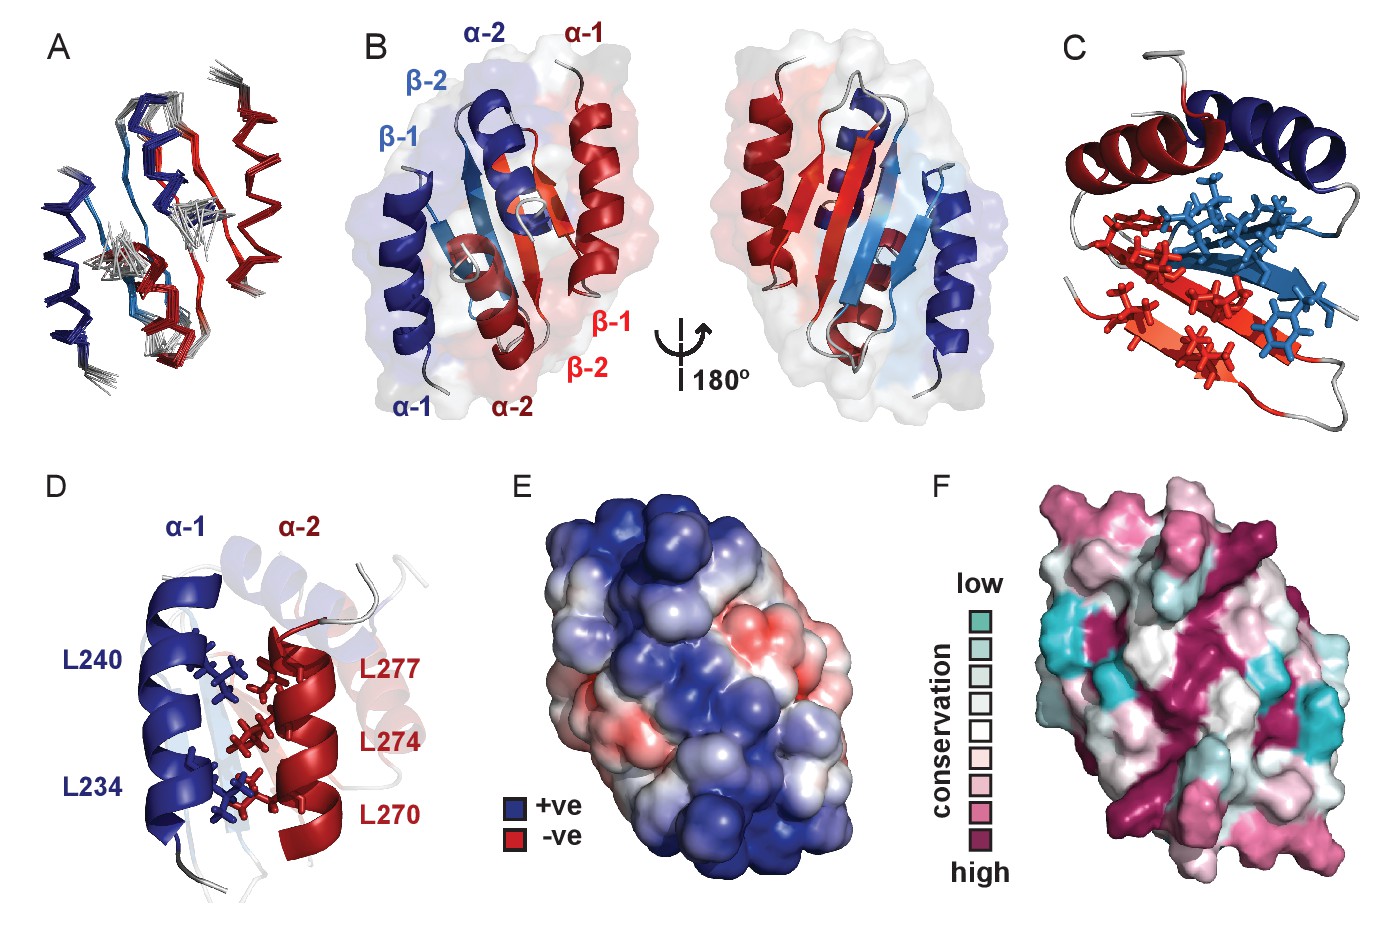
Solution NMR structure of the dimeric ParB C-terminal domain.
(A) Ensemble overlay of the 14 lowest-energy CTD structures. Red and blue depict separate monomers within the dimer. (B) Secondary structure elements are identified. α1 indicates the N-terminus of each monomer. (C) The hydrophobic core of Ile, Val, Leu and Phe residues. For clarity, portions of both monomers were removed. (D) Interdigitating Leu residues of both monomers form a leucine-zipper interaction. (E) Surface charge representation reveals a large electropositive region across the β-sheet face (orientation as in B, right hand side). Continuum electrostatics calculations used the PDB2PQR web server (Dolinsky et al., 2004) and the APBS plugin for PyMOL (Lerner and Carlson, 2006; Baker et al., 2001). (F) Evolutionary conservation surface profile of the CTD of ParB prepared using ConSurf (Goldenberg et al., 2009; Celniker et al., 2013) (orientation as in E). The chemical shifts, restraints and structural co-ordinates have been deposited with the BMRB (34122) and PDB (5NOC).
-
Figure 3—source data 1
NMR assignment, structure calculation and validation statistics.
acommonly assigned groups (i.e. excluding OH, Asp/Glu side-chain carbonyl, Lys amide and Arg guanidinium groups as well as tertiary aromatic carbons); bresidues 229–282; cvalues reported by ARIA 2.3 (Rieping et al., 2007); dordered residues (230-254, 259-278) as calculated by PSVS 1.5 (Bhattacharya et al., 2007); evalues reported by Procheck (Laskowski et al., 1993); fvalue reported by PDB validation software; g residues in secondary structure (231-245, 249-254, 257-264, 267-277). The structural validation programs used were as follows: CING (Doreleijers et al., 2012), Verify3D (Lüthy et al., 1992), Prosa II (Sippl, 1993), Procheck (Laskowski et al., 1993), MolProbity (Lovell et al., 2003).
- https://doi.org/10.7554/eLife.28086.008
Figure 3—figure supplement 1
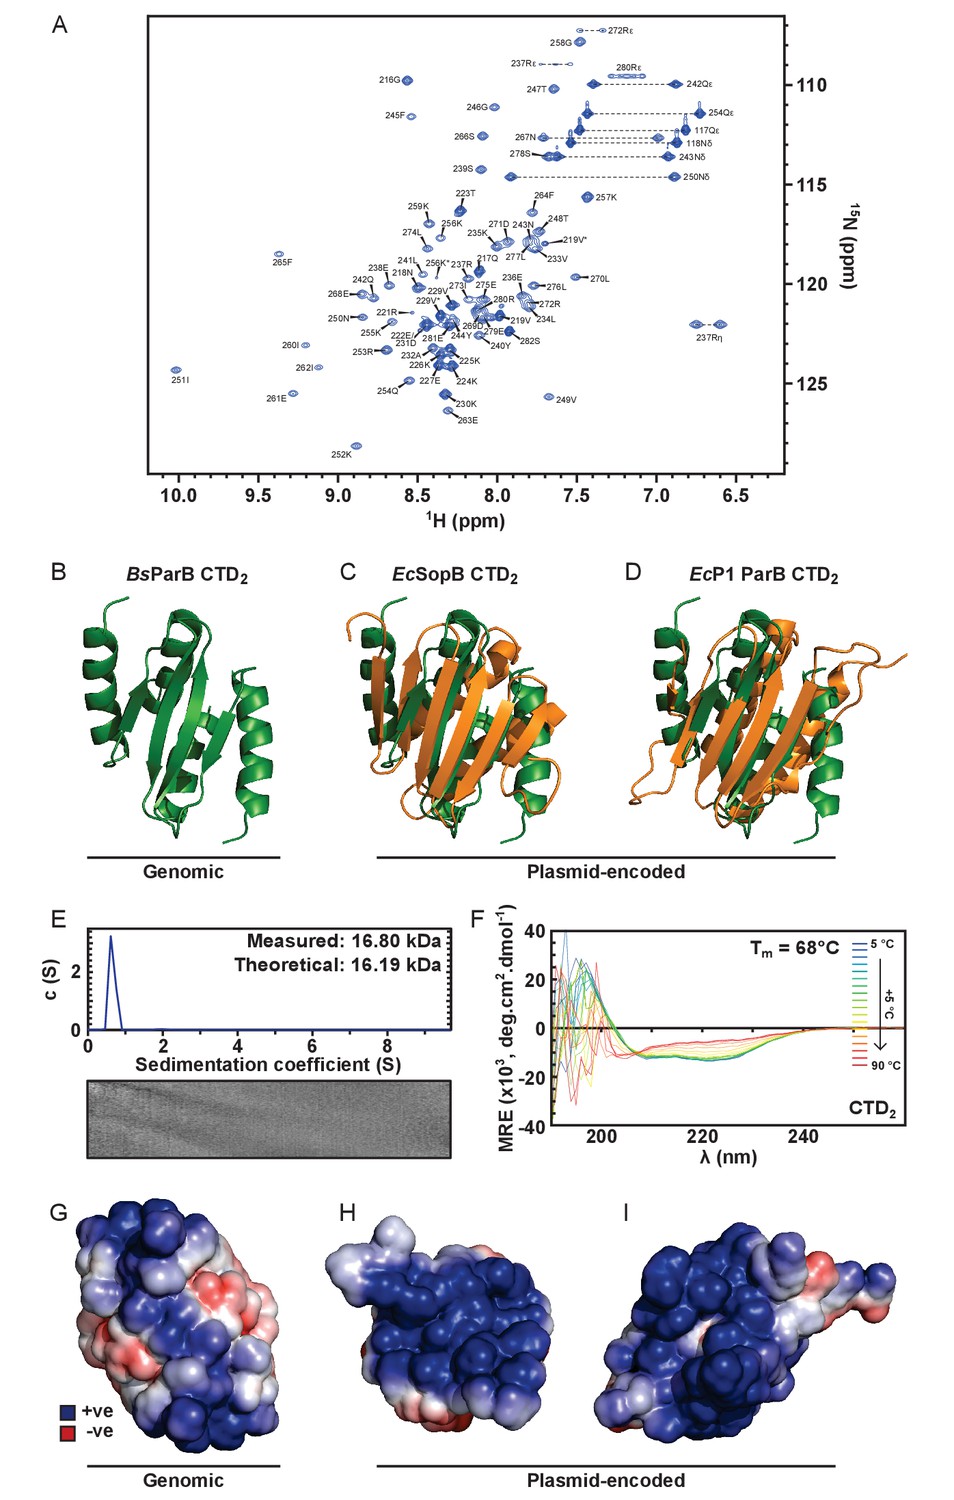
Solution NMR structure of the dimeric ParB CTD domain.
(A) Assigned 1H-15N HSQC spectra of CTD. Arginine ε and η peaks are aliased once and twice, respectively. Starred peaks indicate additional (usually minor) species. (B) The C-terminal domain of B. subtilis ParB (green). (C) Alignment of the secondary structure elements of the CTDs of B. subtilis ParB and E. coli plasmid-encoded SopB (orange) (Schumacher et al., 2010). PDB entry 3KZ5. (D) Alignment of the secondary structure elements of the CTDs of B. subtilis ParB and E. coli plasmid-encoded P1 ParB (orange) (Vecchiarelli et al., 2007). PDB entry 2NTZ. (E) ParB sedimentation velocity c(s) distribution fit at 20°C. Residuals are shown as a grayscale bitmap where the vertical axis lists each scan and the horizontal axis depicts radial position over which data were fitted. Shade indicates variance between fitted and raw data. RMSD = 0.0079. (F) CD spectra over a thermal denaturation scan (5°C to 90°C) for 10 µM CTD2 in PBS. (G–I) Continuum electrostatics calculations were prepared using the PDB2PQR web server (Dolinsky et al., 2004) and the APBS plugin for PyMOL (Lerner and Carlson, 2006). G to I are B. subtilis ParB, E. coli F-plasmid SopB and E. coli P1 ParB, respectively.
Figure 4 with 1 supplement
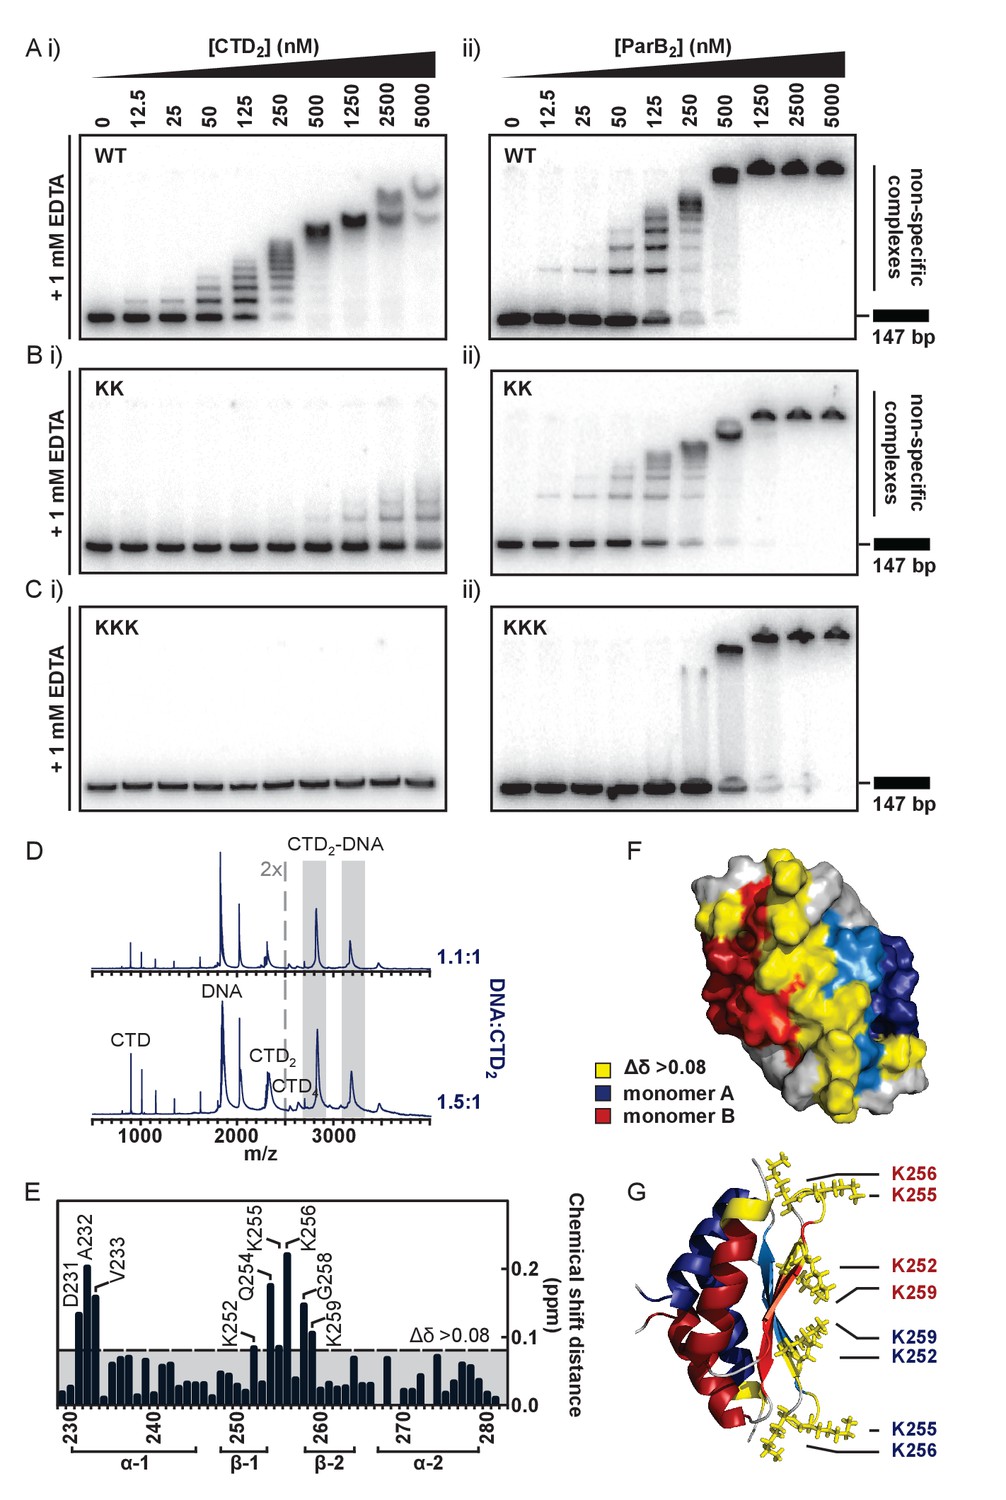
The CTD binds DNA via a lysine-rich surface.
(A–C) TBE-EMSAs for the titration of full length ParB and CTD against 147 bp DNA. Wild type and mutant proteins, K255A + K257A and K252A + K255A + K259A, are indicated. (D) Native mass spectrometry. Titrations of a 15 bp nsDNA hairpin against CTD were performed between ratios of 1.1:1 and 1.5:1 DNA:CTD2. Example spectra are shown with the DNA-CTD2 complex shaded in grey. (E) Deviations in the assigned 1H-15N HSQC spectra of CTD upon titration with a 10 bp hairpin DNA. (F) Chemical shift perturbations exceeding 0.08 ∆δ are highlighted on the structure in yellow. (G) Lys residues thought most likely to bind to DNA are shown as sticks.
Figure 4—figure supplement 1
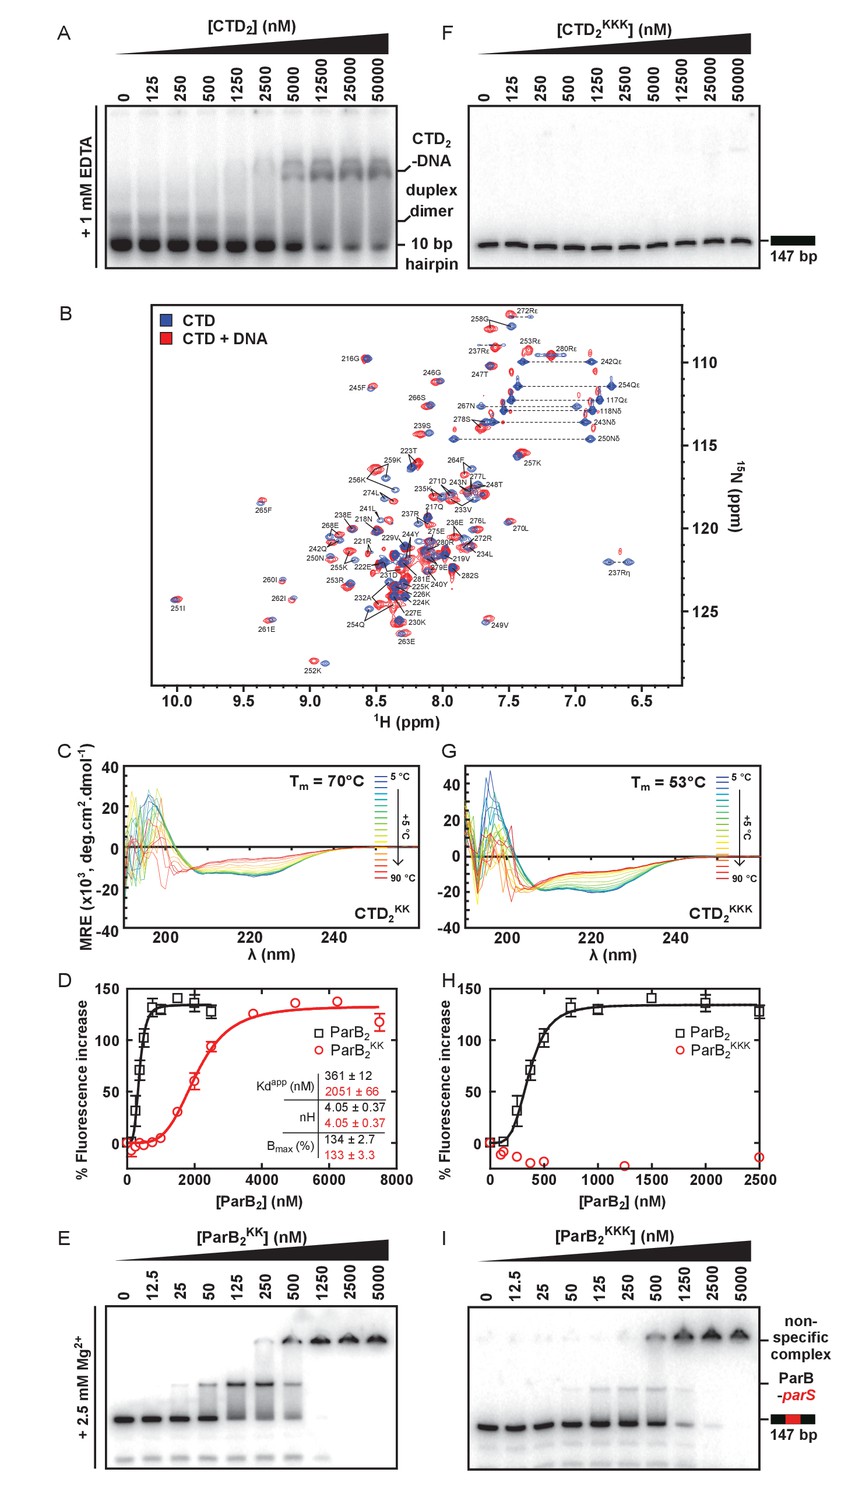
The CTD binds DNA via a lysine-rich surface.
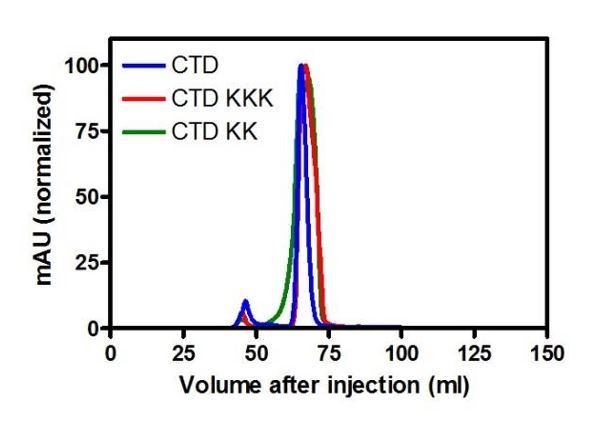
(A) TBE-EMSA showing binding of the CTD to the 10 bp hairpin DNA substrate used for NMR experiments. (B) Assigned 1H-15N HSQC spectra of the CTD prior (blue) and after (red) titration with a 10 bp hairpin DNA substrate. Arginine ε and η peaks are aliased once and twice, respectively. (C) CD spectra over a thermal denaturation scan (5°C to 90°C) for 10 µM CTD2KK in PBS. (D) PIFE assay showing binding of full length ParBKK to non-specific DNA. The data were fitted to the Hill equation. Error bars represent the standard errors from three independent experiments. Standard errors of fitted parameters were calculated in GraphPad Prism. (E) TBM-EMSA showing binding of full length ParBKK to parS-containing DNA. ParBKK is able to form specific complexes. (F) TBE-EMSA showing no binding of CTDKKK to DNA at concentrations as high as 50 µM dimer. (G) CD spectra for 10 µM CTD2KKK recorded as in C. (H) As in D, using ParBKKK. H uses the same wild-type ParB dataset as D. (I) TBM-EMSA showing binding of full length ParBKKK to parS-containing DNA. This mutant protein is also able to form specific complexes.
Figure 5 with 1 supplement
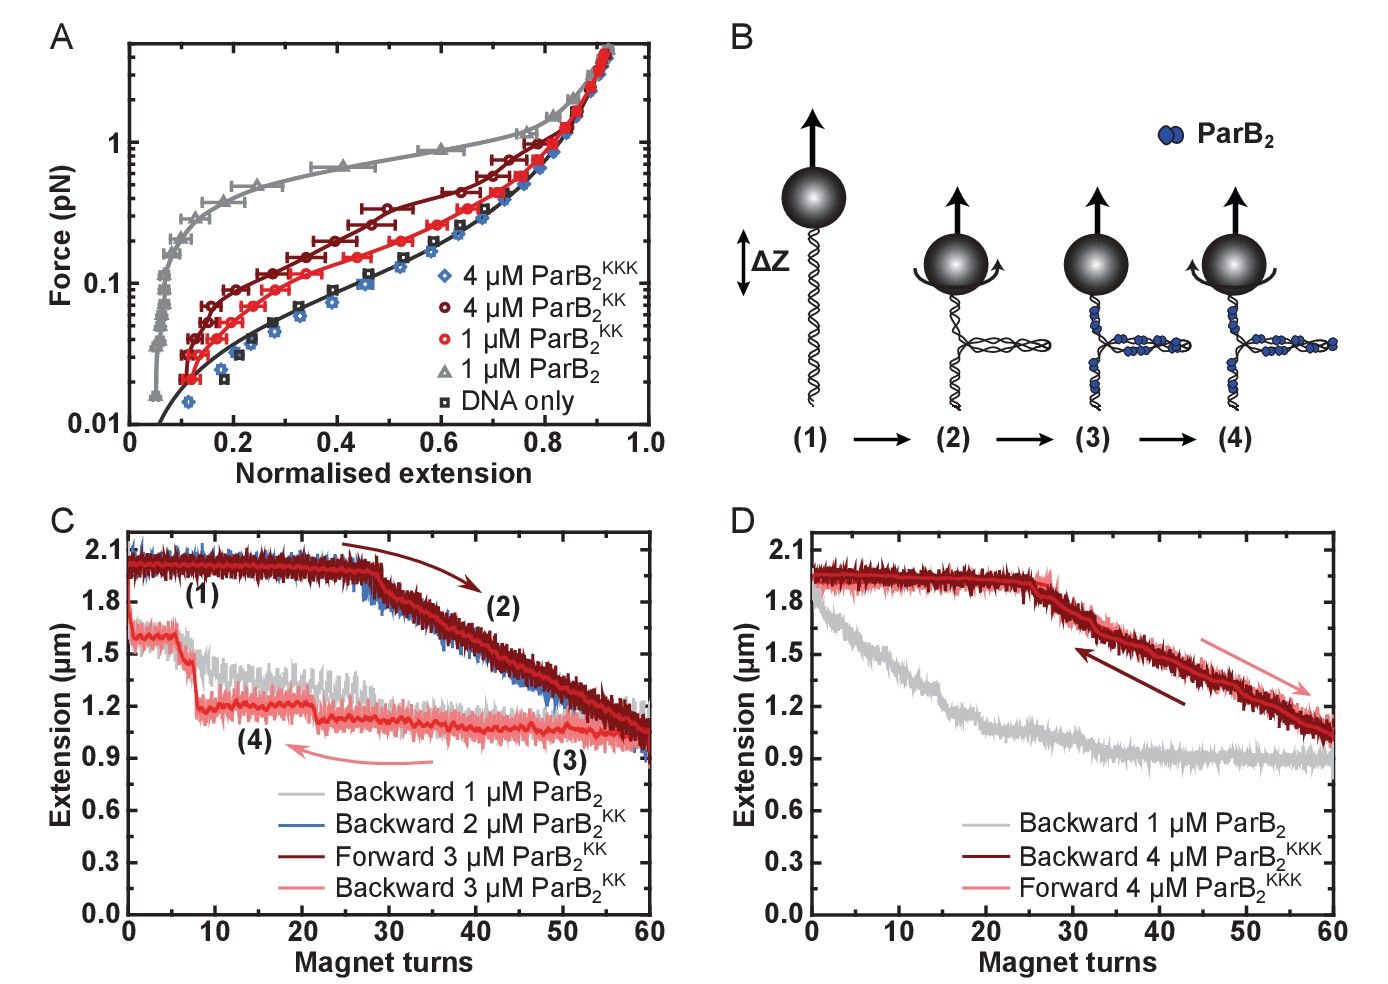
DNA binding by the CTD is required for efficient DNA condensation in vitro.
(A) Mean force-extension curves of DNA molecules co-incubated with ParB variants at the indicated concentrations. Non-condensed (protein-free) DNA data is fitted to the worm-like chain model. Solid lines in condensed data are guides for the eye. Errors are the standard error of the mean of measurements on different molecules (N ~ 18–35 molecules). (B) Schematic of plectoneme stabilisation assay. A single torsionally-constrained DNA molecule was positively supercoiled at 4 pN force by applying 60 turns. This shortens the tether length due to the formation of plectonemes in the overwound DNA. ParB2 is then introduced and all turns are released whilst monitoring DNA extension. Evidence for ParB-dependent plectoneme stabilisation is provided by hysteresis in the extension as a function of magnet turns as the supercoiling is removed. (C) Plectoneme stabilisation assay comparing bare DNA, wild type ParB and ParBKK. The double-mutant protein supported DNA bridging and occasionally large steps were observed in the backward trace (see text for discussion). (D) Plectoneme stabilisation assay comparing wild type ParB and ParBKKK. No activity was detected for the triple-mutant protein.
Figure 5—figure supplement 1
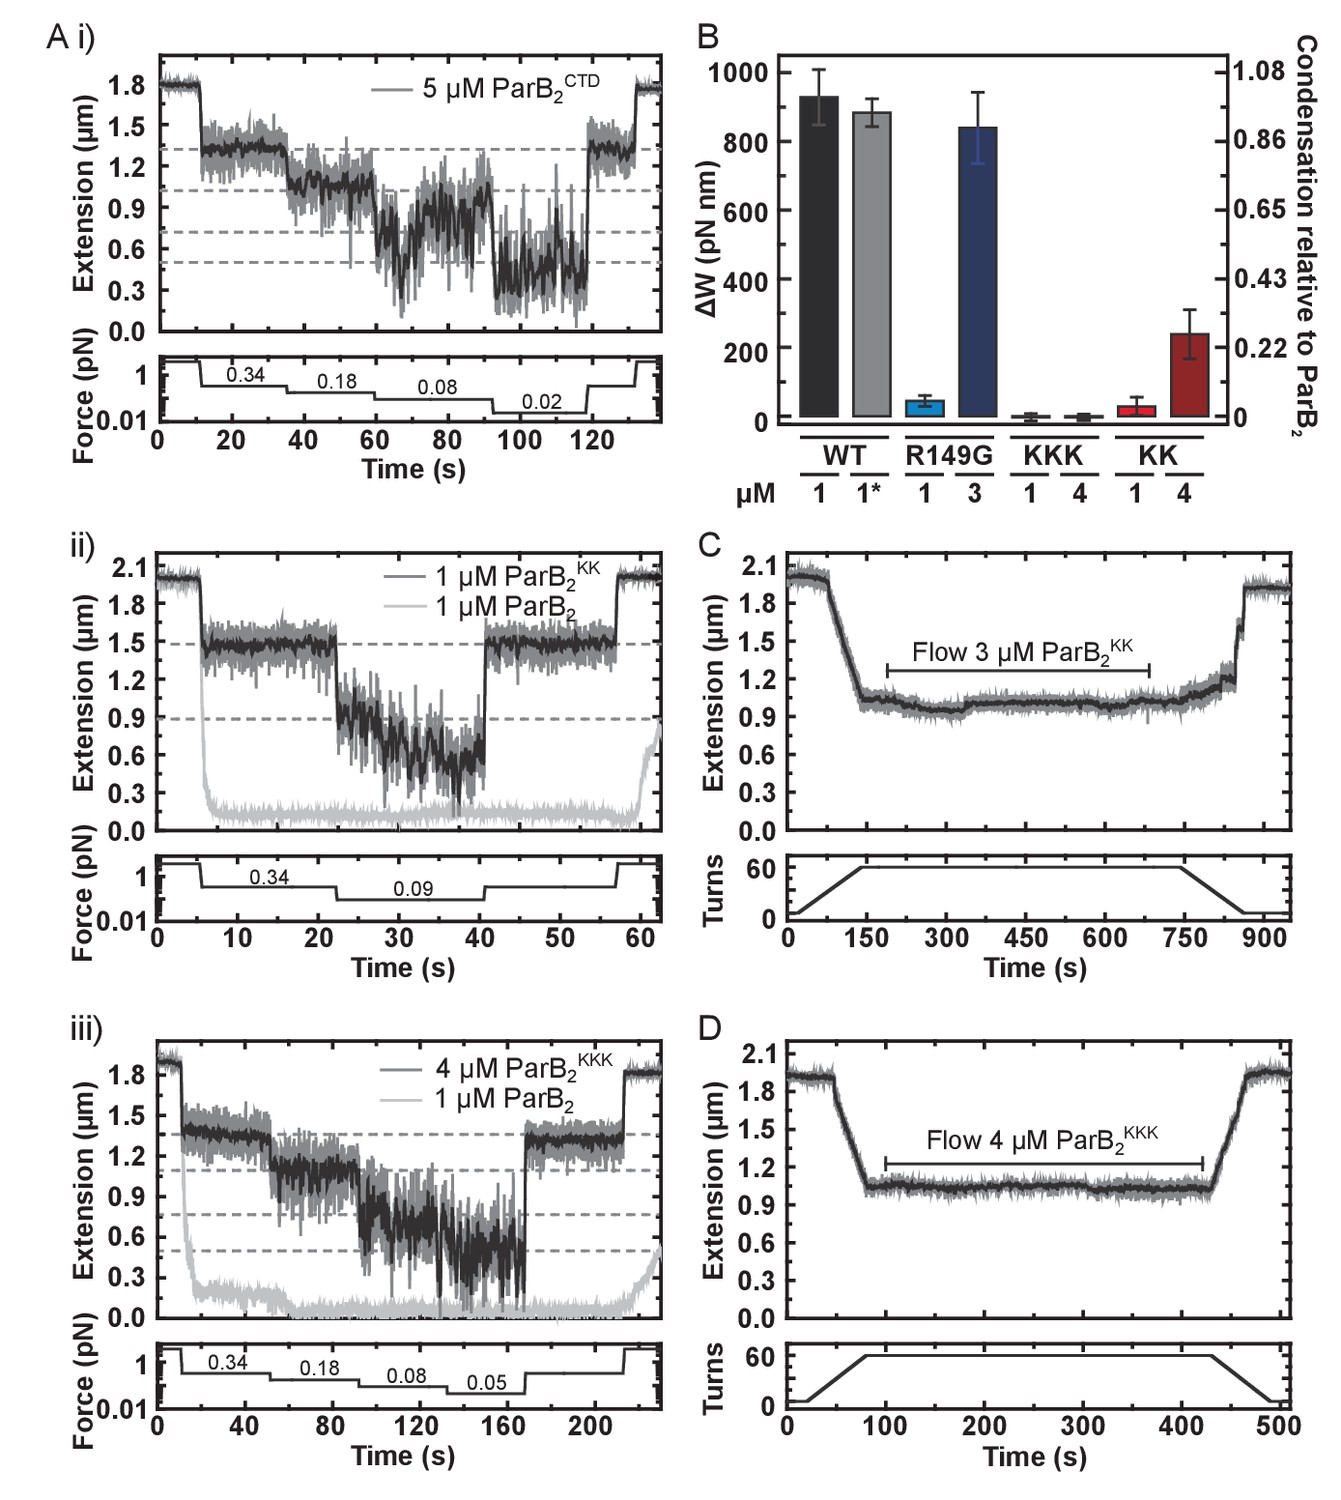
DNA binding by the CTD is required for efficient DNA condensation in vitro.
(A) Representative traces of condensation assays monitored by magnetic tweezers. The expected DNA extension in the absence of ParB at each force is indicated by the dashed lines. (i), (ii) and (ii) use CTD, ParBKK and ParBKKK, respectively. (B) A comparison of the work produced by full length ParB variants in condensing DNA. Errors are standard error of the mean. * indicates this experiment used nsDNA rather than parS-containing. (C) Representative trace of a ParBKK plectoneme stabilisation assay showing hysteresis of DNA extension upon DNA rewinding. (D) Representative trace of a ParBKKK plectoneme stabilisation assay showing no hysteresis upon DNA rewinding.
Figure 6 with 2 supplements
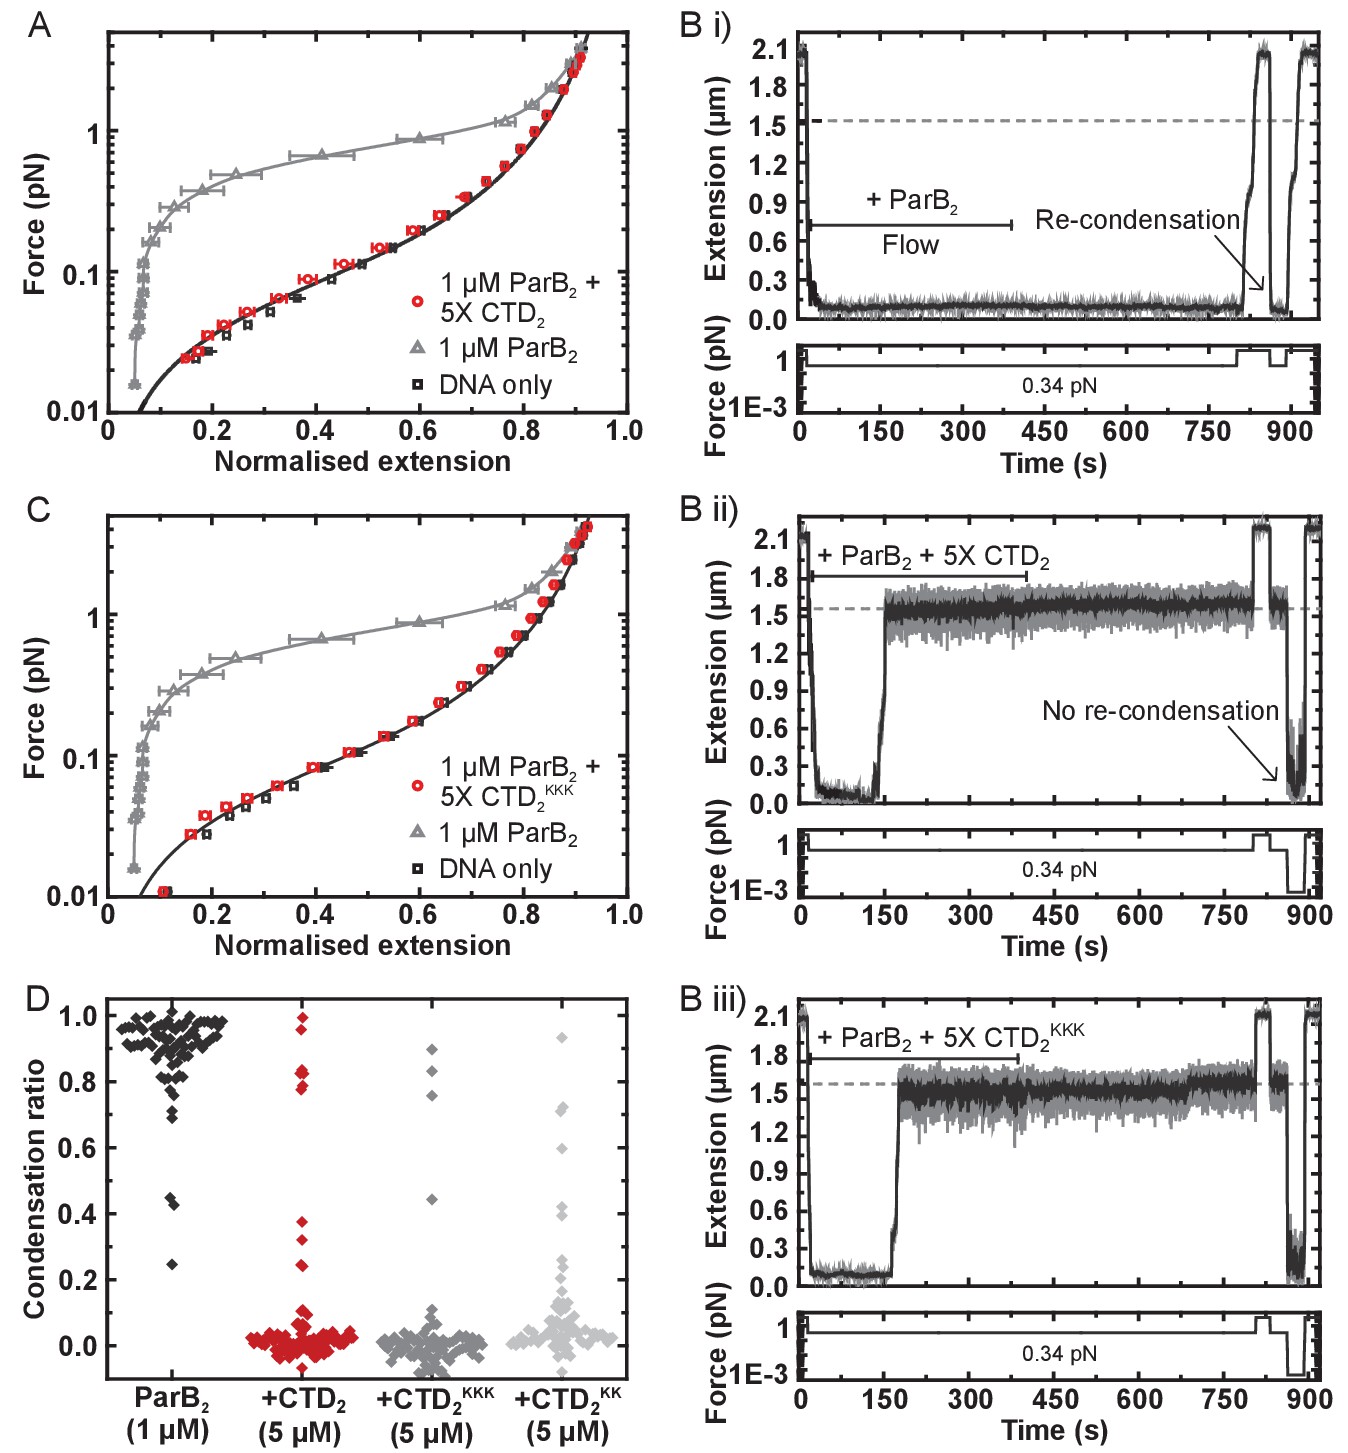
The CTD of ParB both inhibits and disrupts ParB-dependent DNA condensation.
(A) Mean force-extension curves for DNA molecules co-incubated with 1 µM ParB2 in the presence or absence of 5 µM CTD2. Non-condensed (protein-free) DNA data is fitted to the worm-like chain model. Solid lines in condensed data are guides for the eye. (B) (i) ParB-DNA networks are stable in magnetic tweezers in the presence of 1 µM ParB2. (ii) ParB-DNA complexes spontaneously decondense following the introduction of 1 µM ParB2 and 5 µM free CTD2. (iii) ParB-DNA complexes spontaneously decondense following the introduction of 1 µM ParB2 and 5 µM CTD2KKK. (C) Mean force-extension curves for DNA molecules co-incubated with 1 µM ParB2 in the presence or absence of 5 µM mutant CTD2KKK. Errors are the mean of measurements on different molecules (N > 40 molecules) (D) Condensation ratio (see Materials and methods for definition) for individual DNA condensation events involving the addition of CTD competitor variants to pre-condensed ParB-DNA networks.
Figure 6—figure supplement 1
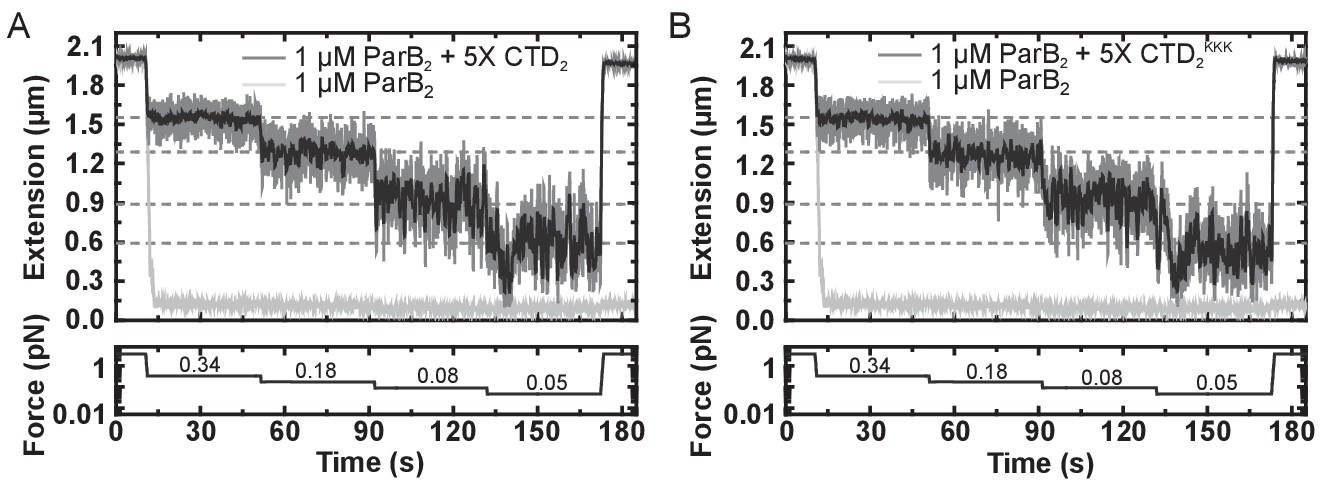
The CTD of ParB both inhibits and disrupts ParB-dependent DNA condensation.
(A) Representative traces of condensation assays for ParB in the presence and absence of excess free CTD. The expected DNA extension in the absence of ParB at each force is indicated by the dashed lines. (B) As in A, but using the CTDKKK variant in place of the CTD.
Figure 6—figure supplement 2
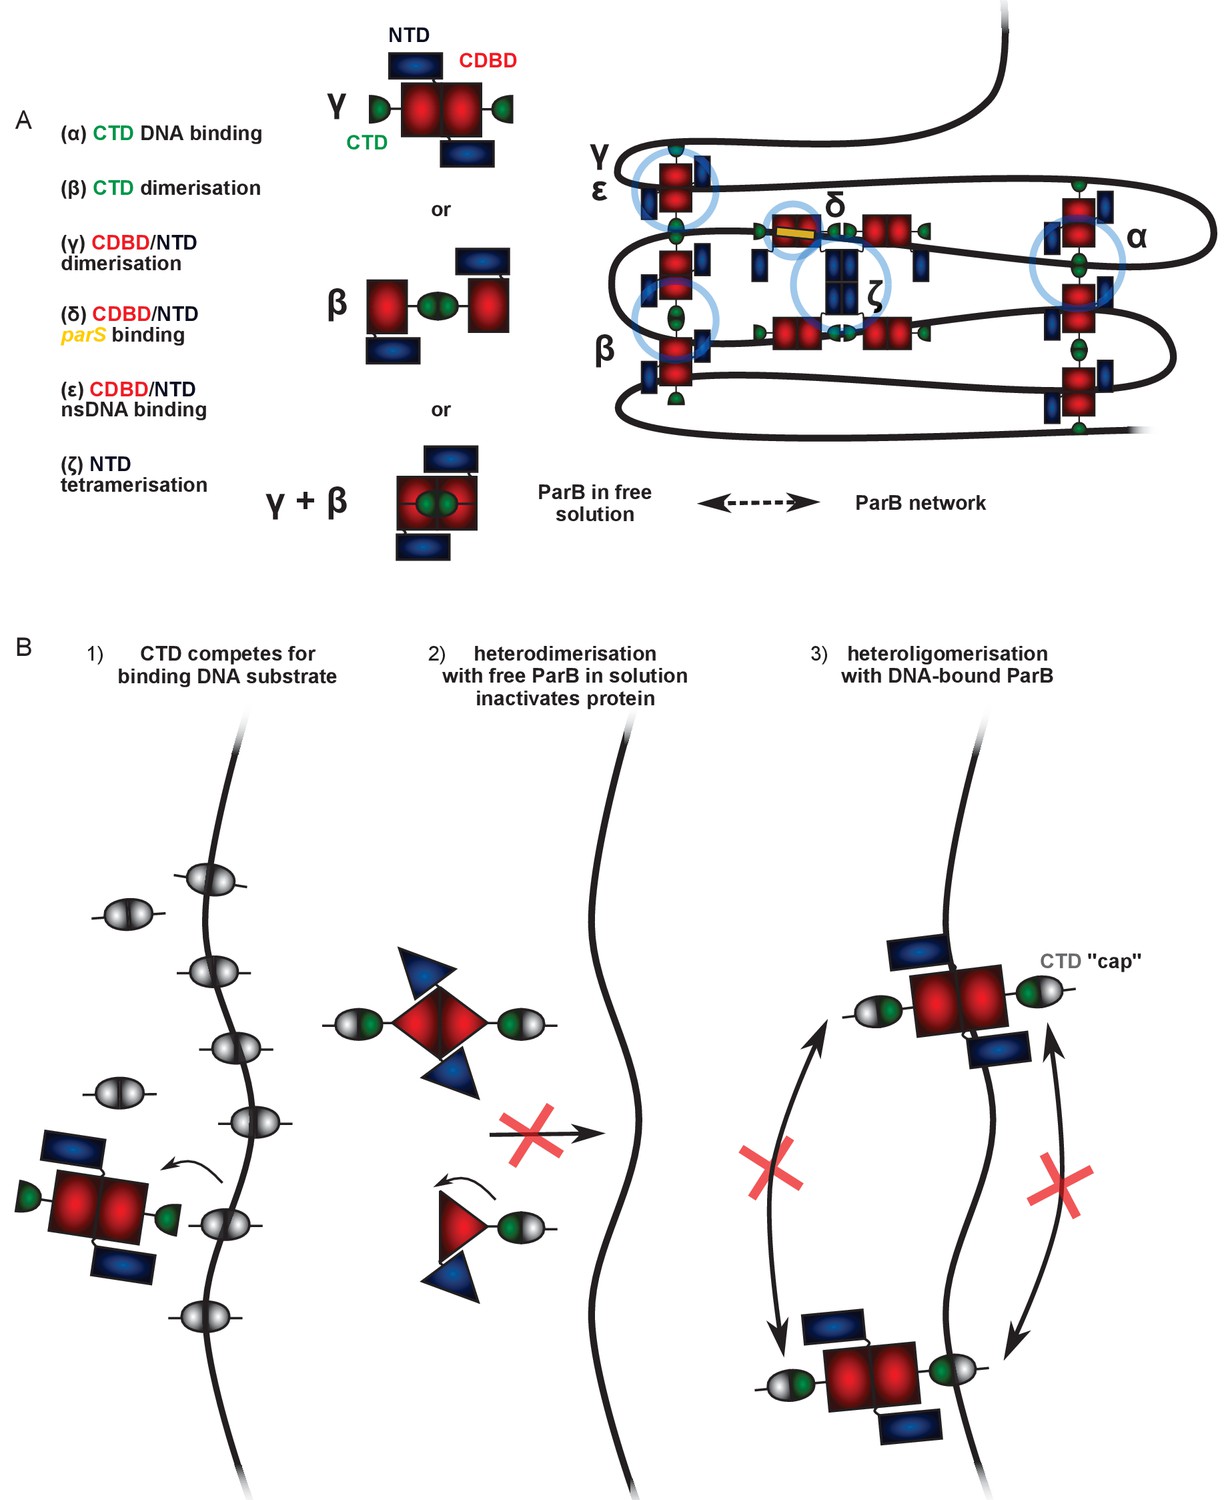
Possible mechanisms to explain the dominant negative effect of the CTD on full length ParB.
(A) A working model for ParB network formation and concomitant DNA condensation incorporating ideas from this work and other published studies (see main text for details). At least two DNA:protein and three protein:protein interfaces have been identified (greek letters), which together result in the formation of ParB networks on DNA, but only dimers in free solution. In free solution, the interfaces supporting dimerisation of ParB are unclear, but scenarios in which the CTD is dimerised may be considered to be more likely because the purified CTD has been shown to be a tight dimer. (B) Hypothetical mechanisms to explain CTD-induced DNA condensation. Scenario 1: The CTD dimer (which can bind dsDNA but not support condensation itself) simply competes for the DNA substrate in the magnetic tweezers, displacing full length ParB and therefore decondensing the DNA. Alternatively, the CTD exchanges with full length ParB forming inactive heterodimers in free solution that can no longer exchange with the ParB network (Scenario 2) or heterooligomers that retain DNA binding activity but which are not able to condense DNA because important bridging interactions are ‘capped’ by the CTD (Scenario 3). In scenario 3, we cannot exclude the idea that the interaction with the truncated CTD somehow has an allosteric effect on a different bridging interface, but the simplest explanation is that the CTD is itself responsible for key bridging interactions between DNA segments.
Figure 7 with 1 supplement
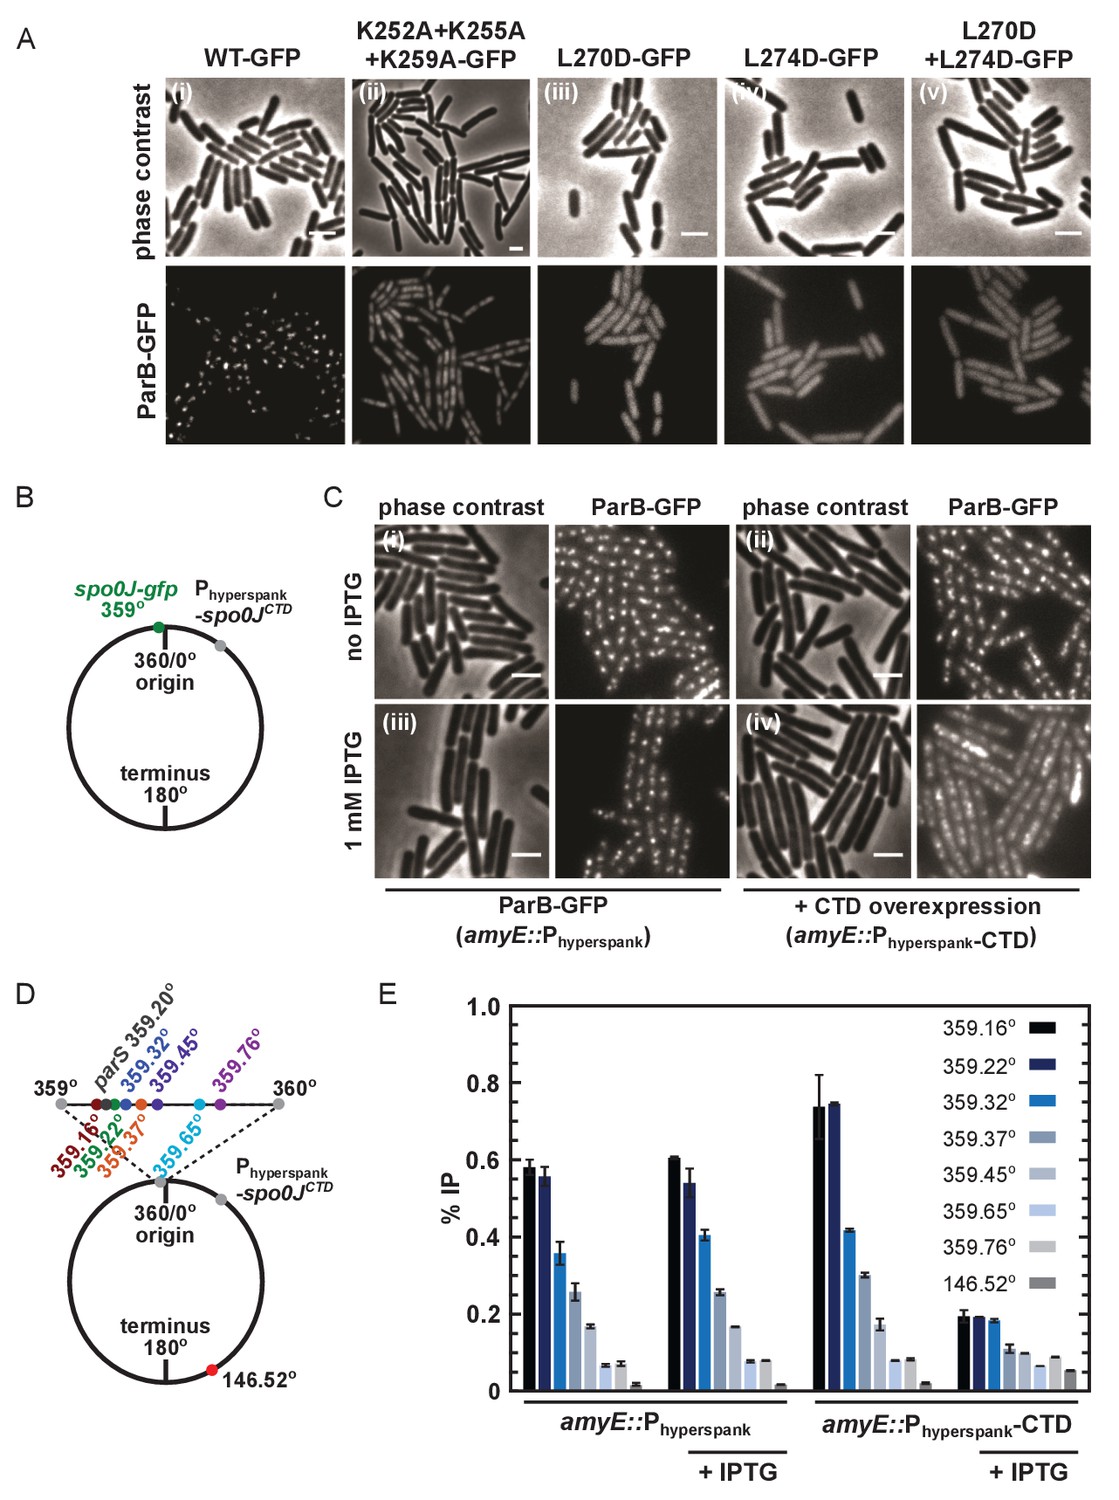
DNA-binding and dimerisation by the CTD is critical for ParB function in vivo.
(A) Variant ParB-GFP mutants form abnormal foci in B. subtilis. Cells were grown overnight in slow growth conditions before dilution (1:100) into fast growth media, and were allowed to achieve at least five mass doublings before observation by microscopy (N > 300 cells). Scale bar is 2 µm. (B) Construct design for overexpression of the CTD in vivo. (C) CTD overexpression was induced by IPTG in the presence of chromosomally-encoded wild type ParB-GFP using the Phyperspank construct. Cells were grown as in A. (D) Construct design for ChIP-qPCR. (E) ChIP-qPCR assay for ParB spreading. Cells were grown slowly overnight, diluted (1:100) into fast growth media, and allowed to reach eight mass doublings before crosslinking with 1% formaldehyde. Background IP was measured at the terminus (146°). Primer pairs produced 200–300 bp fragments.
Figure 7—figure supplement 1
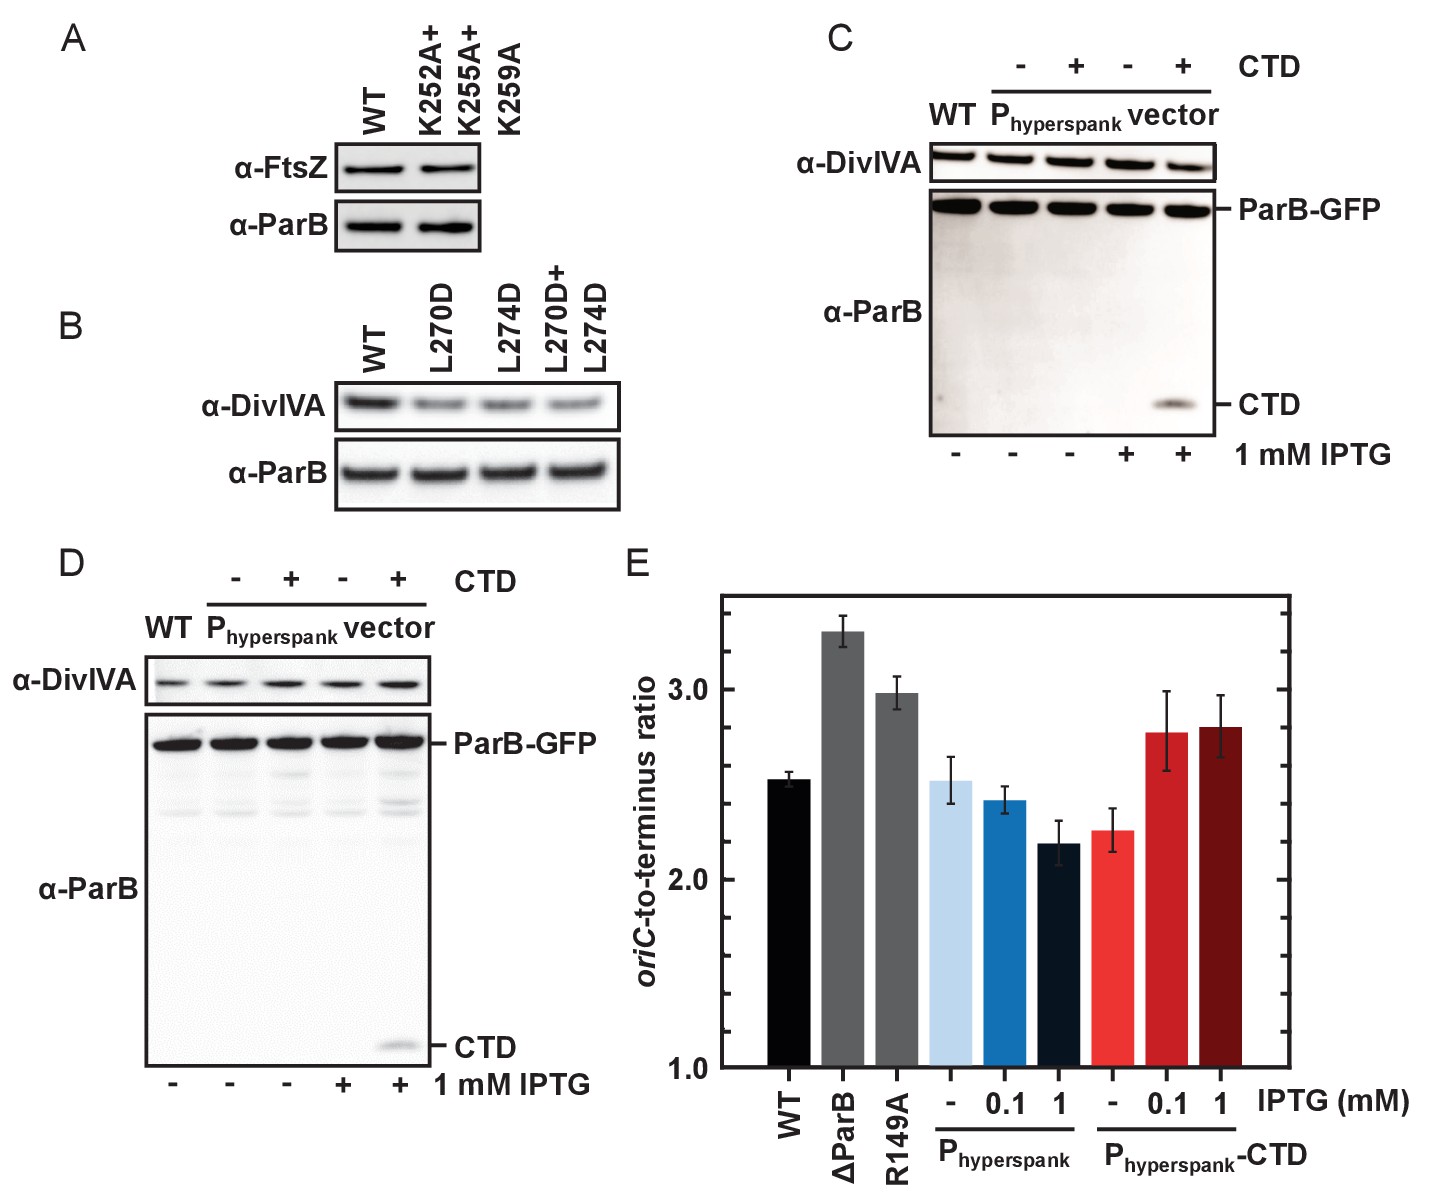
DNA-binding and dimerisation by the CTD is critical for ParB function in vivo.
(A–B) Western blot analysis. Expression levels of ParBL270D+L274D and ParBK252A+K255A+K259A with a C-terminal gfp fusion were similar to wild type ParB. DivIVA is an abundant cell division protein that was used as a loading control, as well as FtsZ. (C) Wild type ParB-GFP levels of expression were unaffected by overexpression of CTD. (D) As in C using the construct for ChIP-qPCR (Figure 7D). (E) Marker frequency analysis was used to measure the rate of DNA replication initiation. Cells were grown in slow growth media and allowed to achieve at least three mass doublings (A6000.3 to 0.5) before DNA was extracted. Regulation of DnaA by Soj was affected by overexpression of CTD. R149A is a parS DNA-binding mutant. Error bars indicate the standard deviation of three technical replicates.
Author response image 1
Tables
Table 1
Primer sequences used in ChIP-qPCR
https://doi.org/10.7554/eLife.28086.018| Plasmid | Genotype | Genome location |
|---|---|---|
| oqAKPCR3 | 5’-AGCCGGATTGATCAAACATC-3’ | 359.32° |
| oqAKPCR4 | 5’-AGAGCCGATCAGACGAAAAC-3’ | 359.32° |
| oqAKPCR5 | 5’-GAGGCAAGCAAAGCTCACTC-3’ | 359.45° |
| oqAKPCR6 | 5’-TGCCATGACAGAGCTGAAAC-3’ | 359.45° |
| oqAKPCR7 | 5’-CTTTTCCAAGGCCTTTAGCC-3’ | 359.22° |
| oqAKPCR8 | 5’-TCACGGAAAACCCATCATTT-3’ | 359.22° |
| oqAKPCR9 | 5’-TATTGGCCTGCTTCATACCC-3’ | 359.65° |
| oqAKPCR10 | 5’-TGGAGATTCTGTCCACGAAA-3’ | 359.65° |
| oqPCR9 | 5’-AAAAAGTGATTGCGGAGCAG-3’ | 359.16° |
| oqPCR10 | 5’-AGAACCGCATCTTTCACAGG-3’ | 359.16° |
| oqPCR25 | 5’-TCCATAATCGCCTCTTGGAC-3’ | 359.37° |
| oqPCR26 | 5’-AAGCGCATGCTTATGCTAGG-3’ | 359.37° |
| oqPCR31 | 5’-GATCCGAAGGTCTGTCTACG-3’ | 359.76° |
| oqPCR32 | 5’-CGATTGCGATTGTACGGTTG-3’ | 359.76° |
| oqPCR57 | 5’-TTTGCATGAACTGGGCAATA-3’ | 146.52° |
| oqPCR58 | 5’-TCCGAACATGTCCAATGAGA-3’ | 146.52° |
Additional files
-
Transparent reporting form
- https://doi.org/10.7554/eLife.28086.019
Download links
A two-part list of links to download the article, or parts of the article, in various formats.
Downloads (link to download the article as PDF)
Open citations (links to open the citations from this article in various online reference manager services)
Cite this article (links to download the citations from this article in formats compatible with various reference manager tools)
The structural basis for dynamic DNA binding and bridging interactions which condense the bacterial centromere
eLife 6:e28086.
https://doi.org/10.7554/eLife.28086


