A spatial memory signal shows that the parietal cortex has access to a craniotopic representation of space
- Columbia University College of Physicians and Surgeons, United States
- New York State Psychiatric Institute, United States
- Columbia University, United States
Figures
Figure 1
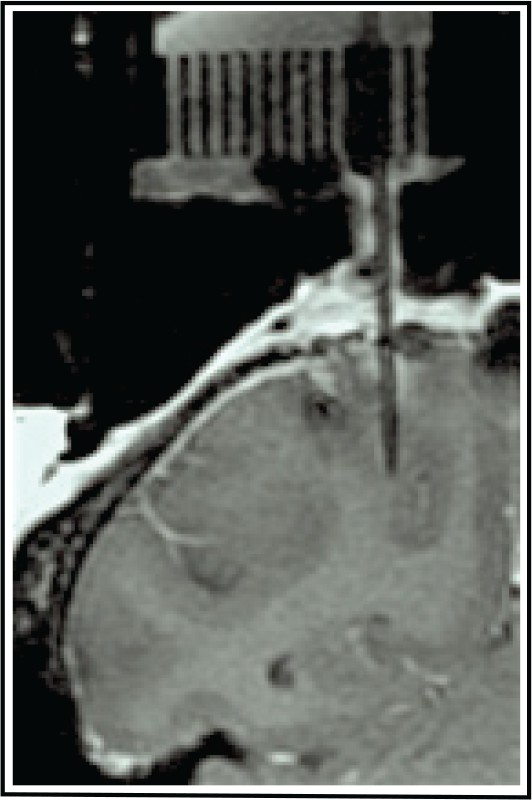
Location of LIP recordings.
(A) A tungsten microelectrode (250 µm thick, straight shadow) located in the target area based on known LIP activity and the commonly used atlas-defined coordinates (Paxinos et al., 1999; Saleem and Logothetis, 2012) within the given coronal slice of the brain. This electrode location was at −2 AP and +10 ML.
Figure 2
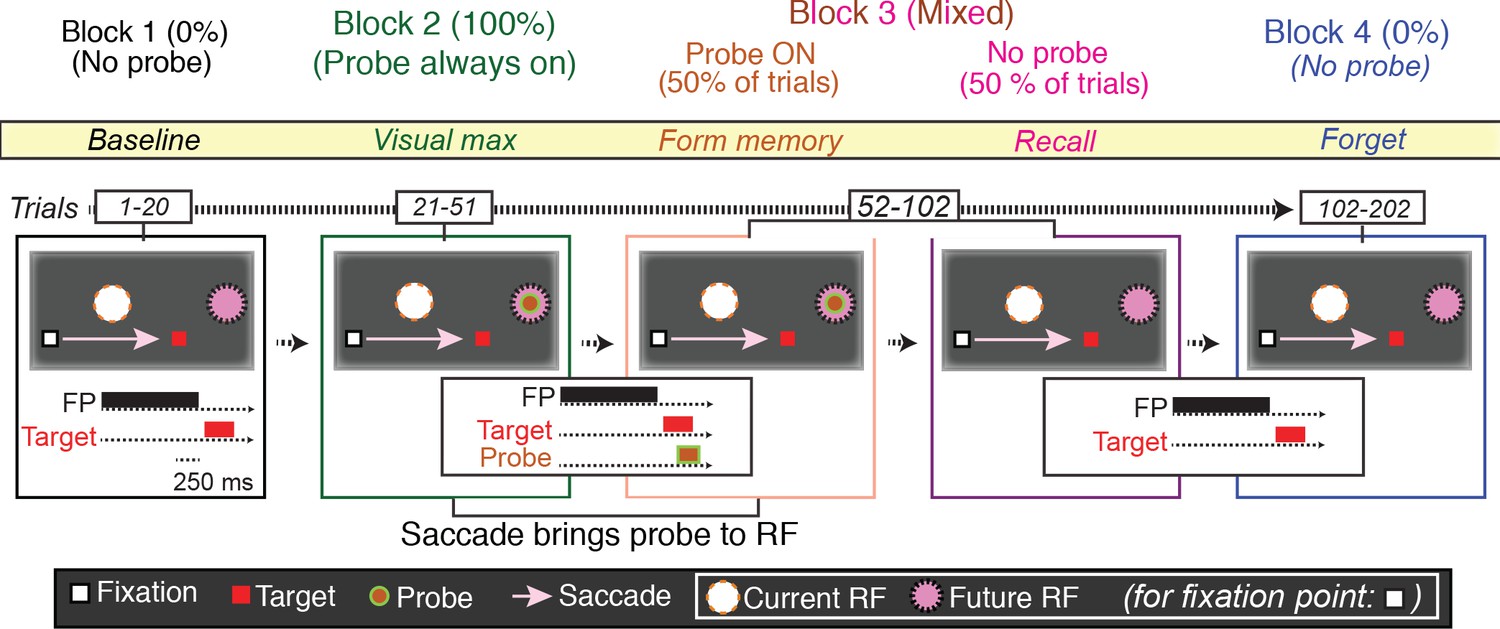
The basic memory task.
The different trials types were performed in blocks. In Block 1 (baseline), the monkey made a visually guided saccade to a point outside the neuron’s response field, to show that the saccade itself does not evoke neural activity. In the cartoon, the fixation point is a white square, the saccade target a red square, the presaccadic spatial location of the receptive field a white circle, the postsaccadic receptive field a magenta circle. The presentation times of the fixation point, saccade target and, when appropriate, probe stimuli are shown in the traces below. In Block 2 (visual max), the monkey made the same saccade, but now the saccade brought the probe stimulus into the receptive field. If the monkey made a saccade to the probe stimulus, the trial was terminated. In Block 3 (form and recall memory), for half of the trials, the probe stimulus appeared on the screen and was brought into the RF by the saccade. These trials were pseudorandomly intermixed with trials in which no probe stimulus appeared and the monkey made the same saccade. In block 4 (forget), the monkey made the same saccade but, as in Block 1, the probe stimulus never appeared.
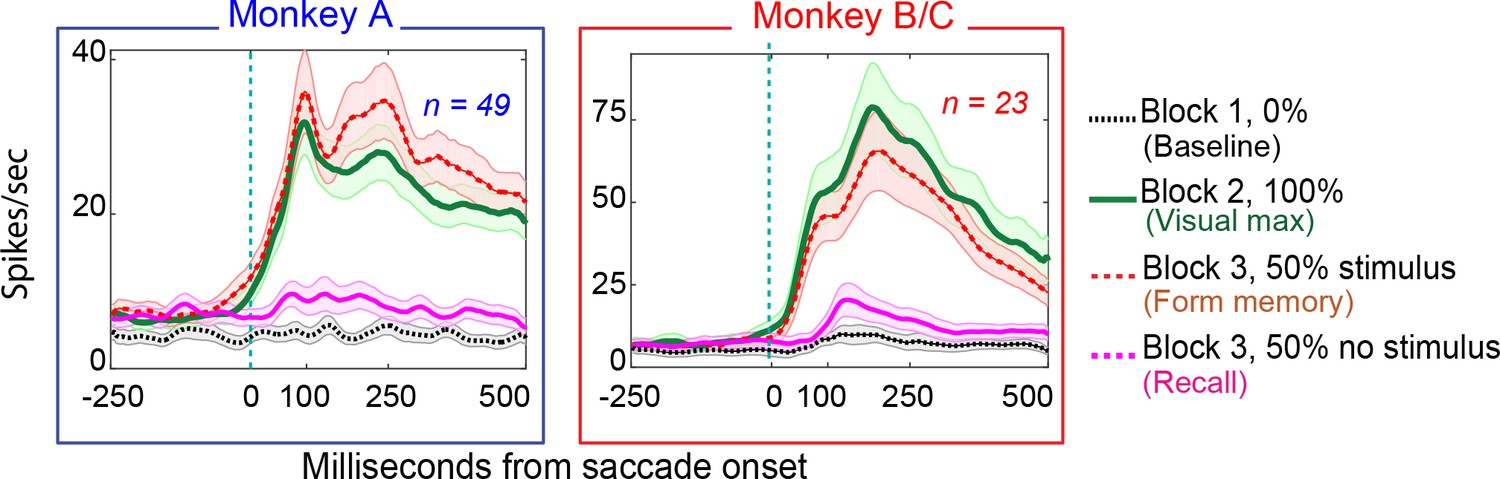
Figure 3

Single-cell responses in the basic memory task: from Monkey A (left panel) and Monkeys B and C (right panel).
Neural activity aligned to the beginning of the saccade. Shaded regions in the peristimulus time histograms (PSTHs) are standard errors of means calculated using all the trials in the given block. Black traces and raster dots: activity in Block 1, stimulus absent. Green traces and raster dots: activity in Block 2, 100% stimulus present. Red (broken) traces and raster dots: activity in stimulus-present trials in Block 3. Magenta traces and raster dots: activity in probe stimulus-absent trials in Block 3. Here, there is a brisk response that shows the expected latency advance evoked by predictive remapping (Duhamel et al., 1992). Note that the latency of the memory response is nearly 100 ms longer after the saccade than the predictive response. The memory decays after many (up to 100) trials. H and V are horizontal and vertical eye movements smoothed using a 10 ms sliding causal filter.
Figure 4
Population responses in the basic memory task: from Monkey A (left panel) and Monkeys B and C (right panel).
Block descriptions are as in Figure 3.
Figure 5
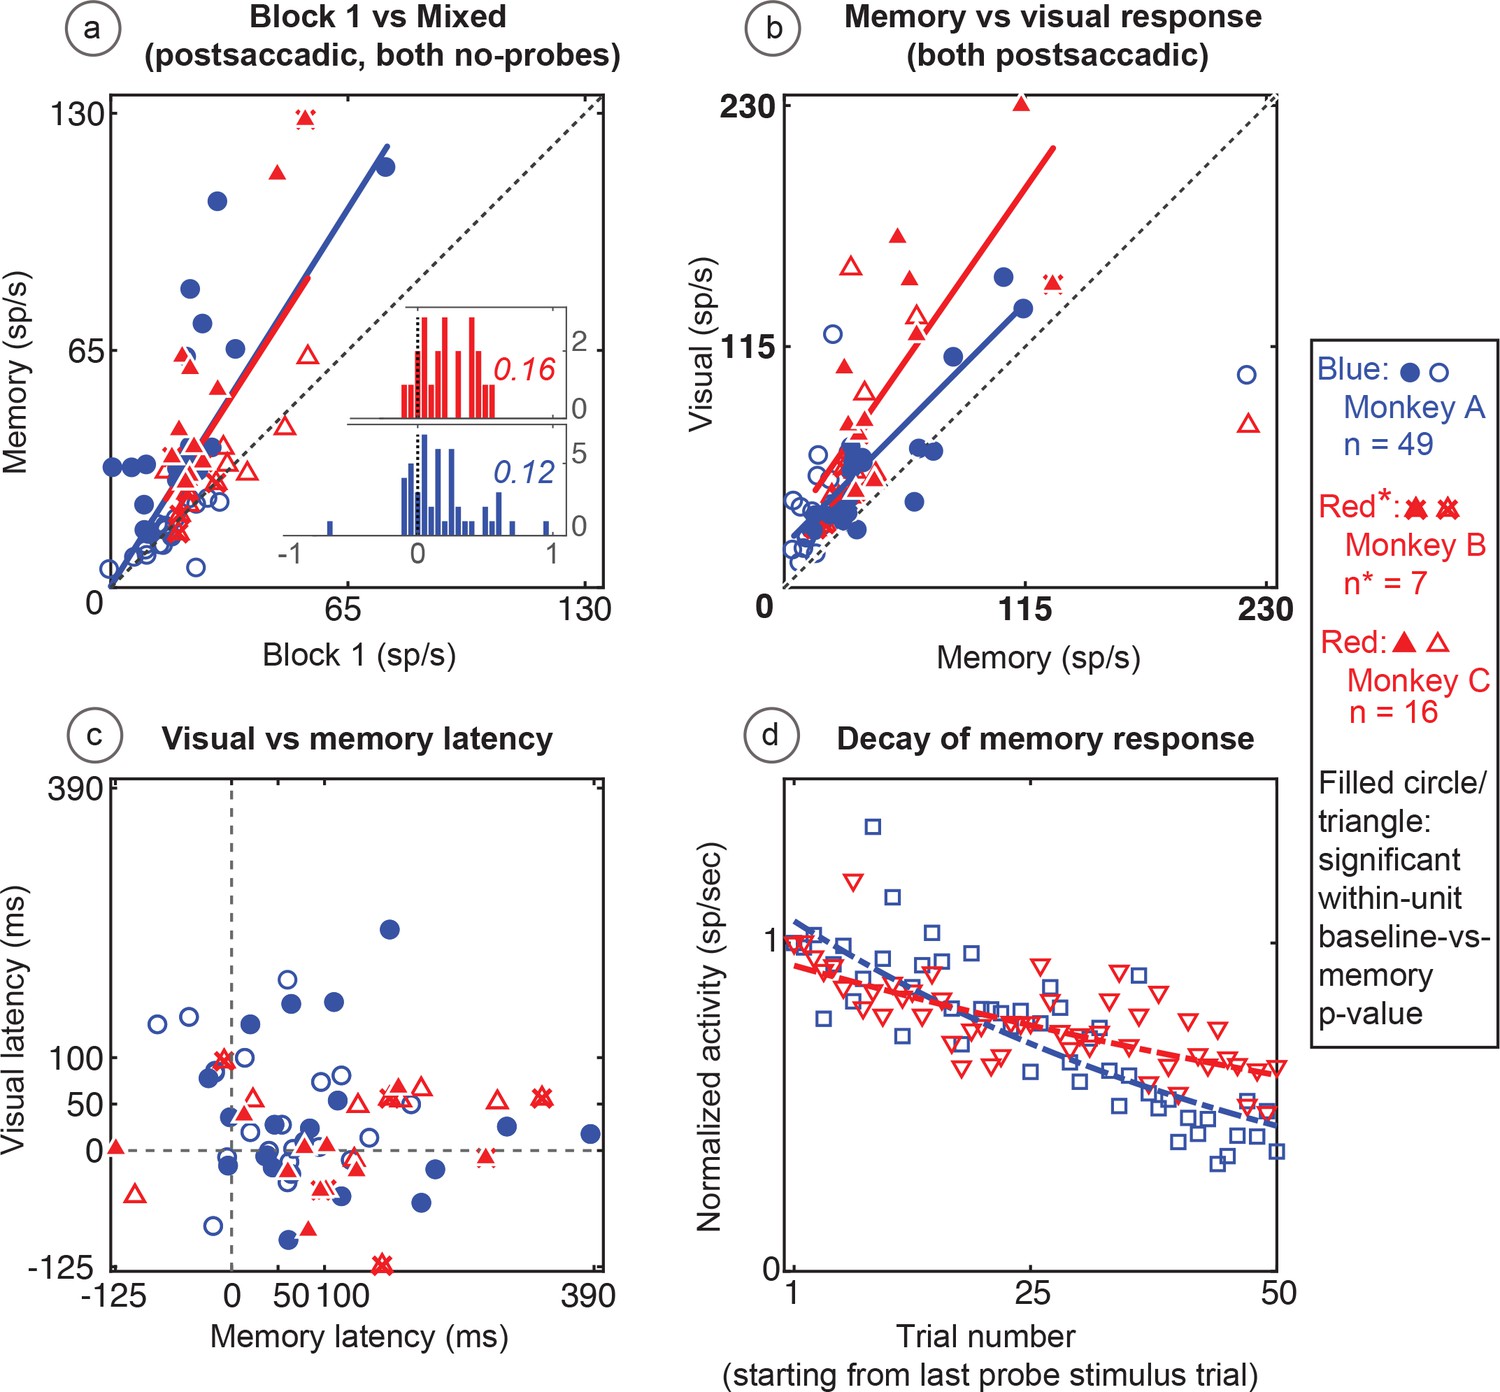
Population data for the basic memory task: For all recorded units (open circles and triangles) and for units which showed significant differences between baseline and memory blocks (filled circles and triangles, trial per trial peak comparisons, Wilcoxon signed rank, population p<0.001, within-cell Wilcoxon rank sum <0.05).
(A) Comparison of peak activity in the baseline and memory conditions (Block 1 vs Block 3, no probe stimulus trials). Each point represents a single cell. Cells with memory activity lie above the x = y line (diagonal). Monkey A: blue circles; Monkeys B and C: red triangles (*=Monkeys B and C). Insets: index (Block 3 versus Block 1) histograms for the whole population, out of which the statistically significant units are shown in shaded circles and triangles on the scatter plot. A median (numbers above index histograms) and rank sum and KS test confirmed memory activity as they both showed that the index distribution for the parent population was positively skewed. (B) Peak memory activity plotted against visual activity. Blue and red lines in the scatter plots (B and C) are polynomial fits to each population data. They both indicate a positive shift of neural responses towards memory activity. (C) Latency of memory response versus the latency of visual response for cells. (D) Normalized decay activity. The memory response gradually decays after the last trial in which the probe appeared. The regression lines are data fits using a first order exponential. As indicated in ‘D’ legend, open squares and triangles are neural activities during decay trials compared to (normalized by) the mean of the last five trials with the probe stimulus (left y-axis).
Figure 6
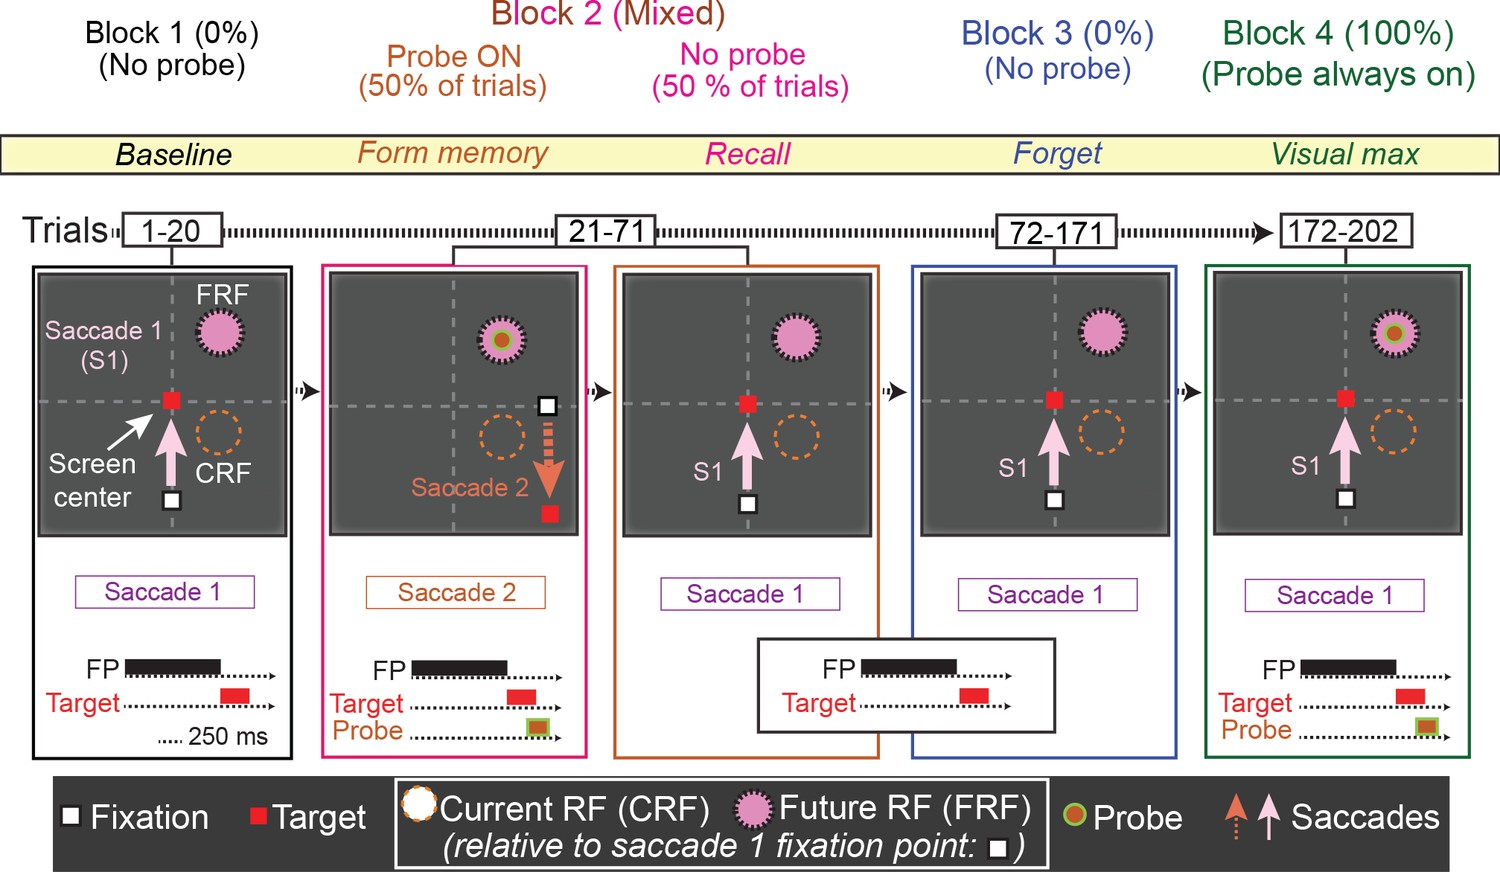
The No-RF task.
Trials occurred in blocks. The first block (block 1, baseline) was used to establish the baseline activity of the neuron for saccade 1, prior to introduction to the probe stimulus. Block 2 (mixed, form and recall memory) introduced a task-irrelevant probe stimulus in half of the trials. In the half of trials where the probe stimulus appeared, the monkey was instructed to make a different saccade (saccade 2), which relocated the cell’s receptive field away from the probe location (Block 2, orange). In the other half of trials, no probe stimulus was presented and the monkey made saccade 1, bringing the location of the (previously presented) probe stimulus into the cell’s receptive field (Block 2, magenta). In Block 3 (forget, identical to Block 1), to measure the decay of the memory response, the monkey was instructed to make saccade one and no probe was presented. Finally, in Block 4 (visual max), to measure the visual response of the cell to the probe, the monkey was instructed to make saccade 1, and the probe stimulus was presented in the cell’s receptive field.
Figure 7
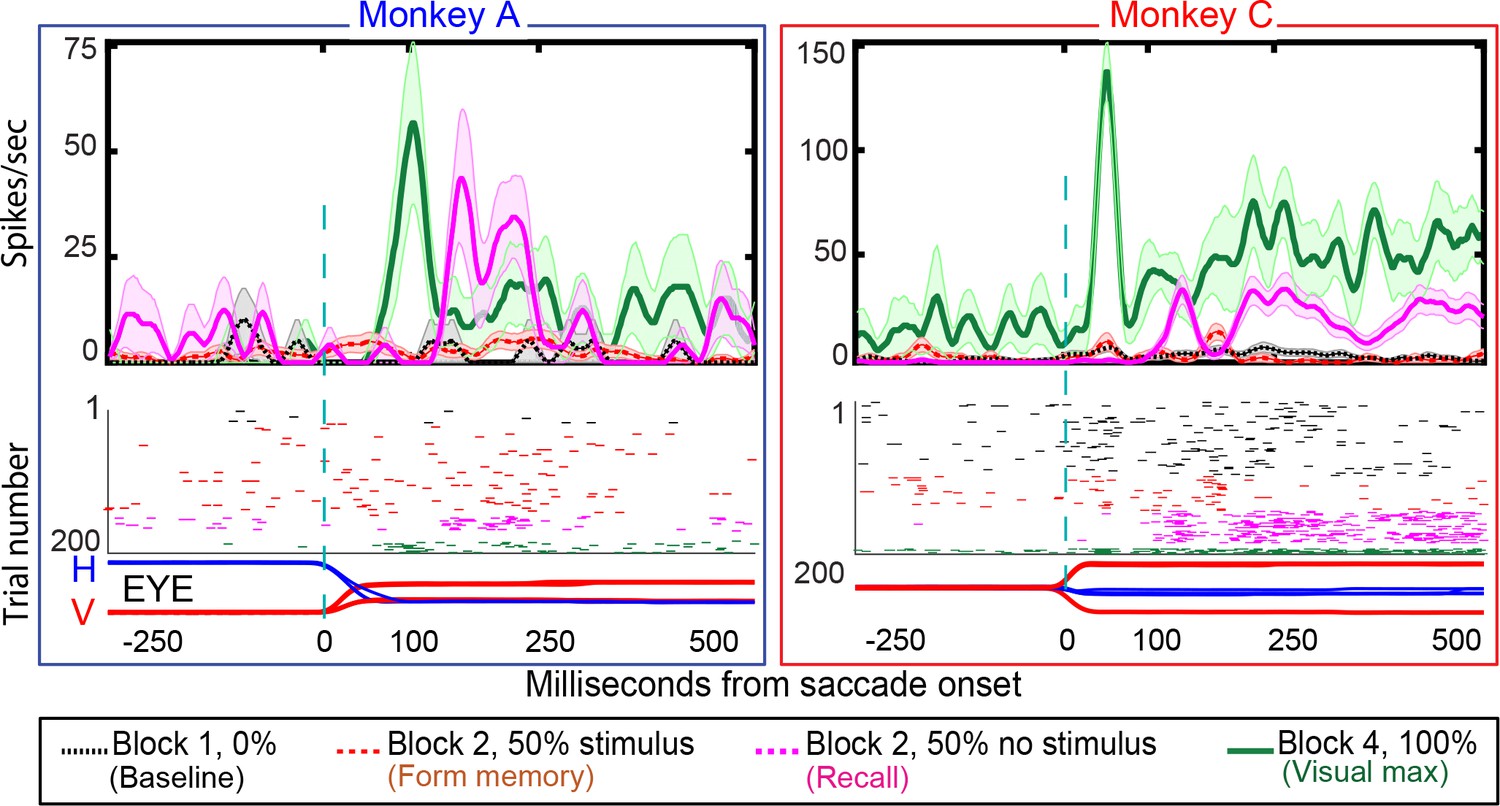
Single-cell responses in the No-RF memory task: from Monkey A (left panel) and Monkeys C (right panel).
Block descriptions are as in Figure 6. Black traces and raster dots: activity in Block 1, stimulus absent. Red (broken) traces and raster dots: activity in stimulus-present trials in Block 2. Magenta traces and raster dots: activity in probe stimulus-absent trials in Block 2. The memory decays after many (up to 100) trials. Green traces and raster dots: activity in Block 4, 100% stimulus present. H and V are horizontal and vertical eye movements smoothed using a 10 ms sliding causal filter.
Figure 8
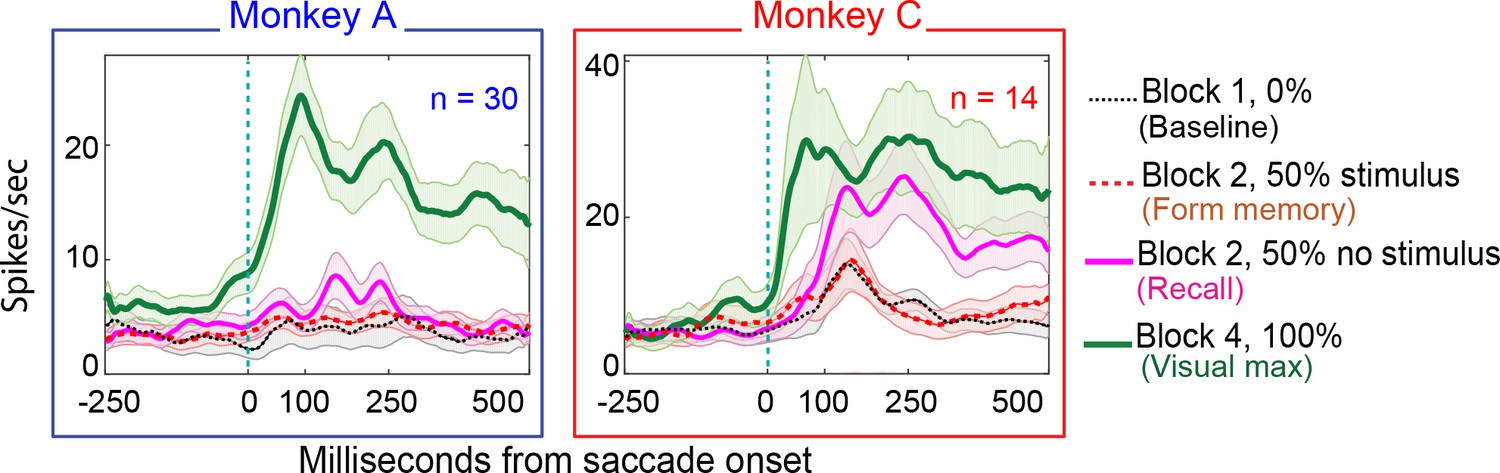
Population responses in the No-RF memory task: from Monkey A (left panel) and Monkeys B and C (right panel).
Block descriptions are as in Figure 7.
Figure 9
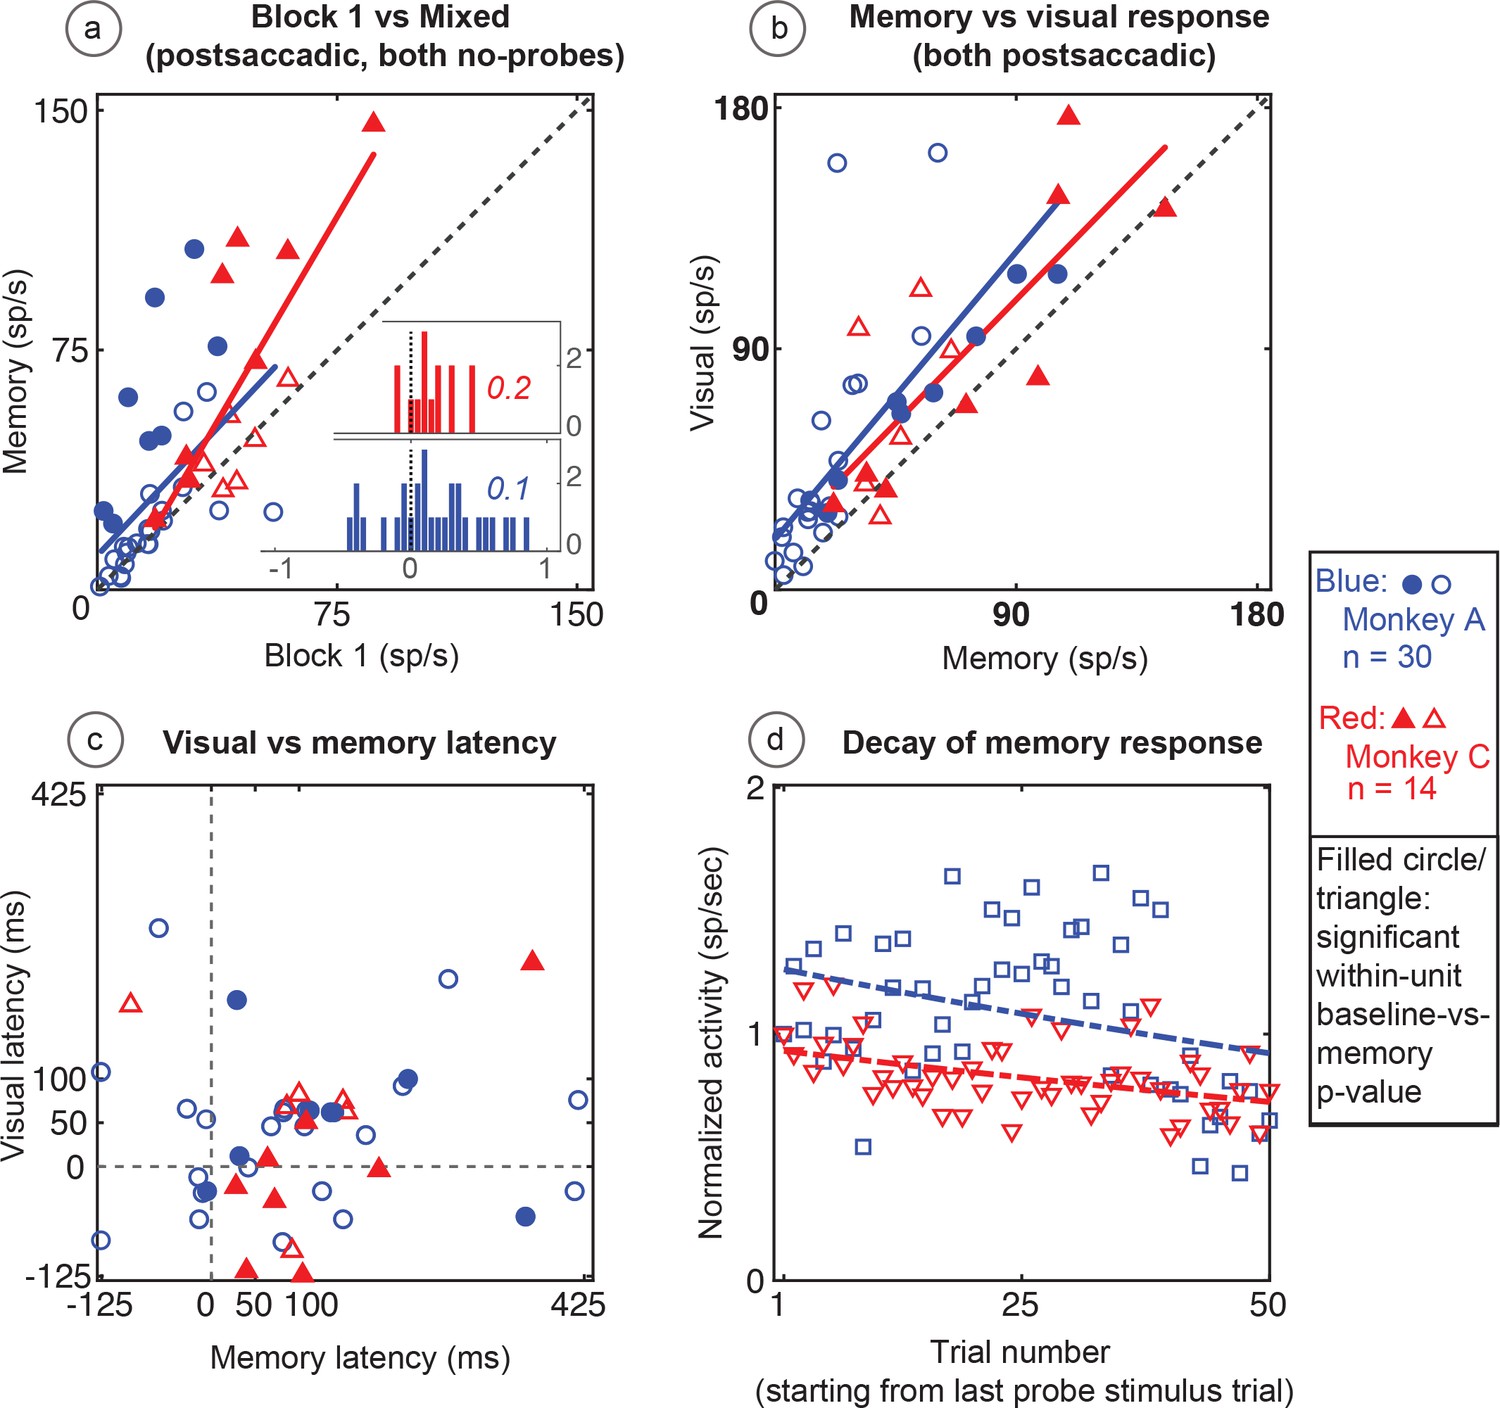
Population data in the No-RF memory task: All recorded units (open circles and triangles) and units which showed significant differences between baseline and memory blocks (filled symbols, trial per trial peak comparisons, Wilcoxon signed rank, population p<0.001, within-cell Wilcoxon rank sum <0.05).
(A) Comparison of peak activity in the baseline and memory conditions (Block 1 vs Block 2, no probe stimulus trials). Each point represents a single cell. Cells with memory activity lie above the x = y line (diagonal). Monkey A: blue circles; Monkey C: red triangles. Insets: index (Block 2 versus Block 1) histograms for the whole population, out of which the statistically significant units are shown in shaded circles and triangles on the scatter plot. A median (numbers above index histograms) and rank sum and KS test confirmed memory activity as they both showed that the index distribution for the parent population was positively skewed. (B) Peak memory activity plotted against visual activity. Blue and red lines in the scatter plots are polynomial fits to each population data. They both indicate positive shift of neural responses towards memory activity. (C) Latency of memory response versus the latency of visual response for cells. (D) Normalized decay activity. Memory response gradually decays after the last trial in which the probe appeared. The regression lines are data fits using a first order exponential. As indicated in ‘D’ legend, open squares and triangles are neural activities during decay trials compared to (normalized by) the mean of the last five trials with the probe stimulus (left y-axis).
Additional files
-
Source Code 1
All Matlab Scripts for data analysis and preparation
The zip file contains all Matlab scripts used in converting raw spike and analog data from NIH’s REX files to Matlab, analyzing neural activities such as firing rates, decay activities etc. and creating spreadsheets and figures.
- https://doi.org/10.7554/eLife.30762.011
-
Source data 1
Table describing response attributes for all neurons included in the analyzed population
The table provides all measured response attributes for the neurons which showed statistically significant memory activity. The first row (headers) contains the particular measure used to quantify activity such as mean, median, etc. It also includes other descriptors such as, the file name, block type, p-values for various comparisons, etc.
- https://doi.org/10.7554/eLife.30762.012
-
Transparent reporting form
- https://doi.org/10.7554/eLife.30762.013
Download links
A two-part list of links to download the article, or parts of the article, in various formats.
Downloads (link to download the article as PDF)
Open citations (links to open the citations from this article in various online reference manager services)
Cite this article (links to download the citations from this article in formats compatible with various reference manager tools)
A spatial memory signal shows that the parietal cortex has access to a craniotopic representation of space
eLife 7:e30762.
https://doi.org/10.7554/eLife.30762


