Neuronal populations in the occipital cortex of the blind synchronize to the temporal dynamics of speech
- University of Trento, Italy
- University of Louvain, Belgium
Figures
Figure 1

Cerebro-acoustic coherence in EB and SI.
(A) Segments from each condition (nat, 8-channel, and 1-channel) in the time domain (see also Video 1). Overlaid is the amplitude envelope of each condition. (B) Spectrogram of the speech samples from (A). The effect of spectral vocoding on the fine spectral detail in all three conditions. (C) The superimposed amplitude envelopes of the samples for each condition are highly similar, despite distortions in the fine spectral detail. (D) Behavioral performance on the comprehension statements reveals that comprehension is unperturbed in the nat and 8-channel conditions, whereas the 1-channel condition elicits chance performance. (E) Coherence spectrogram extracted from bilateral temporal sensors reveals a peak in cerebro-acoustic coherence at 7 Hz, across groups and conditions. The shaded area depicts the frequency range of interest in the current study. The topography shows the spatial extent of coherence values in the range 4–9 Hz. Enhanced coherence is observed selectively in bilateral temporal sensors. (F) Source reconstruction of the raw coherence confirms that cerebro-acoustic coherence is strongest in the vicinity of auditory cortex, bilaterally, extending into superior and middle temporal gyrus. (G) Statistically thresholded maps for the contrast between natural and 1-channel vocoded speech show an effect of intelligibility (p<0.05, FWE-corrected) in right STG. (H) Enhanced envelope tracking is observed for EB versus SI in a bilateral parieto-occipital network along the medial wall centered on Precuneus (p<0.05, FWE-corrected). (I) The statistical map shows the interaction effect between blindness and intelligibility: Early blind (EB) individuals show enhanced synchronization during intelligible (nat) versus non-intelligible speech (1-channel) as compared to SI in right calcarine sulcus (CS) (p<0.005, uncorrected). (J) Boxplots for three regions identified in the whole-brain analysis (top panel, STG; middle panel, parieto-occipital cortex; bottom panel, calcarine sulcus).
Figure 2
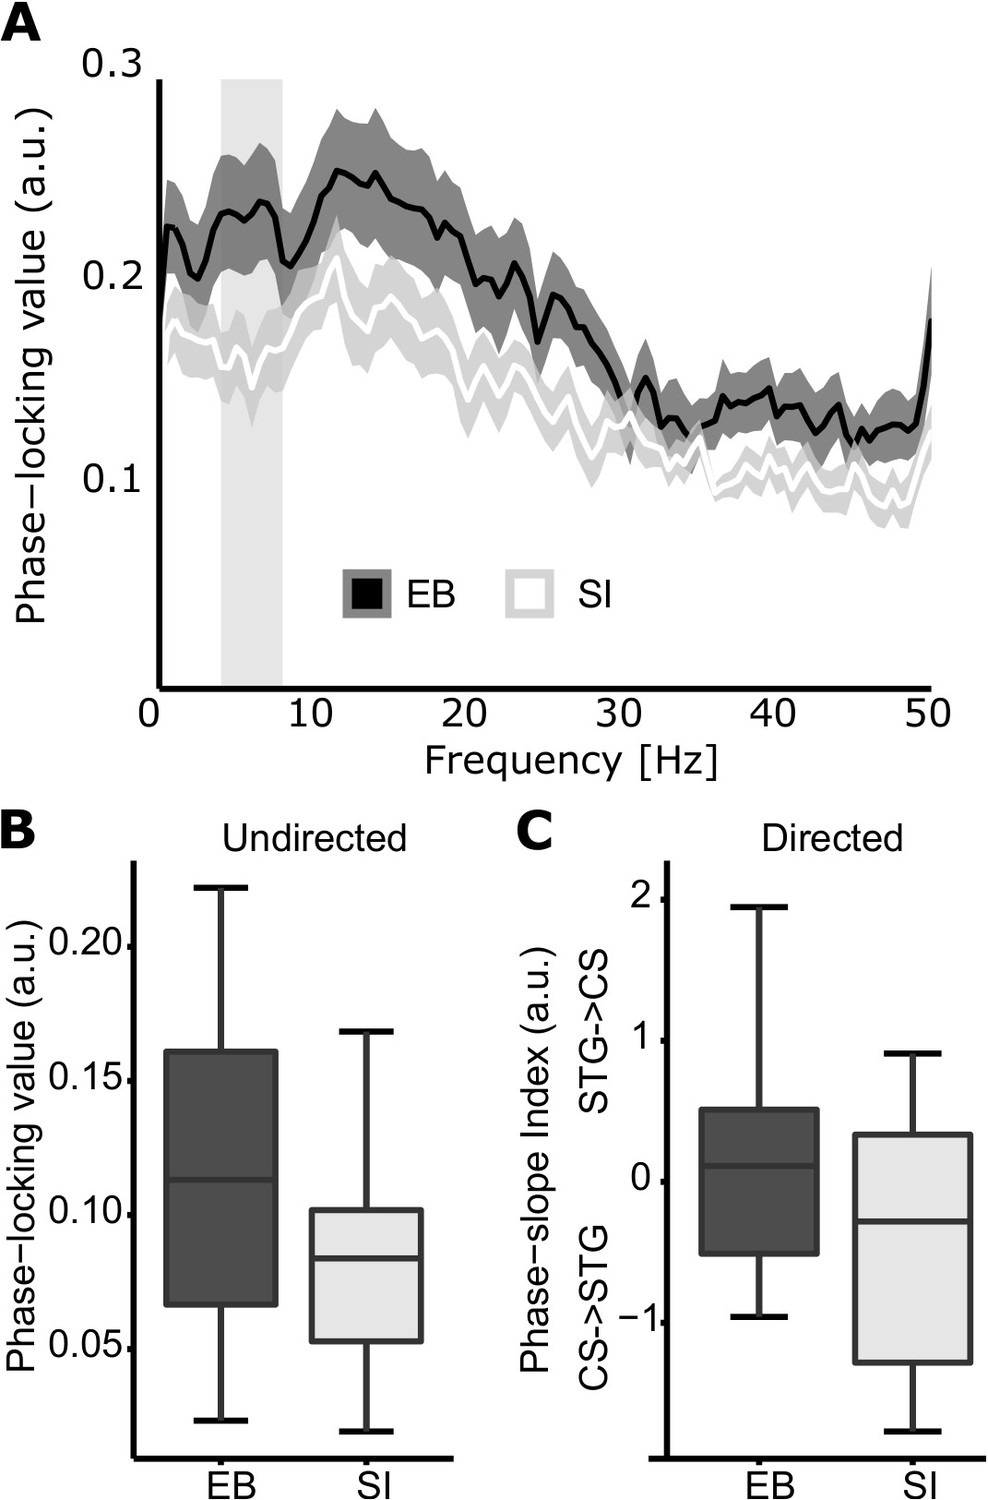
Occipital-temporal connectivity in EB and SI.
(A) Spectra illustrate the phase locking between CS and STG in EB (dark curve) and in SI (light curve). Shaded areas illustrate the SEM. A difference between the curves is observed in the theta range. (B) Boxplots depict the mean phase locking between CS and STG for EB (black) and SI (white) in the theta range. Connectivity is enhanced in EB versus SI. (C) Directional connectivity analysis using the phase-slope index (PSI). Positive values suggest enhanced directionality from STG to CS, and negative values represent enhanced connectivity in the opposite direction. The boxplots highlight the strong feed-forward drive from CS to STG shown by SI, whereas blind individuals show a more balanced pattern, with a non-significant trend in the opposite direction.
Videos
Video 1
Movie of the natural and two vocoding conditions used for one exemplar of auditory segment used in our experiment.
https://doi.org/10.7554/eLife.31640.007Tables
Table 1
Proportion of correct responses for the story comprehension questions.
Depicted are the number of subjects (N) in the early blind (EB) and sighted individuals (SI) groups, the mean (M), and the standard error of the mean (SE) for each of the three conditions (Natural, 8-channel, 1-channel).
| Natural | 8-channel | 1-channel | |||||
|---|---|---|---|---|---|---|---|
| Group | N | M | SE | M | SE | M | SE |
| EB | 17 | 0.899 | 0.019 | 0.853 | 0.031 | 0.559 | 0.027 |
| SI | 15 | 0.914 | 0.020 | 0.890 | 0.025 | 0.576 | 0.034 |
Table 2
MNI (Montreal Neurological Institute) coordinates and p-values for the three contrasts tested with threshold-free cluster enhancement (TFCE).
https://doi.org/10.7554/eLife.31640.005| MNI-coordinates (mm) | ||||
|---|---|---|---|---|
| p-value (FWE-cor) | x | y | z | |
| Intelligibility | ||||
| Superior temporal gyrus | 0.027 | 64 | −16 | 0 |
| Blindness | ||||
| Posterior cingulate | 0.030 | 8 | −40 | 40 |
| Postcentral sulcus | 0.033 | 16 | −32 | 64 |
| Precuneus | 0.033 | -8 | −64 | 48 |
| Blindness x intelligibility | ||||
| Calcarine sulcus | 0.007 | 16 | −88 | 0 |
Additional files
-
Transparent reporting form
- https://doi.org/10.7554/eLife.31640.008
Download links
A two-part list of links to download the article, or parts of the article, in various formats.
Downloads (link to download the article as PDF)
Open citations (links to open the citations from this article in various online reference manager services)
Cite this article (links to download the citations from this article in formats compatible with various reference manager tools)
Neuronal populations in the occipital cortex of the blind synchronize to the temporal dynamics of speech
eLife 7:e31640.
https://doi.org/10.7554/eLife.31640


