Capturing change in clonal composition amongst single mouse germinal centers
- Cleveland Clinic Lerner College of Medicine, United States
- Boston Children’s Hospital, United States
- Howard Hughes Medical Institute, United States
- Aarhus University, Denmark
- Massachusetts General Hospital, United States
- Harvard Medical School, United States
Figures
Figure 1 with 1 supplement
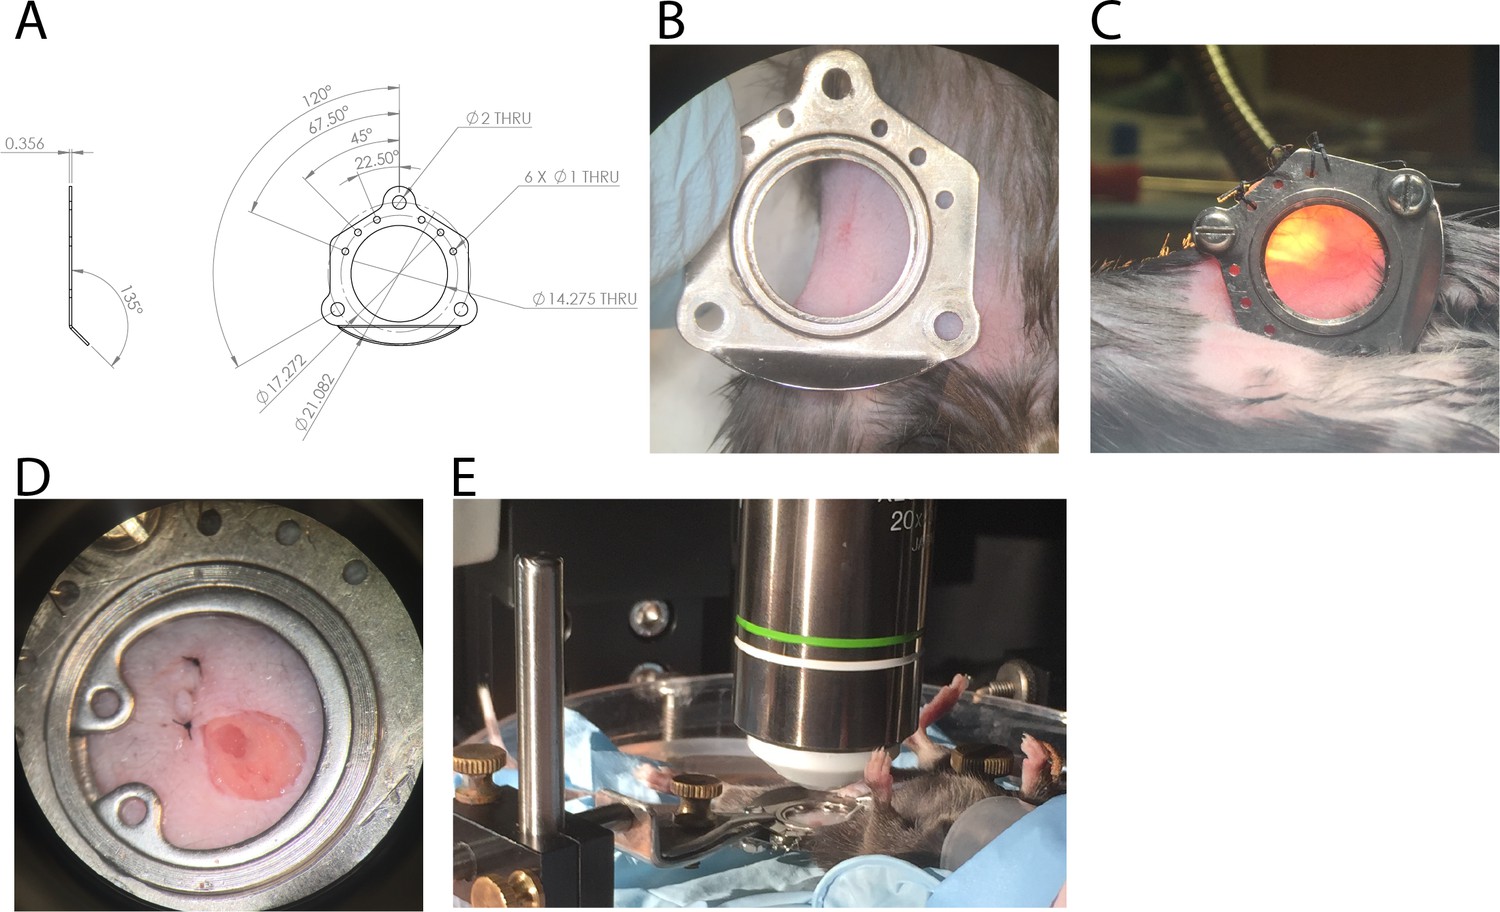
Design and surgical implantation of titanium CLNW.
(A) CAD schematic detailing the dimensions of the titanium plates opposed to fit a chronic lymph node window (CLNW). (B) Following shaving the surgical site, window plates are briefly overlaid for surgical planning and prior to sterile preparation. (C) Following surgical implantation of the CLNW, transillumination confirms the node centered appropriately within the imaging range. (D) Photomicrograph of completed CLNW demonstrating coverglass, incision closure, and LN placement within the center of viewing range. (E) Imaging setup demonstrating anesthetized mouse on a heated H2O reservoir with clamp fixation of the window minimizing motion artifact.
Figure 1—figure supplement 1
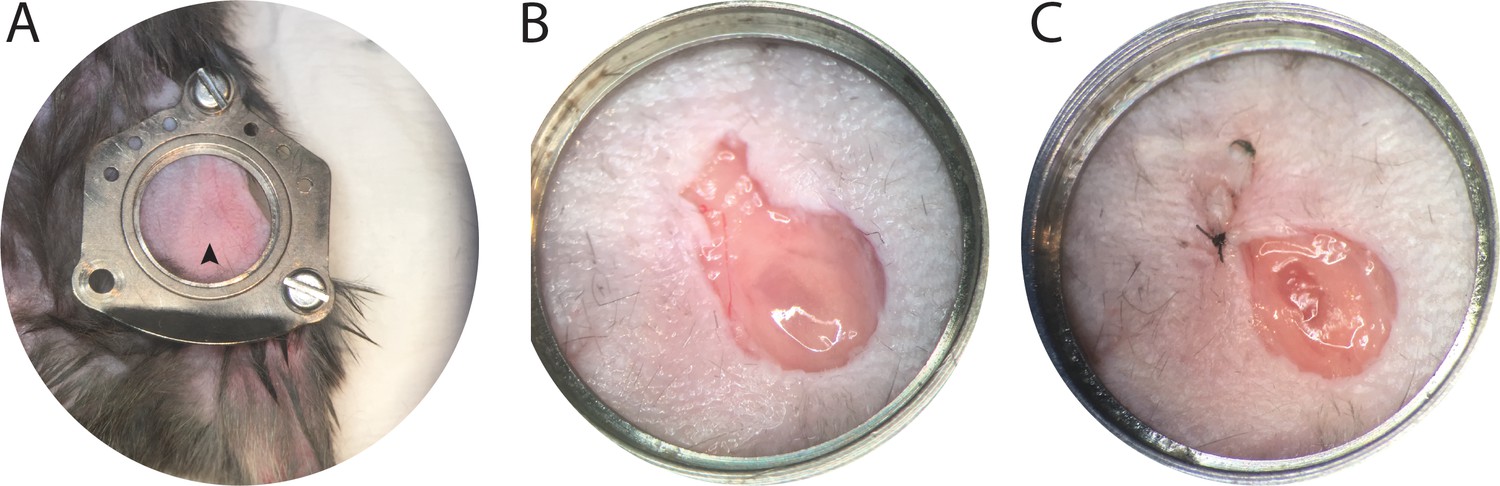
Additional surgical images demonstrates anchor placement and node exposure.
(A) Additional representative image illustrating surgical step just after placing CLNW anchors and prior to stretching skin across the plate and suturing skin anchors. Note LN is visible as darker ovoid shape surrounded by fat, marked by arrowhead. (B) Additional representative image illustrating surgical step after placing and extending the skin incision to include the LN (which is fully encased in the fat pad connective tissue, note sheen in image reflecting this). (C) Additional representative image illustrating surgical step after opening the fat pad capsule and lifting the connective tissue from the superior-most aspect of the LN capsule. Also note, closing a portion of the incision to reduce open surface area. This is prior to sterile irrigation and placement of coverslip.
Figure 2 with 1 supplement
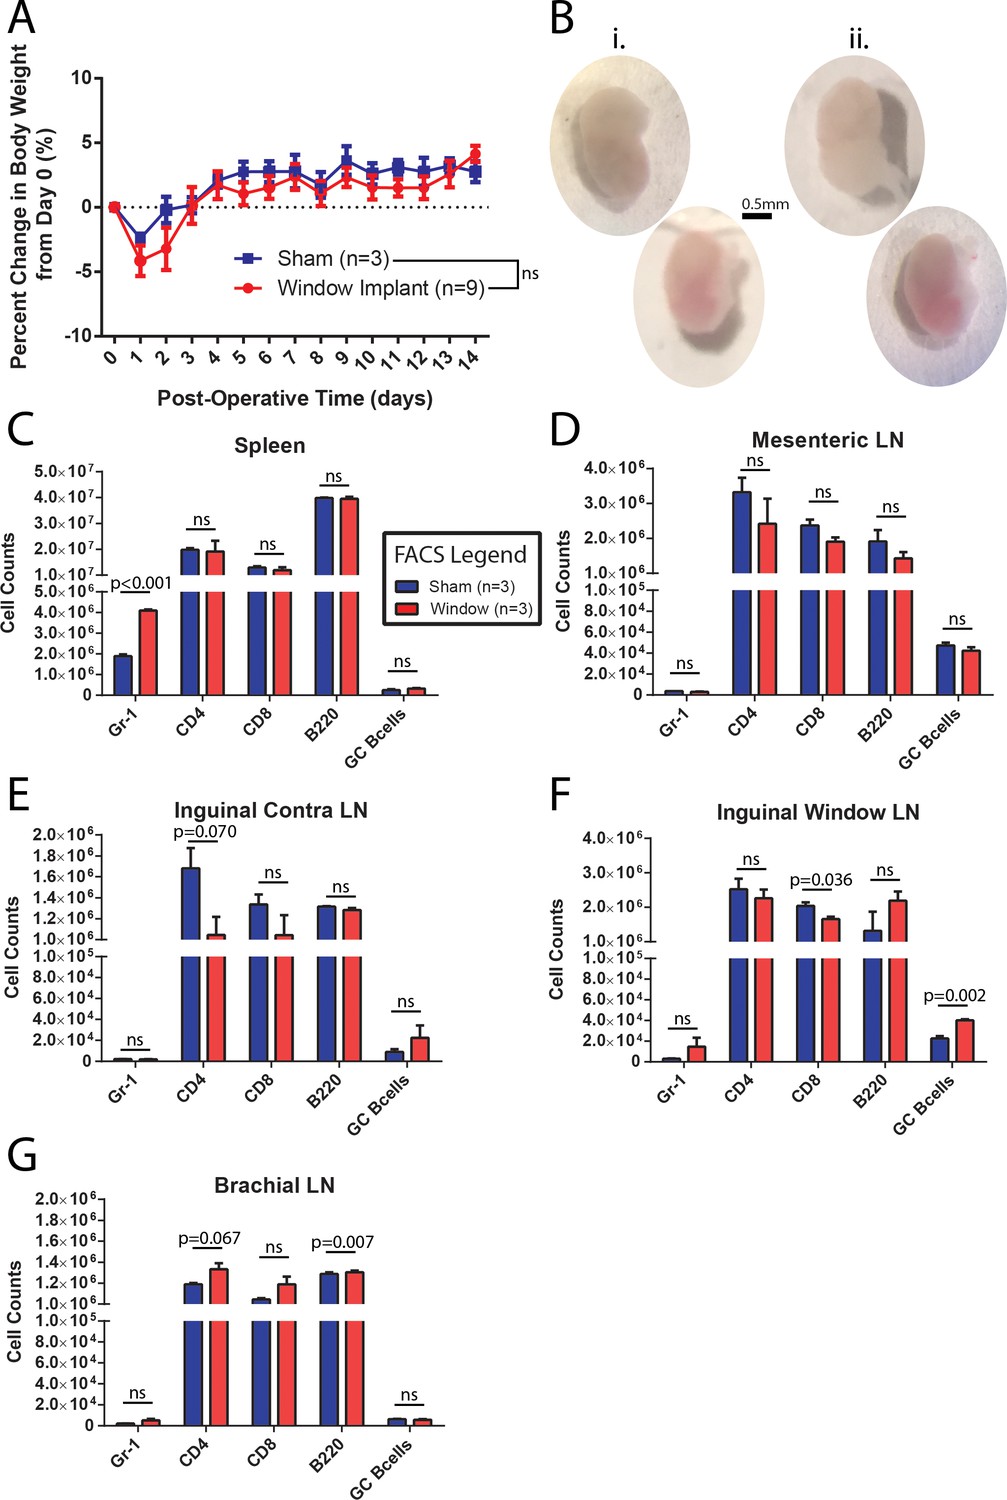
CLNW implantation does not dramatically perturb homeostasis.
(A) Daily weight monitoring of sham operated and window implanted mice demonstrates a slightly more dramatic post-operative decline followed by correction to the level of controls by day 3. Experiments conducted on more than three independent occasions. (B) Gross morphological assessment following 2 weeks within the CLNW. The sham operated LNs [I; two vertical nodes at left] were found to be similar to imaged nodes [ii; two vertical nodes at right] on the basis of size, vascularity, and consistency. (C) Flow cytometric quantification of numbers of live, CD45+ gate for Gr-1+, CD4+, CD8+, B220+, and GL7hiCD38lo GC B cells in spleen compared between sham operated and CLNW implanted mice (n = 3 per group). Mean ± SEM indicated. P values obtained from chi squared analysis of proportions of live CD45+ cells. (D) Similar to (C) except for mesenteric lymph nodes. (E) Similar to (C) except for the contralateral (opposite operated side) inguinal lymph nodes. (F) Similar to (C) except for CLNW implanted inguinal lymph nodes. (G) Similar to (C) except for brachial lymph nodes.
-
Figure 2—source data 1
CLNW and control mice weights and cell counts.
- https://doi.org/10.7554/eLife.33051.006
-
Figure 2—source data 2
CLNW and control mean pixel intensity for perioperative PE-IC lymphatics assessment.
- https://doi.org/10.7554/eLife.33051.007
Figure 2—figure supplement 1
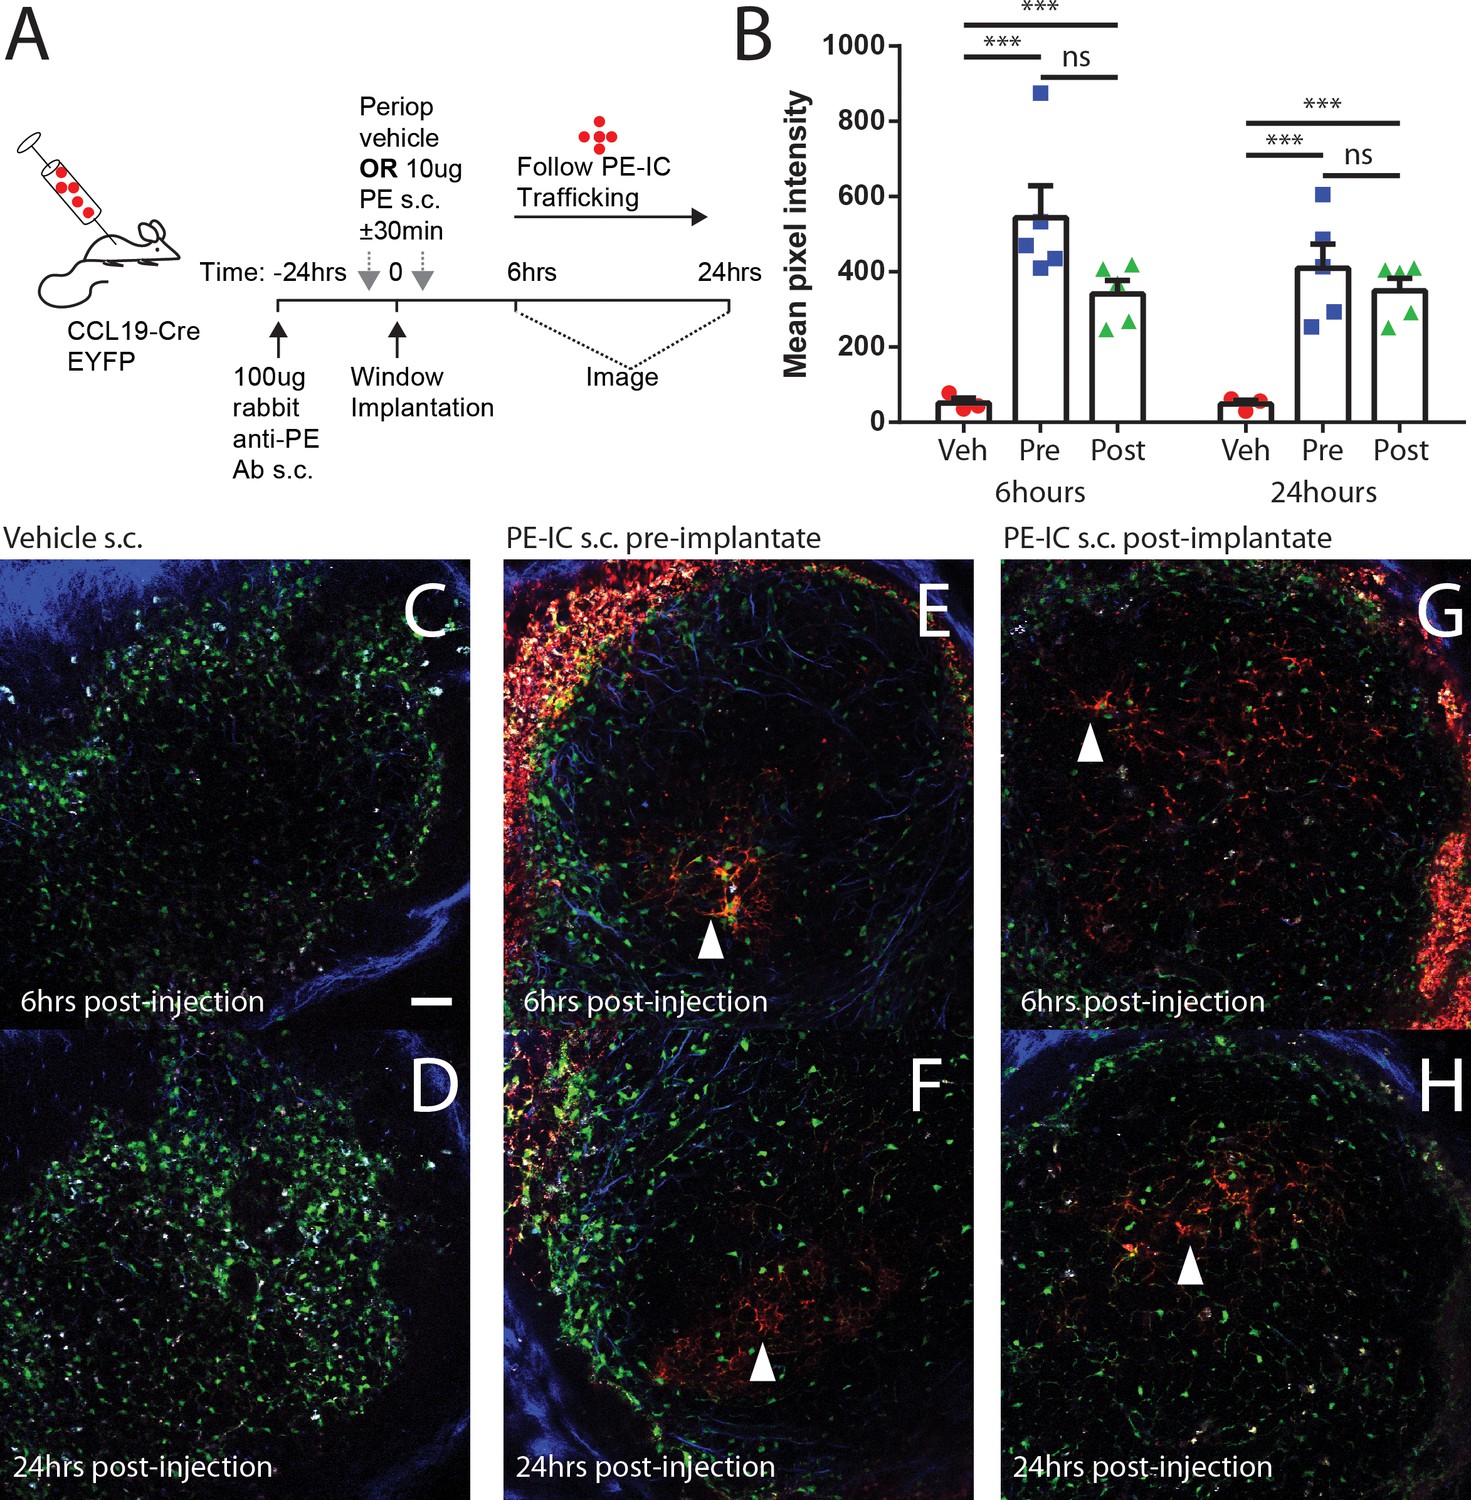
Perioperative PE-IC immunization reveals intact lymphatics in CLNW operated mice.
(A) Schematic overview of experimental approach for CCL19-Cre EYFP mice, preoperative s.c. injection with rabbit anti-PE Ab, followed by either immediately (30 min) pre- or post-CLNW operation injections of either 10 ug PE or vehicle. iLN were then imaged for PE signal at 6 and 24 hr post-implantation. (B) Quantification of veh and PE injected LN at 6 and 24 hr reveals rapid uptake of PE onto the FDC network within each follicle in PE injected animals (*** represents p<0.0001). There was no significant difference (ns) between PE uptake in pre vs post-operation PE injection confirming the integrity of the lymphatics during surgical implantation of CLNW. (C) Representative follicles following veh at 6 hr and (D) 24 hr post-implantation time. Scale bar = 100 um. (E, F) As in (C, D) but for pre-implantate injection of PE. Arrowheads note the reticular pattern of PE-IC labeling of FDC. (G, H) As in (C, D) but for post-implantate injection of PE.
Figure 3 with 2 supplements
Observing the establishment of GC to foreign antigen using the CLNW.
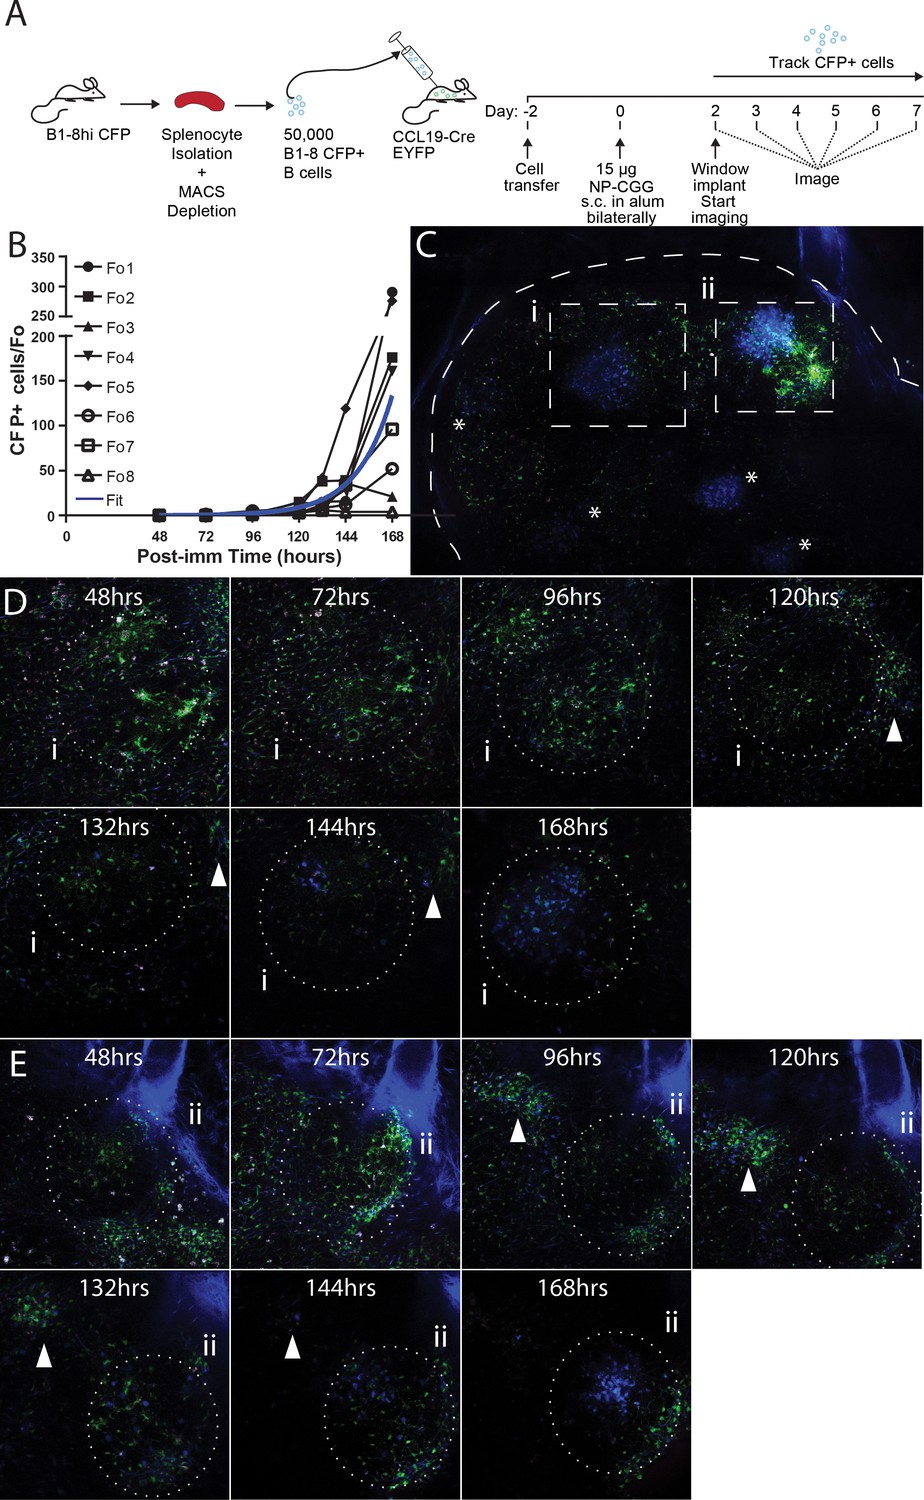
(A) Schematic outlining the adoptive transfer of B-18hi cells into CCL19-CreEYFP recipients on day −2, the immunization with NP-CGG bilaterally on day 0 and surgical implantation of the CLNW on day two with subsequent daily imaging. Experiments conducted on two independent preparations with two independent mice. (B) Graphical quantification of CFP+ cells within longitudinally observed single follicles from days 2–7 demonstrating an average exponential increase in cellularity with a surprising level of variability. Individual black lines with different symbols for each Fo as in the legend, blue overlay is the average fit line. (C) Following 7 days of imaging, a single CLNW is observed at constant depth (~150 um) and images ‘stitched’ to form a GC map. *represent the location of GC, of varying intensity due to depth. Second harmonics generation from collagen rendered in blue, YFP+ cells rendered in green and CFP+ cells rendered in blue. (D) Follicle (i) from empty through evolution to a germinal center over the 48–168 hr observation, shown in (C), white arrowhead demonstrates location of extafollicular CFP+ cells. (E) Follicle (ii) from empty through evolution to a germinal center over the 48–168 hr observation, shown in (C), white arrowhead demonstrates location of extafollicular CFP+ cells.
-
Figure 3—source data 1
Early GC formation CFP+ cell counts.
- https://doi.org/10.7554/eLife.33051.009
Figure 3—video 1
Intravital imaging of CFP+ B1-8 hi cells in in NP-CGG immunized, CCL19-EYFP reporter.
Thirty fps intravital video of a GC over 2 hr at an interval of 15 s per frame. High density GC at right with low density primary focus at left and possible trafficking between. Second harmonic generation from collagen rendered in blue, YFP+ cells rendered in green and CFP+ cells labeled in blue.
Figure 3—video 2
Intravital imaging of CFP+ B1-8 hi cells in in NP-CGG immunized, CCL19-EYFP reporter with PE-immune complex immunization for FDC visualization.
Thirty fps intravital video of a GC over 1 hr at an interval of 15 s per frame. Second harmonic generation from collagen rendered in blue, YFP+ cells rendered in green and CFP+ cells labeled in blue, PE-labelled FDC in red.
Figure 4
Establishing fidelity of clonal development in CLNW observed GC.
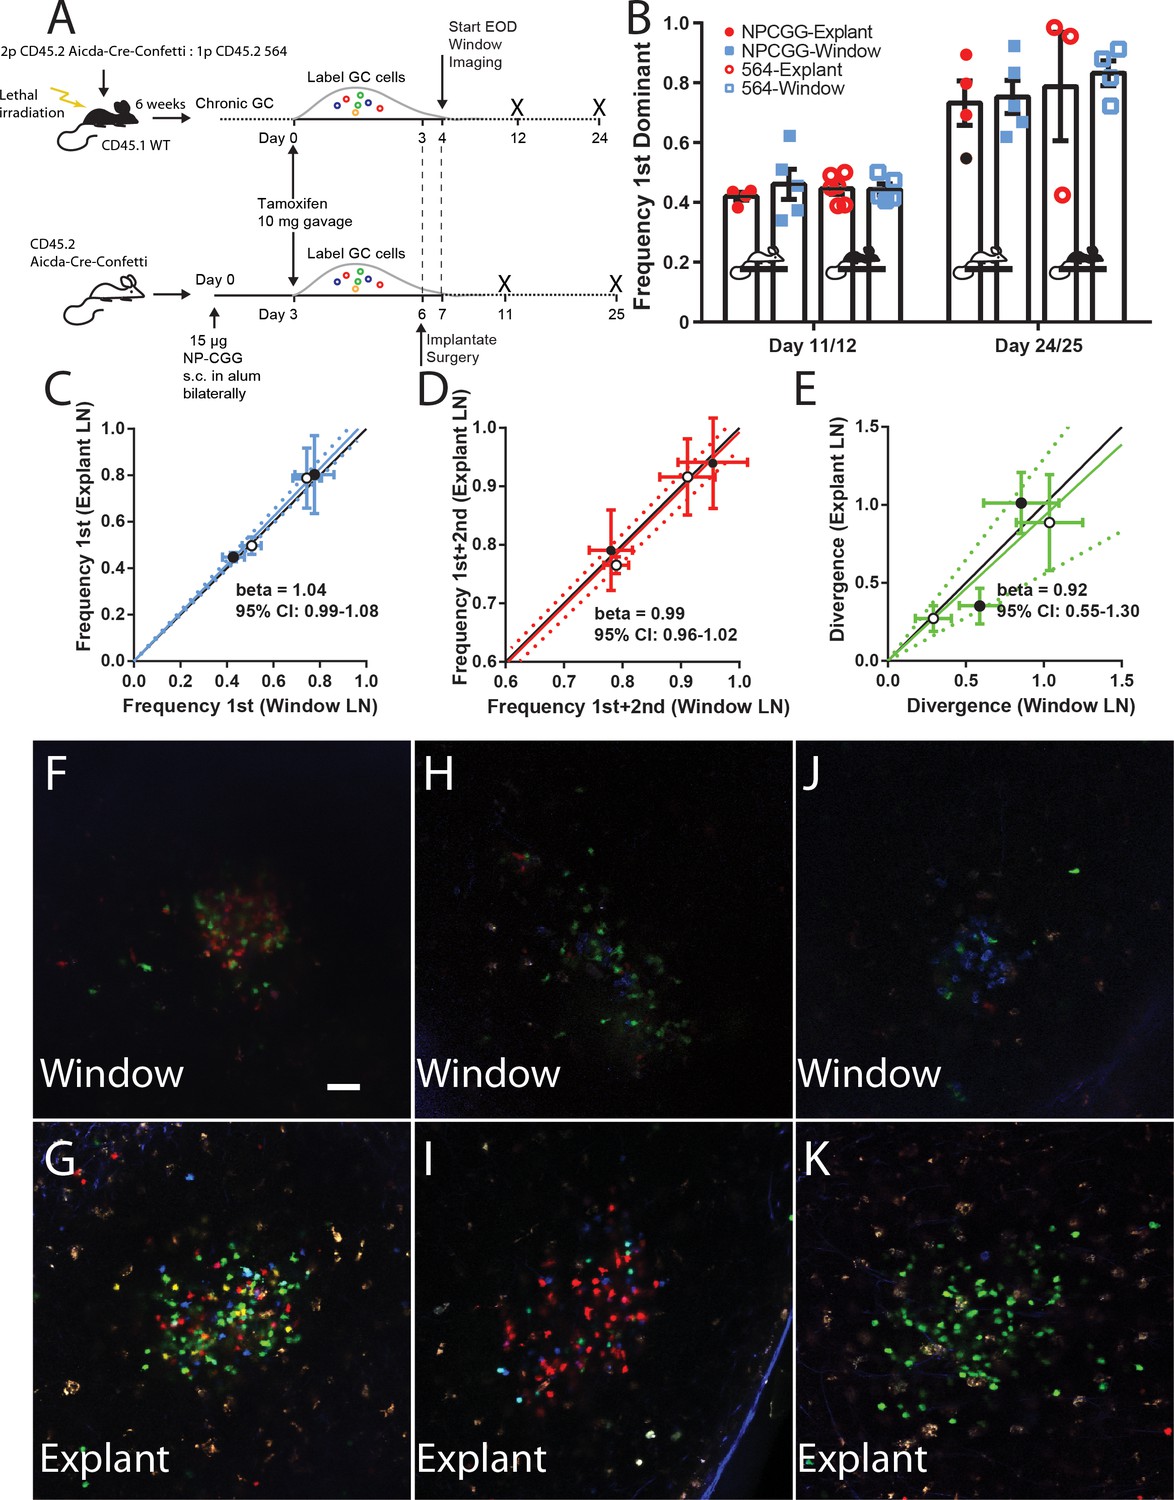
(A) Schematic overview of experimental approach for generation and analysis of CD45.2 Aicda-Cre-Confetti and CD45.2 Aicda-Cre-Confetti 564 mixed BM chimeras. Experiments conducted on two independent preparations with two independent mice each. (B) Overview of fidelity of the window imaging model. The frequency of most (first) dominant colors observed in individual mice between GCs in the CLNW as compared to the explanted contralateral LN observed ex vivo. These observations are shown in both the average (bar with standard error) as well as individual values plotted per the key for both NPCGG and 564 at early (day 11/12) and later (day 24/25) times. (C) Comparing the frequency of most (first) predominant colors observed in individual mice between GCs in the CLNW as compared to the contralateral LN observed ex vivo. Both NP-CGG and 564 comparisons are included and a linear regression is fitted, demonstrating a beta coefficient overlapping with unity, 1.04 (0.99–1.08). The mean of an average of 4.1 GC per LN for each mouse at each time point, for both NP-CGG and 564, is indicated by each point. (D) Similar to (C) except comparing the frequency of the most and second most predominant colors as observed ex vivo from the contralateral LN and in vivo in the CLNW. Regression line with beta coefficient overlapping unity, 0.99 (0.96–1.02). (E) Similar to (C) except comparing the divergence index for color composition by GC as observed ex vivo from the contralateral and in vivo in the CLNW. Regression line with beta coefficient overlapping unity, 0.92 (0.55–1.30). (F–G) Representative images used for quantification of color between CLNW observed (top) and explant imaged (bottom) within the same mouse. (H–I) As in (F–G) but a separate mouse. (J–K) As in (F–G) but a separate mouse.
-
Figure 4—source data 1
Comparison of CLWN and explant derived data to calculate relative frequency, dominance, divergence index.
- https://doi.org/10.7554/eLife.33051.013
Figure 5
Following the clonal composition of individual GC responding to foreign antigen over days to weeks.
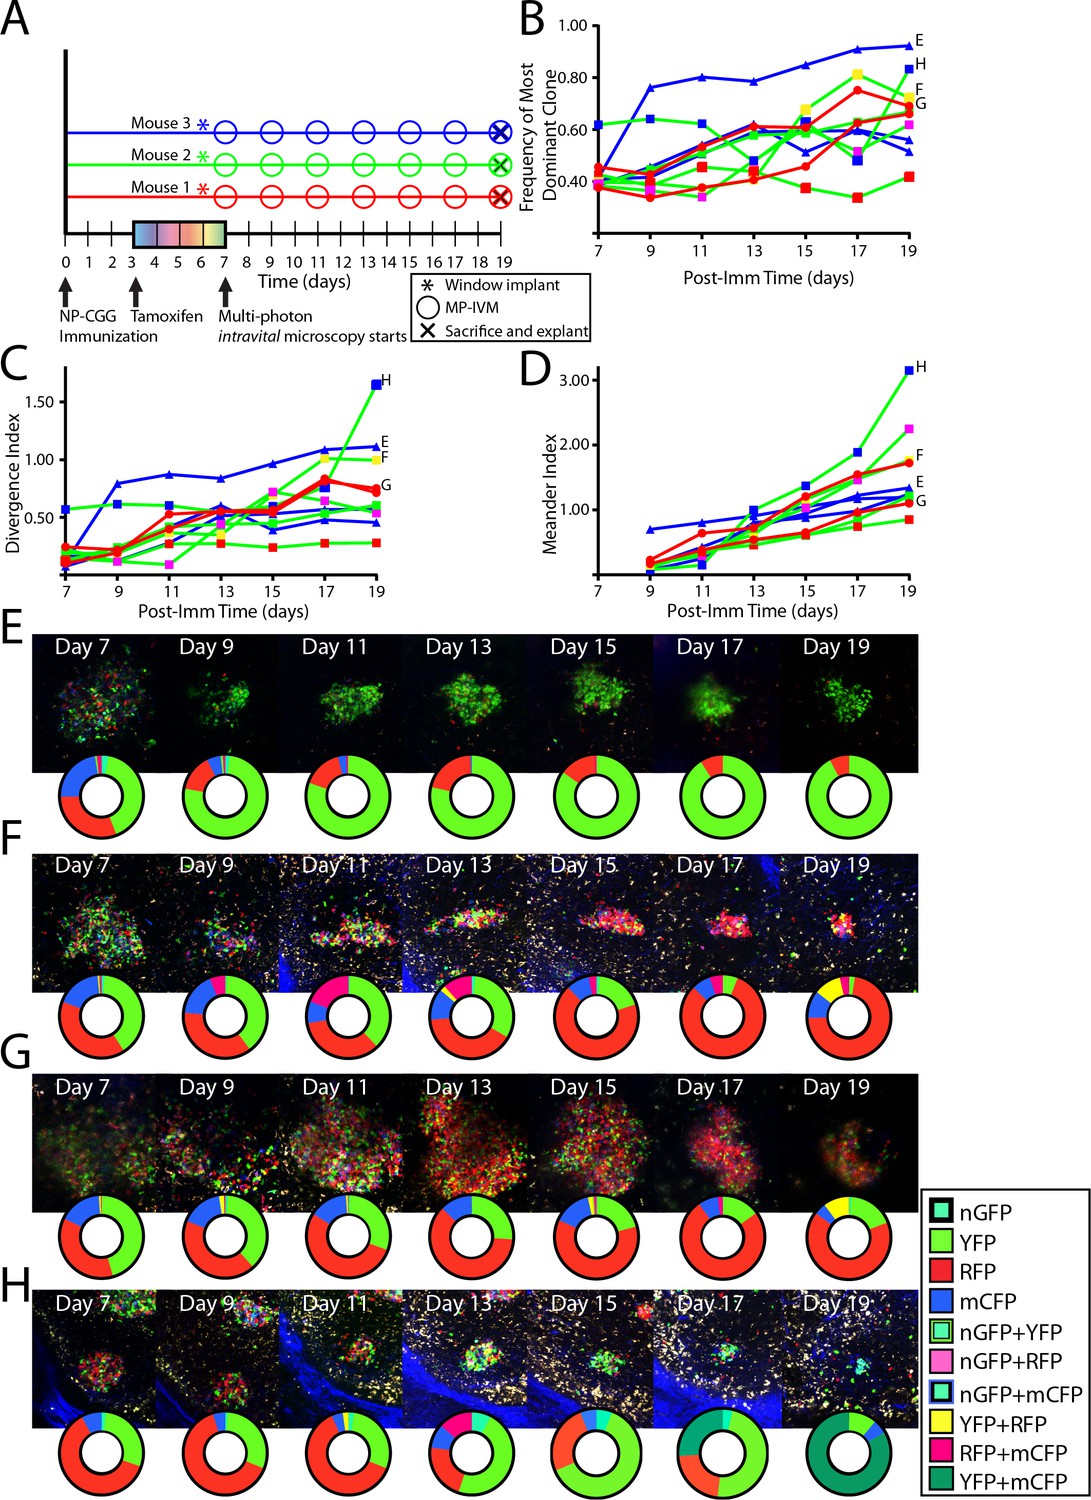
(A) Schematic overview of experimental approach for NP-CGG immunization (imm), tamoxifen treatment, surgical implantation of the CLNW, and multiphoton intravital microscopy in CD45.2 Aicda-Cre-Confetti mice. Data represent one independent experiment with three mice each. (B) Frequency of most dominant color for each individual GC as observed from 7 to 19 days post-imm in 3 mice. (C) Divergence Index for each individual GC as observed from 7 to 19 days post-imm in 3 mice. (D) Meander Index for each individual GC as observed from 7 to 19 days post-imm in 3 mice. (E) GC labeled E as in (B), (C), and (D) with pie chart to elaborate quantification below at each observation from days 7–19. (F) GC labeled F as in (B), (C), and (D) with pie chart to elaborate quantification below at each observation from days 7–19. Prominent clonal inversion observed from days 11–15. (G) GC labeled G as in (B), (C), and (D) with pie chart to elaborate quantification below at each observation from days 7–19. (H) GC labeled H as in (B), (C), and (D) with pie chart to elaborate quantification below at each observation from days 7–19. Double clonal inversion observed from days 11–13 and days 17–19. Please note that in E-H, representative images and quantification charts do not display 1:1 correspondence, since the latter are based on multiple z-planes throughout the volume of each of the GCs.
-
Figure 5—source data 1
NPCGG tracking experimental data for each observed GC to calculate relative frequency, dominance, relative frequency, and meander score.
- https://doi.org/10.7554/eLife.33051.015
Figure 6

Following the clonal composition of individual autoimmune GC over days to weeks.
(A) Schematic overview of experimental approach for CD45.2 Aicda-Cre-Confetti 564 mixed BM chimeras elaborating tamoxifen treatment, surgical implantation of the CLNW, and multiphoton intravital microscopy. Data represent two independent experiments with three mice each. (B) Frequency of most dominant color for each individual GC as observed from 4 to 26 days post-tamoxifen induction in individual GC from 6 mice. (C) Divergence Index for each individual GC as observed from 4 to 26 days post-tamoxifen in 6 mice. (D) Meander Index for each individual GC as observed from 4 to 26 days post-tamoxifen in 6 mice. (E) Four representative GC labeled with pie chart to elaborate quantification below at each observation from days 4–26. Second row down, prominent double inversion event comparing days 12–14 and 20–22. Third row down, white arrow for marking the site of a cluster of extra-GC YFP+ cluster which compete in the RFP +dominant GC on days 24 and 26. Please note that the representative images and quantification charts do not display 1:1 correspondence, since the latter are based on multiple z-planes throughout the volume of each of the GCs.
-
Figure 6—source data 1
564-Ig tracking experimental data for each observed GC to calculate relative frequency, dominance, relative frequency, and meander score.
- https://doi.org/10.7554/eLife.33051.017
Figure 7
Principal component analysis reveals global mouse association with variance in color relative frequency for adjacent GC.
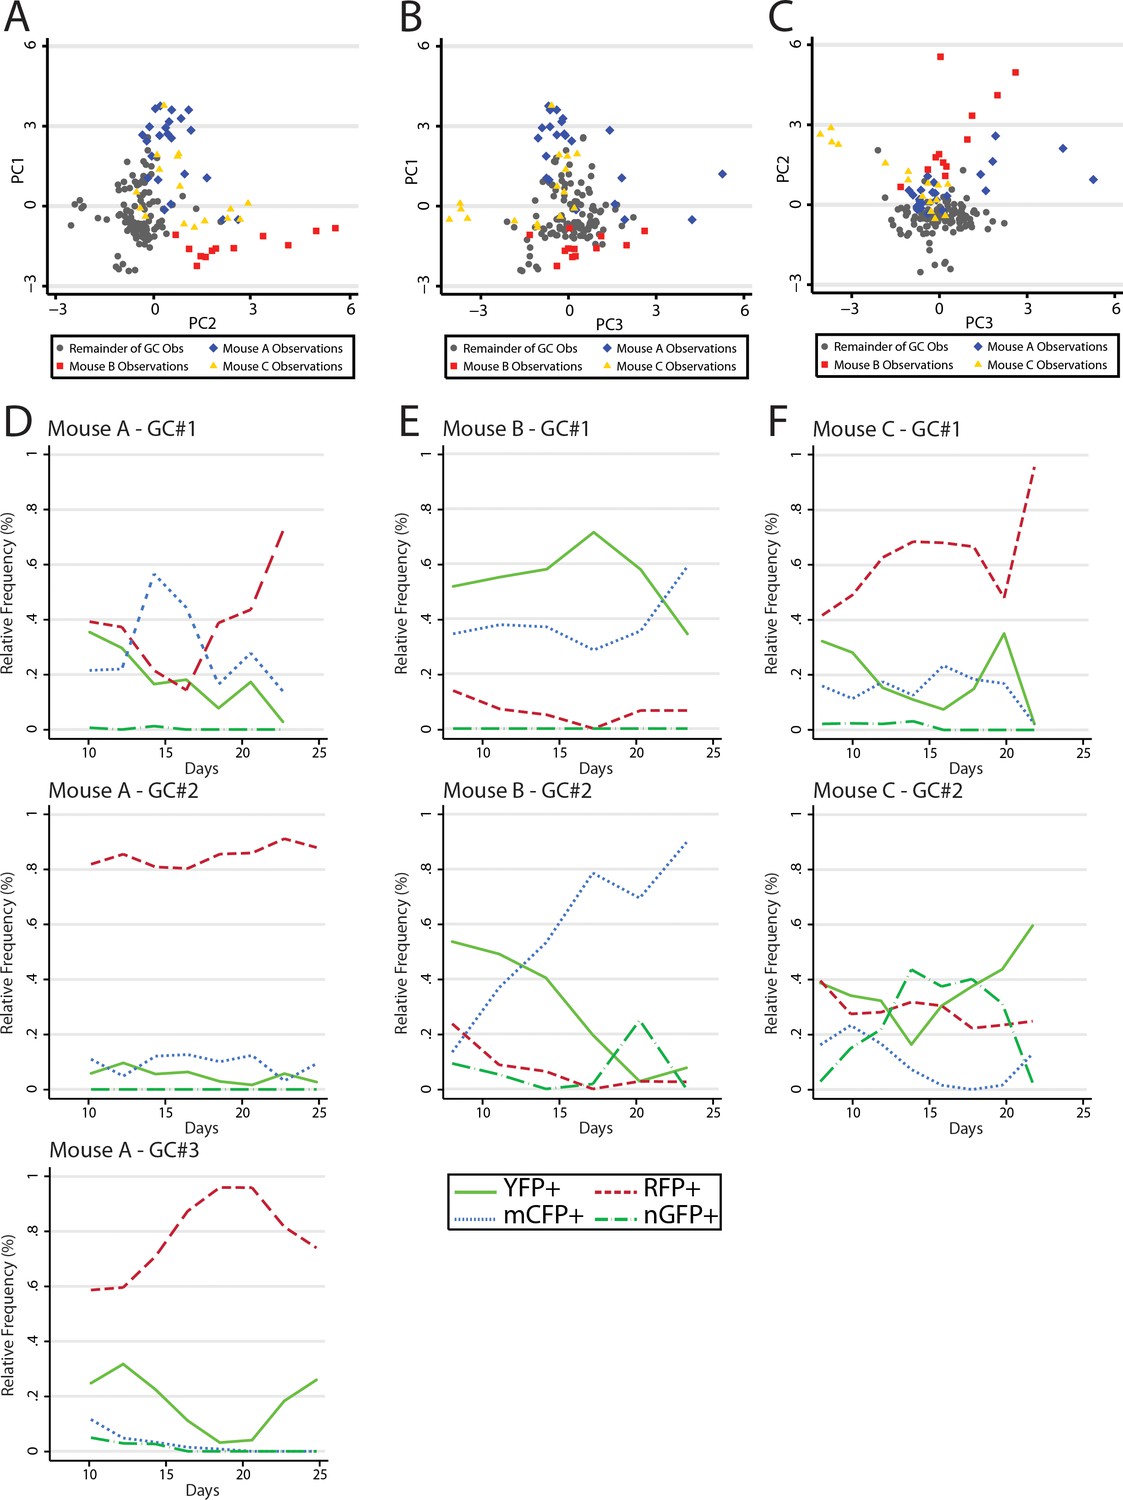
(A) Following generation of principal components, GC data points are shown by principal component 1 (PC1) and principal component 2 (PC2). Data points are colored as Mouse A (blue), Mouse B (red), Mouse C (gold), and the remainder of GC (gray). Statistical association for PC1 was p<0.0001 for A, p<0.0001 for B, and p=0.5861 for C. For PC2 A was p=0.142, B was p<0.0001, and C was p<0.0001. For PC3 A was p=0.002, B was was p=0.005 and C was p=0.002. (B) As in (A) but for PC1 and PC3. (C) As in (A) but for PC2 and PC3. (D) Relative frequencies of the four most prevalent colors in all observed GC (#1–3) within the window of Mouse A. (E) As in (D) but for Mouse B. (F) As in (D) but for Mouse C.
-
Figure 7—source data 1
Longitudinal observations of relative frequency by GC to perform PCA
- https://doi.org/10.7554/eLife.33051.019
Tables
Table 1
Modeling* the B1-8hi CFP+ GC Initiation to NP-CGG.
https://doi.org/10.7554/eLife.33051.020| Y0 | K | Tau | Doubling time (hours) | R∧2 | |
|---|---|---|---|---|---|
| Fo1 | 2.5 × 10⁻⁶ (-−8.5 × 10⁻⁶ – 1.4 × 10⁻⁵) | 0.110 (0.085–0.136) | 9.06 (7.35–11.81) | 6.28 (5.10–8.18) | 0.9980 |
| Fo2 | 0.022 (−0.022–0.066) | 0.053 (0.042–0.065) | 18.73 (15.32–24.09) | 12.98 (10.62–16.70) | 0.9890 |
| Fo3 | 1.469 (−3.945–6.883) | 0.018 (−0.006–0.0422) | 56.49 (23.68-inf) | 39.15 (16.41-INF) | 0.5811 |
| Fo4 | 0.001 (0.001–0.001) | 0.072 (0.069–0.753) | 13.82 (13.28–14.40) | 9.58 (9.21–9.99) | 0.9998 |
| Fo5 | 0.120 (−0.147–0.387) | 0.046 (0.033–0.060) | 21.66 (16.74–30.67) | 15.01 (11.61–21.26) | 0.9781 |
| Fo6 | 0.005 (−0.005–0.015) | 0.055 (0.043–0.060) | 18.13 (14.91–23.13) | 12.57 (10.34–16.03) | 0.9895 |
| Fo7 | 0.010 (−0.016–0.036) | 0.055 (0.039–0.071) | 18.26 (14.11–25.88) | 12.66 (9.78–17.94) | 0.9820 |
| Fo8 | 0.472 (−0.873–1.817) | 0.014 (−0.005–0.034) | 69.67 (29.58-inf) | 48.29 (20.50-INF) | 0.5779 |
| Average | 0.011 (0.006–0.016) | 0.056 (0.053–0.059) | 17.86 (17.08–18.70) | 12.38 (11.84–12.96) | 0.9996 |
Key resources table
| Reagent type (species) or resource | Designation | Source or reference | Identifiers | Additional information |
|---|---|---|---|---|
| Antibody | Rabbit polyclonal anti-B-Phycoerythrin | Rockland Immunochemicals | Cat#200-401-099; RRID: AB_10893993 | |
| Antibody | Rabbit polyclonal anti-C3b-A633 | This paper | N/A | |
| Antibody | Rat monoclonal anti-mouse/human GL7 antigen-PacBlue (clone GL7) | Biolegend | Cat#144613; RRID: AB_2563291 | |
| Antibody | Rat monoclonal anti-mouse /human CD45R/B220-PerCP/Cy5.5 (clone RA3-6B2) | Biolegend | Cat#103235; RRID: AB_893356 | |
| Antibody | Mouse monoclonal anti-mouse IgMb-FITC (clone AF6-78) | Biolegend | Cat#406205; RRID: AB_315038 | |
| Antibody | Mouse monoclonal anti-mouse IgMa-PE (clone MA-69) | Biolegend | Cat#408608; RRID: AB_940545 | |
| Antibody | Mouse monoclonal anti-mouse CD45.1-FITC (clone A20) | Biolegend | Cat#110705; RRID: AB_313494 | |
| Antibody | Mouse monoclonal anti-mouse CD45.2-APC (clone 104) | Biolegend | Cat#109813; RRID: AB_389210 | |
| Antibody | Rat monoclonal anti-mouse IgD-PacBlue (clone 11–26 c.2a) | Biolegend | Cat#405711; RRID: AB_1937245 | |
| Antibody | Rat monoclonal anti-mouse CD21/CD35 (CR2/CR1)-PE (clone 7E9) | Biolegend | Cat#123409; RRID: AB_940411 | |
| Antibody | Rat monoclonal anti-mouse CD138 (Syndecan-1)-PE (clone 281–2) | Biolegend | Cat#142503; RRID: AB_10915989 | |
| Antibody | Rat monoclonal anti-mouse CD38-PE/Cy7 (clone 90) | Biolegend | Cat#102717; RRID: AB_2072892 | |
| Antibody | Rat anti-mouse CD31-A647 (clone 390) | Biolegend | Cat#102415 RRID: AB_493411 | |
| Antibody | Mouse monoclonal anti-mouse CD157 (BST-1)-PE (clone BP-3) | Biolegend | Cat#140203; RRID: AB_10643273 | |
| Antibody | Mouse monoclonal anti-mouse CD95 (APO-1/Fas)-PE (clone 15A7) | eBioscience | Cat#12-0951-81; RRID: AB_465788 | |
| Antibody | Rabbit polyclonal anti-Goat IgG (H + L) Cross -adsorbed-A488 | ThermoFisher Scientific | Cat#A-11078; RRID: AB_2534122 | |
| Antibody | Goat polyclonal anti-Mouse IgG2c, Human adsorbed-AP | Southern Biotech | Cat#1079–04; RRID: AB_2692321 | |
| Antibody | Goat polyclonal anti-Mouse IgG2a, Human adsorbed-AP | Southern Biotech | Cat#1080–04; RRID: AB_2692322 | |
| Antibody | Rabbit polyconal anti-Mouse Immunoglobulins-biotin | DAKO | Cat#E035401-2; RRID: AB_2722694 | |
| Antibody | Mouse monoclonal anti-idiotype (clone 9D11) | Chatterjee et al. (2013) | N/A | |
| Other | Custom Chamber | This paper | N/A | |
| Other | Microsurgical Instruments | Fine Science Tools, Foster City, California, USA | N/A | |
| Other | 5–0 ethilon and 5–0 stainless steel suture | Ethicon, Somerville, New Jersey, USA | N/A | |
| Chemical compound, drug | Tamoxifen | Sigma | Cat#T5648 | |
| Chemical compound, drug | Imject Alum Adjuvant | ThermoFisher Scientific | Cat#77161 | |
| Chemical compound, drug | Np-Osu | Bioresearch technologies | Cat#N-1010–100 | |
| Chemical compound, drug | Fixable Viability Dye eFluor 780 | eBioscience | Cat#65-0865-14 | |
| Chemical compound, drug | Hoechst 33342 | ThermoFisher Scientific | Cat#H3570 | |
| Chemical compound, drug | DAPI (4’,6-Diamidino-2-Phenylindole, Dihydrochloride) | ThermoFisher Scientific | Cat#D1306 | |
| Peptide, recombinant protein | B-Phycoerythrin | ThermoFisher Scientific | Cat#P800 | |
| Peptide, recombinant protein | Streptavidin-PE/Cy7 | Biolegend | Cat#405206 | |
| Peptide, recombinant Protein | Phalloidin-A568 | ThermoFisher Scientific | Cat#A12380 | |
| Peptide, recombinant protein | Chicken gamma globulin | Rockland Immunochemicals | Cat#D602-0100 | |
| Peptide, recombinant protein | Europium-labeled streptavidin | Perkin Elmer | Cat#1244–360 | |
| Biological sample (Mus musculus) | Mouse: Aicda-CreERT2 EYFP: Aicda-CreERT2 flox-stop-flox-EYFP | Dogan et al. (2009) | N/A | |
| Biological sample (mouse) | Mouse: PA-GFP: B6.Cg-Ptprca Tg(UBC-PA-GFP)1Mnz/J | The Jackson Laboratory | JAX: 022486 | |
| Biological sample (mouse) | Mouse: 564Igi: 564 HiKi | Berland et al. (2006) | N/A | |
| Biological sample (mouse) | Mouse: Aicda-CreERT2 Confetti: Aicda-CreERT2-Rosa26Confetti | Tas et al. (2016) | N/A | |
| Software, algorithm | ImageJ | Rasband WS, ImageJ, NIH, Bethesda, Maryland, USA | https://imagej.nih.gov/ij/ | |
| Software, algorithm | STATA | Statacorp, College Station, Texas, USA | https://stata.com |
Additional files
-
Transparent reporting form
- https://doi.org/10.7554/eLife.33051.021
Download links
A two-part list of links to download the article, or parts of the article, in various formats.
Downloads (link to download the article as PDF)
Open citations (links to open the citations from this article in various online reference manager services)
Cite this article (links to download the citations from this article in formats compatible with various reference manager tools)
Capturing change in clonal composition amongst single mouse germinal centers
eLife 7:e33051.
https://doi.org/10.7554/eLife.33051


