Codon usage biases co-evolve with transcription termination machinery to suppress premature cleavage and polyadenylation
- The University of Texas Southwestern Medical Center, United States
- Yunnan University, China
- East China University of Science and Technology, China
Figures
Figure 1 with 1 supplement
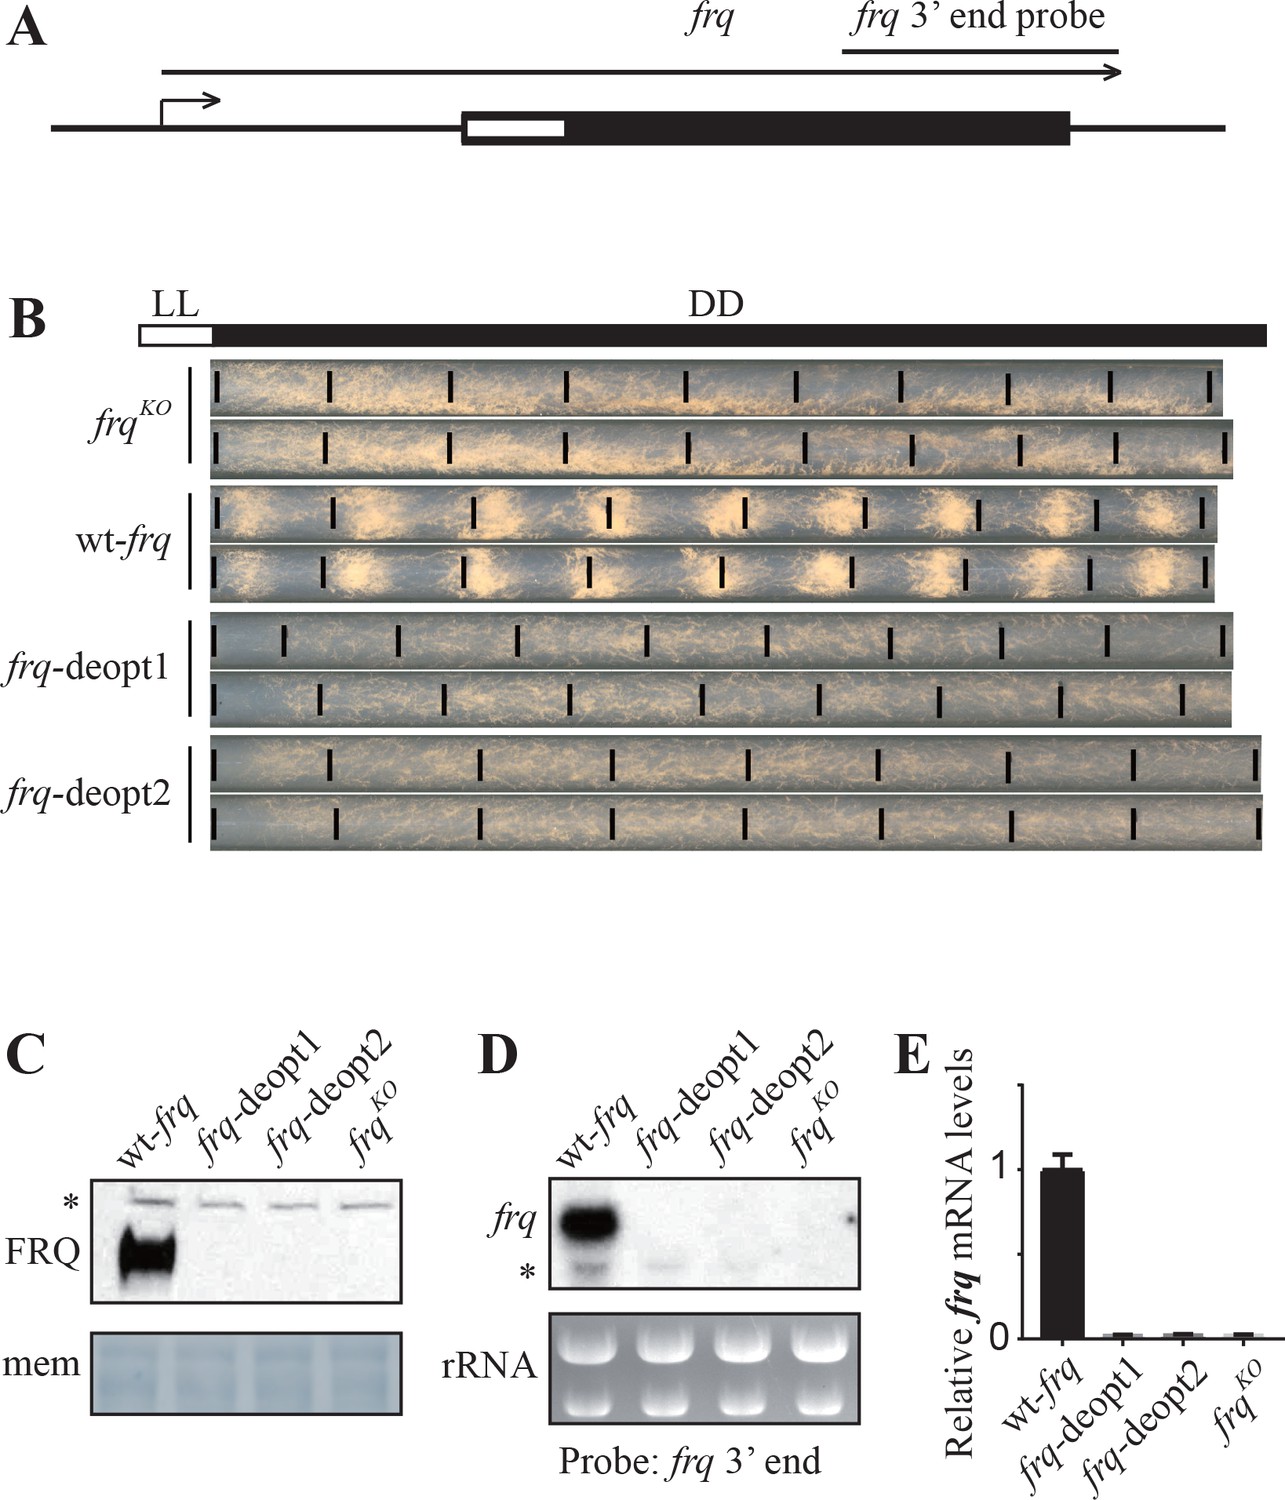
Codon deoptimization of the amino-terminal end of the frq ORF abolished the expression of full-length frq mRNA.
(A) A diagram showing the frq locus. (B) Race tube analysis showing the conidiation rhythm of the frqKO, wt-frq, frq-deopt1, and frq-deopt2 strains. The strains were first cultured in constant light (LL) for 1 day before transferred to constant darkness (DD). Black lines mark the growth fronts every 24 hr. The distance between asexual spore bands was measured and then divided by growth rate to calculate the period length of conidiation rhythm. For the wt-frq strain, the period of conidiation rhythm was 22.07 ± 0.04 hr. (C) Western blot showing FRQ protein levels in frqKO, wt-frq, frq-deopt1, and frq-deopt2 strains. (D) Northern blot showing the expression of full-length frq mRNA in the indicated strains. An RNA probe specific for 3’ end of frq was used in this experiment. (E) Strand-specific RT-qPCR results showing frq mRNA levels in the indicated strains. Primers used for the qPCR were targeted to the middle of frq ORF.
Figure 1—figure supplement 1

DNA sequences of 5’ end of the frq open reading frame region for the indicated constructs.
Nucleotides mutated only in frq-deopt1 are shown in green, nucleotides mutated only in frq-deopt2 are shown in yellow; nucleotides mutated both in frq-deopt1 and frq-deopt2 are shown in red.
Figure 2 with 1 supplement
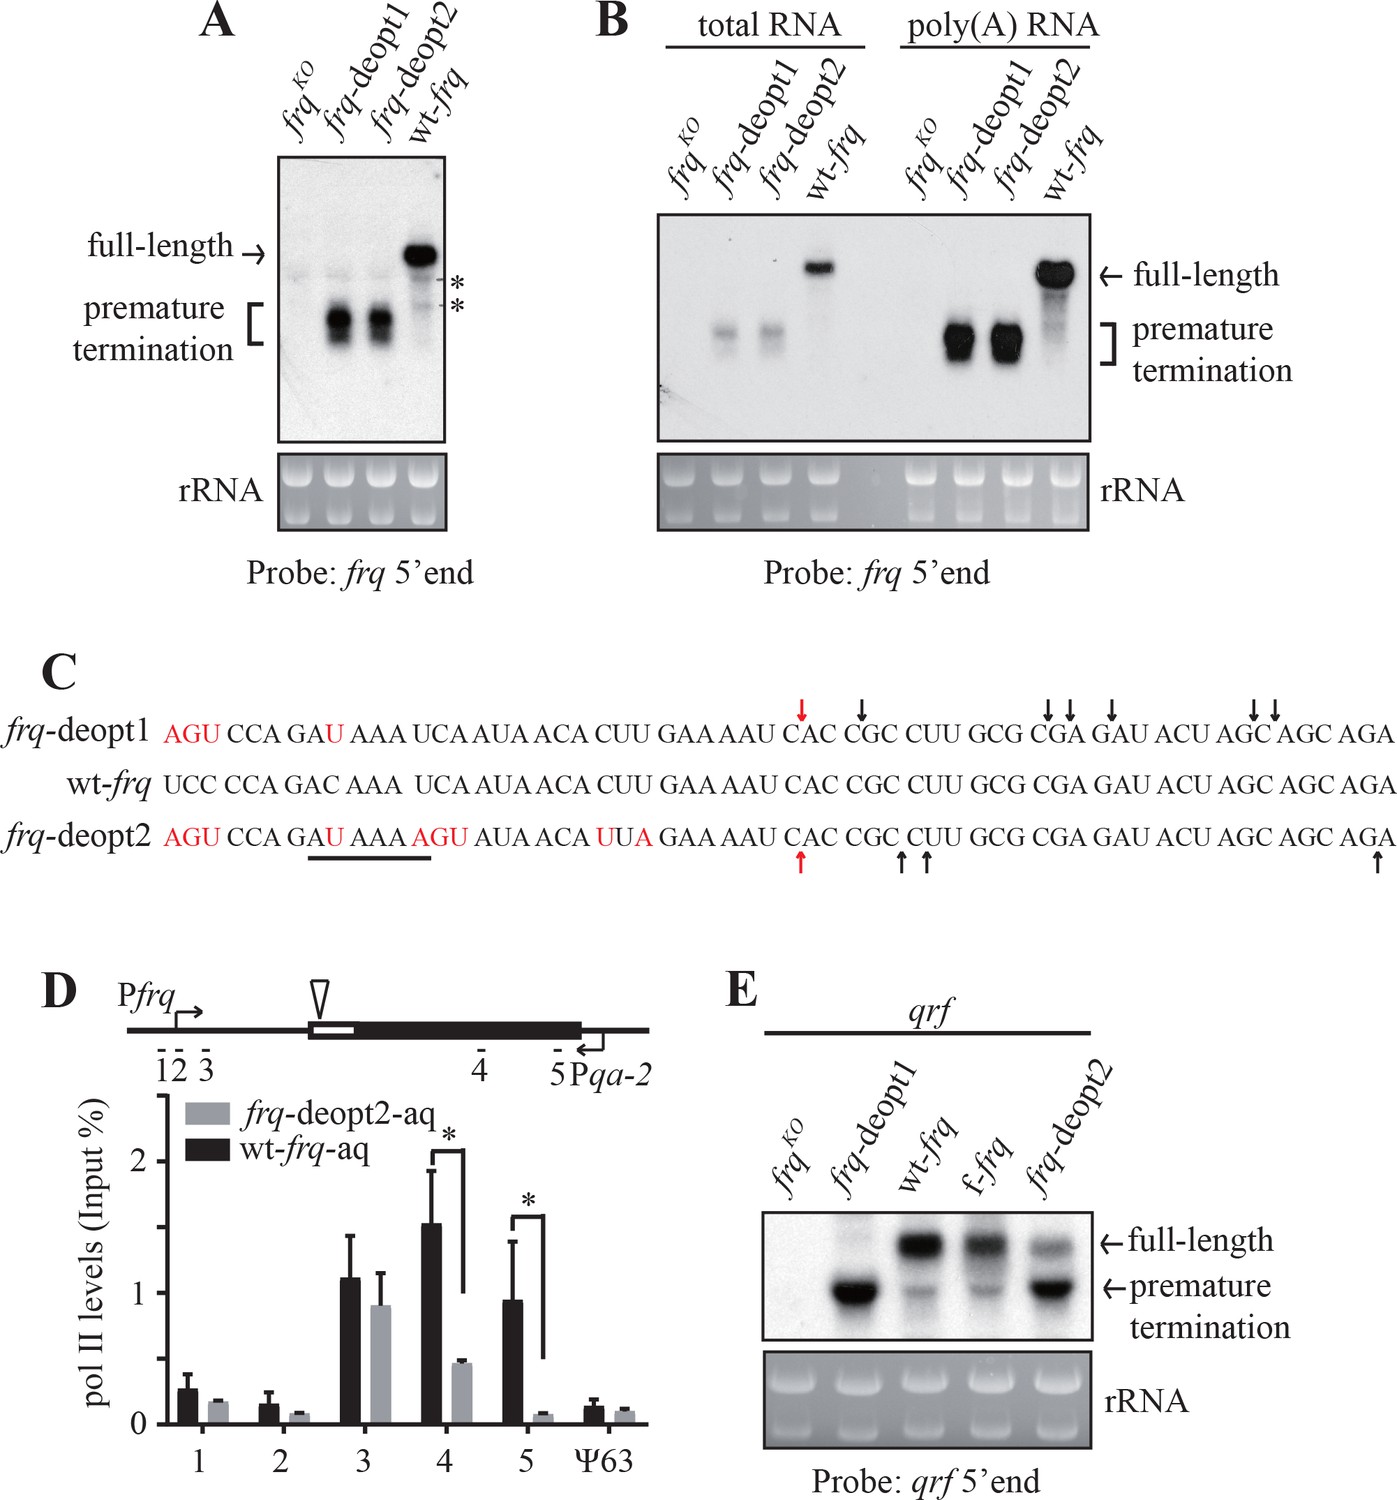
Codon deoptimization of frq results in premature transcription termination.
(A) Northern blot showing the presence of truncated frq mRNA species in both de-optimized strains using an RNA probe targeted to 5’ end of frq mRNA (indicated in ; Figure 2—figure supplement 1E). * indicates a non-specific band. (B) Northern blot showing both full-length and truncated frq mRNA are enriched in poly(A)-containing RNAs. Poly(A) RNAs were purified from total RNAs by using oligo-dT beads. Equal amounts of total RNA or poly(A) RNA were loaded in each lane. Probe specific for 5’ end of frq was used. (C) Poly(A) sites mapped by 3’ RACE. Arrows indicate the mapped poly(A) sites, the red arrows indicate the major poly(A) site that was found in both frq-deopt1 and frq-deopt2 strains, and the black line indicates potential PAS motif (AUAAAU in frq-deopt1 and AAUAAA in frq-deopt2). Nucleotides that are mutated are shown in red. (D) ChIP assay showing RNA pol II levels at the frq transgene loci in the wt-frq-aq and frq-deopt2-aq strains. The ChIP results were normalized by input DNA and represented as Input%. The promoter of qrf was replaced by a qa-2 promoter and tissue were cultured in the absence quinic acid to block qrf transcription. The triangle on the top indicates the location of mapped poly(A) sites. The previously known heterochromatin region ψ63 in Neurospora was used as the negative control. Error bars shown are standard deviations (n = 3). *p<0.05. (E) Northern blot analysis showing premature transcription termination of qrf. f-frq is an frq codon-optimized strain (Zhou et al., 2013a).
Figure 2—figure supplement 1
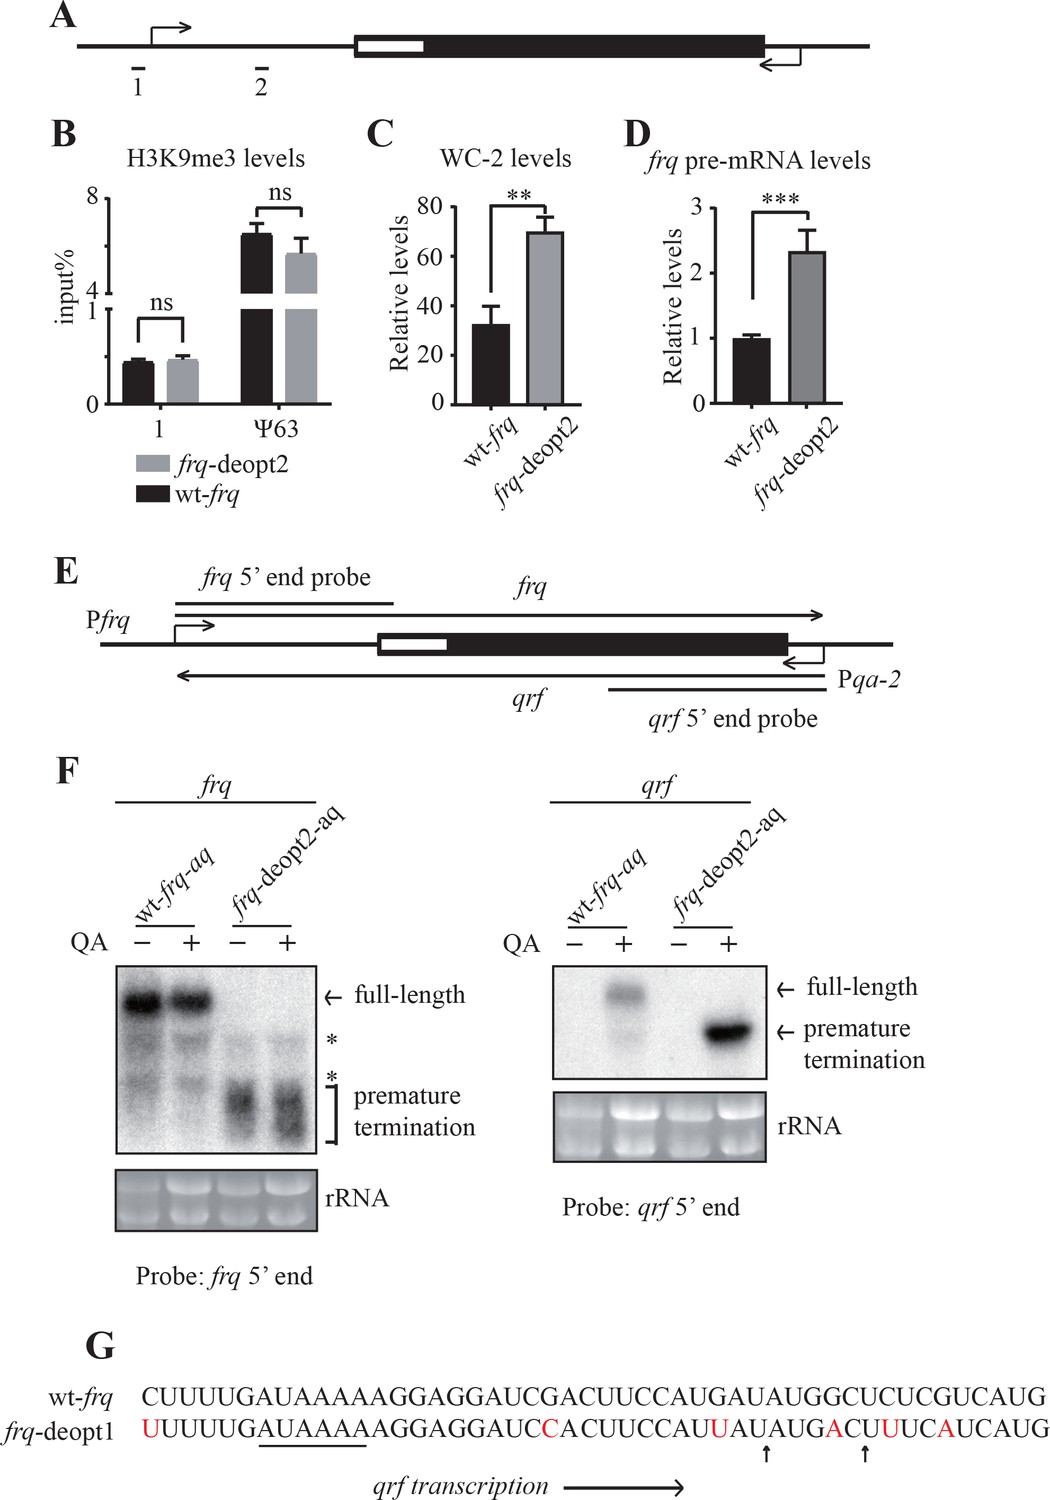
Mechanism of the codon usage-mediated gene expression changes at the frq locus
(A) A diagram showing the frq locus. Primer set one is used to detect H3K9me3 levels (B) and WC-2 levels (C); primer set two is used to detect frq pre-mRNA levels (D). (B) ChIP analysis showing H3K9me3 levels at the frq promoter in the wt-frq and frq-deopt2 strains. The ChIP results were normalized by input DNA and represented as percentage of input (Input%). The heterochromatic region ψ63 was used as a positive control. ns, not significant. (C) ChIP assay showing WC-2 enrichment at the frq promoter in the wt-frq and frq-deopt2 strains. The ChIP results were first normalized by input DNA then normalized by an internal control β-tubulin and represented as relative levels. **p<0.01. (D) Strand-specific RT-qPCR assay showing frq pre-mRNA levels in the wt-frq and frq-deopt2 strains. ***p<0.001. (E) A diagram showing the frq locus. RNA probes used for detecting prematurely terminated frq mRNA and for detecting qrf in northern blot assay are indicated. The promoter of qrf was replaced by a qa-2 promoter, which is activated only in the presence of quinic acid (QA). (F) Northern analysis detecting frq (left) and qrf (right) in the wt-frq-aq and frq-deopt2-aq strains. The asterisks indicate non-specific bands. – means without QA in the medium, and +means with QA in the medium. (G) Poly(A) sites of prematurely terminated qrf mapped by 3’ RACE. Arrows indicate the mapped poly(A) sites, and the black line indicates a potential PAS motif (AAUAAA). Nucleotides that are mutated are shown in red.
Figure 3 with 1 supplement

Rare codons promote while optimal codons suppress premature transcription termination of frq.
(A) A diagram showing the constructs created to map codons important for premature transcription termination. The triangle indicates the location of the mapped poly(A) sites. Black bars indicate the regions where wild-type codons are used, whereas white bars indicate regions that are codon de-optimized. (B) Left panel, northern blot analysis showing the expression of full-length and premature terminated frq mRNA species in the indicated strains. The asterisks indicate non-specific bands. A probe for frq 5’ end was used. Right panel, densitometric analyses of results from three independent experiments. Error bars shown are standard deviations (n = 3). ***p<0.001. (C) Left panel, western blot result showing FRQ protein levels in the indicated strains. The asterisk indicates a non-specific band. Right panel, densitometric analyses of results from three independent experiments. (D) Left top panel, western analyses showing FRQ protein levels in the wt-frq, frq-deopt6, and frq-deopt7 strains. Left bottom panel, northern blot showing full-length frq mRNA levels in the indicated strains. Middle panel, densitometric analysis of FRQ levels from three independent experiments. Right, densitometric analyses of full-length frq mRNA levels from three independent experiments. Error bars shown are standard deviations (n = 3). **p<0.01, ***p<0.001. (E) Left top panel, western analyses showing FRQ protein levels in the frq-deopt4 and frq-deopt4* strains. Left bottom panel, northern blot showing full-length frq mRNA levels in the indicated strains. An RNA probe specific for 5’ end of frq was used. Middle, densitometric analyses of FRQ levels from three independent experiments. Right, densitometric analyses of full-length frq mRNA levels from three independent experiments. Error bars shown are standard deviations (n = 3). ***p<0.001.
Figure 3—figure supplement 1
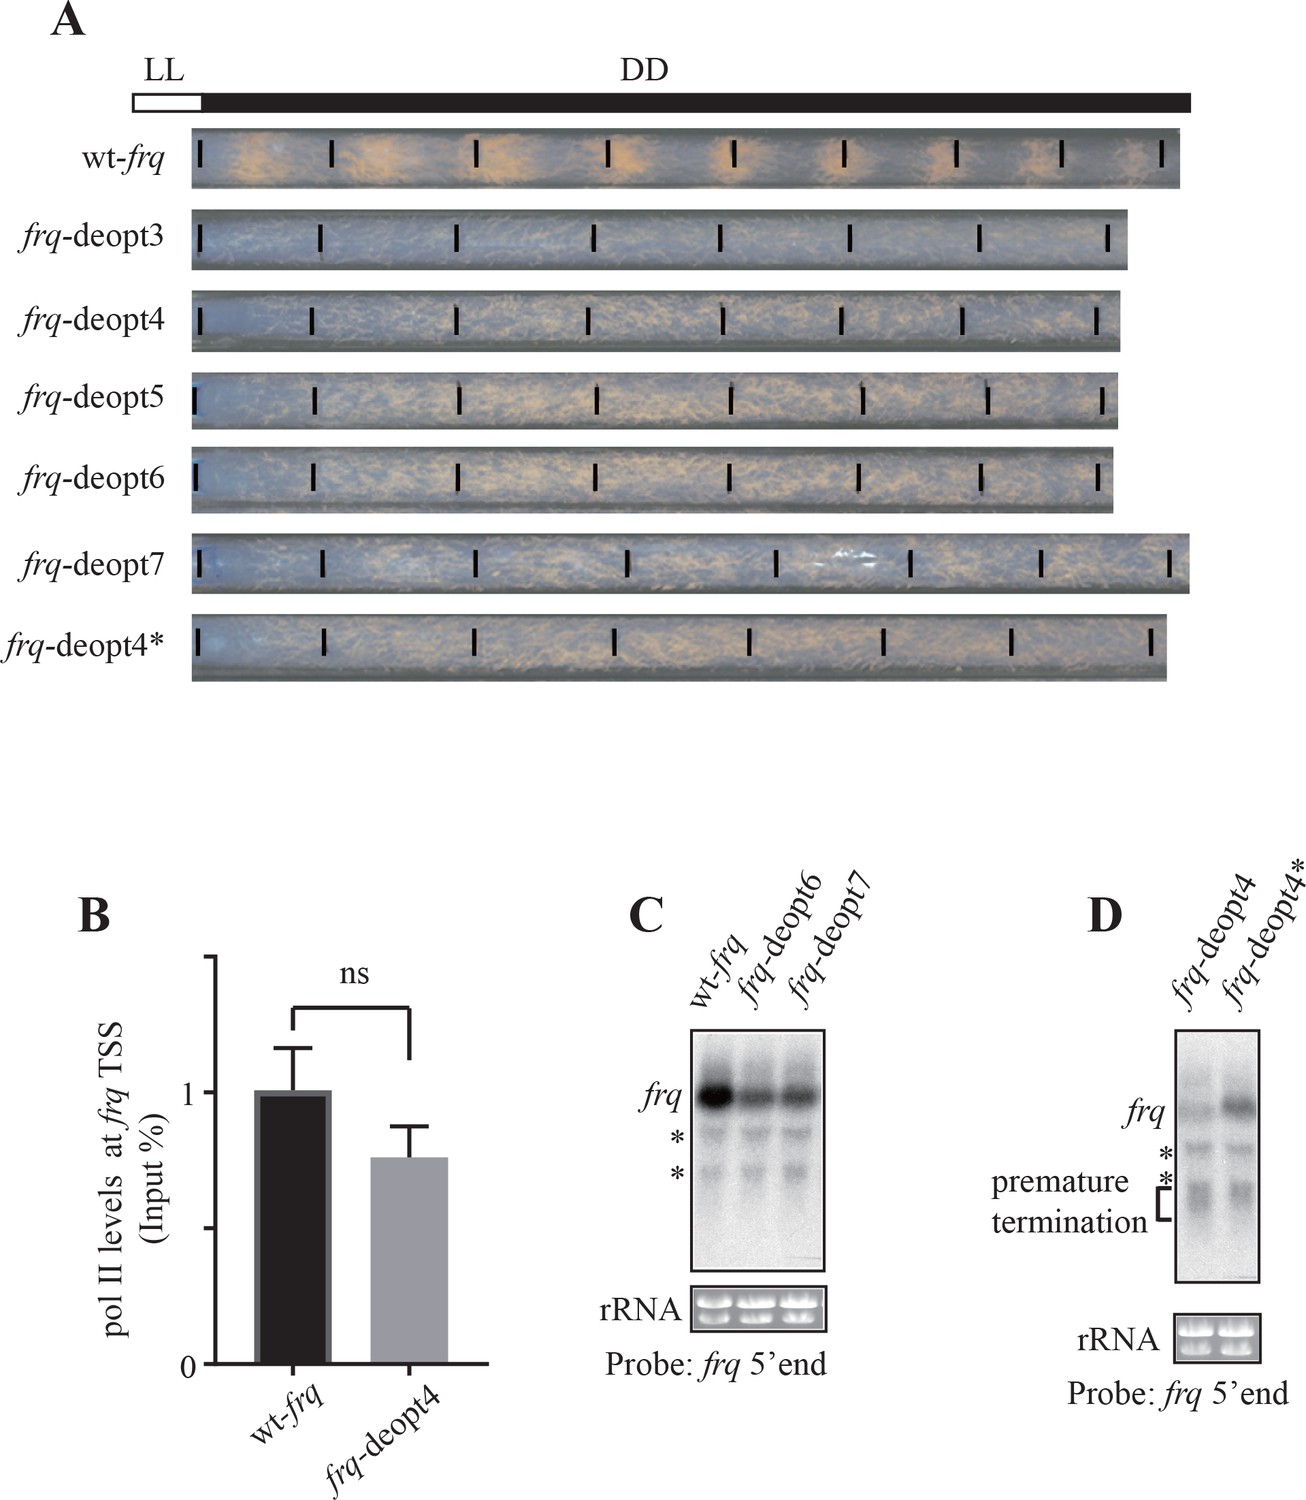
Codon deoptimization of frq abolish circadian clock function and reduction of frq expression.
(A) Race tube analysis showing the conidiation phenotypes of the wt-frq, frq-deopt3, frq-deopt4, frq-deopt5, frq-deopt6, frq-deopt7, and frq-deopt4* strains in constant darkness (DD). The strains were first cultured in constant light (LL) for 1 day before transferred to DD. Black lines mark the growth fronts every 24 hr. (B) ChIP analysis showing polII levels at the frq transcription start site (TSS) in the wt-frq and frq-deopt4 strains. The ChIP results were normalized by input DNA and represented as Input%. ns, not significant. (C) Northern blot showing full-length and prematurely terminated frq mRNA levels in wt-frq, frq-deopt5, frq-deopt6, and frq-deopt7 strains. An RNA probe specific for 5’ end of frq was used. * indicate non-specific bands. (D) Northern blot showing full-length and prematurely terminated frq mRNA levels in the frq-deopt4 and frq-deopt4* strains. An RNA probe specific for 5’ end of frq was used. * indicate non-specific bands.
Figure 4 with 1 supplement
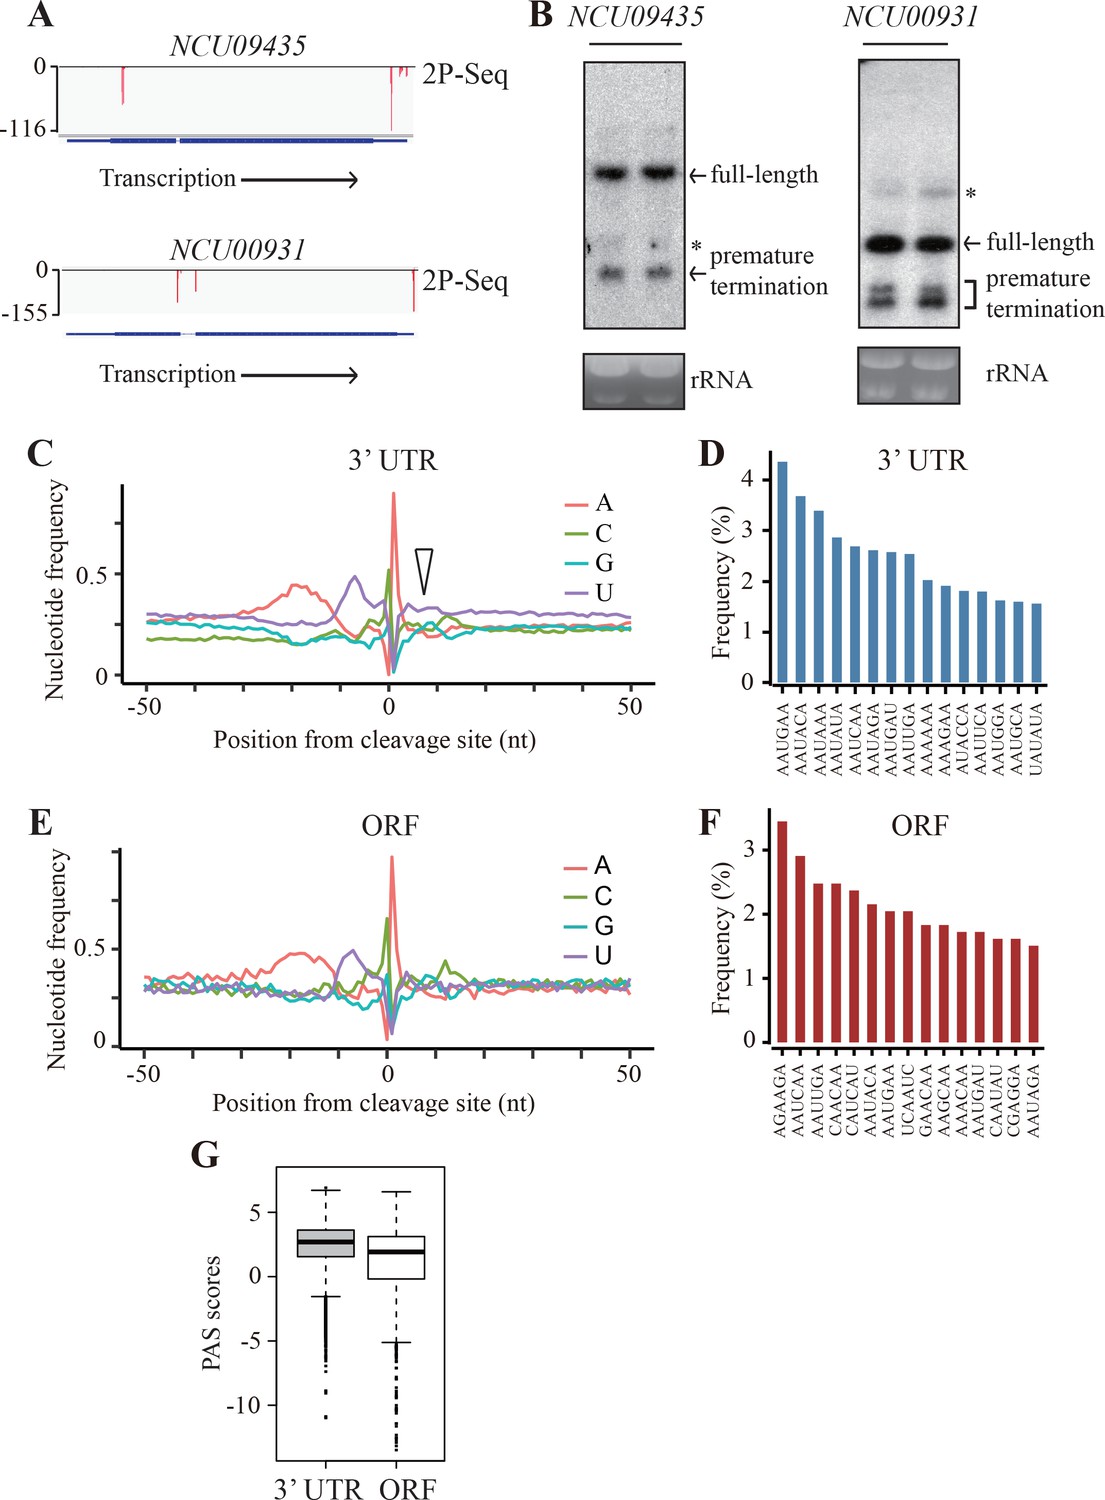
Genome-wide identification of premature transcription termination events in ORF of endogenous Neurospora genes.
(A) 2P-seq results on NCU09435 (top) and NCU00931 (bottom) genes showing the transcription termination events in the 3’ UTR and ORF. (B) Northern blot analyses showing the presence of both full-length and prematurely terminated NCU09435 mRNA (left) and NCU00931 mRNA (right) in the wild-type strain, respectively. An RNA probe specific for 5’ end of NCU09435 or NCU00931 was used, respectively. * indicates a non-specific band. (C) Genome-wide nucleotide composition surrounding mRNA 3’ ends in the 3’UTRs. 0 indicates the position of the mapped 3’ end of mRNA. The triangle indicates the downstream U-rich element. (D) Top 15 most frequently used PAS motifs found in the A-rich element of 3’ UTR-PAS. (E) Genome-wide nucleotide sequence composition surrounding ORF-pA sites. (F) Top 15 most frequently used PAS motifs found in the A-rich element of ORF-PAS. (G) Box-plots of PAS scores for 3’UTR-PAS and ORF-PAS determined in Neurospora.
Figure 4—figure supplement 1

Analyses of the 2P-seq results in Neurospora.
(A) Scatter analysis showing the reproducibility of two biological replicates of our 2P-seq of nuclear poly(A)-containing RNAs of Neurospora. (B) 2P-seq reads mapped in the coding region of NCU09435 and in the first exon of NCU00931. Amino acids coded by the least preferred codons are shown in green, amino acids coded by the most preferred codons are shown in red, and the rest are shown in black. The arrows indicate the direction of translation.
Figure 5 with 3 supplements
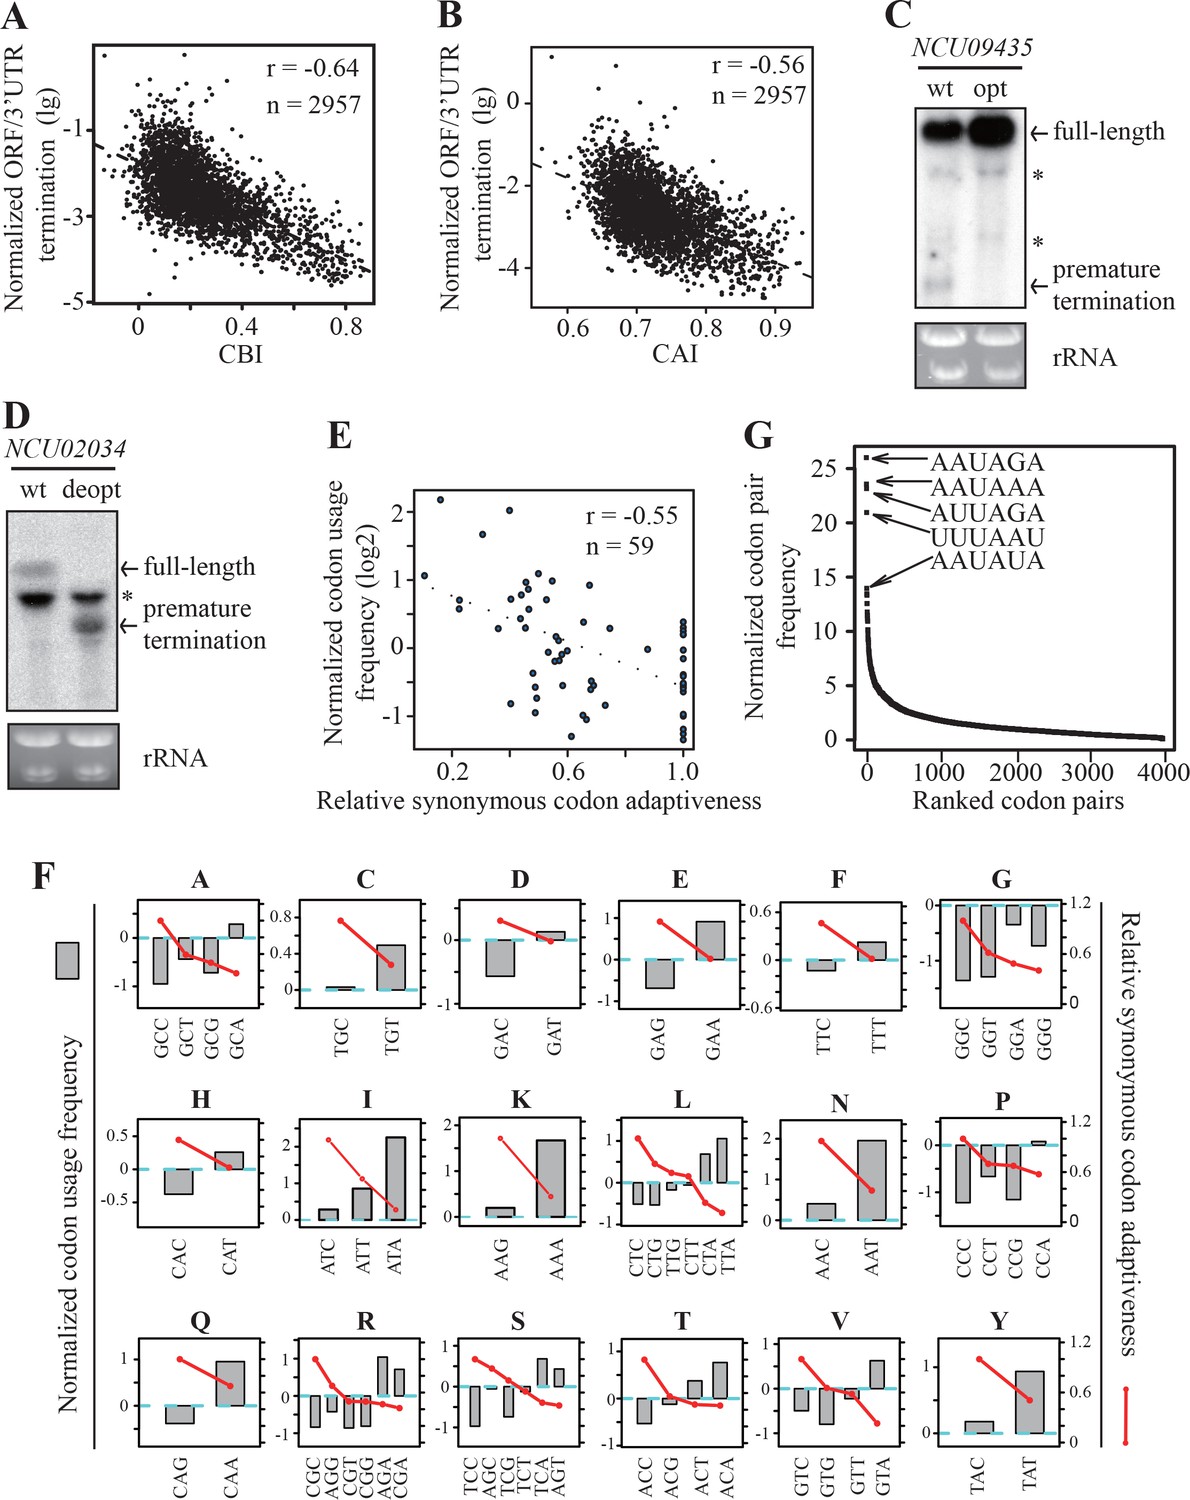
Strong genome-wide correlations between codon usage and premature transcription termination events.
(A) Scatter plot of normalized ORF/3’ UTR termination events (log10) vs. CBI. r = −0.64, p<2.2 × 10⁻¹⁶, n = 2957. (B) Scatter analysis showing the correlation of normalized ORF/3’ UTR termination events with CAI. Pearson’s r = −0.56. p<2.2 10−16, n = 2957. (C) Northern blot analyses showing that premature transcription termination was abolished after codon optimization of NCU09435. gfp-NCU09435-wt and gfp-NCU09435-opt were targeted to the his-3 locus, and an RNA probe specific for gfp was used. The asterisks indicate non-specific bands. (D) Northern blot analyses showing that premature transcription termination was observed after codon de-optimization of NCU02034. gfp-NCU02034-wt and gfp-NCU02034-deopt were targeted to the his-3 locus, and an RNA probe specific for gfp was used. (E) Scatter plot of normalized codon usage frequency (NCUF) (log2) with relative synonymous codon adaptiveness (RSCA) of all codons with at least two synonymous codons. r = −0.55, p=3.8 × 10⁻⁶, n = 59. (F) The correlation of normalized codon usage frequency (NCUF) with relative synonymous codon adaptiveness (RSCA) within each synonymous codon group with at least two synonymous codons. NCUF values of every codon within the −10 to −30 regions upstream of all identified ORF-pA sites was calculated. (G) A graph showing the ranking of all codon pairs by normalized codon pair frequency (NCPF). Codon pairs are ranked based on their NCPF values.
Figure 5—figure supplement 1

Sequence alignment of NCU09435-wt and NCU09435-opt constructs (A) and sequence alignment of NCU02034-wt and NCU02034-deopt constructs (B).
Nucleotides that are mutated in the optimized NCU09435 gene are shown in red. The arrow indicates the poly(A) site mapped by 2P-seq. The black line in (A) indicates a potential PAS motif present only in the wild-type construct. Nucleotides that are mutated in the de-optimized NCU02034 gene are shown in red. The black line in (B) indicates a potential PAS motif present both in the wild-type and deoptimized construct.
Figure 5—figure supplement 2

Nucleotide composition (U top panel and A bottom panel) surrounding PAS motifs in 3’ UTR (A) and coding region (B).
True PAS means at least a poly(A) site was identified by 2P-seq within the 5–35 nt downstream of PAS motif, and False PAS has no poly(A) site was identified in this region. 0 indicates the position of the first nucleotide of PAS, the black bar indicates the position of PAS motif, and the yellow lines indicate the regions shows different between True PAS and False PAS. A/U contents above 0.5 are not shown.
Figure 5—figure supplement 3

Correlations between relative codon usage frequency and relative synonymous codon adaptiveness.
(A) Scatter plot analysis of relative codon usage frequency (RCUF) with relative synonymous codon adaptiveness (RSCA) of all codons with at least two synonymous codons in Neurospora. r = −0.66, p=5.5 × 10⁻⁹, n = 59. (B) The correlation of relative codon usage frequency (RCUF) with relative synonymous codon adaptiveness (RSCA) within each synonymous codon group with at least two codons in Neurospora.
Figure 6
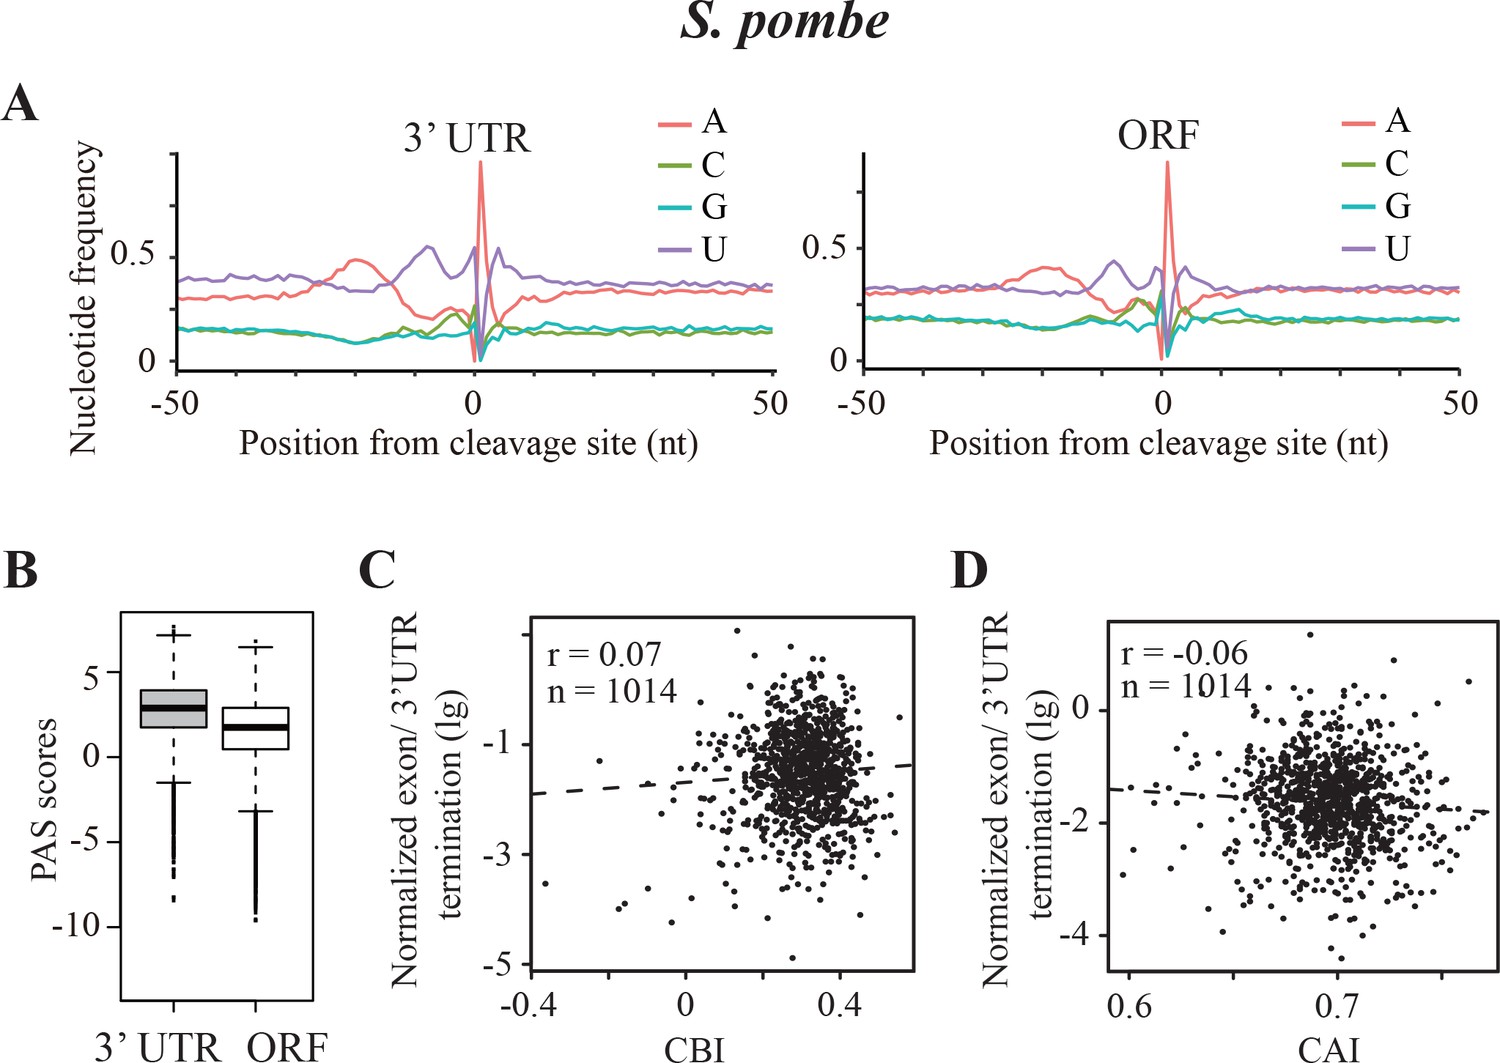
Transcription termination events in Schizosaccharomyces pombe.
(A) Nucleotide sequence composition surrounding the poly(A) sites located in 3’ UTR (left) and in ORF (right) in S. pombe. (B) Genome-wide PAS scores for 3’UTR-PAS and ORF-PAS. (C) Scatter analysis showing the correlation of normalized ORF/3’ UTR termination with CBI. r = 0.07, p=0.04, n = 1014. (D) Scatter plot of normalized ORF/3’ UTR termination vs CAI. r = −0.06, p=0.03, n = 1014.
Figure 7 with 2 supplements
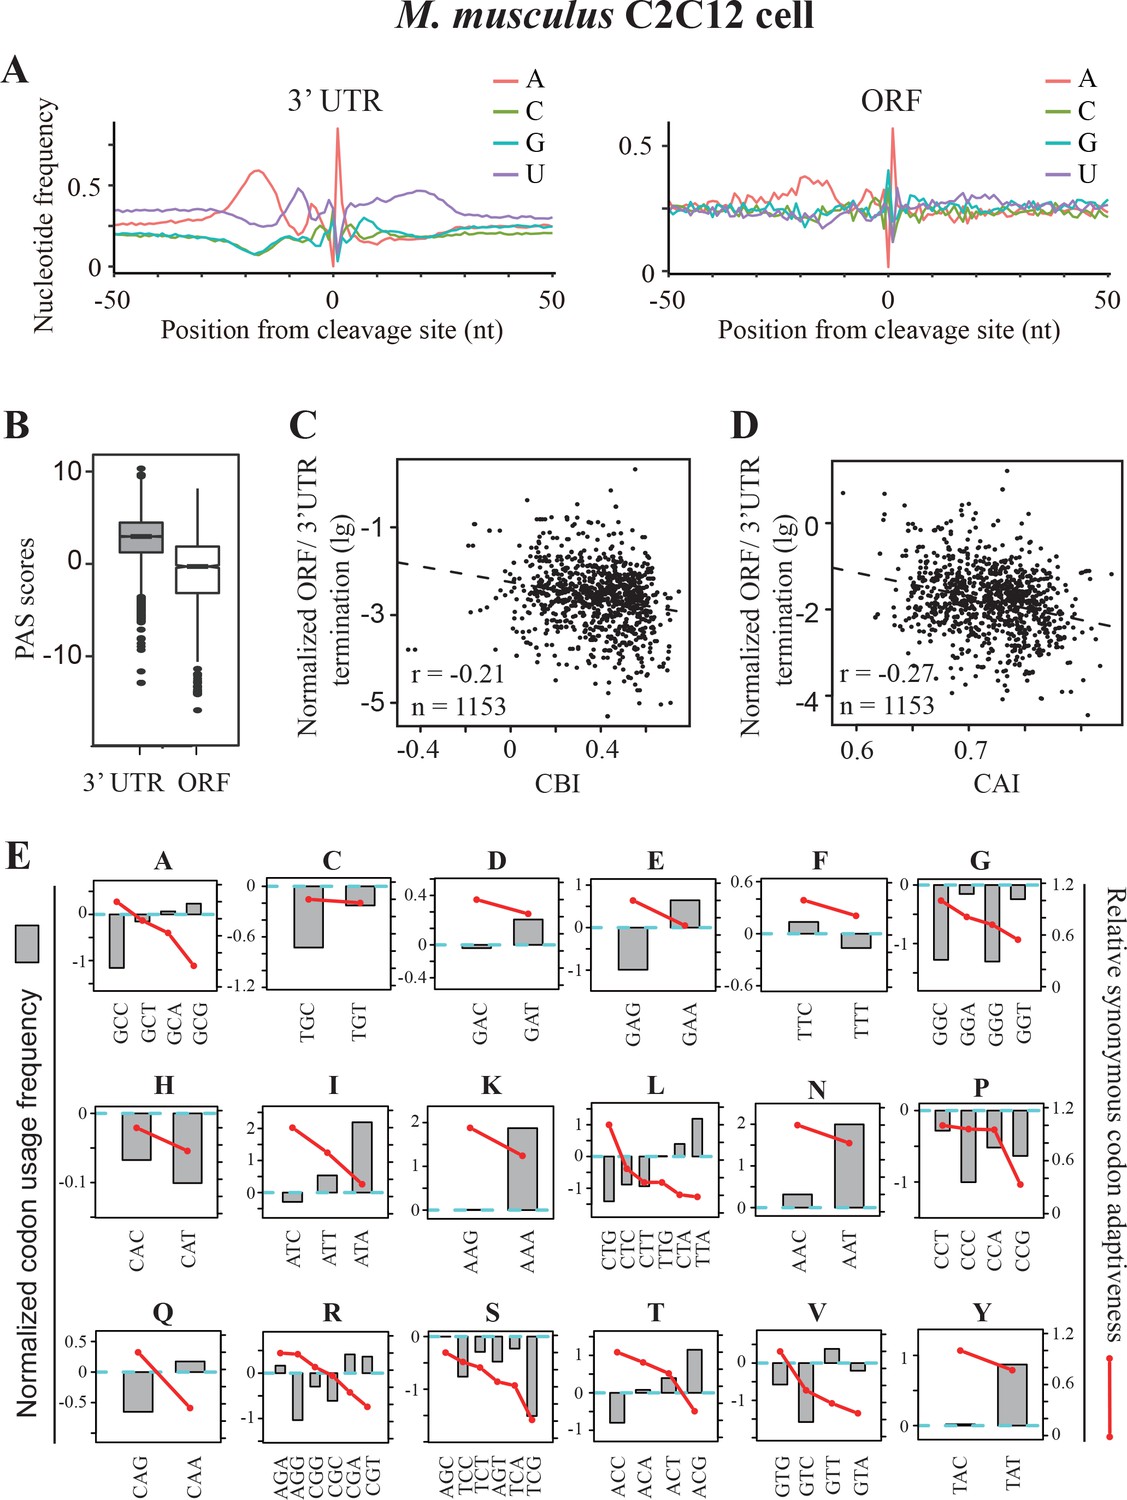
Premature transcription termination events in ORFs in mouse C2C12 cells.
(A) Nucleotide sequence composition surrounding poly(A) sites in 3’ UTR (left) and in ORFs (right) in mouse C2C12 cells. (B) PAS scores for 3’UTR-PAS and ORF-PAS. (C) Scatter analysis showing the correlation of normalized ORF/3’ UTR termination with CBI. Pearson’s r = −0.21. p=6.29 × 10⁻¹³, n = 1153. (D) Scatter plot of normalized ORF/3’ UTR termination vs CAI. r = −0.27, p<2.2 × 10⁻¹⁶, n = 1153. (E) The correlation of normalized codon usage frequency (NCUF) with relative synonymous codon adaptiveness (RSCA) within each synonymous codon group with at least two codons. NCUF values were calculated for −10 to −30 nt regions upstream of identified poly(A) sites in ORFs.
Figure 7—figure supplement 1
Sequence analyses of poly(A) sites in mouse C2C12 cells.
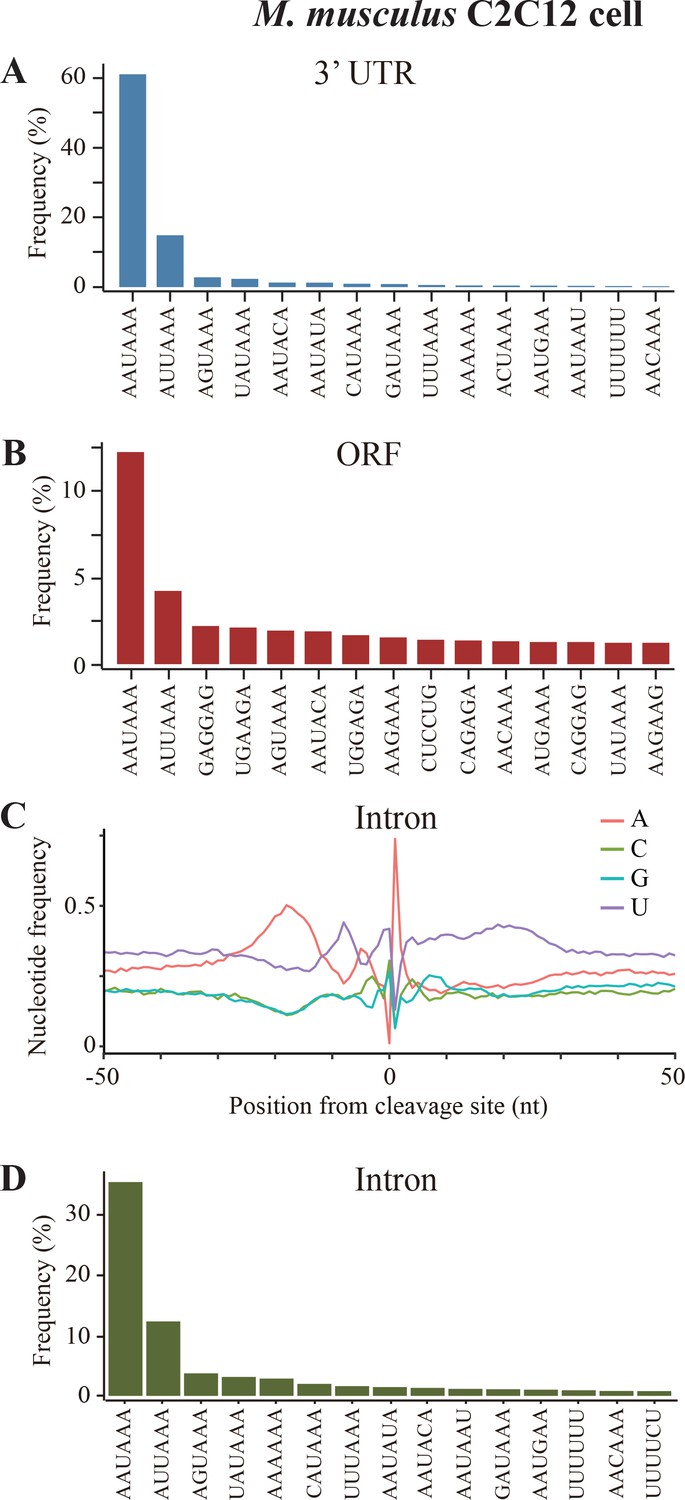
(A) Top 15 most frequently used PAS motifs found in the A-rich element of 3’ UTR-PAS. (B) Top 15 most frequently used PAS motifs found in the A-rich element of 3’ UTR-PAS ORF-PAS in mouse C2C12 cells. (C) Nucleotide sequence composition surrounding poly(A) sites in intron. (D) Top 15 most frequently used PAS motifs found in the A-rich element of 3’ Intron-PAS.
Figure 7—figure supplement 2
Codon usage and sequence analyses of poly(A) sites in mouse C2C12 cells.
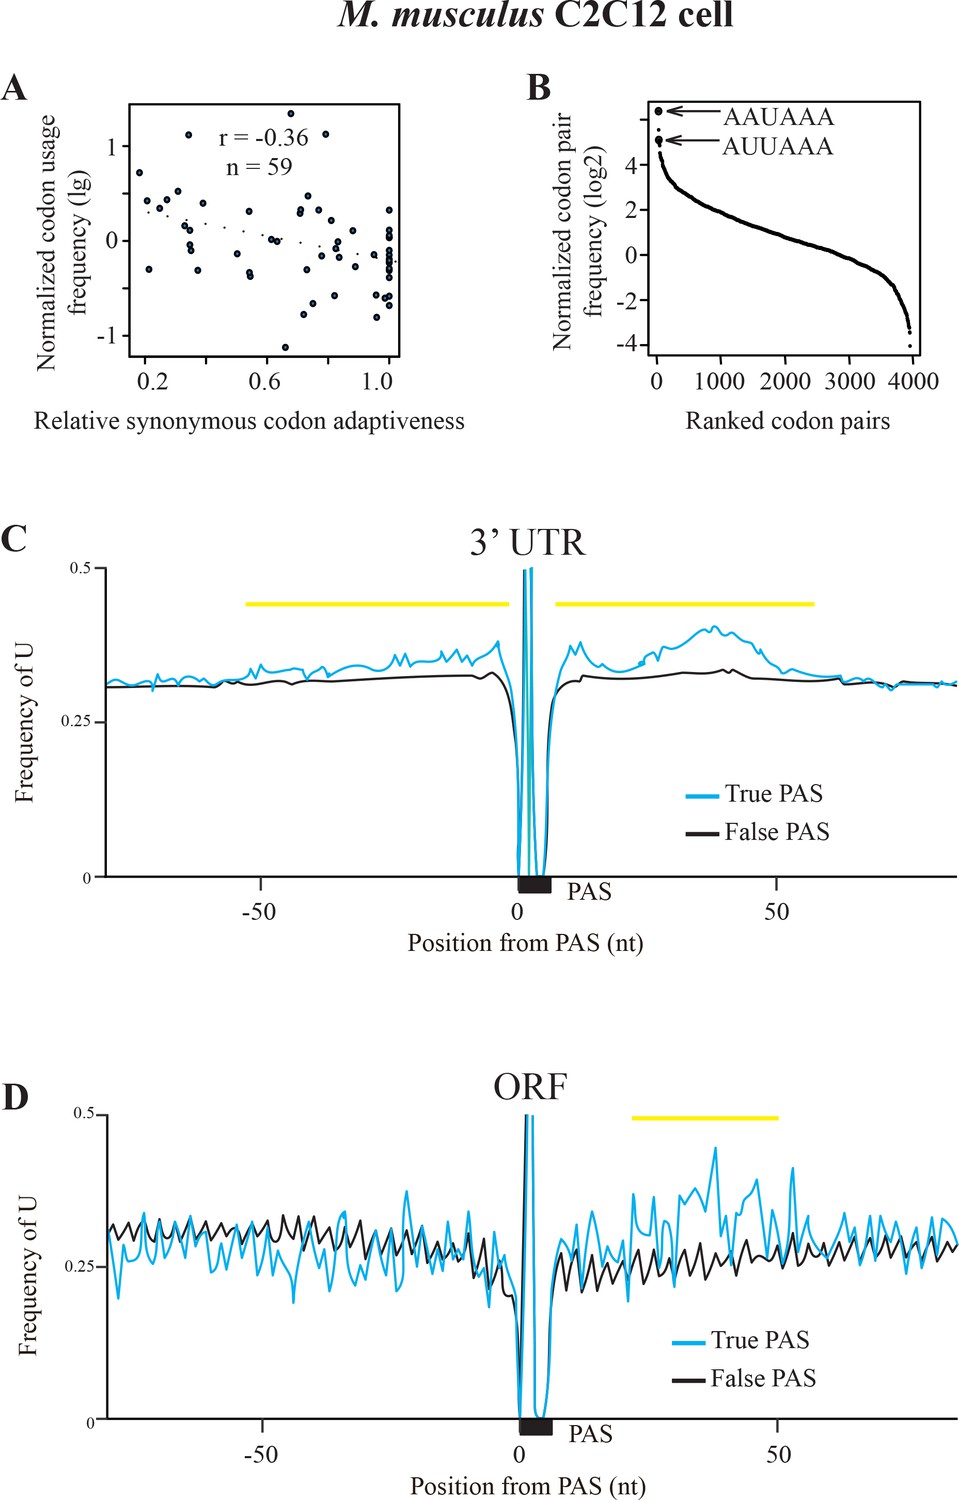
(A) Scatter plot showing the correlation between normalized codon usage frequency (NCUF) (log2) and relative synonymous codon adaptiveness (RSCA) of all codons with at least two synonymous codons in mouse. r = −0.36, p=0.0198, n = 59. (B) A graph showing the ranking of all codon pairs by normalized codon pair frequency values. PAS motifs AAUAAA and AUUAAA are ranked 1st and 3rd among all the codon pairs. (C–D) The nucleotide U content of surrounding PAS motifs in 3’ UTR (C) and the coding regions (D) in mouse are shown. 0 indicates the position of the first nucleotide of PAS, the black bar indicates the position of PAS motif, and the yellow lines indicate the regions shows different between True PAS and False PAS. A/U contents above 0.5 are not shown.
Tables
Key resources table
| Reagent type (species) or resource | Designation | Source or reference | Identifiers | Additional information |
|---|---|---|---|---|
| gene (Neurospora crassa) | frequencey (frq) | NA | NCBI Gene ID:3876095 | |
| gene (Neurospora crassa) | NCU09435 | NA | NCBI Gene ID:3874734 | |
| gene (Neurospora crassa) | NCU00931 | NA | NCBI Gene ID:3880910 | |
| strain (Neurospora crassa) | 4200 | PMID:155773 | Strain maintained in Yi Liu's lab | |
| strain (Neurospora crassa) | 303–3 (bd, frq10, his-3) | PMID:8052643 | ||
| strain (Neurospora crassa) | 301–6 (bd, his-3, A) | PMCID: PMC180927 | ||
| antibody | anti-FRQ | PMID:9150146 | Rabbit polyclonal; 1:50 for western blot | |
| antibody | anti-WC-2 | PMID: 11226160 | Rabbit polyclonal; 1:500 for ChIP | |
| antibody | Anti-RNA polymerase II CTD repeat YSPTSPS (phospho S2) antibody | abcam | ab5095 | Rabbit polyclonal; 1:500 for ChIP |
| antibody | Anti-H3K9me3 | Active Motif | catalog no:39161 | Rabbit polyclonal; 1:500 for ChIP |
| recombinant DNA reagent | pKAJ120 | PMID:8052643 | deoptimized frq gene; seeFigure 1—figure supplement 1 | |
| recombinant DNA reagent | frq-deopt1 | this paper | deoptimized frq gene; seeFigure 1—figure supplement 1 | |
| recombinant DNA reagent | frq-deopt2 | this paper | deoptimized frq gene; see Materials and methods | |
| recombinant DNA reagent | frq-deopt3 | this paper | deoptimized frq gene; see Materials and methods | |
| recombinant DNA reagent | frq-deopt4 | this paper | deoptimized frq gene; see Materials and methods | |
| recombinant DNA reagent | frq-deopt5 | this paper | deoptimized frq gene; see Materials and methods | |
| recombinant DNA reagent | frq-deopt6 | this paper | deoptimized frq gene; see Materials and methods | |
| recombinant DNA reagent | frq-deopt7 | this paper | deoptimized frq gene; see Materials and methods | |
| recombinant DNA reagent | frq-deopt4* | this paper | deoptimized frq gene; see Materials and methods | |
| recombinant DNA reagent | gfp-NCU09435-wt | this paper | wild-type NCU09435 gene in frame with gfp | |
| recombinant DNA reagent | gfp-NCU09435-opt | this paper | optimized NCU09435 gene; see Figure 5—figure supplement 1 | |
| recombinant DNA reagent | gfp-NCU02034-wt | this paper | wild-type NCU02034 gene in frame with gfp | |
| commercial assay or kit | SuperScript III Reverse Transcriptase | Thermo Fisher (Waltham, MA ) | catalog no:18080093 | For 3' RACE and making 2P-seq library |
| commercial assay or kit | TURBO DNA-free Kit | Thermo Fisher (Waltham, MA ) | catalog no: AM1907 | |
| commercial assay or kit | TOPO TA Cloning Kit, Dual promotor for in vitro Transcription | Thermo Fisher (Waltham, MA ) | catalog no: 452640 | |
| commercial assay or kit | Direct-zol RNA miniprep plus | Zymo research | catalog no: R2072 | |
| commercial assay or kit | CircLigase II ssDNA Ligase | Epicentre | catalog no: CL9021K | |
| software, algorithm | TopHat | http://ccb.jhu.edu/software/tophat/index.shtml | RRID:SCR_013035 | |
| software, algorithm | samtools | http://samtools.sourceforge.net/ | RRID:SCR_002105 | |
| software, algorithm | BEDTools | http://bedtools.readthedocs.io/en/latest/ | RRID:SCR_006646 | |
| software, algorithm | codonW | http://codonw.sourceforge.net/ | ||
| software, algorithm | Source code | this paper | scripts to analyze 2P-seq and 3’READS. Including eight steps: read processing, mapping, filtering and downstream analyses that create plot and figures. | |
| software, algorithm | raw sequencing data | this paper | PRJNA419320 | 2P-seq data, including two repeats from nuclear RNA extracts |
| software, algorithm | raw sequencing data | PMID:27401558 | GSE75753 | mouse poly(A)-seq data |
| software, algorithm | raw sequencing data | PMID:26765774 | GSE72574 | yeast poly(A)-seq data |
Additional files
-
Supplementary file 1
Strain list used in this study
- https://doi.org/10.7554/eLife.33569.018
-
Supplementary file 2
Primers used in this study
- https://doi.org/10.7554/eLife.33569.019
-
Transparent reporting form
- https://doi.org/10.7554/eLife.33569.020
Download links
A two-part list of links to download the article, or parts of the article, in various formats.
Downloads (link to download the article as PDF)
Open citations (links to open the citations from this article in various online reference manager services)
Cite this article (links to download the citations from this article in formats compatible with various reference manager tools)
Codon usage biases co-evolve with transcription termination machinery to suppress premature cleavage and polyadenylation
eLife 7:e33569.
https://doi.org/10.7554/eLife.33569


