Research: Adequate statistical power in clinical trials is associated with the combination of a male first author and a female last author
- University Medical Center Utrecht/Utrecht University, Netherlands
- VU University, Netherlands
- University Medical Center Utrecht/Utrecht University, The Netherlands
Figures
Figure 1
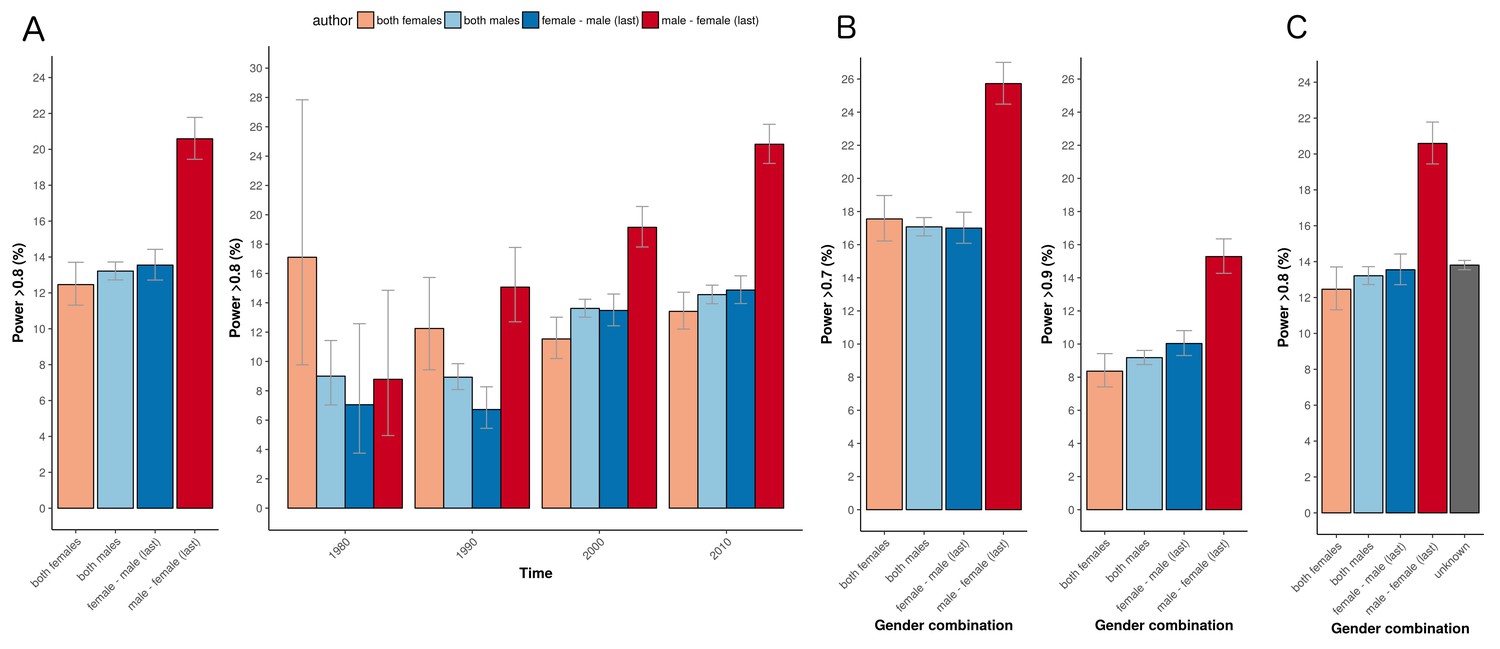
Percentage of adequately powered trials for the four different gender combinations of first and last author.
(A) Percentage of trials with power > 0.8 published between 1974 and 2017 for the four gender combinations (left panel) and for four periods (1975–1985; 1985–1995; 1995–2005; >2005) during this time (right panel). (B) Percentage of trials published with power > 0.7 (left) and power > 0.9 (right) for the four gender combinations. (C) Percentage of trials with power > 0.8 for the four gender combinations, including the trials were gender could not be determined for the first and/or last author (‘unknown’). Error bars represent the 95% confidence interval for proportions for all panels.
Figure 2
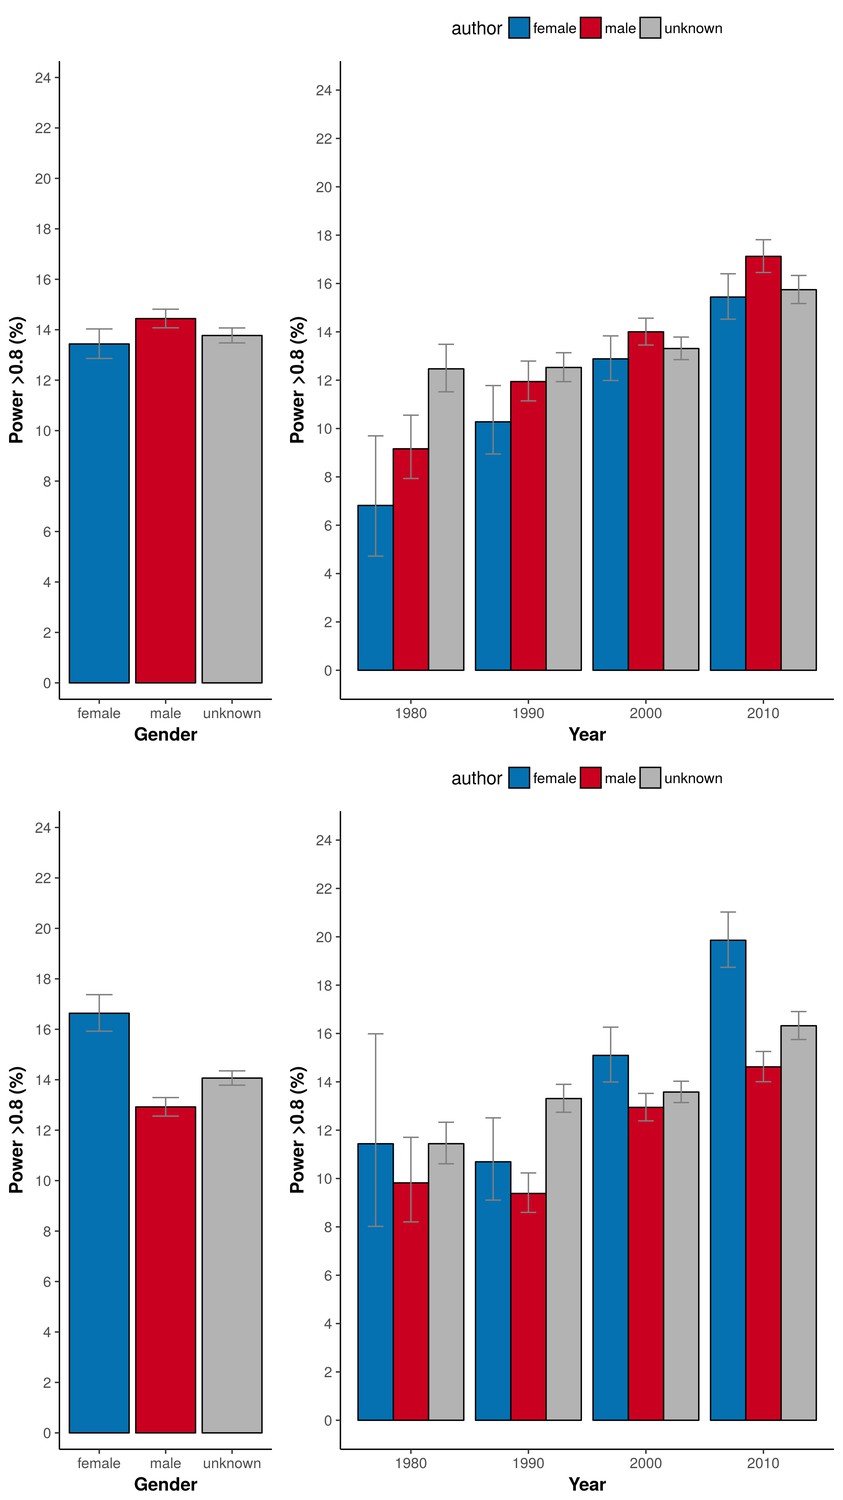
Percentage of adequately powered trials when the gender of the first and last author is male, female or unknown.
Left: Percentage of trials with power > 0.8 plotted for the gender of the first author (top) and the last author (bottom). Right: Percentage of trials with power > 0.8 plotted for four periods (1975–1985; 1985–1995; 1995–2005; >2005) for the gender of the first author (top) and the last author (bottom). Error bars represent the 95% confidence interval for proportions for all panels.
Figure 3
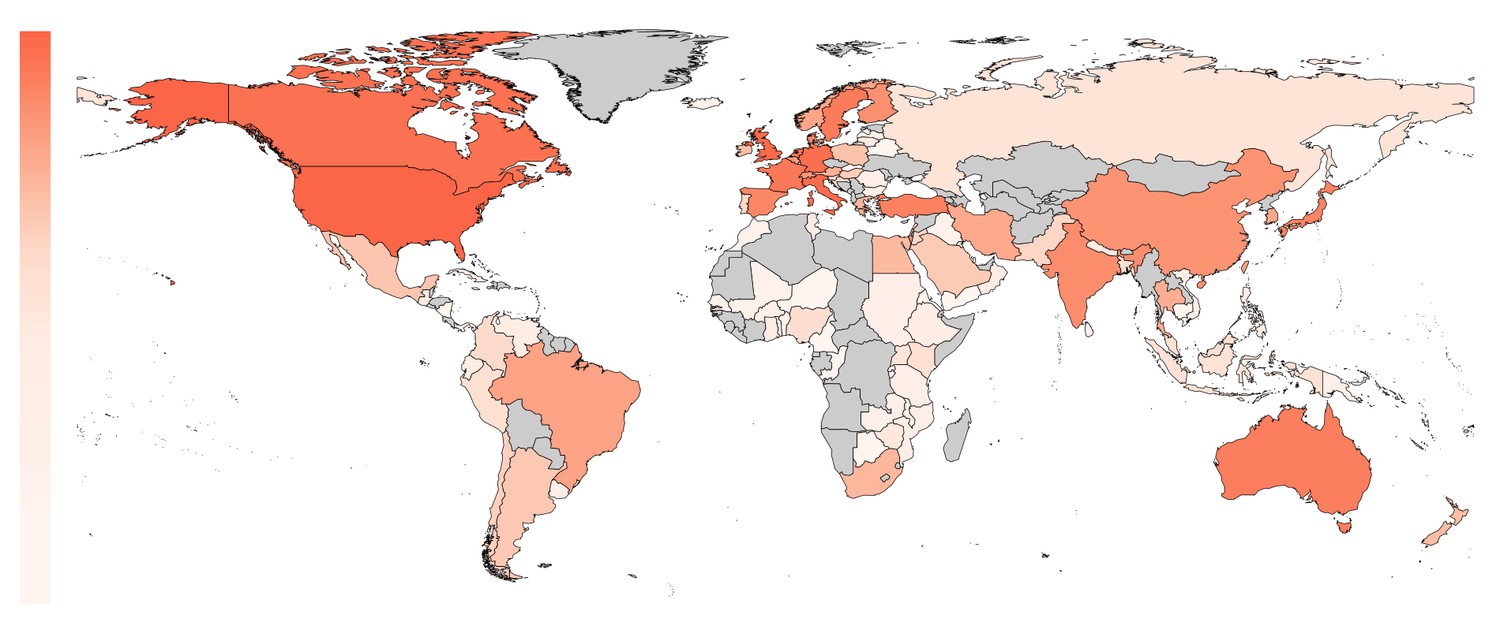
The proportion of included trials mapped per country on a white to red color scale (range: 0 – 24%).
The highest proportion of first authors were affiliated with an institution in the United States. Countries not present in any affiliation are plotted in gray.
Figure 4
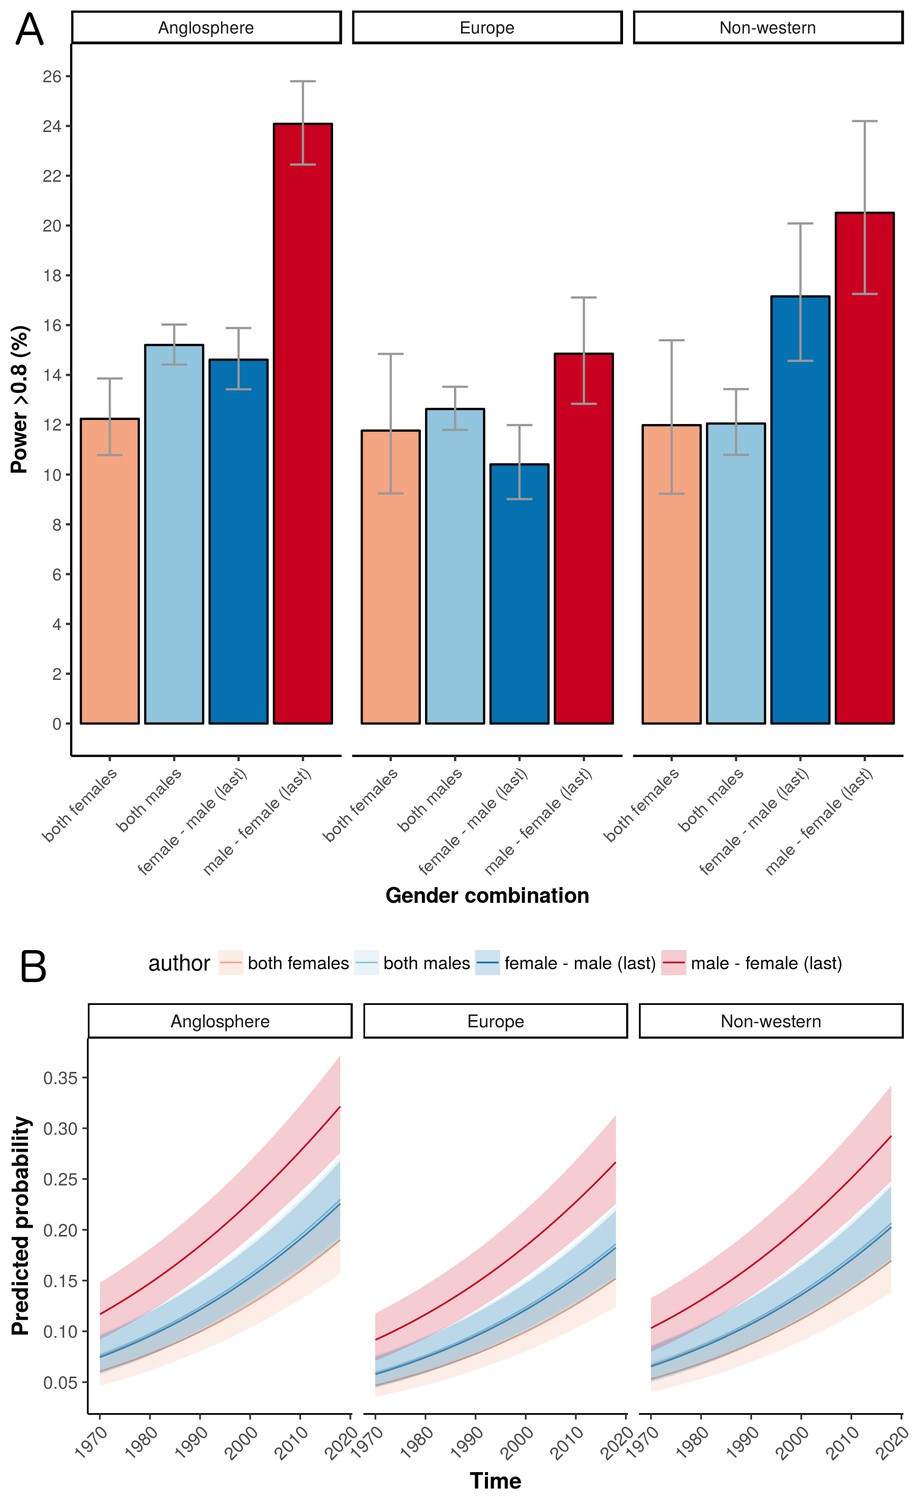
The influence of geography on the percentage of trials that are adequately powered.
(A) Percentage of trials with power > 0.8 for the four gender combinations of first and last author within the three country groups. Error bars represent the 95% confidence interval for proportions. (B) A logistic regression multivariable model (see "Data analysis and statistical model" below) can be used to predict the probability that a trial will have a power above a certain value. Here the predicted probabilities that trials will have power > 0.8 are plotted as a function of year for the four gender combinations in the three country groups. The predicted probabilities are averaged across medical disciplines and plotted as mean and 95% confidence intervals.
Figure 5

Percentage of adequately powered trials, for the four gender combinations of the first and the last author, within 21 major medical disciplines.
Error bars represent the 95% confidence interval for proportions.
Figure 6
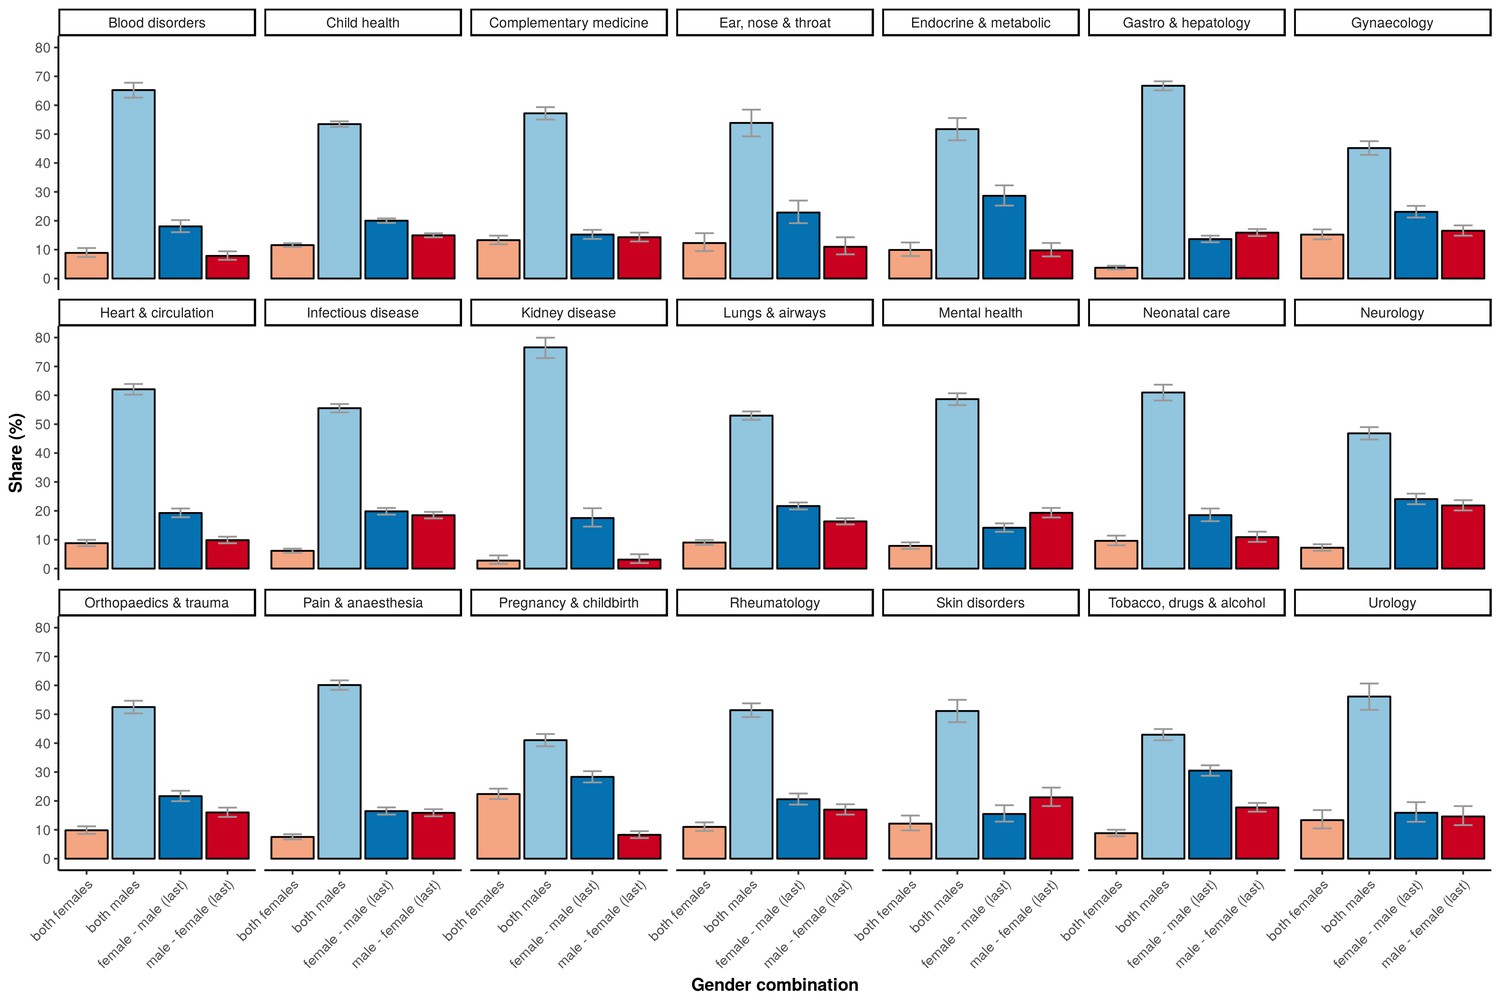
The percentage of the total number of trials underlying the four gender combinations within 21 major medical disciplines.
Error bars represent the 95% confidence interval for proportions.
Figure 7
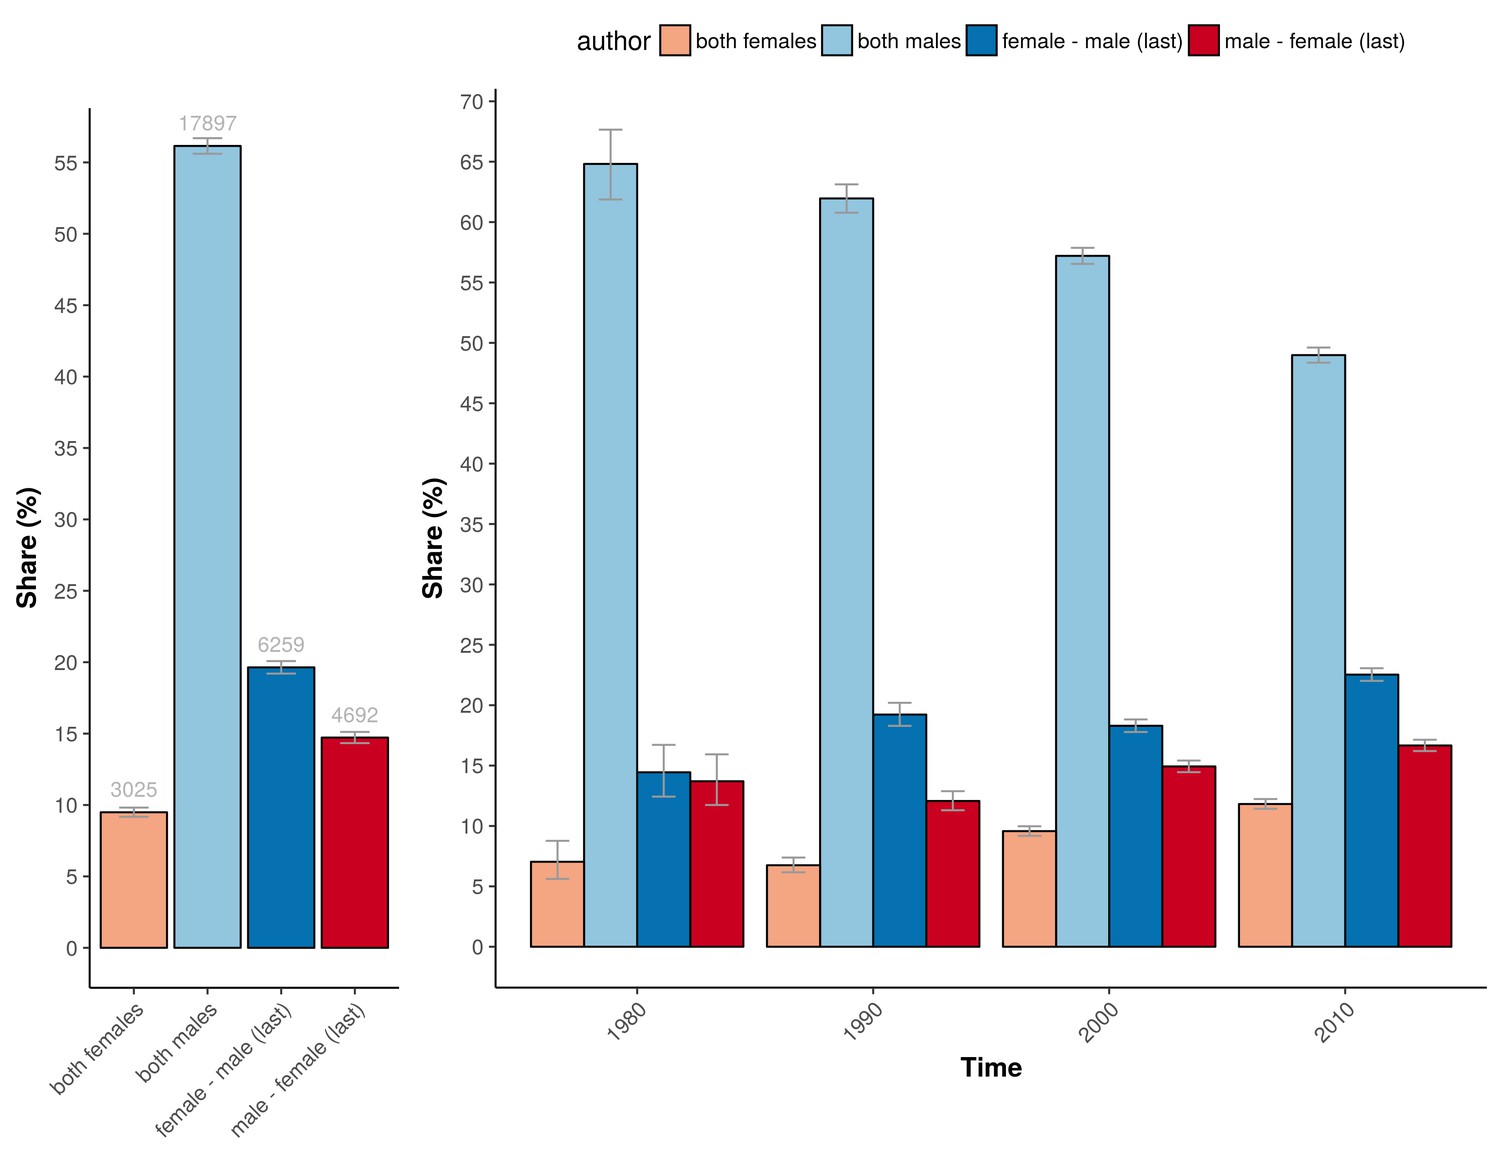
The percentage of trials for the different gender combinations and periods studied.
Left: The number and percentage of trials underlying the power calculations for the four gender combinations. Right: The corresponding percentage of the total number of trials underlying the four gender combinations for the four periods studied (1975–1985; 1985–1995; 1995–2005; >2005). Error bars represent the 95% confidence interval for proportions for both panels.
Figure 8
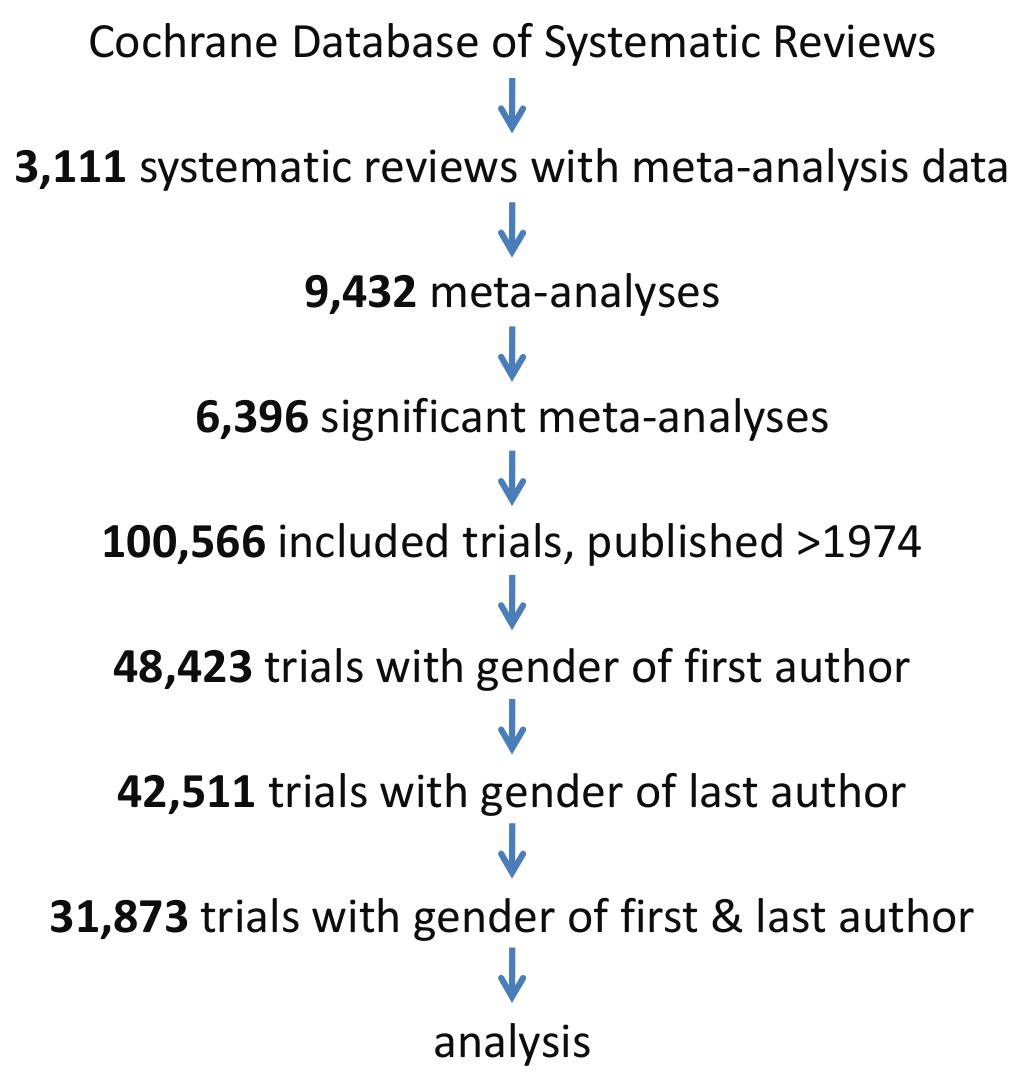
Flow diagram of the 31,873 trials selected for analysis.
Trials were analyzed if published after 1974, included in a significant meta-analysis in a systematic review and gender data was extractable for both the first and the last author.
Tables
Table 1
Model estimates for the variables fitted against adequately powered trials.
https://doi.org/10.7554/eLife.34412.004| Variables | Odds ratio | 95% CI | Z value | P value | |
|---|---|---|---|---|---|
| Author combination | |||||
| Both females | 1.00 (ref.) | ||||
| Both males | 1.28 | 1.17 | 1.41 | 5.22 | <0.0001 |
| Female - male (last) | 1.25 | 1.13 | 1.39 | 4.29 | <0.0001 |
| Male - female (last) | 2.08 | 1.87 | 2.30 | 13.94 | <0.0001 |
| Time | |||||
| Publication year | 1.03 | 1.02 | 1.03 | 12.05 | <0.0001 |
| Country group | |||||
| Anglosphere | 1.00 (ref.) | ||||
| Europe | 0.76 | 0.71 | 0.81 | 8.87 | <0.0001 |
| Non-western | 0.87 | 0.80 | 0.94 | 3.69 | <0.0001 |
| Medical discipline | |||||
| Allergy & intolerance | 1.00 (ref) | ||||
| Blood disorders | 0.45 | 0.34 | 0.62 | 5.11 | <0.0001 |
| Child health | 0.47 | 0.36 | 0.61 | 5.68 | <0.0001 |
| Complementary medicine | 0.23 | 0.17 | 0.31 | 9.14 | <0.0001 |
| Consumer strategies | 0.66 | 0.41 | 1.03 | 1.80 | 0.072 |
| Dentistry & oral health | 1.05 | 0.68 | 1.59 | 0.21 | 0.832 |
| Developmental problems | 0.69 | 0.47 | 1.00 | 1.98 | 0.048 |
| Ear, nose & throat | 0.37 | 0.24 | 0.55 | 4.77 | <0.0001 |
| Effective health systems | 0.75 | 0.53 | 1.07 | 1.57 | 0.115 |
| Endocrine & metabolic | 0.29 | 0.20 | 0.42 | 6.51 | <0.0001 |
| Eyes & vision | 0.56 | 0.38 | 0.81 | 3.02 | 0.003 |
| Gastroenterology & hepatology | 0.49 | 0.38 | 0.65 | 5.07 | <0.0001 |
| Genetic disorders | 0.19 | 0.12 | 0.30 | 7.09 | <0.0001 |
| Gynaecology | 0.69 | 0.52 | 0.92 | 2.58 | 0.01 |
| Health & safety at work | 0.24 | 0.13 | 0.42 | 4.74 | <0.0001 |
| Heart & circulation | 0.29 | 0.22 | 0.39 | 8.24 | <0.0001 |
| Infectious disease | 0.61 | 0.47 | 0.80 | 3.62 | <0.0001 |
| Kidney disease | 0.80 | 0.58 | 1.12 | 1.28 | 0.201 |
| Lungs & airways | 0.35 | 0.27 | 0.46 | 7.56 | <0.0001 |
| Mental health | 0.53 | 0.40 | 0.71 | 4.40 | <0.0001 |
| Neonatal care | 0.47 | 0.34 | 0.64 | 4.68 | <0.0001 |
| Neurology | 0.56 | 0.42 | 0.74 | 4.08 | <0.0001 |
| Orthopaedics & trauma | 0.79 | 0.60 | 1.05 | 1.63 | 0.103 |
| Pain & anaesthesia | 0.64 | 0.49 | 0.84 | 3.23 | 0.001 |
| Pregnancy & childbirth | 0.58 | 0.44 | 0.77 | 3.76 | <0.0001 |
| Public health | 1.23 | 0.78 | 1.92 | 0.89 | 0.372 |
| Rheumatology | 0.75 | 0.57 | 1.00 | 2.02 | 0.043 |
| Skin disorders | 0.89 | 0.65 | 1.23 | 0.69 | 0.488 |
| Tobacco, drugs & alcohol | 0.34 | 0.26 | 0.46 | 7.39 | <0.0001 |
| Urology | 1.04 | 0.74 | 1.45 | 0.21 | 0.834 |
| Wounds | 0.36 | 0.21 | 0.61 | 3.73 | <0.0001 |
Table 2
Model estimates from the sensitivity analysis (with individual countries) for the variables fitted against adequately powered trials.
https://doi.org/10.7554/eLife.34412.005| Variables | Odds ratio | 95% CI | Z value | P value | |
|---|---|---|---|---|---|
| Author combination | |||||
| Both females | 1.00 (ref.) | ||||
| Both males | 1.25 | 1.13 | 1.37 | 4.58 | <0.001 |
| Female - male (last) | 1.19 | 1.07 | 1.32 | 3.28 | 0.001 |
| Male - female (last) | 1.98 | 1.78 | 2.19 | 12.95 | <0.001 |
| Time | |||||
| Publication year | 1.02 | 1.02 | 1.03 | 14.5 | <0.001 |
| Country | |||||
| Argentina | 1.00 (ref.) | ||||
| Australia | 0.79 | 0.52 | 1.19 | 1.12 | 0.261 |
| Austria | 1.31 | 0.84 | 2.02 | 1.19 | 0.232 |
| Bangladesh | 3.29 | 2.00 | 5.41 | 4.69 | <0.001 |
| Belgium | 0.94 | 0.61 | 1.45 | 0.29 | 0.775 |
| Brazil | 0.98 | 0.63 | 1.51 | 0.10 | 0.92 |
| Canada | 1.16 | 0.78 | 1.72 | 0.72 | 0.474 |
| Chile | 0.74 | 0.39 | 1.42 | 0.89 | 0.371 |
| China | 1.20 | 0.8 | 1.81 | 0.87 | 0.383 |
| Colombia | 1.95 | 1.17 | 3.26 | 2.55 | 0.011 |
| Costa Rica | 0.00 | 0.00 | Inf | 0.14 | 0.891 |
| Croatia | 0.47 | 0.22 | 1.03 | 1.88 | 0.06 |
| Czech Republic | 0.71 | 0.45 | 1.13 | 1.45 | 0.147 |
| Denmark | 1.24 | 0.82 | 1.87 | 1.03 | 0.303 |
| Egypt | 1.78 | 1.13 | 2.79 | 2.50 | 0.013 |
| Finland | 0.88 | 0.58 | 1.32 | 0.63 | 0.527 |
| France | 0.91 | 0.61 | 1.37 | 0.44 | 0.663 |
| Gambia | 1.05 | 0.56 | 1.99 | 0.16 | 0.87 |
| Germany | 0.90 | 0.6 | 1.34 | 0.53 | 0.593 |
| Ghana | 0.84 | 0.48 | 1.48 | 0.61 | 0.544 |
| Greece | 0.46 | 0.29 | 0.75 | 3.12 | 0.002 |
| Hong Kong | 1.37 | 0.89 | 2.11 | 1.44 | 0.15 |
| Hungary | 2.87 | 1.75 | 4.7 | 4.18 | <0.001 |
| India | 0.89 | 0.58 | 1.35 | 0.56 | 0.573 |
| Indonesia | 0.71 | 0.34 | 1.48 | 0.93 | 0.354 |
| Iran | 1.14 | 0.73 | 1.79 | 0.59 | 0.557 |
| Ireland | 0.80 | 0.49 | 1.32 | 0.87 | 0.387 |
| Israel | 0.80 | 0.51 | 1.26 | 0.98 | 0.328 |
| Italy | 1.03 | 0.69 | 1.53 | 0.15 | 0.881 |
| Japan | 0.35 | 0.22 | 0.53 | 4.83 | <0.001 |
| Jordan | 3.91 | 2.09 | 7.32 | 4.27 | <0.001 |
| Kenya | 0.42 | 0.18 | 1.00 | 1.97 | 0.049 |
| Korea | 1.56 | 1.02 | 2.39 | 2.07 | 0.038 |
| Lebanon | 1.36 | 0.75 | 2.46 | 1.01 | 0.311 |
| Malawi | 0.12 | 0.03 | 0.52 | 2.83 | 0.005 |
| Malaysia | 0.78 | 0.34 | 1.79 | 0.59 | 0.552 |
| Mali | 0.75 | 0.29 | 1.91 | 0.61 | 0.543 |
| Mexico | 1.07 | 0.62 | 1.85 | 0.25 | 0.8 |
| Netherlands | 0.71 | 0.47 | 1.07 | 1.62 | 0.106 |
| New Zealand | 1.28 | 0.76 | 2.14 | 0.94 | 0.349 |
| Nigeria | 1.32 | 0.70 | 2.48 | 0.87 | 0.386 |
| Norway | 0.89 | 0.56 | 1.41 | 0.49 | 0.624 |
| Pakistan | 0.93 | 0.48 | 1.83 | 0.20 | 0.844 |
| Papua New Guinea | 0.00 | 0.00 | Inf | 0.10 | 0.918 |
| Peru | 0.99 | 0.57 | 1.7 | 0.04 | 0.967 |
| Poland | 0.39 | 0.22 | 0.68 | 3.29 | 0.001 |
| Portugal | 3.17 | 1.84 | 5.45 | 4.17 | <0.001 |
| Qatar | 0.00 | 0.00 | Inf | 0.11 | 0.916 |
| Saudi Arabia | 0.54 | 0.30 | 0.98 | 2.02 | 0.043 |
| Singapore | 1.14 | 0.68 | 1.93 | 0.50 | 0.614 |
| Slovenia | 0.00 | 0.00 | Inf | 0.11 | 0.91 |
| South Africa | 1.24 | 0.79 | 1.96 | 0.93 | 0.355 |
| Spain | 1.08 | 0.71 | 1.62 | 0.35 | 0.73 |
| Sweden | 1.24 | 0.83 | 1.85 | 1.03 | 0.301 |
| Switzerland | 0.66 | 0.43 | 1.02 | 1.89 | 0.059 |
| Taiwan | 0.45 | 0.29 | 0.71 | 3.43 | 0.001 |
| Thailand | 1.53 | 0.99 | 2.37 | 1.93 | 0.053 |
| Turkey | 0.64 | 0.42 | 0.98 | 2.06 | 0.039 |
| Uganda | 1.27 | 0.56 | 2.88 | 0.58 | 0.56 |
| UK | 1.25 | 0.84 | 1.85 | 1.10 | 0.273 |
| USA | 1.42 | 0.96 | 2.10 | 1.78 | 0.076 |
| Venezuela | 5.25 | 3.22 | 8.54 | 6.67 | <0.001 |
| Vietnam | 0.00 | 0.00 | Inf | 0.12 | 0.907 |
| Zimbabwe | 1.93 | 0.90 | 4.12 | 1.70 | 0.089 |
| Other countries | 0.75 | 0.48 | 1.17 | 1.28 | 0.201 |
| Medical discipline | |||||
| Allergy & intolerance | 1.00 (ref.) | ||||
| Blood disorders | 0.49 | 0.39 | 0.63 | 5.79 | <0.001 |
| Child health | 0.55 | 0.45 | 0.67 | 5.87 | <0.001 |
| Complementary medicine | 0.26 | 0.20 | 0.33 | 11.21 | <0.001 |
| Consumer strategies | 0.94 | 0.66 | 1.34 | 0.35 | 0.73 |
| Dentistry & oral health | 1.43 | 1.07 | 1.92 | 2.41 | 0.016 |
| Developmental problems | 0.78 | 0.58 | 1.05 | 1.64 | 0.101 |
| Ear, nose & throat | 0.51 | 0.39 | 0.68 | 4.66 | <0.001 |
| Effective health systems | 0.85 | 0.63 | 1.14 | 1.11 | 0.269 |
| Endocrine & metabolic | 0.4 | 0.30 | 0.53 | 6.58 | <0.001 |
| Eyes & vision | 0.51 | 0.38 | 0.70 | 4.27 | <0.001 |
| Gastroenterology & hepatology | 0.56 | 0.46 | 0.69 | 5.41 | <0.001 |
| Genetic disorders | 0.29 | 0.20 | 0.42 | 6.51 | <0.001 |
| Gynaecology | 0.82 | 0.66 | 1.01 | 1.84 | 0.066 |
| Health & safety at work | 0.54 | 0.37 | 0.79 | 3.16 | 0.002 |
| Heart & circulation | 0.34 | 0.27 | 0.43 | 9.43 | <0.001 |
| Infectious disease | 0.8 | 0.65 | 0.99 | 2.09 | 0.036 |
| Kidney disease | 0.71 | 0.55 | 0.92 | 2.59 | 0.01 |
| Lungs & airways | 0.47 | 0.38 | 0.58 | 7.04 | <0.001 |
| Mental health | 0.6 | 0.48 | 0.75 | 4.58 | <0.001 |
| Neonatal care | 0.38 | 0.29 | 0.48 | 7.81 | <0.001 |
| Neurology | 0.7 | 0.57 | 0.87 | 3.26 | 0.001 |
| Orthopaedics & trauma | 1.18 | 0.96 | 1.46 | 1.56 | 0.12 |
| Pain & anaesthesia | 0.73 | 0.60 | 0.90 | 2.92 | 0.003 |
| Pregnancy & childbirth | 0.69 | 0.55 | 0.85 | 3.40 | 0.001 |
| Public health | 1.72 | 1.24 | 2.37 | 3.27 | 0.001 |
| Rheumatology | 0.97 | 0.78 | 1.20 | 0.31 | 0.757 |
| Skin disorders | 1.26 | 0.99 | 1.59 | 1.89 | 0.058 |
| Tobacco. drugs & alcohol | 0.4 | 0.32 | 0.50 | 7.97 | <0.001 |
| Urology | 1.27 | 1.00 | 1.63 | 1.92 | 0.054 |
| Wounds | 0.8 | 0.59 | 1.08 | 1.44 | 0.15 |
Download links
A two-part list of links to download the article, or parts of the article, in various formats.
Downloads (link to download the article as PDF)
Open citations (links to open the citations from this article in various online reference manager services)
Cite this article (links to download the citations from this article in formats compatible with various reference manager tools)
Research: Adequate statistical power in clinical trials is associated with the combination of a male first author and a female last author
eLife 7:e34412.
https://doi.org/10.7554/eLife.34412


