Regenerating hair cells in vestibular sensory epithelia from humans
- University College London, United Kingdom
- Imperial College London, United Kingdom
- Boston Children's Hospital, United States
Figures
Figure 1

Undamaged utricular maculae.
(A–C) Fixed immediately after harvesting. (D) After 28 days in explant culture. (A) Hair cells labelled for myosin VIIa (red) are distributed over the entire utricle. Phalloidin labels actin (green) at the intercellular junctions at the luminal surface of the epithelium. Many of the junction-associated actin bands are quite wide, but others, mainly where hair cells have been lost, are thin. Scale bar: 50 µm. (B) SEM shows organised hair bundles of hair cells and surfaces of intervening supporting cells. Scale bar: 5 µm. (C) Hair cells do not contact the basement membrane underlying the epithelium and their nuclei are at a level above that of supporting cells, which are in contact with the basement membrane. Neuronal elements have rapidly died away from the hair cells. Scale bars: 5 µm. (D) Undamaged utricle maintained in explant culture for 28 days. Hair cells labelled for myosin VIIa (red) are distributed across the entire epithelium. Scale bar: 25 µm.
Figure 2
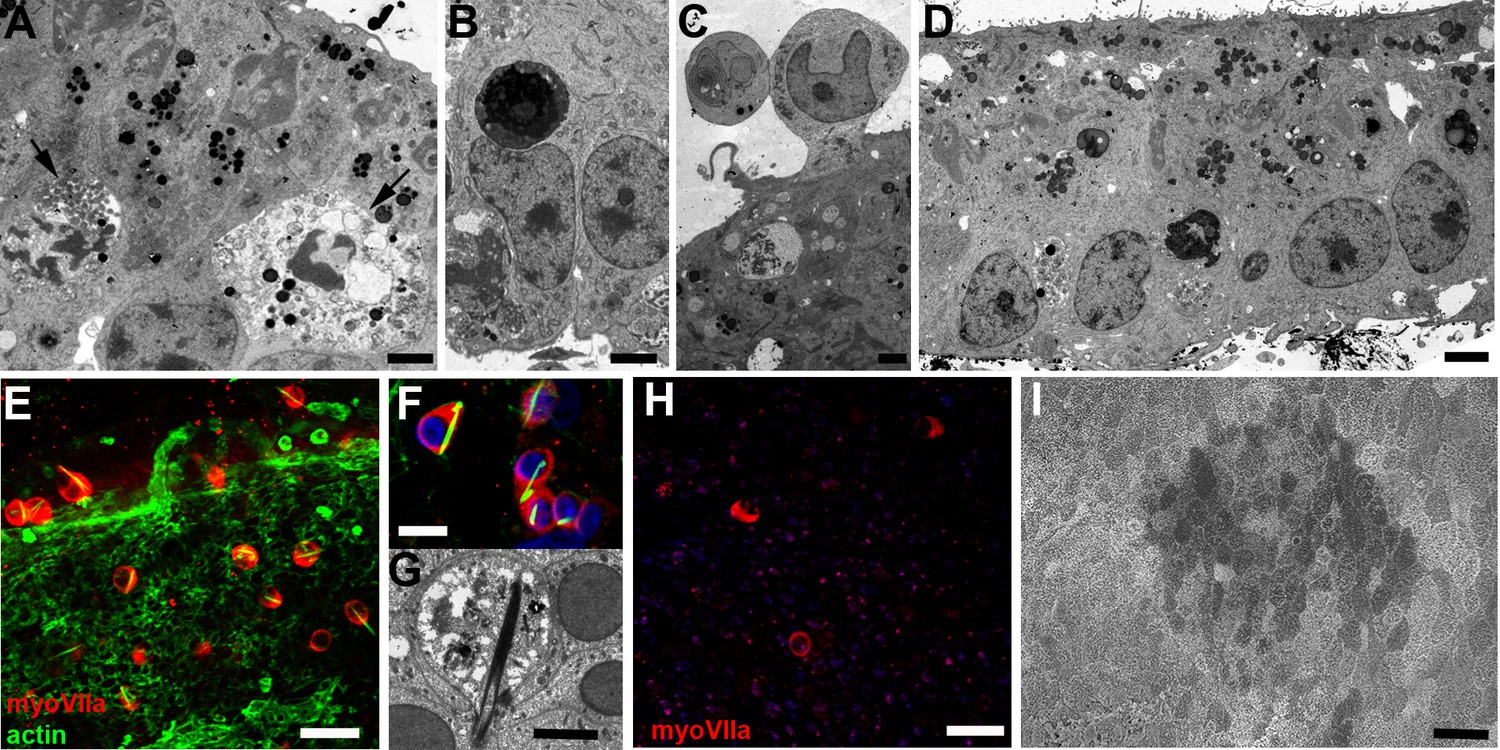
Hair cell loss in utricular maculae following incubation in gentamicin.
(A) Hair cells undergoing apoptosis (arrows), indicated by the condensed marginated chromatin in their nuclei, at 24 hr after incubation in gentamicin. Scale bar: 2 µm. (B) Apoptotic body inside a supporting cell at 24 hr after incubation with gentamicin. Scale bar: 2 µm. (C) Hair cells in the process of extrusion from the sensory epithelium at 24 hr after incubation in gentamicin. Supporting cells below the extruding hair cell have formed tight junctions to close the space that the hair cell is vacating. Scale bar: 2 µm. (D) Four days after the end of incubation with gentamicin, few hair cell bodies are evident within the epithelium. Scale bar: 5 µm. (E) 2 days after incubation with gentamicin, remaining hair cells labelled for myosin VIIa (red) are almost all rounded in shape and enclose a phalloidin-labelled rod-like inclusion (green). Scale bar: 25 µm. (F) Rod-like inclusions composed of actin (labelled with phalloidin, green) are present in almost all remaining hair cells (labelled for myosin VIIa, red) at 24 hr after incubation with gentamicin. Nuclei labelled with DAPI (blue). Scale bar: 10 µm. (G) Thin section reveals rod-like inclusion composed of densely packed filaments in degenerating hair cell at 24 hr after incubation with gentamicin. Scale bar: 2 µm. (H) 21 days after incubation with gentamicin very few cells that label for myosin VIIa remain. Scale bar: 25 µm. (I) SEM of apical surface of utricle 21 days after incubation with gentamicin. There are no hair bundles or other obvious surface specialisations. The surfaces of almost all cells are relatively smooth, with variable numbers of short dispersed microvilli, and have a polygonal profile, characteristics of the apical surfaces of supporting cells in regions where hair cells have been lost. Scale bar: 20 µm.
Figure 3
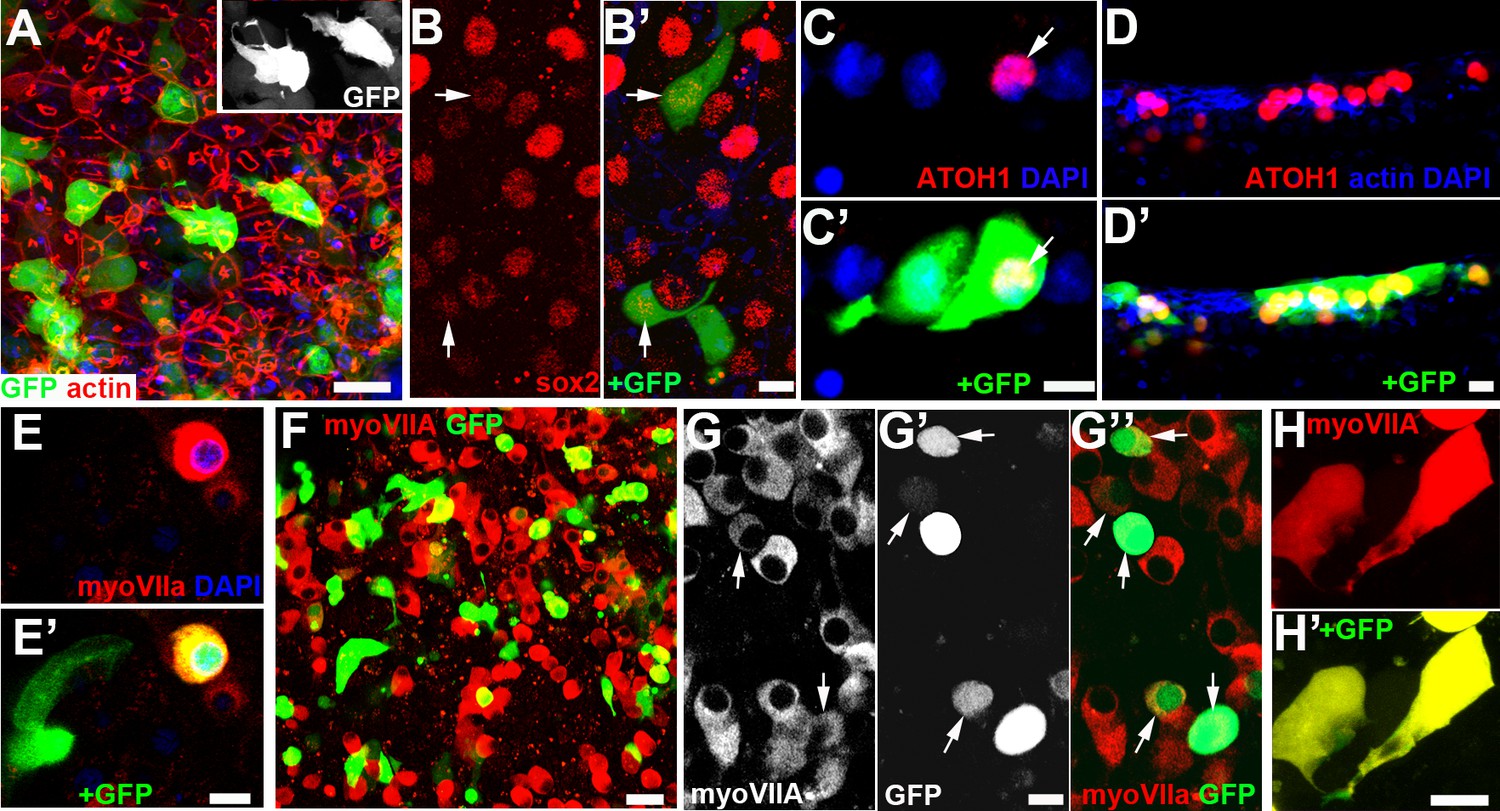
Sensory epithelia transduced with ATOH1 and GFP after incubation with gentamicin.
(A) GFP expression 2 days after transduction. Many supporting cells express GFP which delineates cell shape revealing several cells with thin, basally directed extensions (inset). Scale bar 20 µm. (B) Labelling for SOX2 (red), and B’) SOX2 and GFP expression, 2 days after transduction. Arrows indicate nuclei labelled for SOX2 (B) inside cells that express GFP (B’). Scale bar: 10 µm. (C) Frozen section. Labelling for ATOH1(red) and C’) ATOH1 with GFP expression in utricular macula 5 days after transduction. Arrows indicate nucleus labelled for ATOH1 (C) in cell that expresses GFP (C’). Adjacent cell, with basally directed extension expresses GFP but the nucleus does not label for ATOH1. Scale bar: 10 µm. (D) Frozen section. Labelling for ATOH1(red) and D’) ATOH1 with GFP expression in crista 5 days after transduction. Several cells whose nuclei label for ATOH1 also express GFP, but there are also cells with ATOH1 +nuclei which do not express GFP. Phalloidin-labelled actin, as well as DAPI to label nuclei, is in the blue channel to label the intercellular junctions as orientation for identification of the luminal surface of the epithelium. Scale bar: 10 µm. (E) Myosin VIIa (red) labels cell that also expresses GFP (E’). Adjacent cell, with morphological characteristics of supporting cell, expresses GFP but not Myosin VIIa. Scale bar: 10 µm. (F) 18 days after transduction, many cells label for Myosin VIIa (red). Scale Bar: 20 µm. (G) Myosin VIIa labelling, (G’) GFP expression, (G’’) Merge of myosin VIIA labelling (red) and GFP at 18 days post transduction. Arrows indicate some cells expressing GFP that label for myosin VIIa. The intensity of labelling for myosin VIIa and the level of expression of GFP vary. Myosin VIIa labelled cells often clustered together and appear to be in contact. Scale bar: 10 µm. (H, H’) Some cells at 18 days after transduction that are labelled for myosin VIIa (H) and also express GFP (H’) have thin basally extended projections. Scale bar: 10 µm.
Figure 4
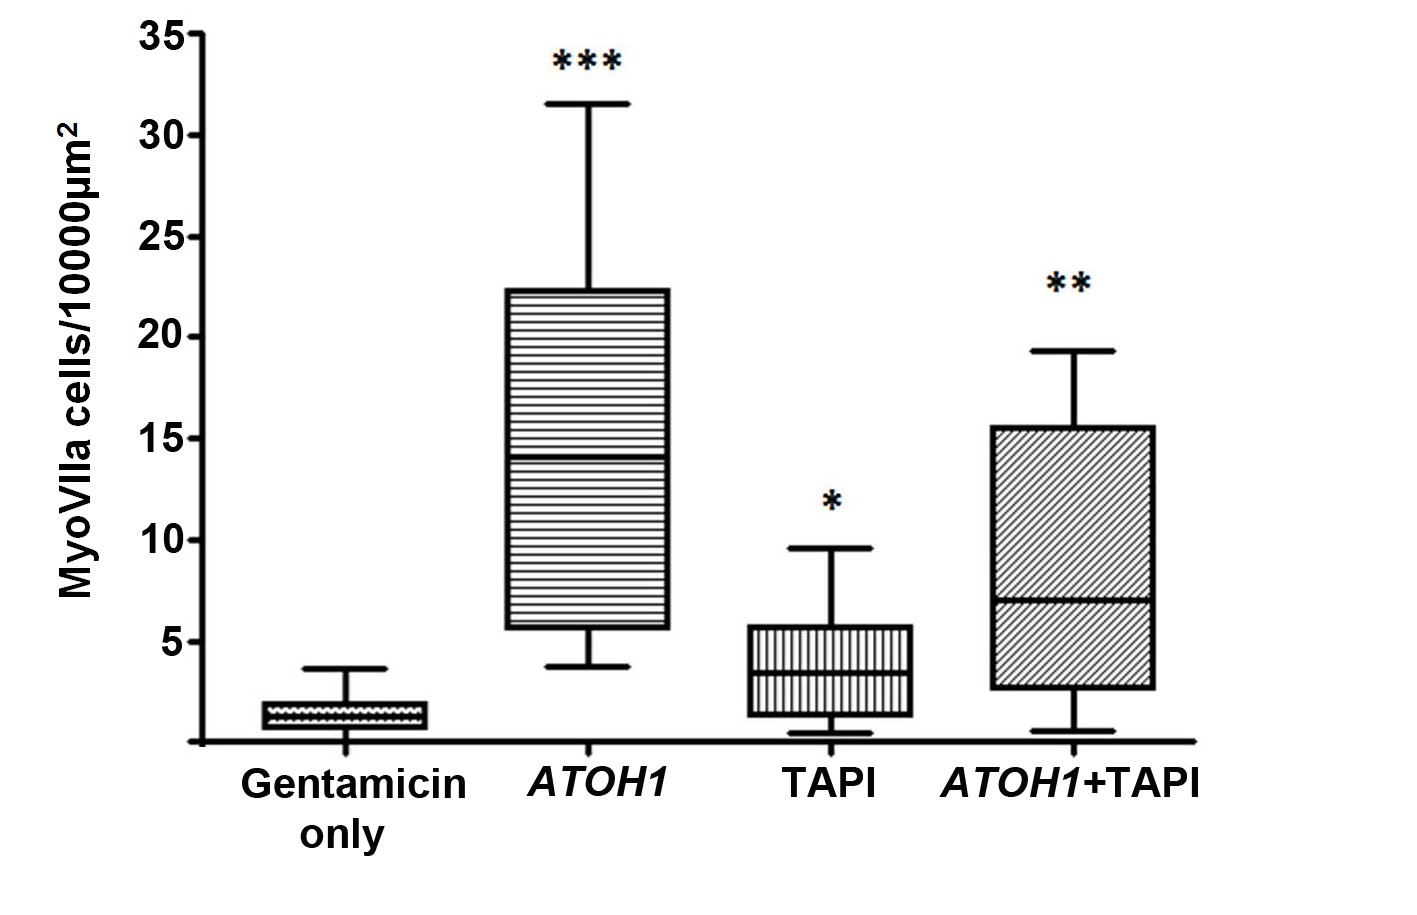
Numbers of myosin VIIa positive cells per unit area.
Number of labelled cells (25%–75% percentiles and maximum-minimum) in utricles following 48 hr incubation in gentamicin then maintained up to 28 days with no further treatment (Gentamicin only, control tissue N = 11); 18 days after transduction with ATOH1 (N = 7); maintained 18 days in medium containing TAPI1 (N = 7); transduced with ATOH1 and maintained 18 days in medium containing TAPI1 (N = 6). Asterisks indicate significant difference in the numbers of myosin VIIa positive cells in each treatment condition compared to the gentamicin only control.
Figure 5
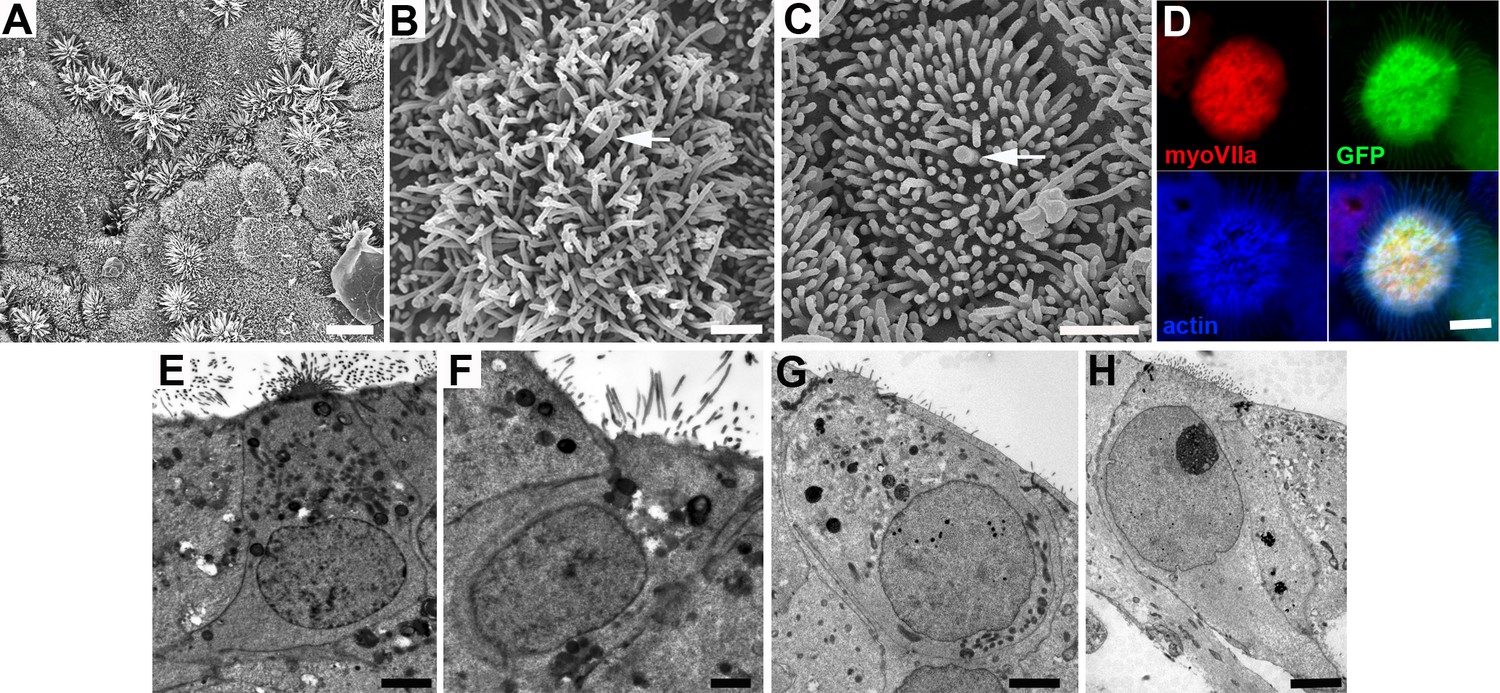
Morphological characteristics of cells in utricles 18 days after transduction with ATOH1.
(A) Many cells across the epithelium bear elongated microvillar-like projections from their apical surface. Scale bar: 5 µm. (B, C) Cells with dense cluster of apical projections possess a single thicker, kinocilium-like projection from the centre of the cell surface (arrowed). Scale bars: 1 µm. (D) Thin projections on cells expressing myosin VIIa (red) and GFP contain actin (blue). Scale bar: 2 µm. (E,F) Thin sections of cells in utricle in which SEM showed cells with dense clusters of apical projections in panel A, and (G,H) in a utricle that showed large numbers of myosin VIIa labelled cells after immunolabelling similar to the utricle shown in Figure 3 panel F. In cells with numerous, microvillar projections, nuclei are located towards the apical (luminal) surface and have approximately cylindrical cell bodies, similar to hair cells, but some (panels E and H) have thinning basal extensions, reminiscent of supporting cells converting to hair cells. Scale Bars: 2 µm.
Figure 6
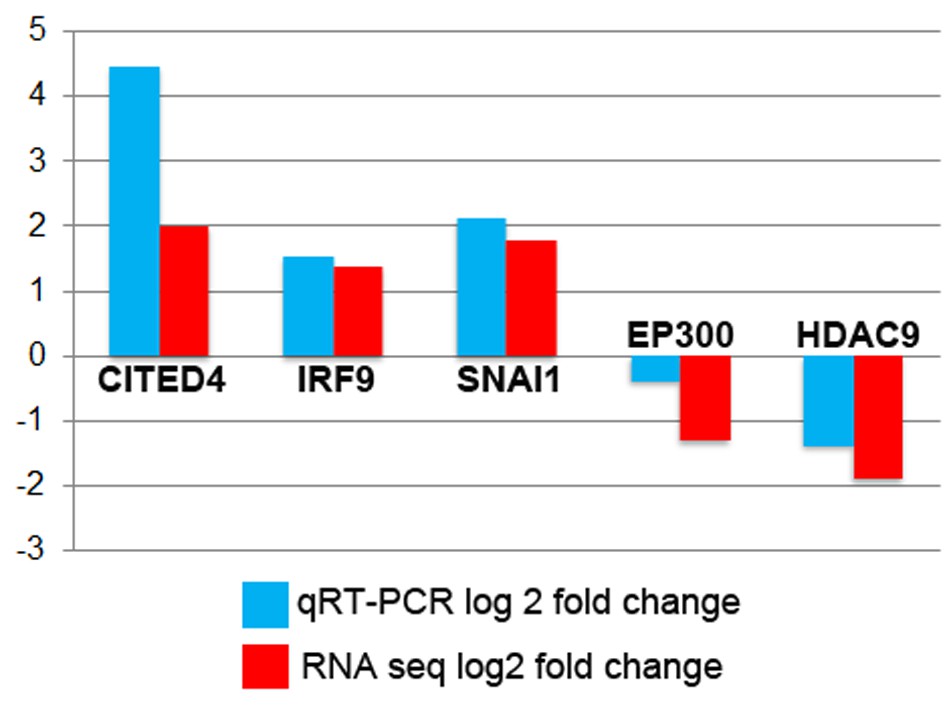
Average RQ values in Log2 fold-change for ATOH1 treated versus controls from Taqman (blue) compared to Log2 fold-change measured by RNA-seq (red).
https://doi.org/10.7554/eLife.34817.008Tables
Table 1
Transcription factors and chromatin modifiers that exhibit significant changes in gene expression upon Atoh1 transduction into human sensory epithelia.
The left column lists gene names followed by gene descriptions. AB T is the average transcript abundance in the Atoh1 treated samples (as FPKMs). AB C is the average abundance in the control samples. LOG2 is the log base2 fold change of Atoh1 transfected compared to the controls. FUNCT indicates whether a given gene is a transcription factor (TF) or a chromatin modifier (CM). Names in bold are genes that show a > 2 fold change in expression (and p<0.05) across all three comparisons (they are part of the 441 differentially expressed genes, see Materials and methods and Results). Genes in plain text show statistically significant changes in all comparisons, but only pass >2 fold in at least one comparison.
| GENE | Description | Ab T | Ab C | LOG2 | Funct |
|---|---|---|---|---|---|
| ATOH1 | atonal bHLH transcription factor 1 | 37.8 | 0.3 | 6.9 | TF |
| RAX | retina and anterior neural fold homeobox | 0.7 | 0.1 | 2.5 | TF |
| ZNF296 | zinc finger protein 296 | 17.1 | 3.0 | 2.5 | TF |
| POU4F3 | POU class 4 homeobox 3 | 3.4 | 0.8 | 2.1 | TF |
| CITED4 | Cbp/p300 interacting transactivator | 56.6 | 13.7 | 2.0 | TF |
| GTF2IRD2 | GTF2I repeat domain containing 2 | 2.7 | 0.7 | 2.0 | TF |
| SNAI1 | snail family transcriptional repressor 1 | 30.7 | 8.9 | 1.8 | TF |
| ZNF775 | zinc finger protein 775 | 17.8 | 5.9 | 1.6 | TF |
| MEF2B | myocyte enhancer factor 2B | 2.1 | 0.7 | 1.6 | TF |
| SOX12 | SRY-box 12 | 10.1 | 3.6 | 1.5 | TF |
| ZNF784 | zinc finger protein 784 | 3.7 | 1.3 | 1.4 | TF |
| ZNF837 | zinc finger protein 837 | 1.8 | 0.7 | 1.4 | TF |
| IRF9 | interferon regulatory factor 9 | 137.3 | 53.5 | 1.4 | TF |
| ZNF692 | zinc finger protein 692 | 36.7 | 15.1 | 1.3 | TF |
| GTF2H3 | general transcription factor IIH subunit 3 | 9.3 | 21.5 | −1.2 | TF |
| ZNF382 | zinc finger protein 382 | 0.9 | 2.2 | −1.2 | TF |
| EP300 | E1A binding protein p300 | 10.9 | 26.3 | −1.3 | CM |
| ZFHX4 | zinc finger homeobox 4 | 1.0 | 2.4 | −1.3 | TF |
| ASH1L | ASH1 like histone lysine methyltransfer | 5.1 | 12.8 | −1.3 | CM |
| ATRX | ATRX, chromatin remodeler | 7.0 | 22.4 | −1.7 | CM |
| SATB2 | SATB homeobox 2 | 0.8 | 3.0 | −1.9 | TF/CM |
| HDAC9 | histone deacetylase 9 | 5.7 | 20.9 | −1.9 | CM |
| TCF19 | transcription factor 19 | 0.7 | 0.2 | 1.8 | TF |
| HES1 | hes family bHLH transcription factor 1 | 78.1 | 24.1 | 1.7 | TF |
| ZNF467 | zinc finger protein 467 | 4.3 | 1.5 | 1.5 | TF |
| GSC | goosecoid homeobox | 0.8 | 0.3 | 1.5 | TF |
| SALL1 | spalt like transcription factor 1 | 9.7 | 3.9 | 1.3 | TF |
| KCNIP3 | potassium voltage-gated channel protein 3 | 10.1 | 4.3 | 1.3 | TF |
| THAP3 | THAP domain containing 3 | 30.6 | 13.2 | 1.2 | TF |
| MSX1 | msh homeobox 1 | 8.4 | 3.7 | 1.2 | TF |
| SCAND1 | SCAN domain containing 1 | 58.9 | 26.8 | 1.1 | TF |
| ING2 | inhibitor of growth family member 2 | 13.2 | 6.1 | 1.1 | CM |
| MLXIP | MLX interacting protein | 8.8 | 4.2 | 1.1 | TF |
| ZNF652 | zinc finger protein 652 | 11.4 | 5.7 | 1.0 | TF |
| PATZ1 | POZ/BTB and AT hook containing zincfinger | 18.1 | 9.3 | 1.0 | TF/CM |
| RARG | retinoic acid receptor gamma | 18.0 | 9.2 | 1.0 | TF |
| GLI4 | GLI family zinc finger 4 | 13.1 | 6.8 | 1.0 | TF |
| THAP8 | THAP domain containing 8 | 7.5 | 4.3 | 0.8 | TF |
| ING5 | inhibitor of growth family member 5 | 17.5 | 10.4 | 0.8 | CM |
| TAF6 | TATA-box binding protein associated factor | 42.6 | 26.1 | 0.7 | TF |
| ZNF768 | zinc finger protein 768 | 47.2 | 29.3 | 0.7 | TF |
| CREBBP | CREB binding protein | 11.6 | 21.8 | −0.9 | TF |
Key resources table
| Reagent type (species) or resource | Designation | Source or reference | Identifiers | Additional information |
|---|---|---|---|---|
| Biological sample | Ad2 -CMV ATOH1:CMV-GFP viral vector | Kesser et al., Laryngoscope 118:821–831 | ||
| Antibody | anti-myosin VIIa | Developmental Studies Hybridoma Bank | DSHB myo7a138-1 | (1:100) |
| Antibody | anti-espin | J. Bartles (Gift) | (1:50) | |
| Antibody | anti sox 2 | Abcam | ab97959 | (1:100) |
| Antibody | anti-ATOH1 | Aviva Bio Systems | ARP 32365_P050 | (1:100) |
| Antibody | FITC, TRITC secondaries | Sigma | (1:200) | |
| Other | Vectorshield with DAPI | Vector Laboratories | H-1200 |
Additional files
-
Supplementary file 1
Known and putative hair cell markers that exhibit upregulation in gene expression upon Atoh1 transduction into human sensory epithelia.
The left column lists gene names followed by gene descriptions. AB T is the average transcript abundance in the Atoh1 treated samples (as FPKMs). AB C is the average abundance in the control samples. LOG2 is the log base2 fold change of Atoh1 transfected compared to the controls. REFERENCE indicates the published results showing supportive evidence that the given gene is a putative hair cell marker (1) Cai et al. (2015); (2) Scheffer et al., 2015; (3) Shin et al. (2013). Names in bold are genes that show a > 2 fold change in expression (and p<0.05) across all three comparisons (they are part of the 441 differentially expressed genes, see materials and methods and results). Genes with an asterisk (*) are putative Atoh1 downstream targets based on Groves et al publication. Genes in plain text and above the thick bottom line show statistically significant upregulation in all comparisons, but only pass > 2 fold in at least one comparison. Genes below the thick bottom line do not pass any of the above significance thresholds and show at least upregulation in all comparisons.
- https://doi.org/10.7554/eLife.34817.010
-
Transparent reporting form
- https://doi.org/10.7554/eLife.34817.011
Download links
A two-part list of links to download the article, or parts of the article, in various formats.
Downloads (link to download the article as PDF)
Open citations (links to open the citations from this article in various online reference manager services)
Cite this article (links to download the citations from this article in formats compatible with various reference manager tools)
Regenerating hair cells in vestibular sensory epithelia from humans
eLife 7:e34817.
https://doi.org/10.7554/eLife.34817


