Host genetic selection for cold tolerance shapes microbiome composition and modulates its response to temperature
- Ben-Gurion University of the Negev, Israel
- Agricultural Research Organization, Israel
Figures
Figure 1 with 1 supplement
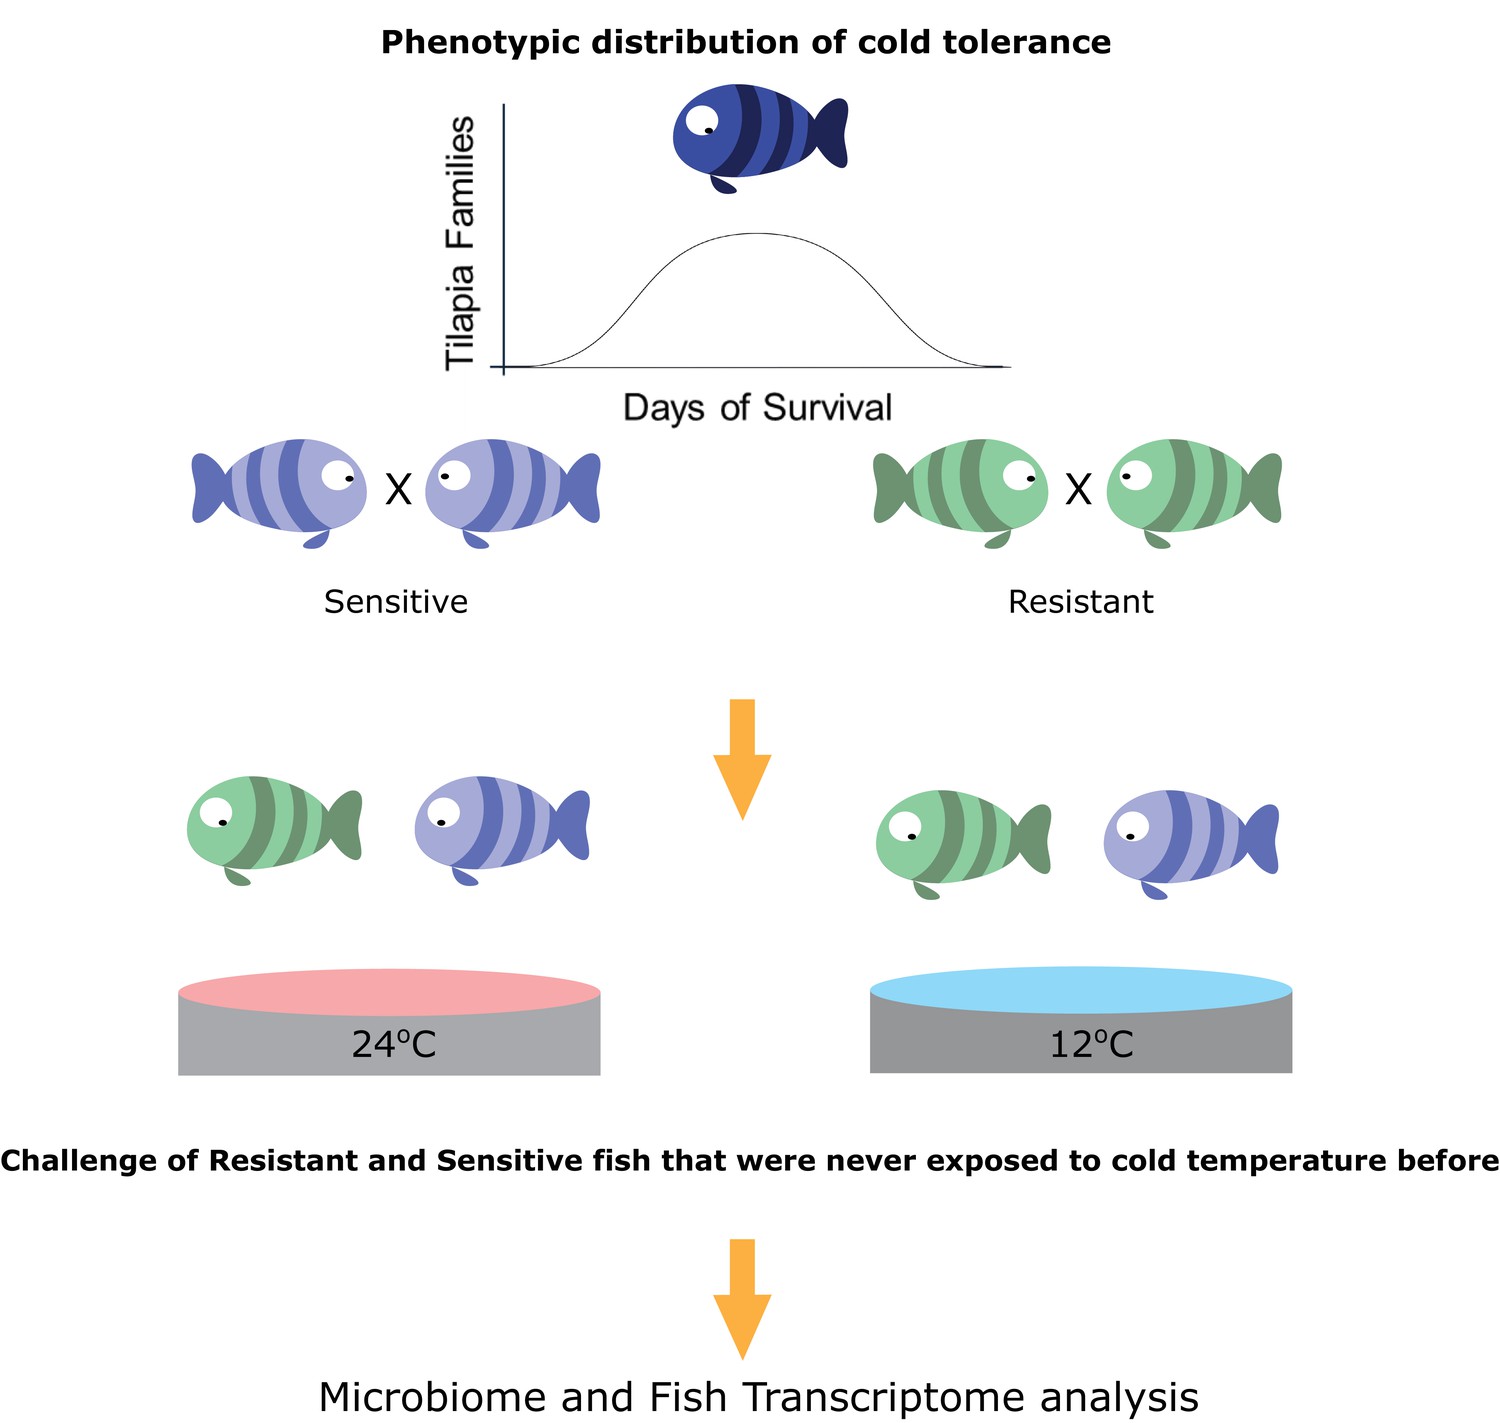
Selection for cold-adapted individuals on the basis of a breeding scheme.
The fish parental lines used in this study originated from an Israeli strain of Oreochromis aureus which was subjected to an ongoing selective breeding program for optimal harvest weight at the Dor Aquaculture Research Station (Zak et al., 2014). Individuals were characterized as cold-resistant or cold-sensitive on the basis of days of survival in low temperatures (<16°C) over the generations. The three most extreme phenotypes (resistant and sensitive) based on their performance at low temperatures were selected and their siblings were transferred to the Agricultural Research Organization (ARO) – Volcani center. These animals were challenged, for the first time, by decreasing water temperature from 24°C to 12°C at a rate of 1 °C/day and then held at 12°C for 2 days before sampling the intestine (for 16S rRNA gene sequencing) and liver (for RNA sequencing) from 7 fish per family (21 fish per tolerance group in each temperature [24°C, control, and 12°C]).
Figure 1—figure supplement 1
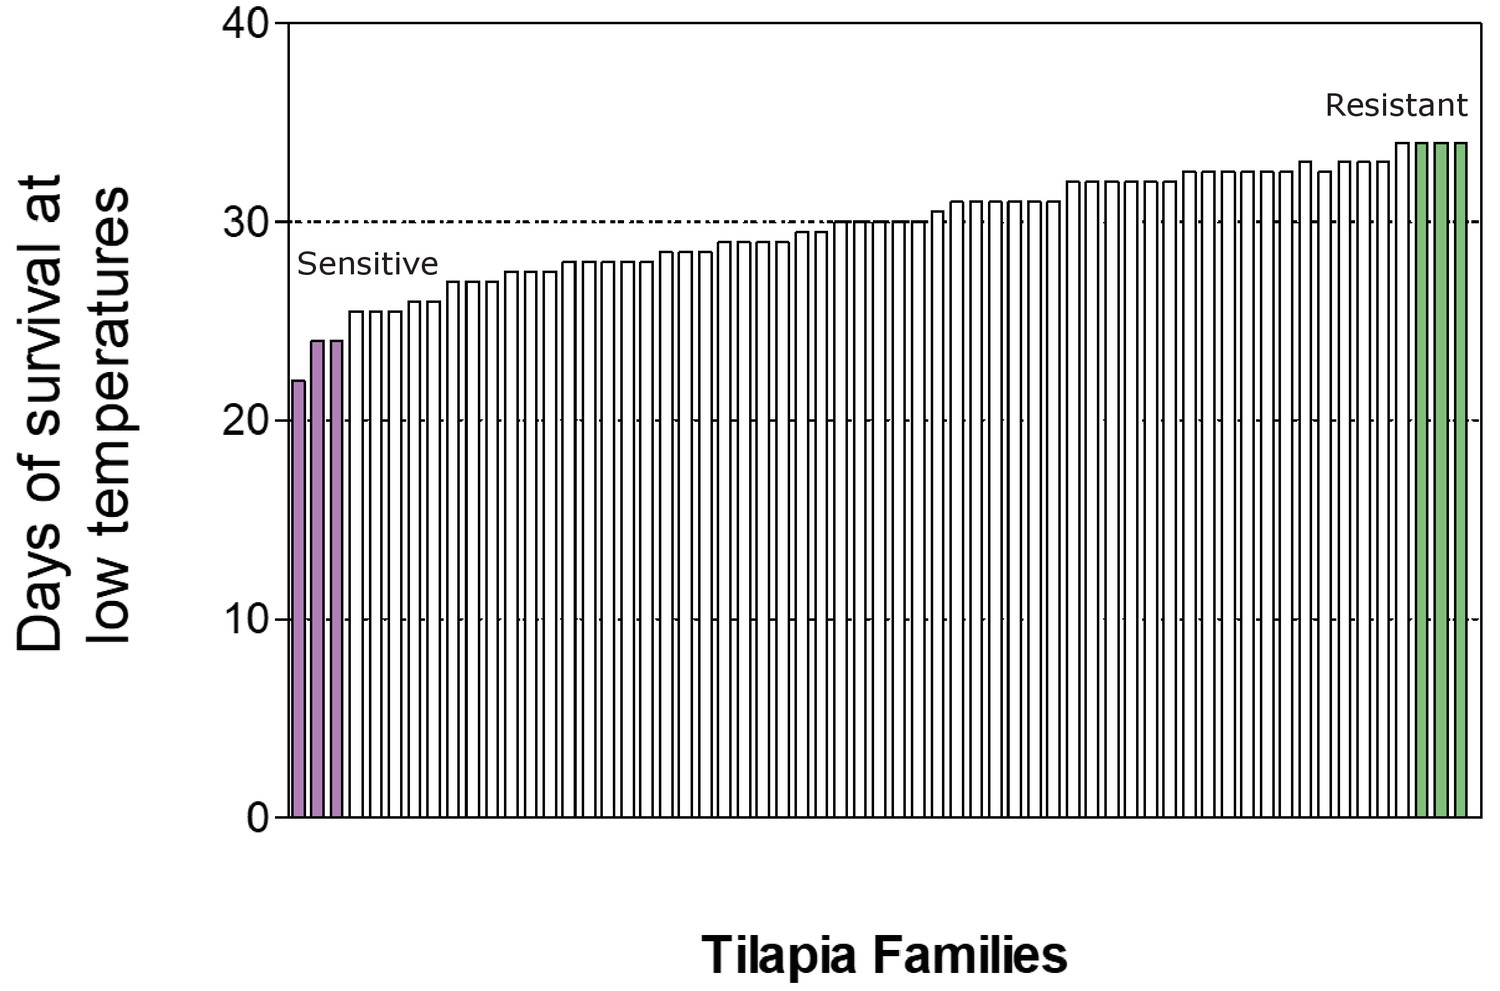
Distribution of survival time (in days) in temperatures below 16°C of the different tilapiine families and selection (highlighted) of individuals originating from the two most extreme maternal phenotypes (resistant in green and sensitive in purple).
https://doi.org/10.7554/eLife.36398.004
Figure 2 with 8 supplements
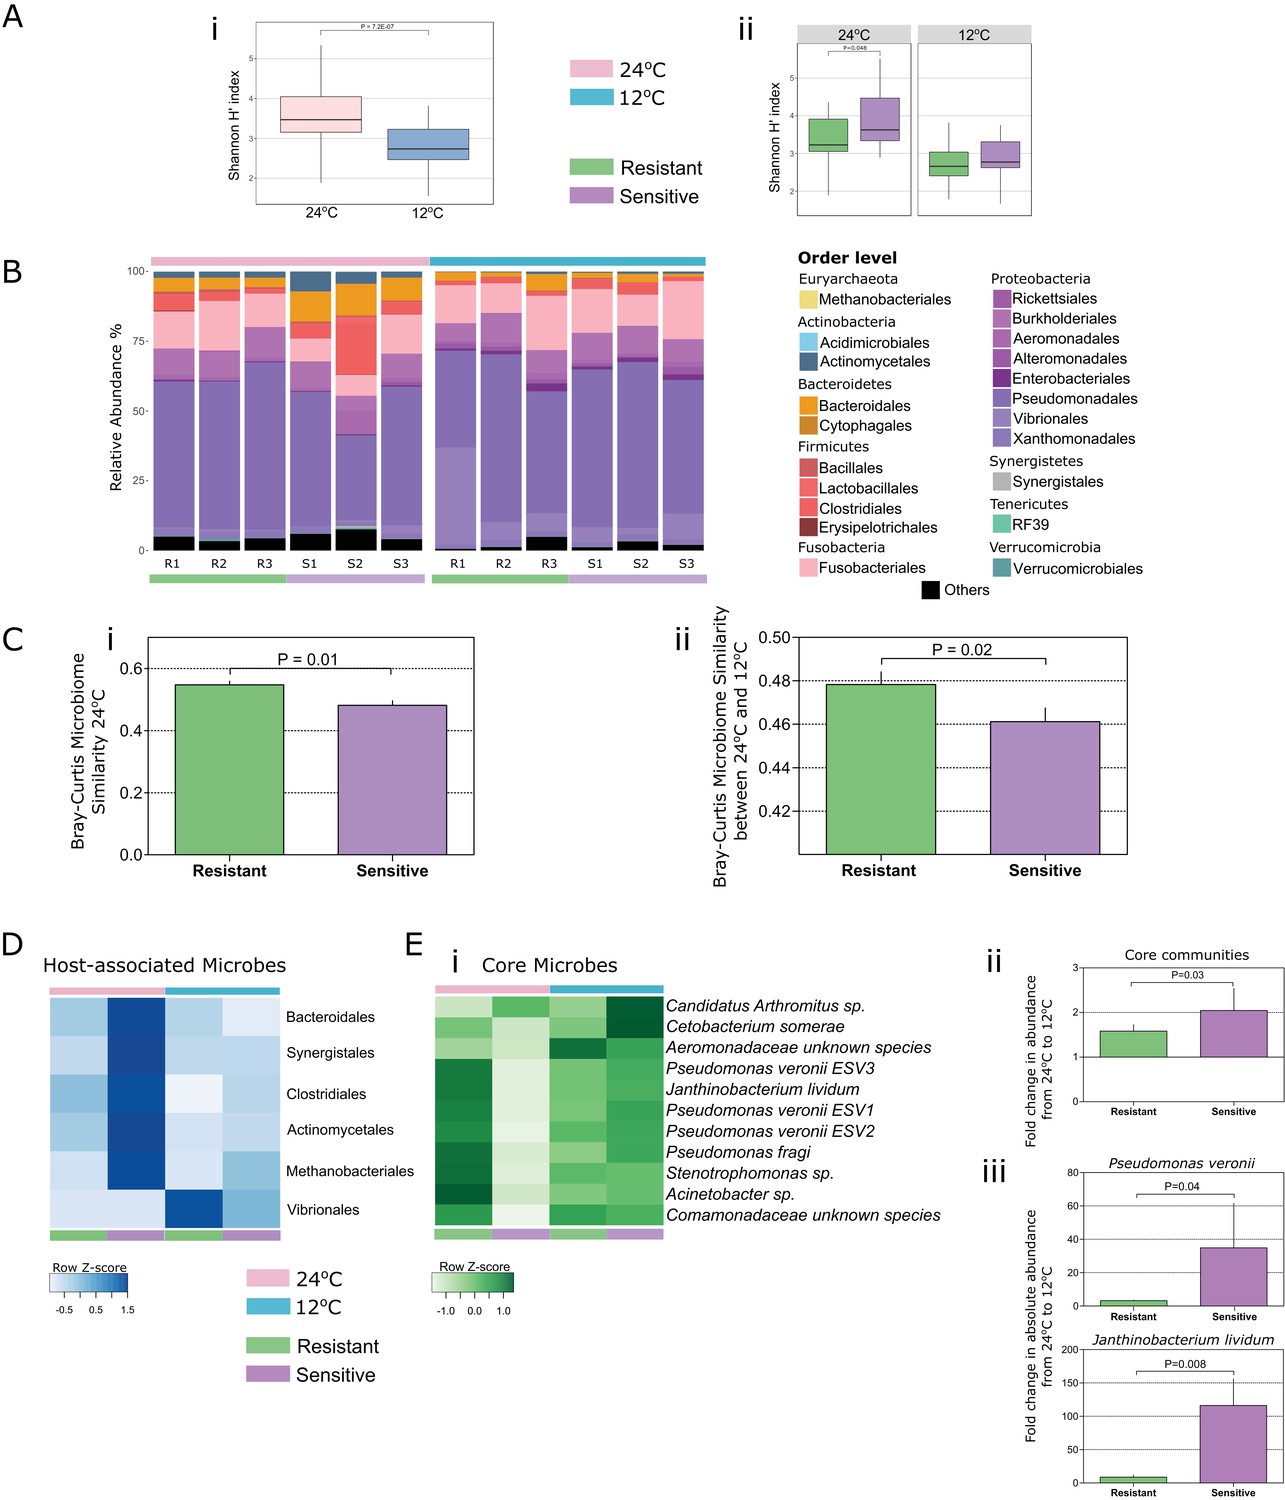
Both temperature and host thermal tolerance have a major effect on shaping microbial communities in the fish gut.
(A) (i) Shannon H’ diversity was decreased (Wilcoxon t-test, two-sided, 95% CI), when fish from both groups were exposed to cold conditions (12°C, blue). (ii) However, in control-warm conditions (24°C, pink) sensitive fish (purple) had a greater diversity of species in their gut microbiomes compared to the resistant fish (green) (Wilcoxon t-test, two-sided, 95% CI). (B) The relative abundance of various orders of microbes in the gut was affected when both resistant and sensitive fish were moved from warm to cold conditions. (C) Comparison of the β-diversity (Bray Curtis) within each of the host groups in (i) warm conditions showed a greater similarity among the resistant individuals compared to that among the sensitive fish, while (ii) comparison in relation to temperature change showed that after exposure to the stressful low-temperature conditions, the microbiomes of cold-resistant fish families were less affected than those of sensitive ones (non-parametric Bonferroni-corrected, using 1000 Monte Carlo permutations). (D) Host-associated species (from indicator species analysis; see 'Materials and methods' section) include several orders that were mostly enriched in either the resistant or the sensitive hosts. (E) (i) Microbial species that were present in >50% of the individuals in both warm and cold conditions (core communities) responded with an increase in their abundance after exposure to cold conditions in the sensitive group, and remained stable in the resistant fish (fold change in abundance from warm to cold shown in (ii)). (iii) These results were also validated by quantitative PCR analysis of the most abundant core species (Pseudomonas veronii and Janthinobacterium lividum). In the box plots, horizontal line in the box represents the median and whiskers indicate the lowest and highest point within 1.5 interquartile ranges of the lower or upper quartile, respectively. Bar plots show the mean copy number per group and whiskers the standard error of the mean.
Figure 2—figure supplement 1
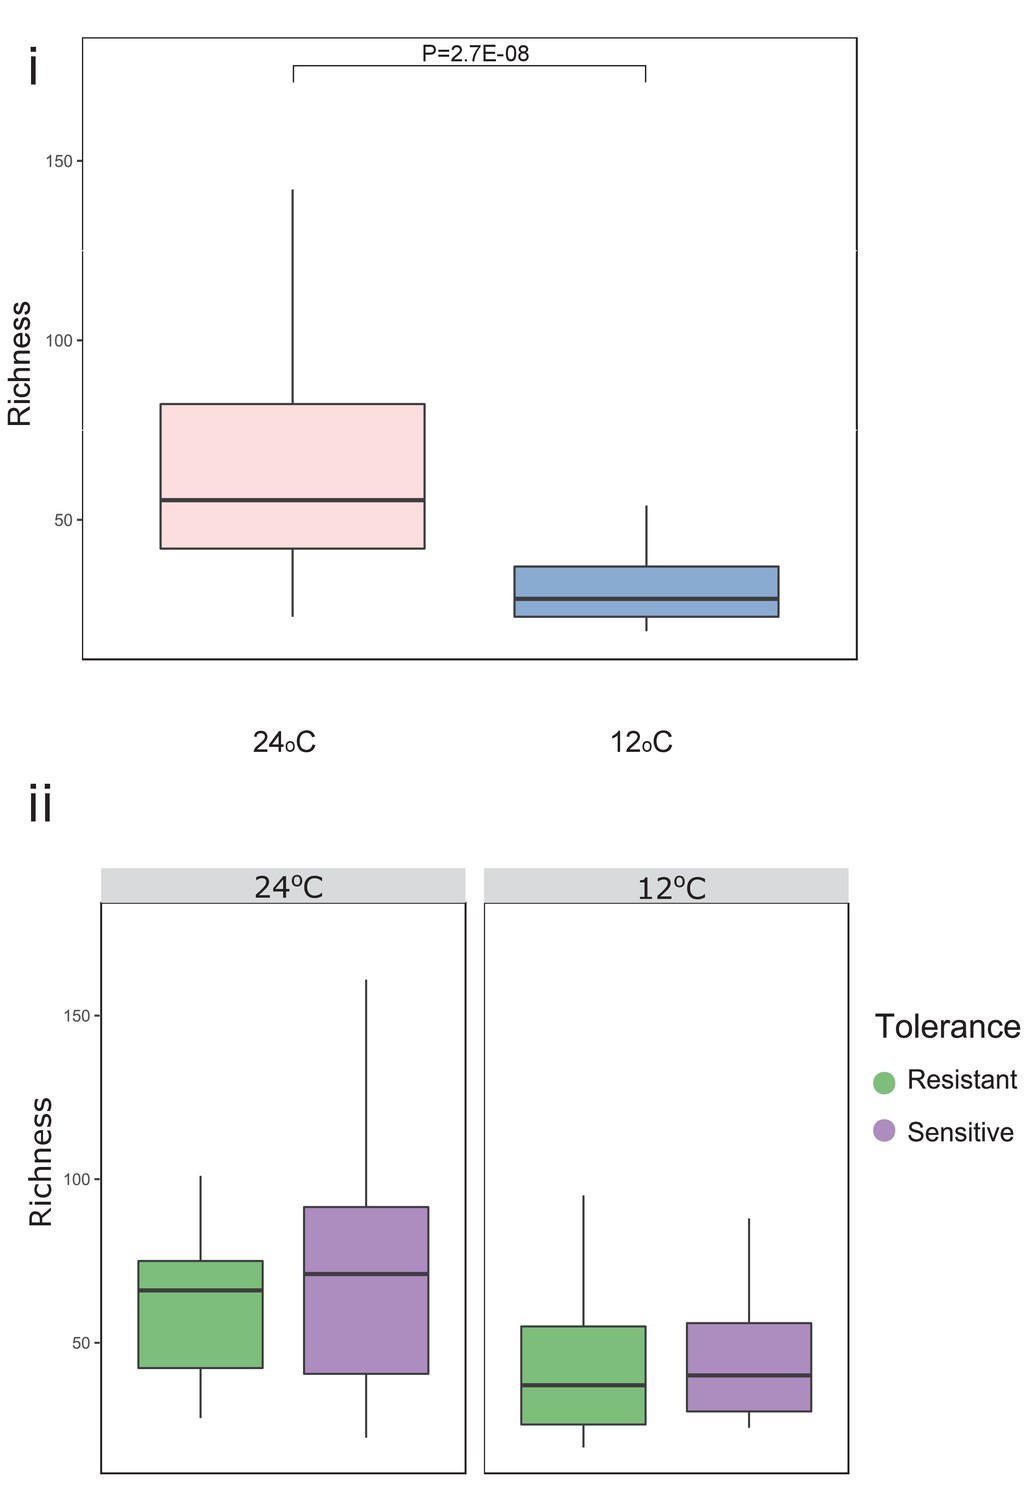
Temperature significantly decreased richness in both resistant and sensitive fish groups.
Microbial gut species richness for (i) all fish and (ii) for resistant and sensitive fish groups, separately. P-values indicate significance as determined by a Wilcoxon t-test (two-sided, 95% CI). In the box plots, the horizontal line within the box represents the median, and whiskers indicate the lowest and highest point within 1.5 interquartile ranges of the lower or upper quartile, respectively.
Figure 2—figure supplement 2
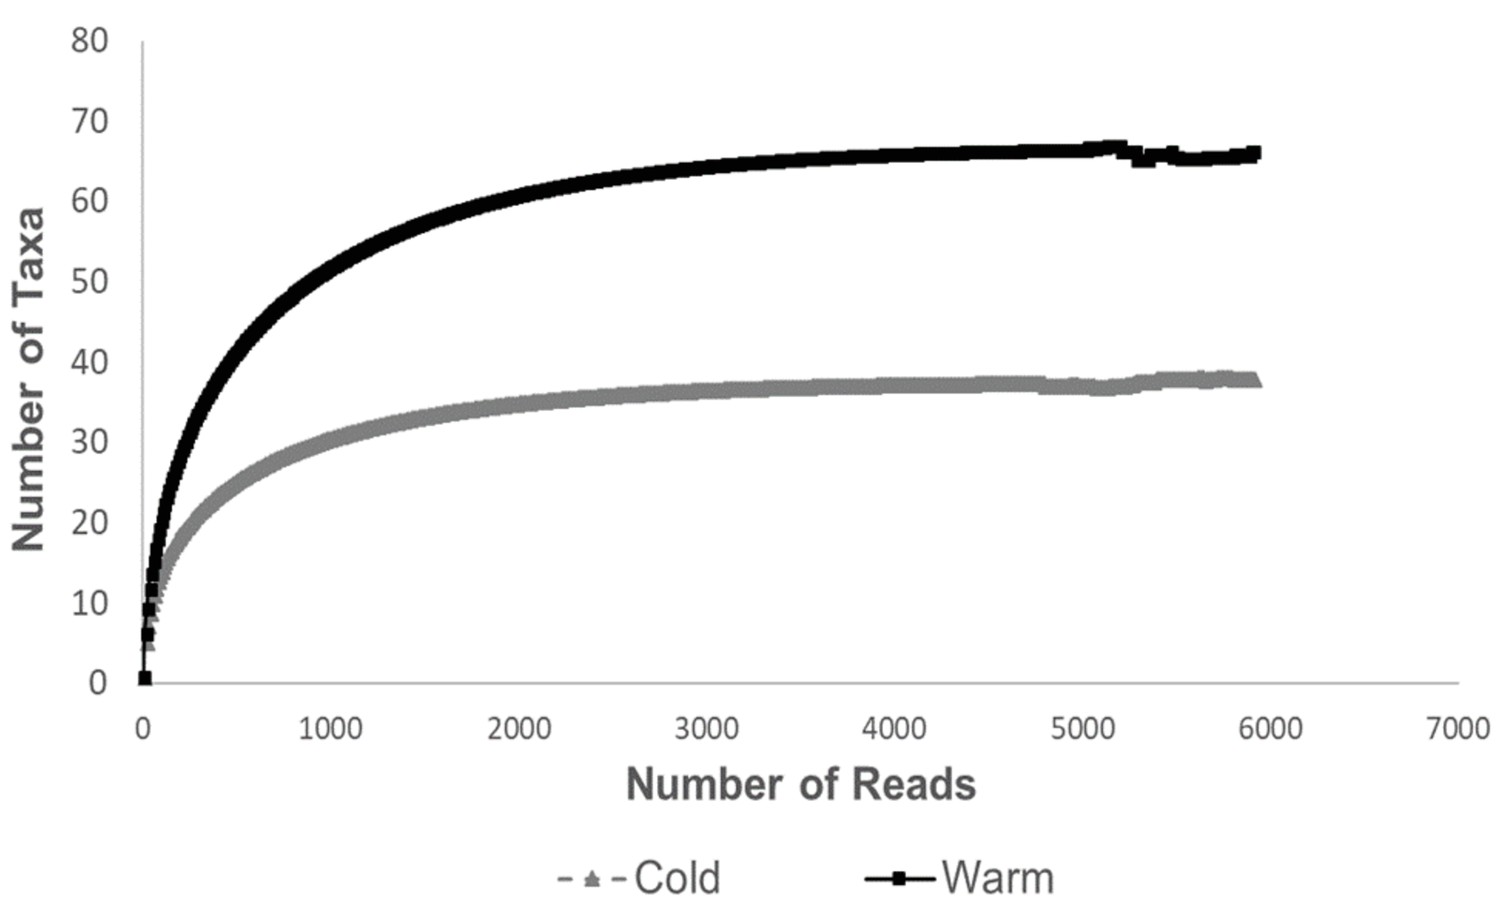
Rarefaction curves for sequence depth in the different temperatures.
The results show that there are more taxa per sequence depth in the 24°C group than in the 12°C group.
Figure 2—figure supplement 3
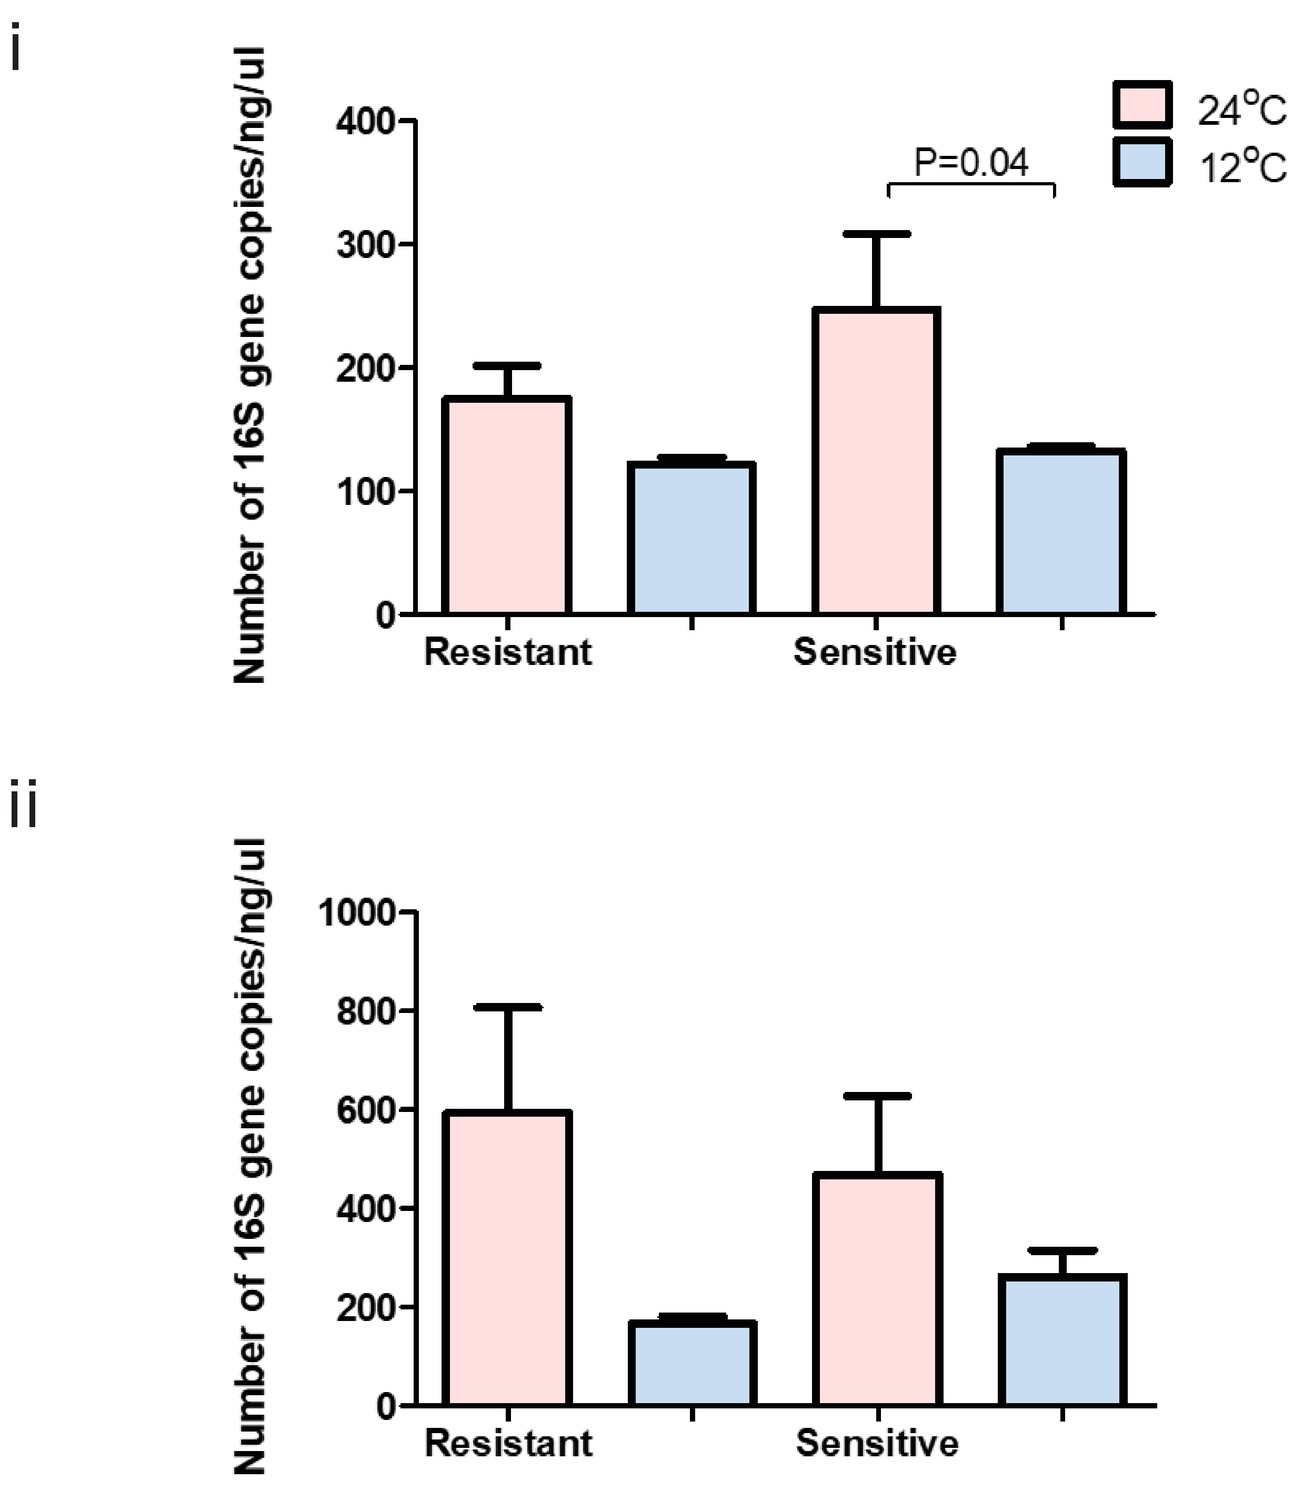
Total bacterial 16S gene copy number within each group at 24°C (pink) and 12°C (blue) in the (i) anterior and (ii) posterior gut of resistant and sensitive fish.
Bar plots show the mean copy number per group and whiskers the standard error of the mean. P-values indicate significance as determined in a two-sided t-test, 95% confidence interval.
Figure 2—figure supplement 4
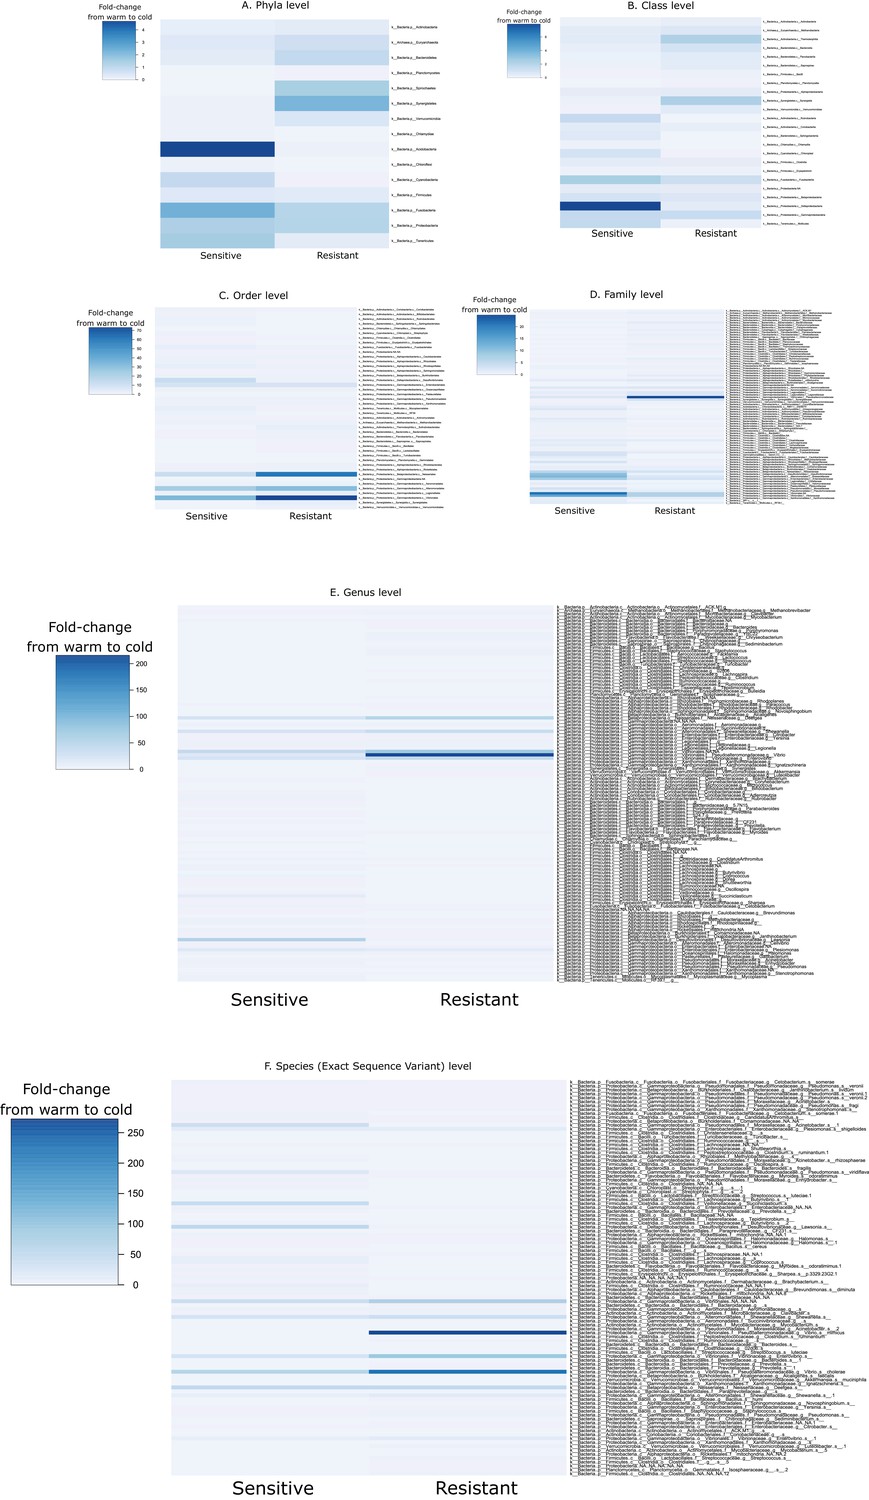
Fold-change in the taxa abundance at different taxonomic levels ((A) phylum, (b) class, (c) order, (d) family, (e) genus and (f) species) from 24°C to 12°C within the guts of the resistant and sensitive host groups.
Values below 1 indicate a decrease in the taxon abundance after cold exposure, while values above 1 show an increase in abundance.
Figure 2—figure supplement 5
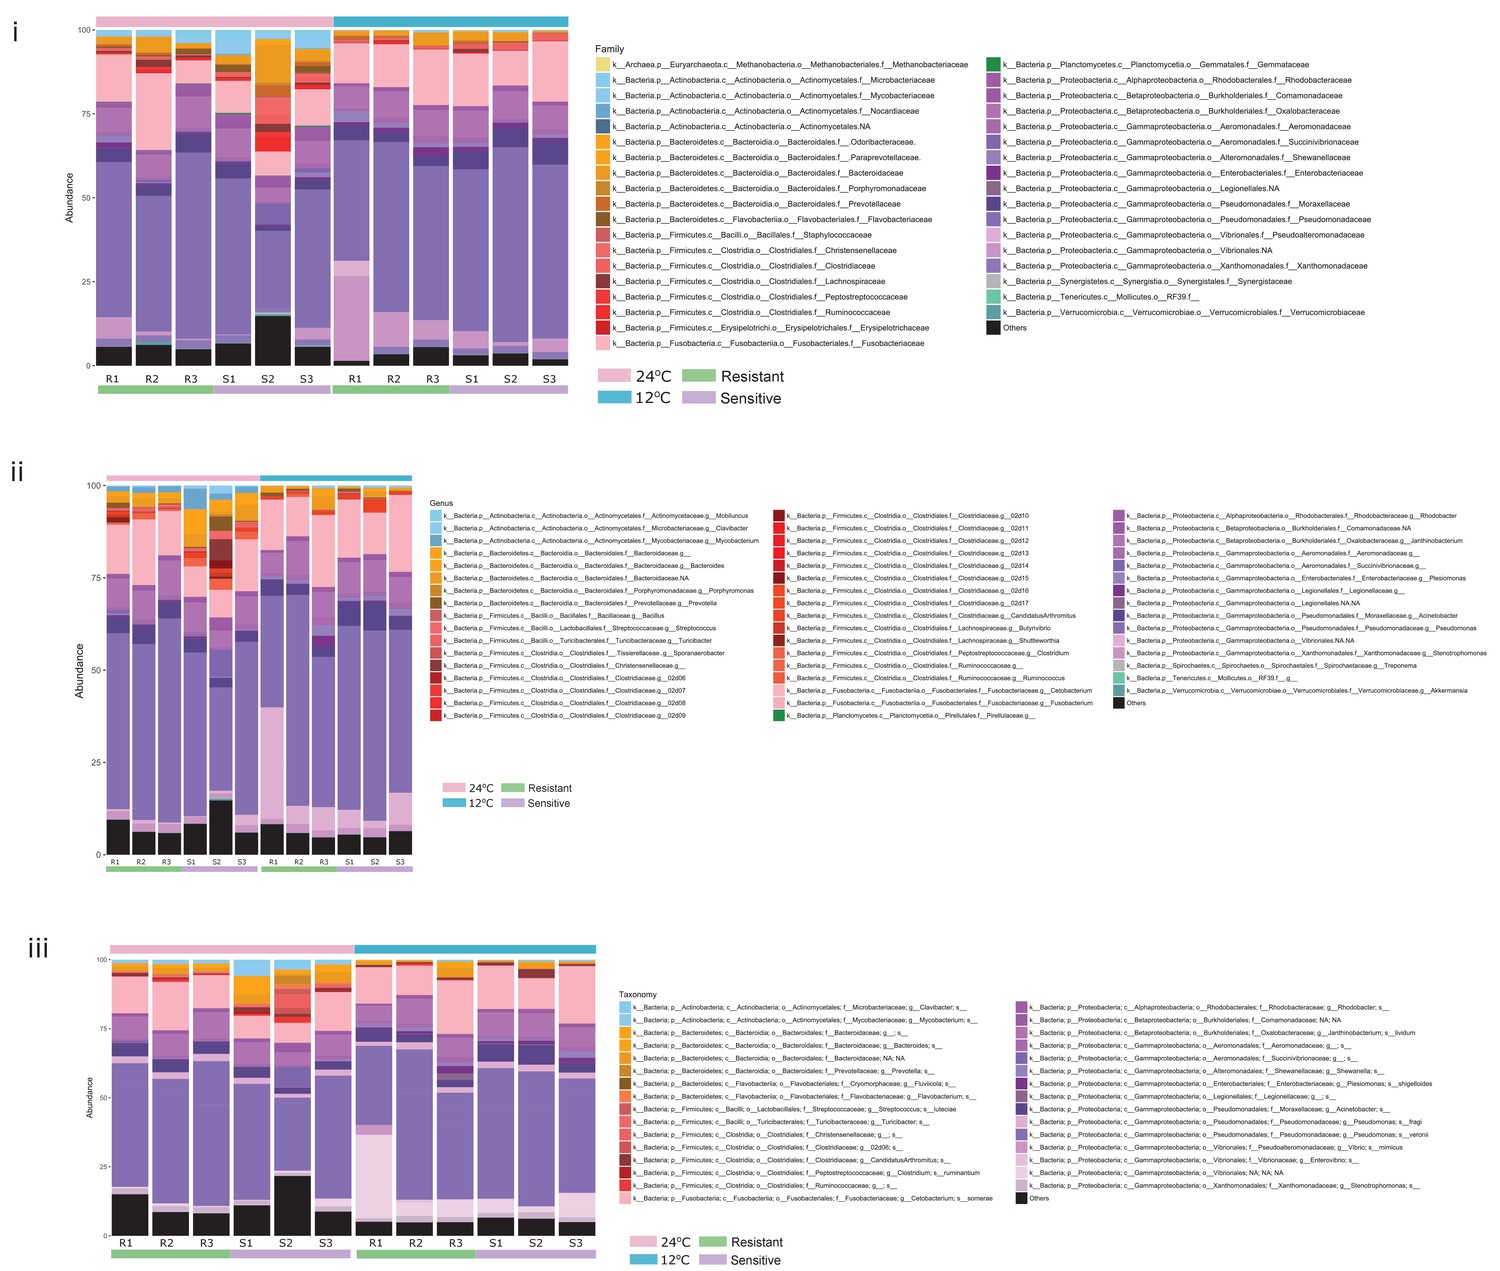
Relative abundance of the most abundant microbial taxa within the posterior gut of fish in the two temperature conditions, at the (i) family, (ii) genus and (iii) exact sequence variant (ESV) levels.
https://doi.org/10.7554/eLife.36398.010
Figure 2—figure supplement 6
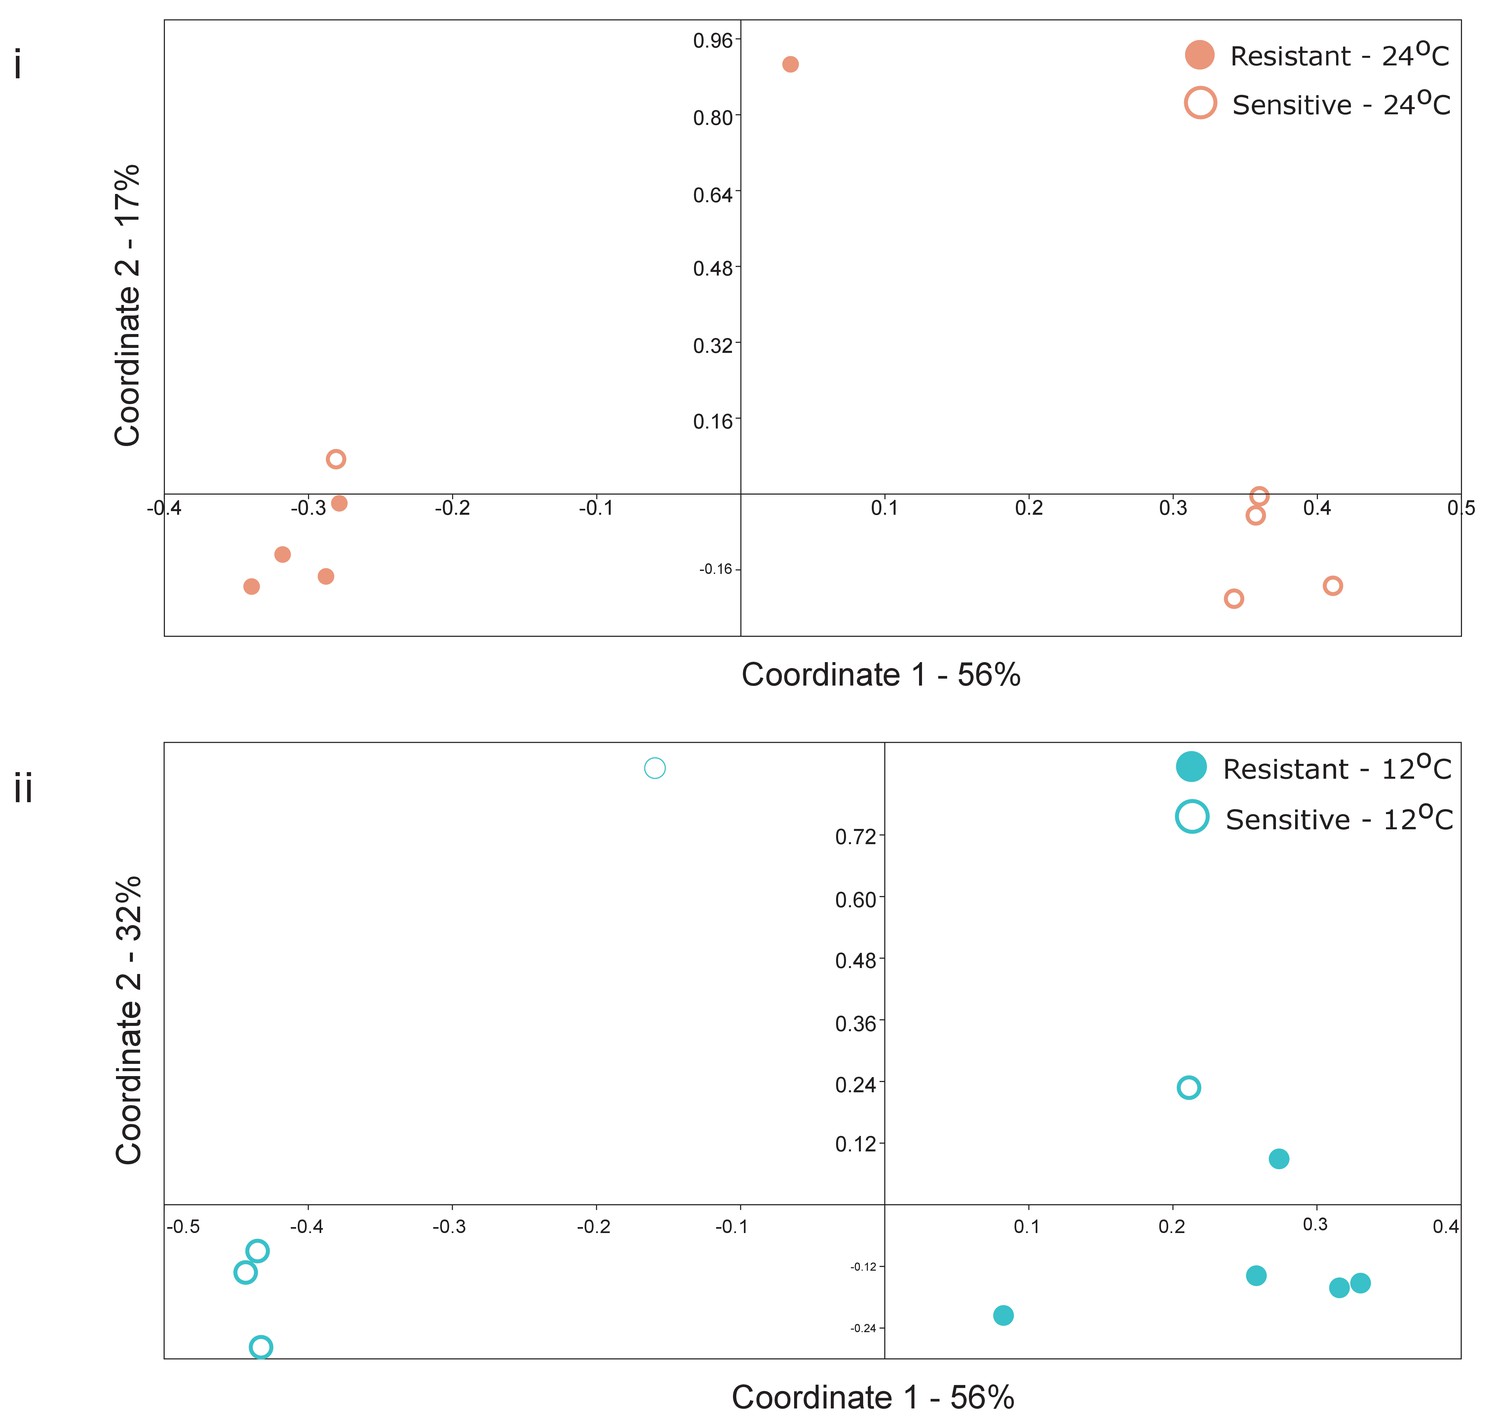
Principal coordinate analysis (Bray-Curtis similarity metric) of selected individuals with (i) high or (ii) low Shannon H’ diversity index (see Supplementary file 1, Table S2) in (i) warm (red) and (ii) cold (blue) conditions, respectively.
Clustering according to the group (Resistant, dot; Sensitive, circle) was significant (ANOSIM, p-value=0.03 and p-value=0.017, respectively).
Figure 2—figure supplement 7
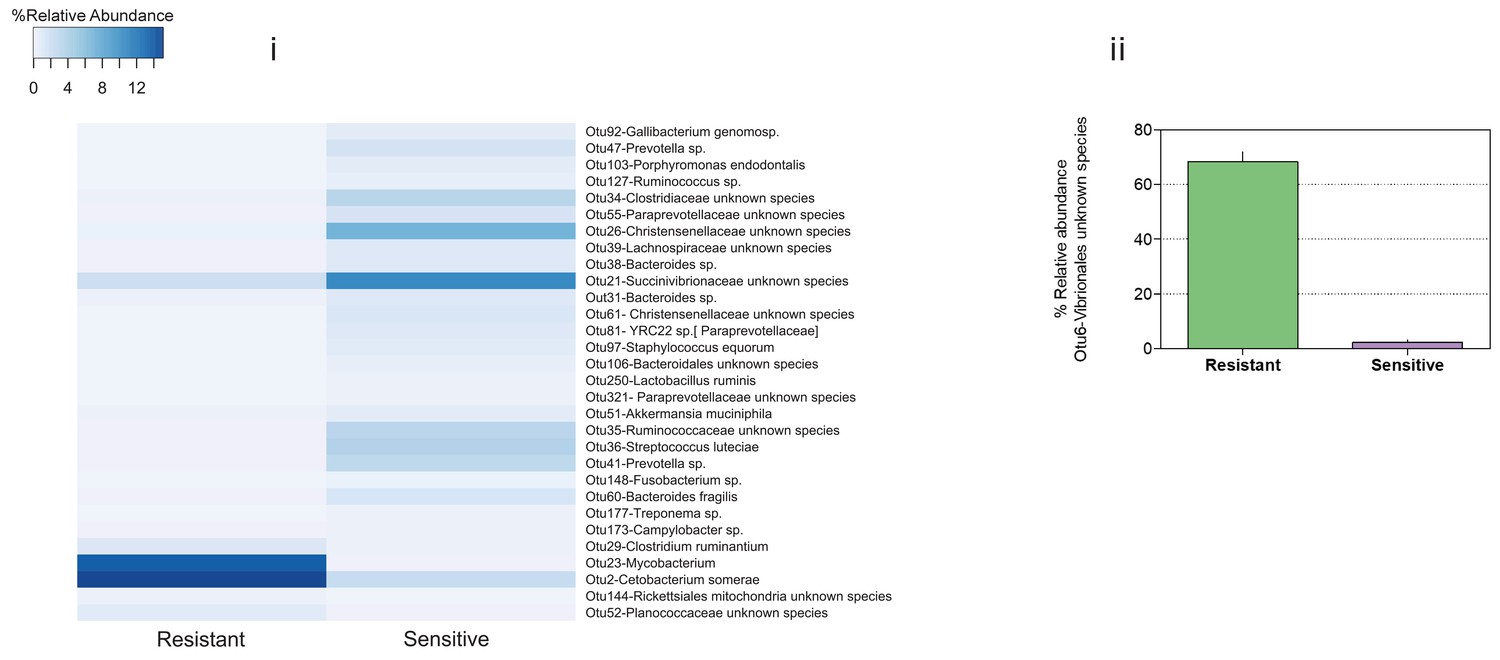
Relative abundance of host-associated (indicator) species that were significantly enriched in low and high diversity microbiomes (see Supplementary file 1, Table S5 for P-values), in (i) warm and (ii) cold conditions in resistant and sensitive fish hosts.
https://doi.org/10.7554/eLife.36398.012
Figure 2—figure supplement 8
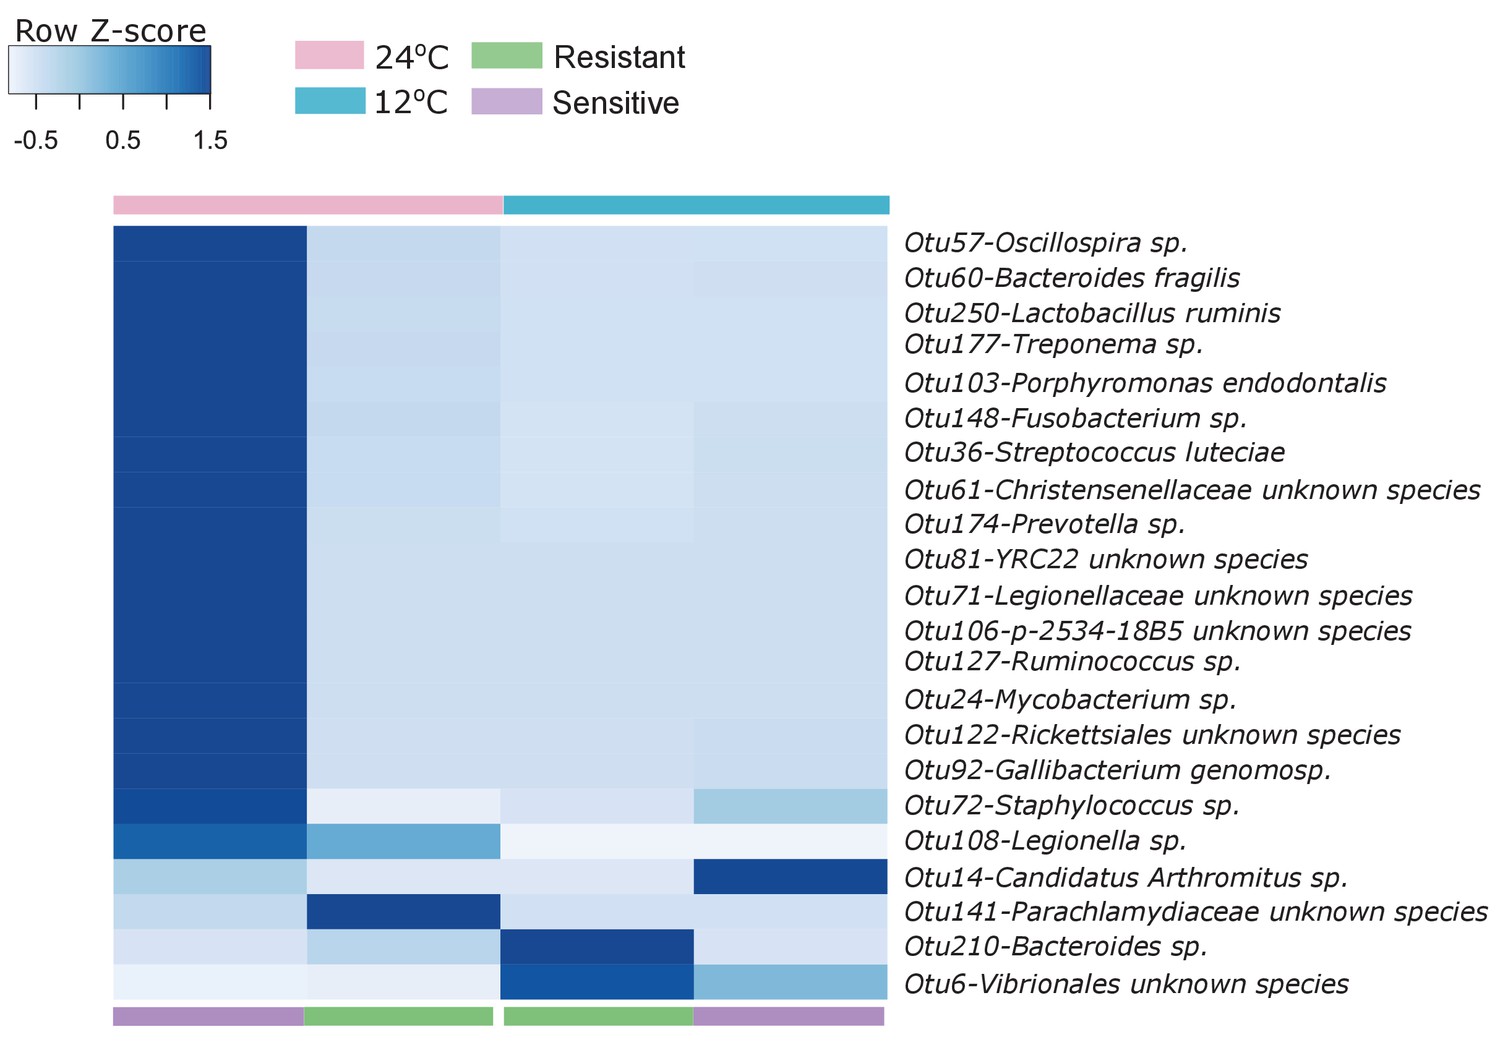
Indicator species analysis (see 'Materials and methods' section) revealed several exact sequence variants that were specific to either the resistant or sensitive fish posterior gut.
https://doi.org/10.7554/eLife.36398.013
Figure 3 with 1 supplement
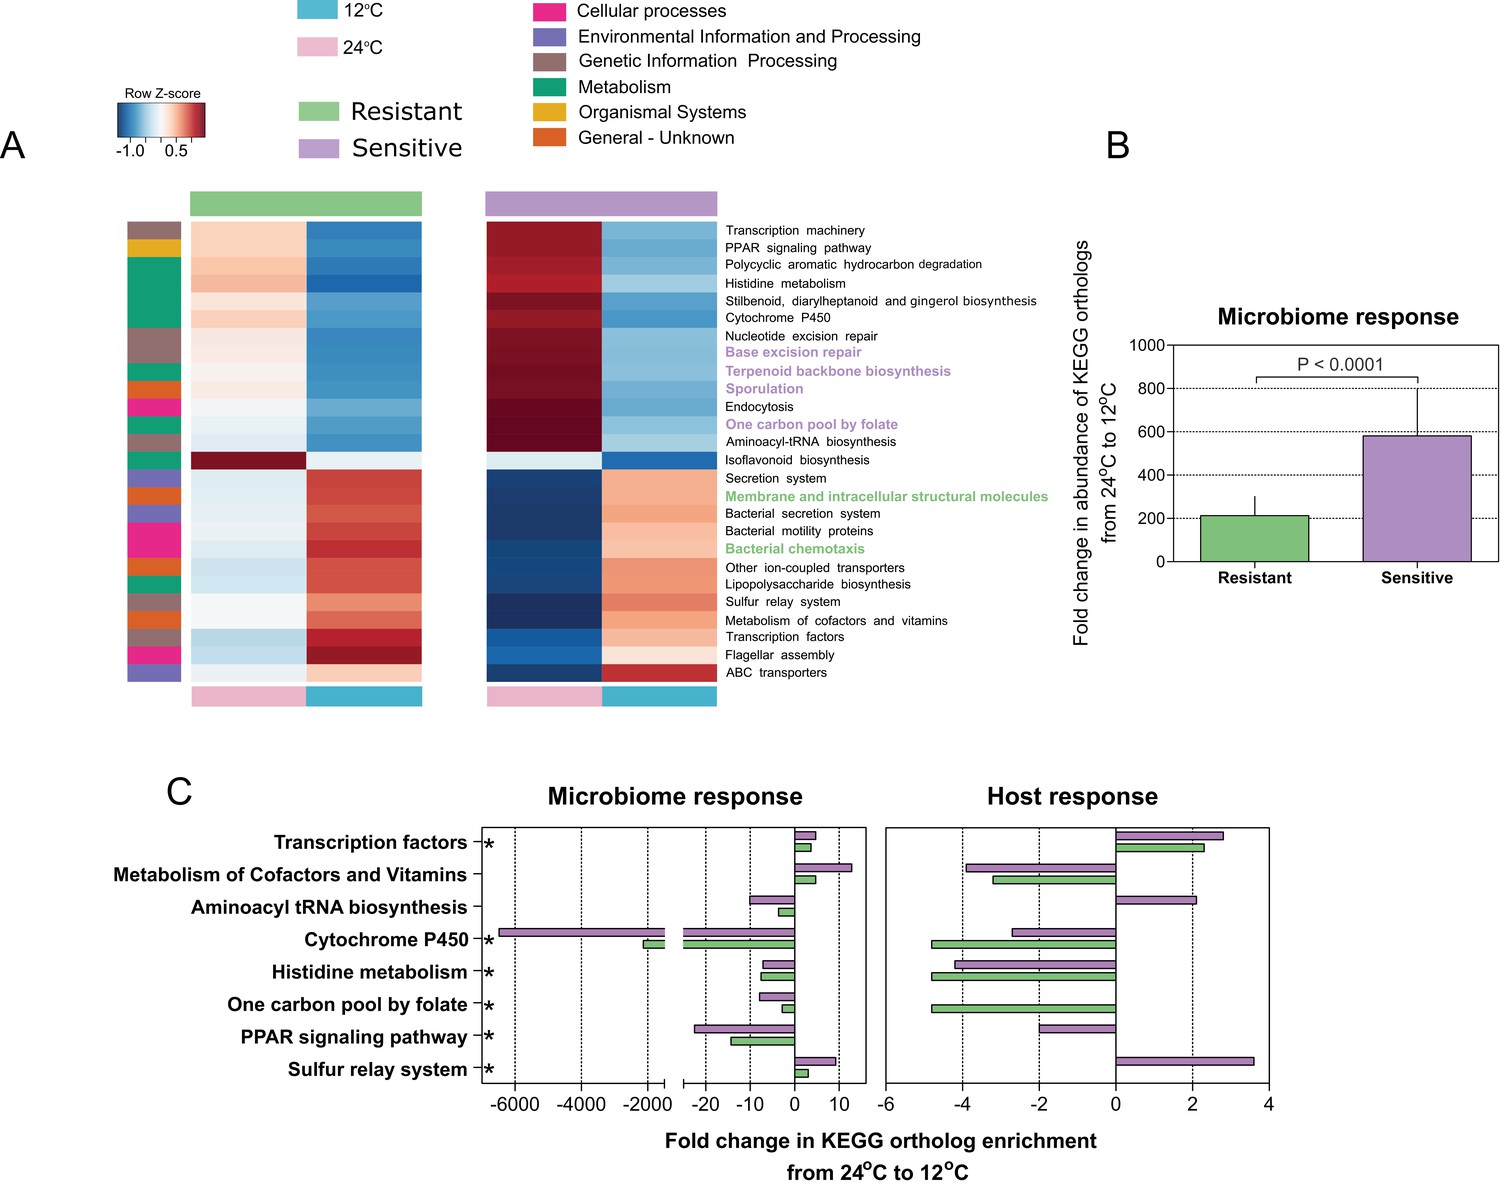
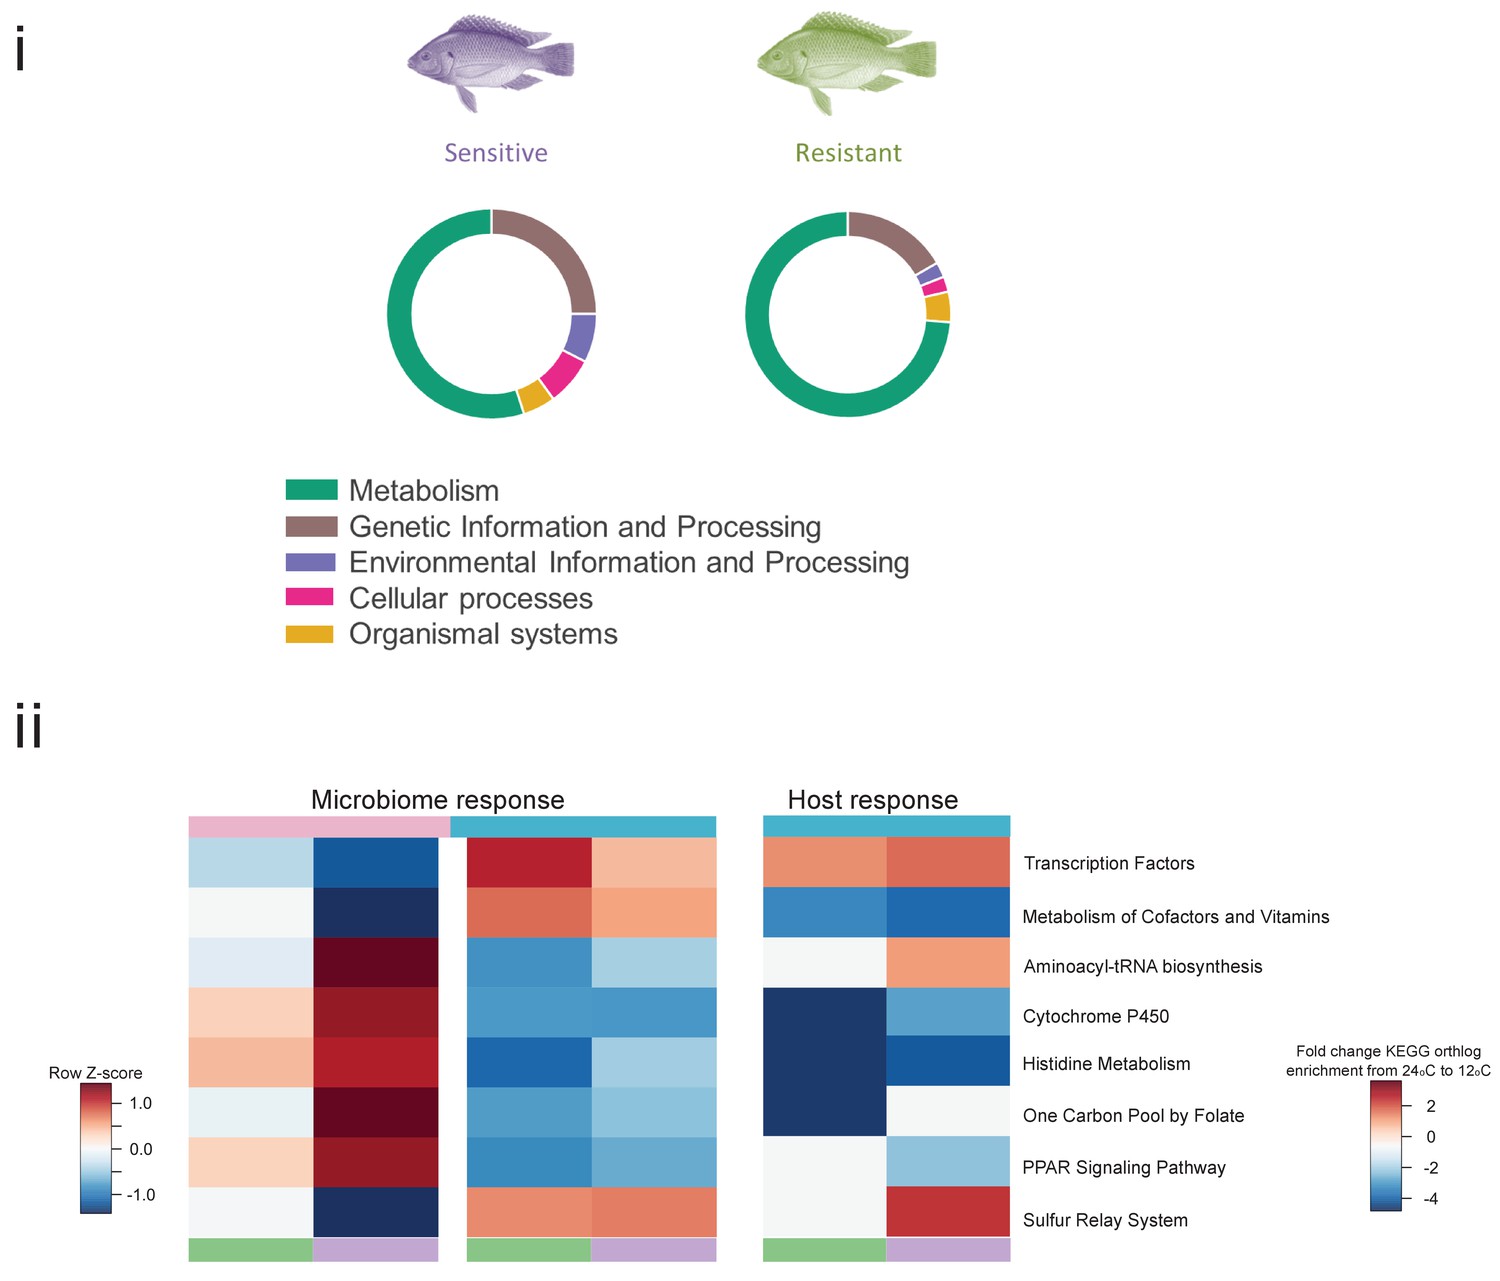
Microbial functional diversity corresponds to cold stress and the host's acclimation.
(A) Pathway enrichment analysis using PICRUSt-predicted KEGG (Kyoto Encyclopedia of Genes and Genomes) orthologs revealed a decrease in microbiome pathways related to metabolism during cold exposure, with an increase in the number of ortholog groups related to cellular processes, genetic and environmental information and processing. Different pathways were enriched in the resistant and sensitive fish, as indicated by the LEfSe analysis (see 'Materials and methods' section). (B) Differences were observed in the microbiome responses of the cold-resistant and sensitive fish, the latter showing a higher fold change from control when exposed to cold conditions (Wilcoxon rank-sum pairwise test, p < 0.0001, two sided). The bar plots show the mean fold change in abundance of KEGG orthologs in the microbial pathways after temperature change from 24°C to 12°C and whiskers represent the standard error of the mean, as indicated by PICRUSt and LEfSe analysis. (C) Functions that are shared between the microbiome and host response that were affected after cold exposure. Bar plots show fold change in the enrichment of KEGG orthologs after temperature change from 24°C to 12°C.
Figure 3—figure supplement 1
Pathways affected during cold exposure in the resistant and sensitive fish families.
(i) Affected pathways assigned to KEGG categories, as indicated by transcriptomic analysis. The size of the fraction is relative to the total number of pathways affected for each KEGG category. (ii) Common KEGG pathways identified as affected (red, upregulated; blue, downregulated) by the cold exposure shared between the microbiome and the host transcriptomic response in the liver.
Figure 4 with 3 supplements
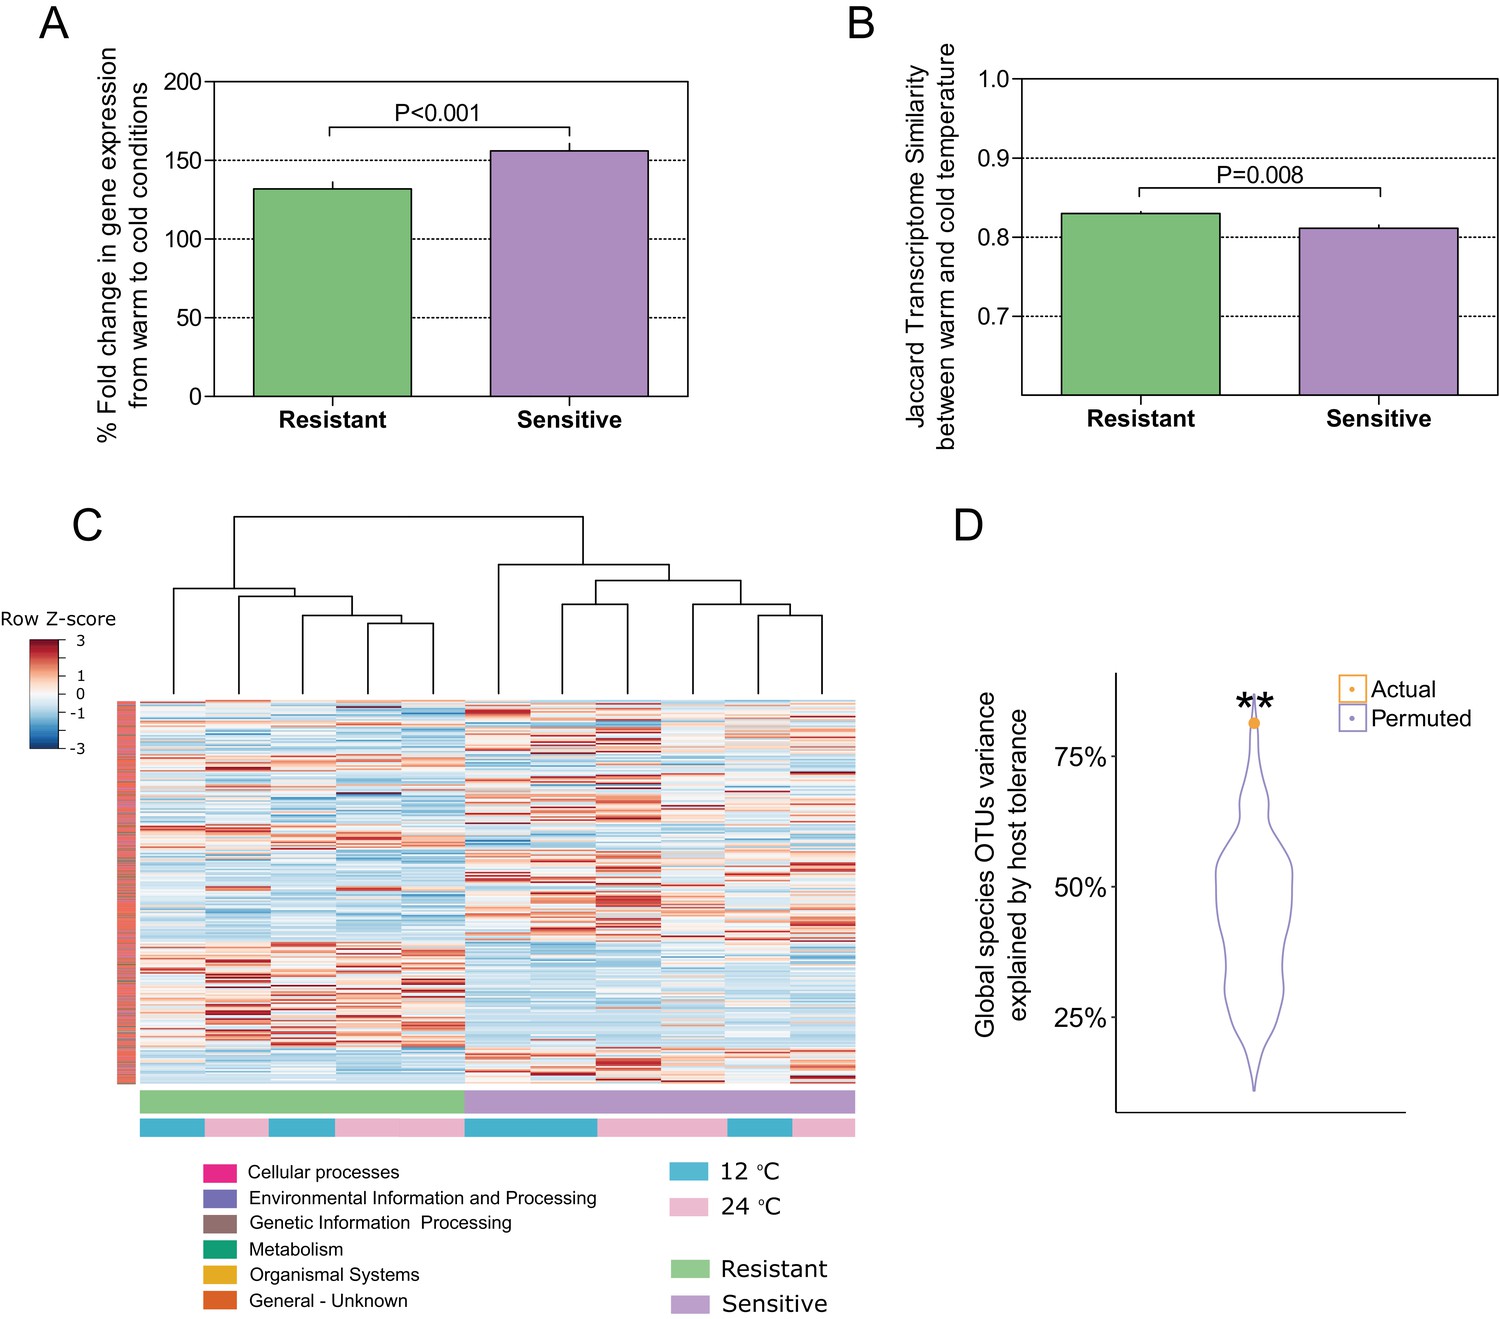
Host–microbiome response during cold exposure indicates a more stable phenotype.
(A) Comparison of the average fold change in transcriptome expression per host group in relation to temperature change showed that after exposure to low-temperature conditions, the gene expression of cold-resistant families was less affected than those of sensitive ones (Wilcoxon rank-sum test, p < 0.0001, two-sided). (B) Comparison of the transcriptome β-diversity (Jaccard) in warm and cold conditions within each of the host groups showed a greater similarity among the resistant individuals than among the sensitive ones (Wilcoxon rank-run test, p = 0.008, two-sided). (C) Heatmap showing the expression patterns of host-associated genes as determined by indval analysis (rows) of cold-resistant and cold-sensitive hosts in warm and cold conditions (columns). Genes were annotated in KEGG (Kyoto Encyclopedia of Genes and Genomes). (D) Total fraction of operational taxonomic unit (OTU) variance explained by host genetics on the basis of Canonical Correlation Analysis (CCA) between the matrices of OTUs principal coordinates and transcriptomic data principal coordinates. A significant correlation was found after comparing the posterior gut microbiome structure and the liver transcriptome between the resistant and sensitive fish (Canonical Correlation Analysis, 1000 permutations, actual variance = 0.83, permuted variance = 0.44, p = 0.0044). This actual value was compared to that of 1000 random permutations, where the order of the host lines' principal coordinates was shuffled.
Figure 4—figure supplement 1
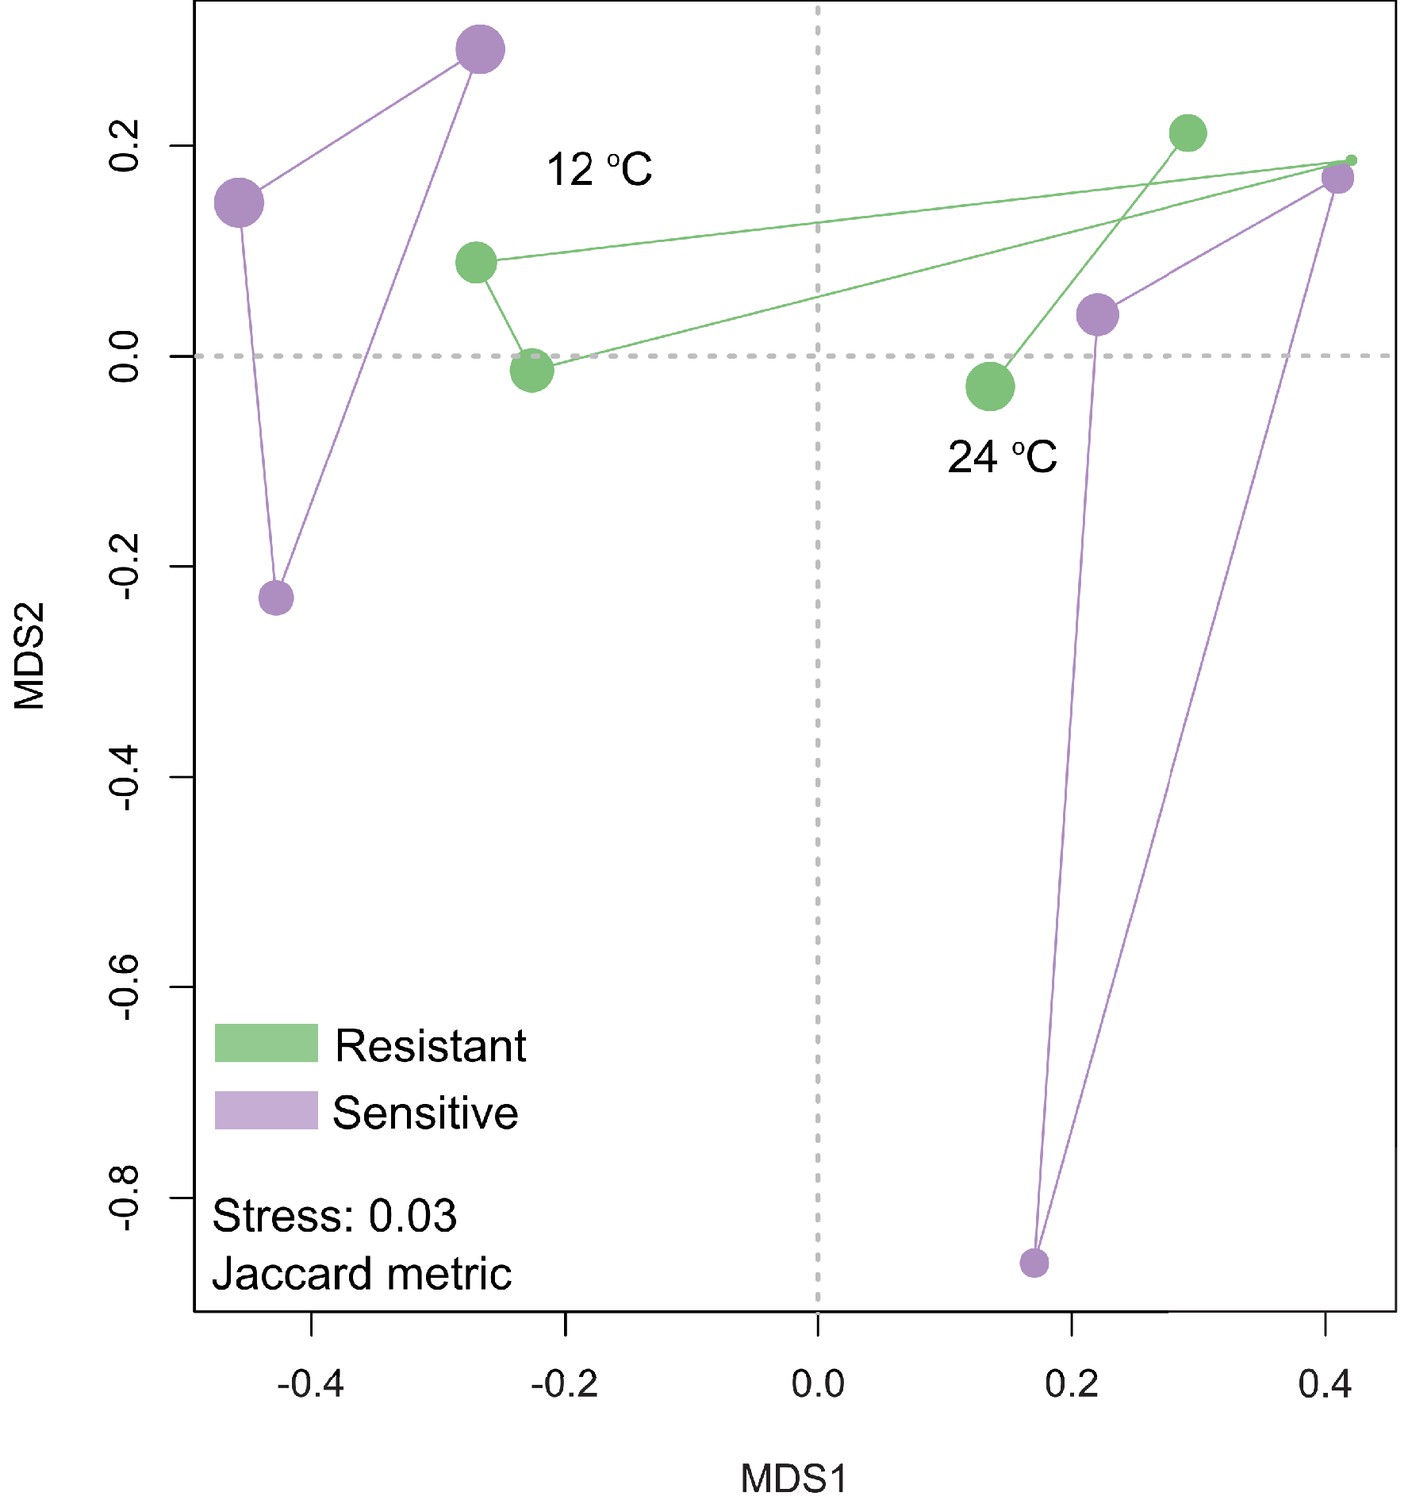
Non-metric multidimensional scaling (NMDS) on the liver transcriptome data showed that clusters were formed on the basis of the Jaccard metric, between the resistant and sensitive fish lines at 12°C and 24°C.
Size of the dot is proportional to the goodness of fit for the first principal coordinate times 100 using the Jaccard metric.
Figure 4—figure supplement 2
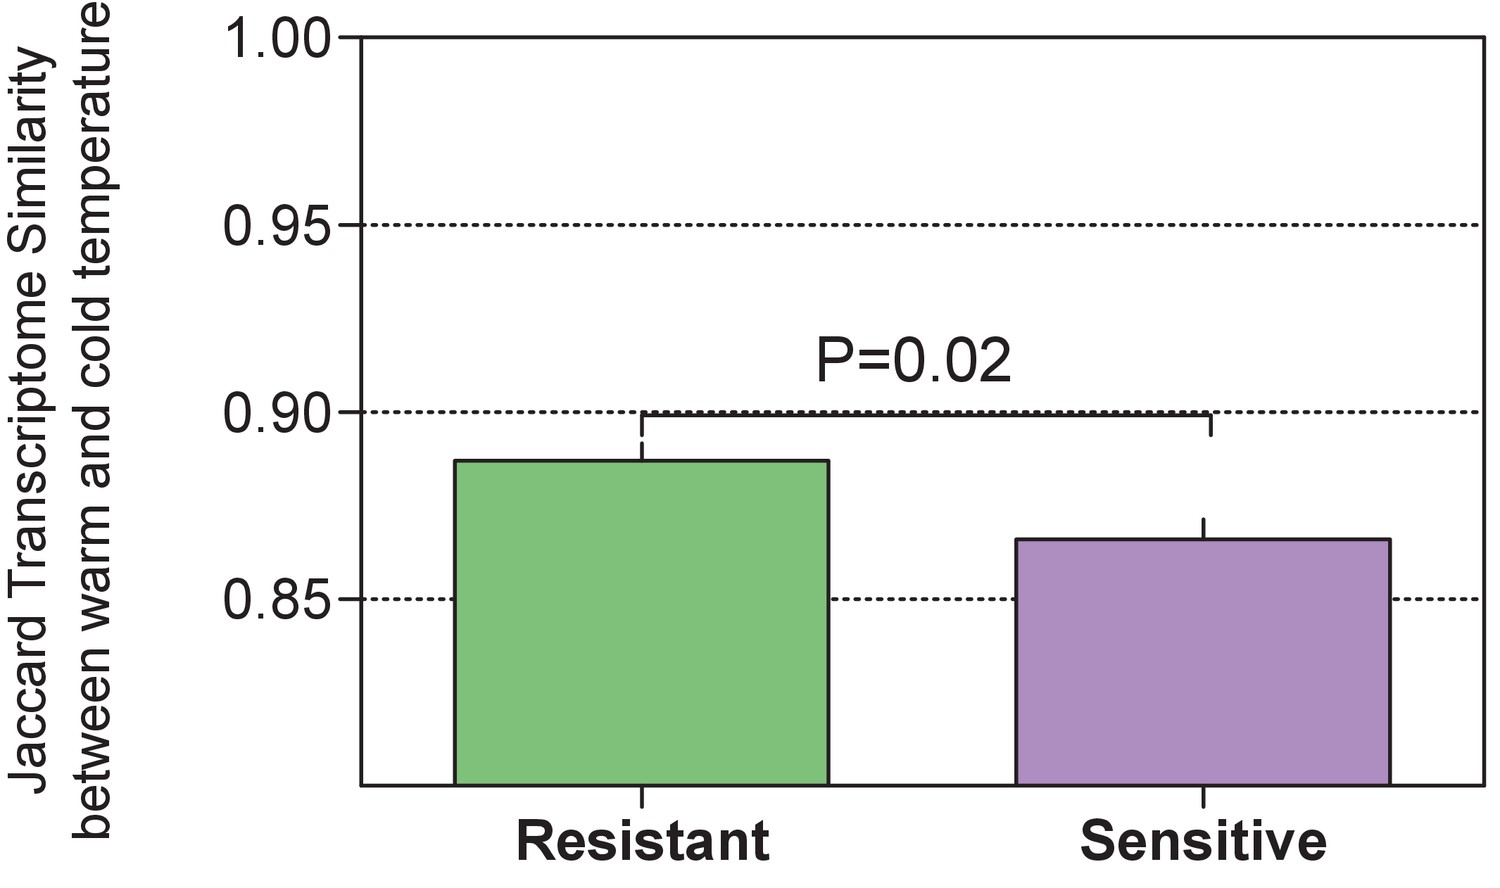
Comparison of the host-associated gene (indval analysis) expression similarity (Jaccard) within each of the host groups between warm and cold conditions showed a higher similarity among the resistant individuals than among the sensitive ones (Wilcoxon rank-run test, p = 0.02, one-sided).
https://doi.org/10.7554/eLife.36398.020
Figure 4—figure supplement 3

Principal coordinate analysis using the Bray Curtis metric for the selected individuals for which transcriptomic analysis was performed.
Size of the dot is proportional to the goodness of fit for the first principal coordinate times 100 using the Bray Curtis metric.
Figure 5
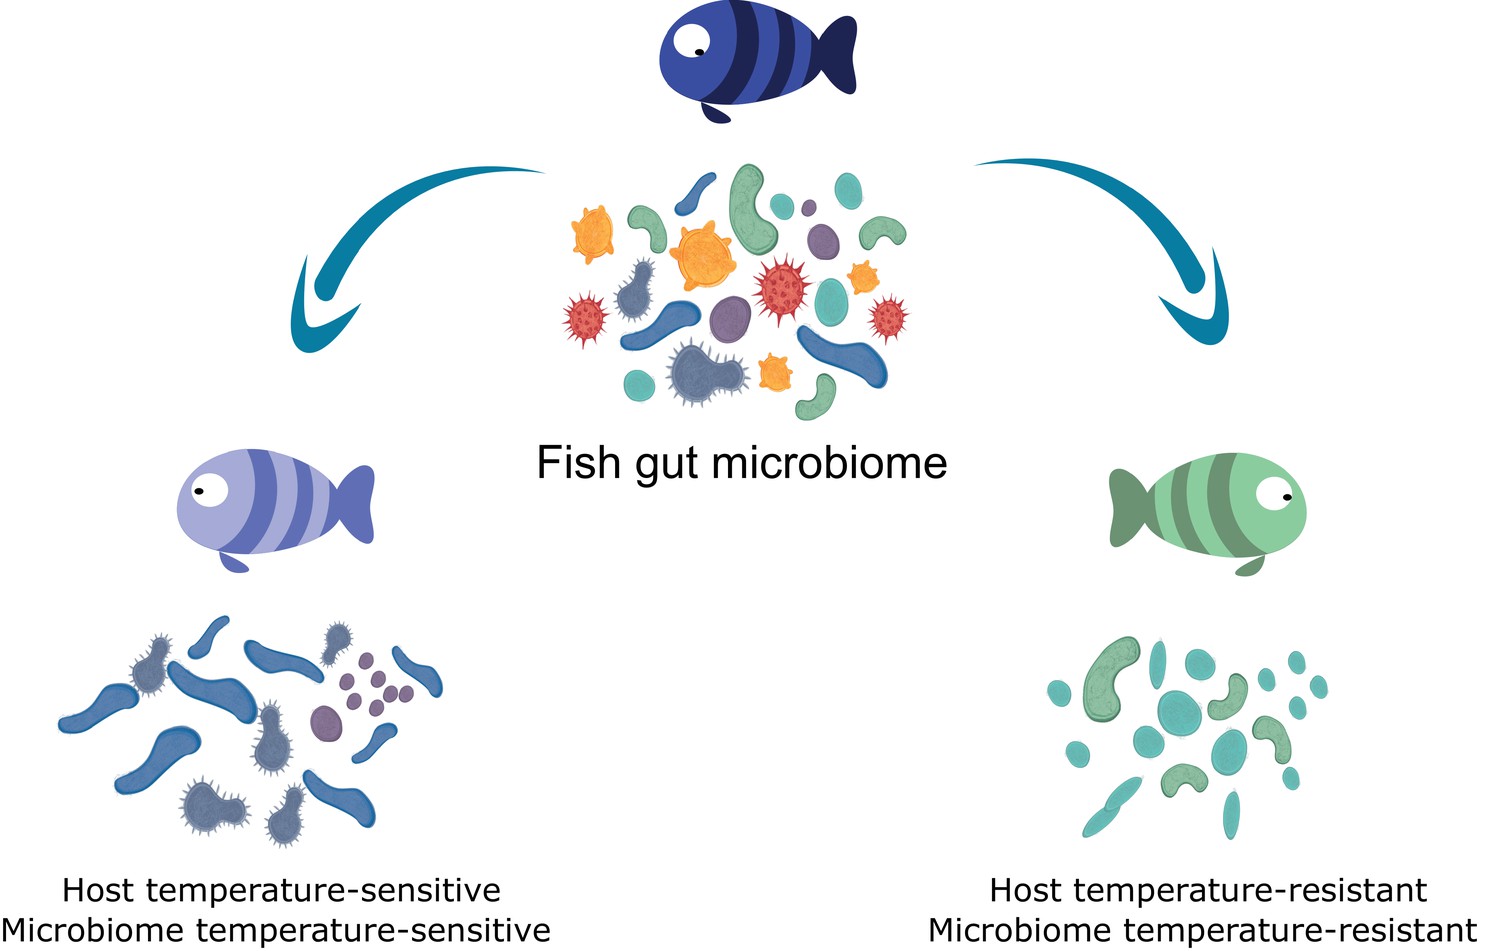
Host cold-tolerant phenotype selection is accompanied by a cold-tolerant gut microbiome.
https://doi.org/10.7554/eLife.36398.022Tables
Table 1
Linear mixed-effects model by restricted maximum likelihood (REML) for temperature and tolerance on richness and diversity.
https://doi.org/10.7554/eLife.36398.014| d.f. | F | P-value | Significant contrasts | ||
|---|---|---|---|---|---|
| Main effects – Richness | |||||
| AIC = 1559.913, BIC = 1578.438, logLik = −773.956 | |||||
| Temperature | 149 | 45.79 | <0.001* | Warm higher than cold | |
| Tolerance – Sensitive | 149 | 5.42 | 0.0213* | Sensitive higher than resistant | |
| Main effects – Diversity (Shannon index H′) | |||||
| AIC = 378.6602, BIC = 397.1857, logLik = −183.3301 | |||||
| Temperature | 149 | 46.43 | <0.001* | Warm higher than cold | |
| Tolerance – Sensitive | 149 | 5.37 | 0.0218* | Sensitive higher than resistant | |
-
*Statistical significance at p < 0.05.
d.f., degrees of freedom; AIC, Akaike information criterion; BIC, Bayesian information criterion; logLik, log of likelihood.
Table 2
Permanova (Adonis) results for experimental communities based on Bray–Curtis distances.
https://doi.org/10.7554/eLife.36398.015| d.f. | SS | MS | PseudoF | R2 | P-value | |
|---|---|---|---|---|---|---|
| Main Effects | ||||||
| Tolerance | 1 | 0.3112 | 0.3112 | 2.2269 | 0.01102 | 0.04* |
| Temperature | 1 | 0.9093 | 0.9093 | 6.5072 | 0.03220 | 0.002** |
| Family | 1 | 0.2601 | 0.2601 | 1.8611 | 0.00921 | 0.110 |
| Part | 1 | 4.0374 | 4.0374 | 28.8936 | 0.14297 | 0.001** |
| Interaction terms | ||||||
| Tolerance x temperature | 1 | 0.5046 | 0.5046 | 3.6113 | 0.01787 | 0.012* |
| Residuals | 159 | 22.2176 | 0.1397 | 0.78674 | ||
| Total | 164 | 28.2401 | 1.00000 |
-
*, **Statistical significance at p < 0.05 and 0.01, respectively. Permutations n = 999.
d.f., degrees of freedom; SS, sum of squares; MS, mean sum of squares.
Additional files
-
Supplementary file 1
Supplementary tables.
- https://doi.org/10.7554/eLife.36398.023
-
Transparent reporting form
- https://doi.org/10.7554/eLife.36398.024
Download links
A two-part list of links to download the article, or parts of the article, in various formats.
Downloads (link to download the article as PDF)
Open citations (links to open the citations from this article in various online reference manager services)
Cite this article (links to download the citations from this article in formats compatible with various reference manager tools)
Host genetic selection for cold tolerance shapes microbiome composition and modulates its response to temperature
eLife 7:e36398.
https://doi.org/10.7554/eLife.36398


