Efficient analysis of mammalian polysomes in cells and tissues using Ribo Mega-SEC
- School of Life Sciences, University of Dundee, United Kingdom
- University of Sydney, Australia
- University of Edinburgh, United Kingdom
Figures
Figure 1 with 5 supplements

Assignment of the peaks separated by a single 2,000 Å SEC column.
(a) The HeLa cell lysate containing 100 μg of RNA was separated into 22 fractions by ultracentrifugation with a 10–45% sucrose density gradient with continuous monitoring of absorbance at 254 nm. (b) Fractions highlighted in blue in (a) were analyzed by SEC with a flow rate of 0.2 ml/min using the 2,000 Å SEC column. The chromatogram of smaller RNPs, 40S, 60S, or 80S monosome is shown. (c) Fractions highlighted in pink in (a) were analyzed by SEC with a flow rate of 0.2 ml/min using the 2,000 Å SEC column. The chromatogram of each polysome fraction is shown. (d) HeLa cell lysate containing 20 μg of RNA was analyzed by SEC using a flow rate of 0.2 ml/min on the 2,000 Å SEC column. The line in the chromatogram is the mean profile and the surrounding ribbon shows the standard deviation across the three technical replicates. The retention time is indicated on the x-axis and the UV absorbance at 260 nm is indicated on the y-axis. The P/M ratio from three technical replicates was also calculated and indicated.
Figure 1—figure supplement 1
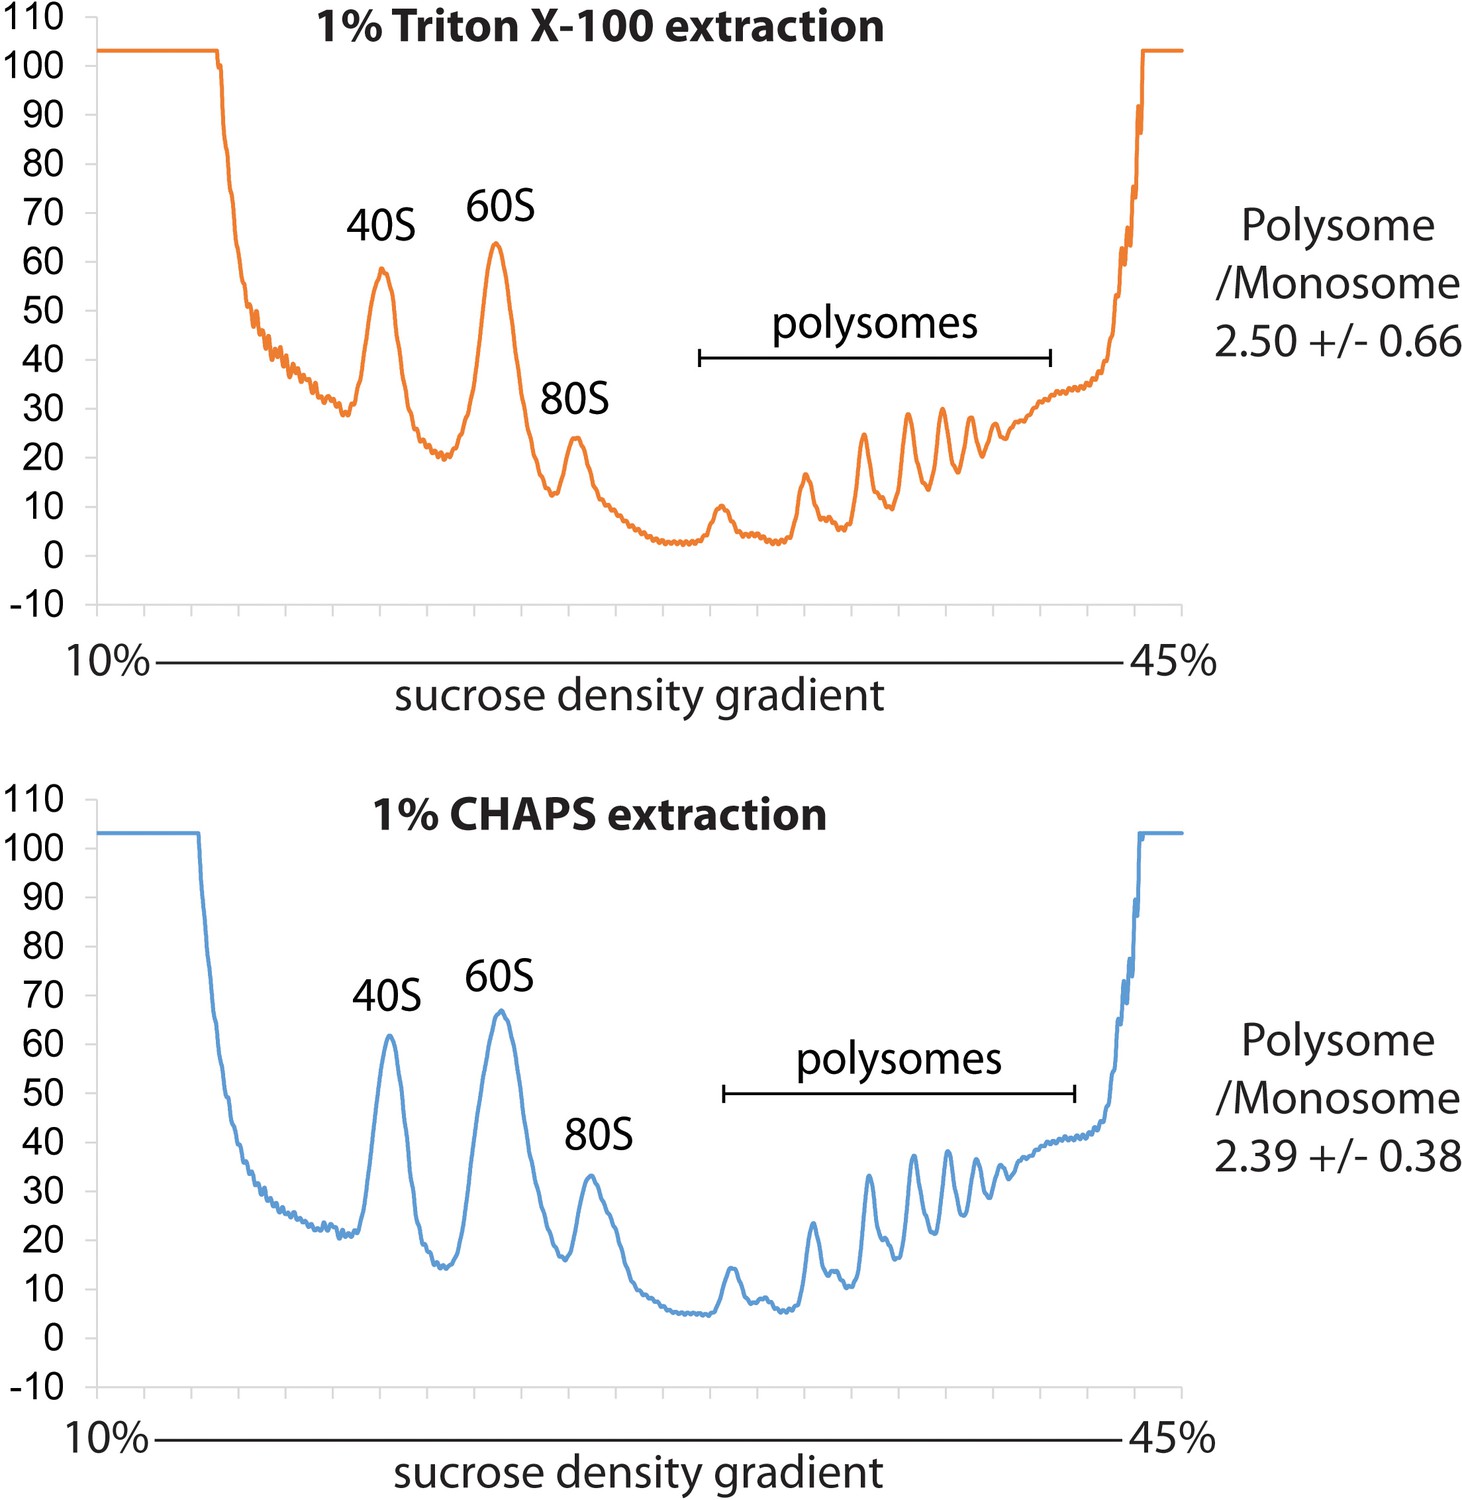
Comparison of the polysome profile from the lysate prepared either by Triton X-100 or CHAPS.
The lysate prepared either by Triton X-100 or CHAPS from HeLa cells was analyzed by ultracentrifugation with 10–45% sucrose density gradient. The absorbance at 254 nm was monitored continuously. The mean of polysome to monosome ratio with standard deviation from two biological replicates is indicated at the left of each chart.
Figure 1—figure supplement 2
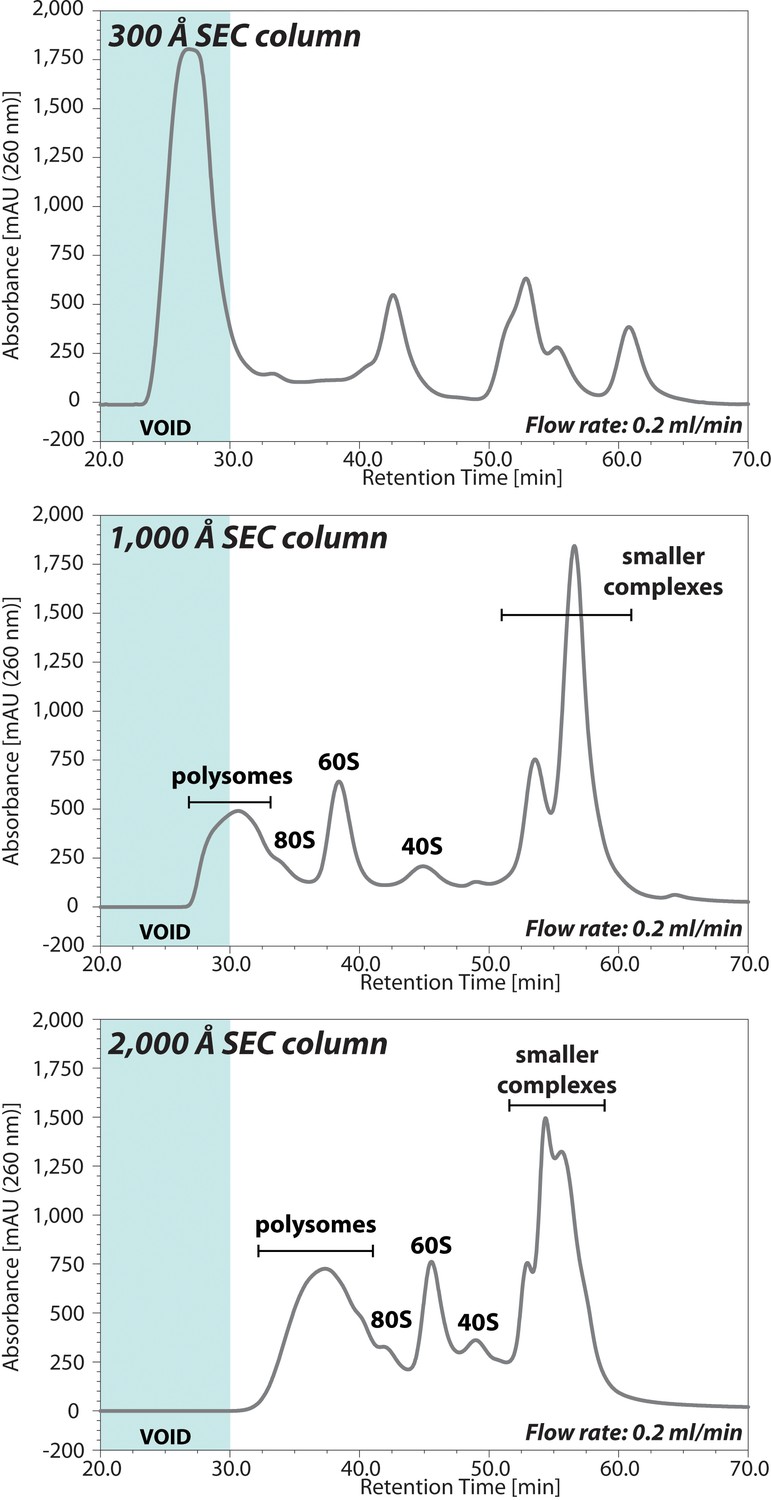
Comparison of the UV chromatograms of polysome profiles for three different pore size columns.
The lysate extracted from HCT116 p53+/+ cells was injected onto three different pore size (300, 1,000, or 2,000 Å) SEC columns. The retention time is indicated on x-axis and the UV absorbance of 260 nm is indicated on y-axis. The area of chromatogram of void volume is highlighted on blue.
Figure 1—figure supplement 3
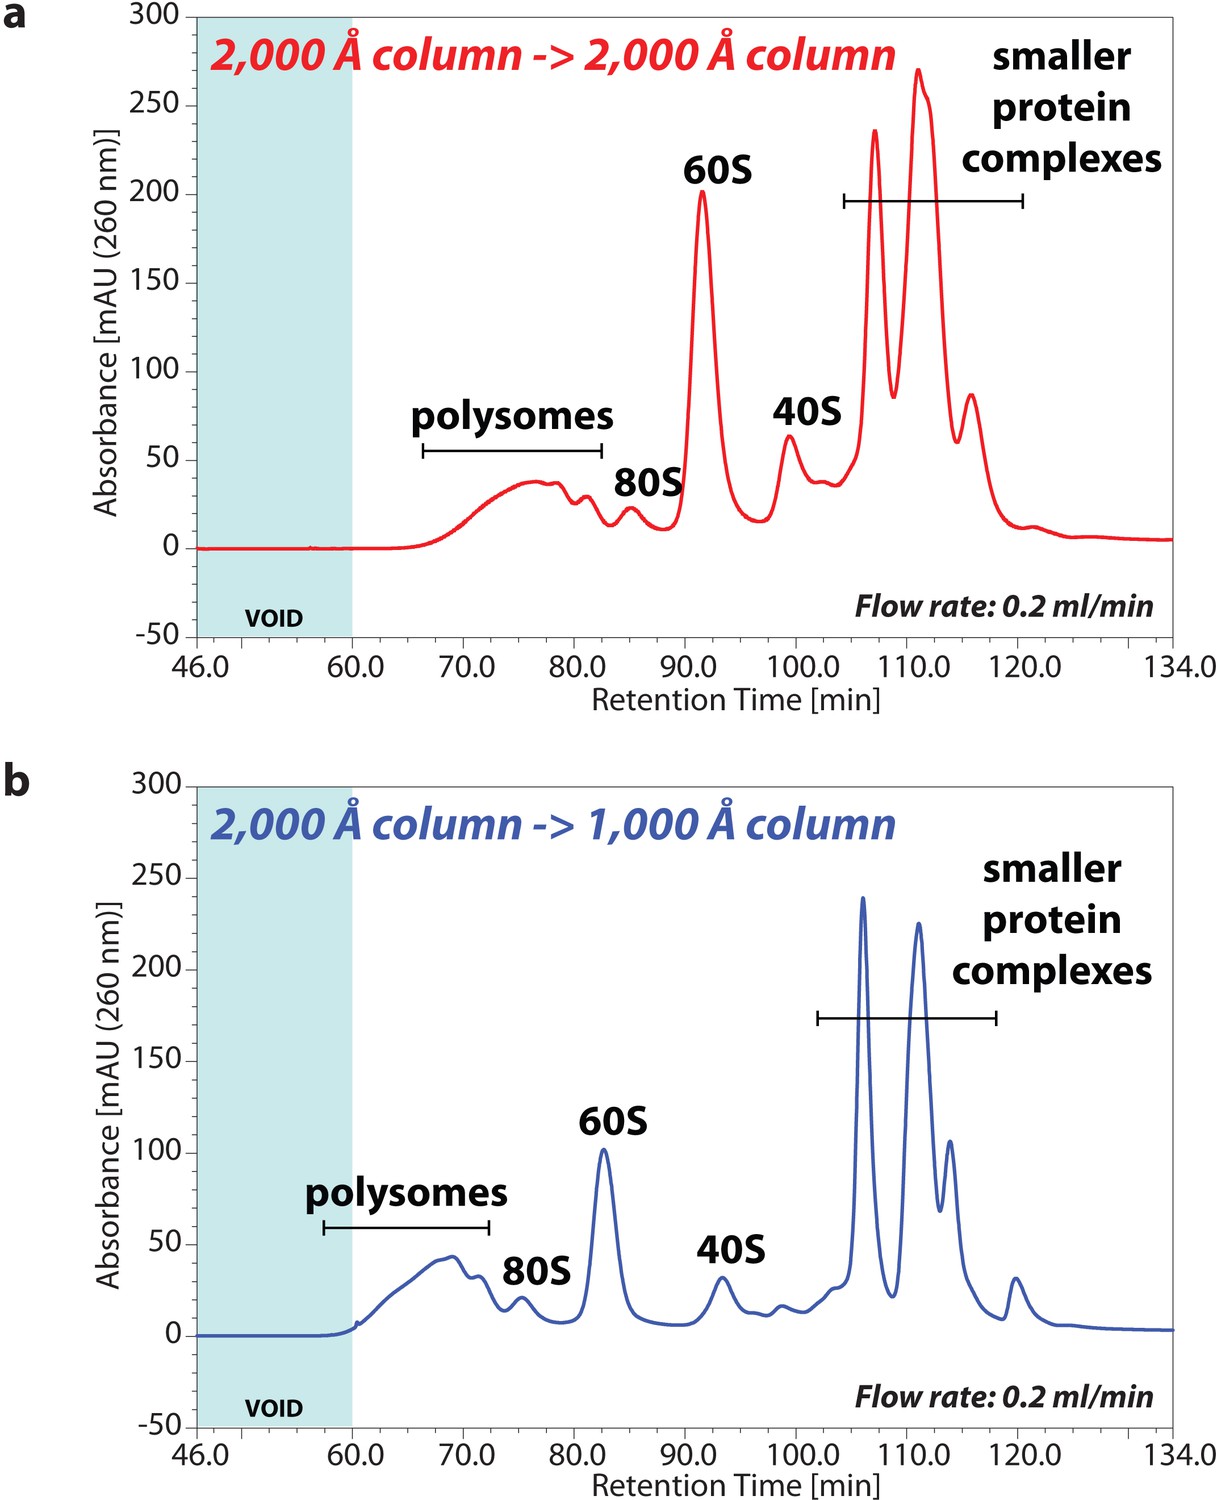
UV chromatogram of polysome profiles by sequential SEC columns.
HeLa cell lysate containing either 80 μg of RNA (a) or 50 μg of RNA (b) was analysed by SEC with the sequential columns; that is (a) two 2,000 Å columns or (b) a 2,000 Å column and a 1,000 Å column, by a flow rate of 0.2 ml/min. The retention time is indicated on x-axis and the UV absorbance of 260 nm is indicated on y-axis. The area of chromatogram of void volume is highlighted on blue.
Figure 1—figure supplement 4
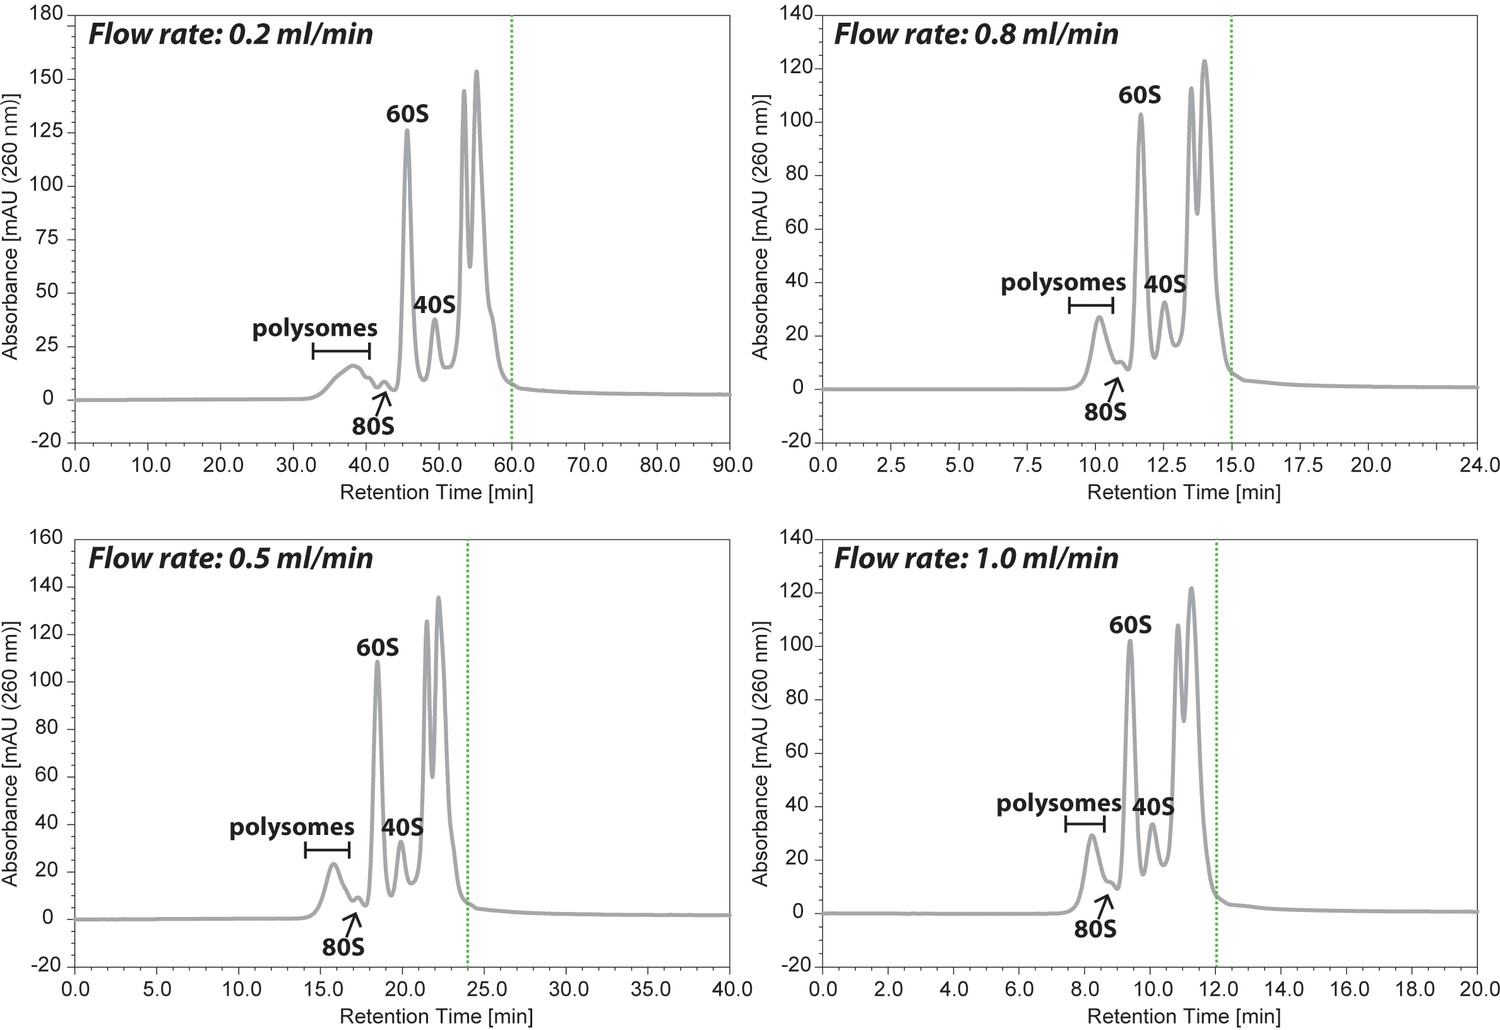
Comparison of the separation profile by the flow rate of 0.2, 0.5, 0.8, or 1.0 ml/ min.
HeLa cell lysate containing 20 μg of RNAs was injected onto the 2,000 Å SEC column and the separation profiles of ribosomes were compared among four different flow rate. Green dash line indicated the time to finish the separation.
Figure 1—figure supplement 5

Comparison of Ribo Mega-SEC chromatograms for the lysates from different cell lines.
The equal amount of the lysate from HeLa, U2OS, HCT116 p53+/+, and HCT116 p53-/- cells was individually injected onto the 2,000 Å SEC column. The retention time is indicated on x-axis and the UV absorbance of 260 nm is indicated on y-axis.
Figure 2 with 3 supplements
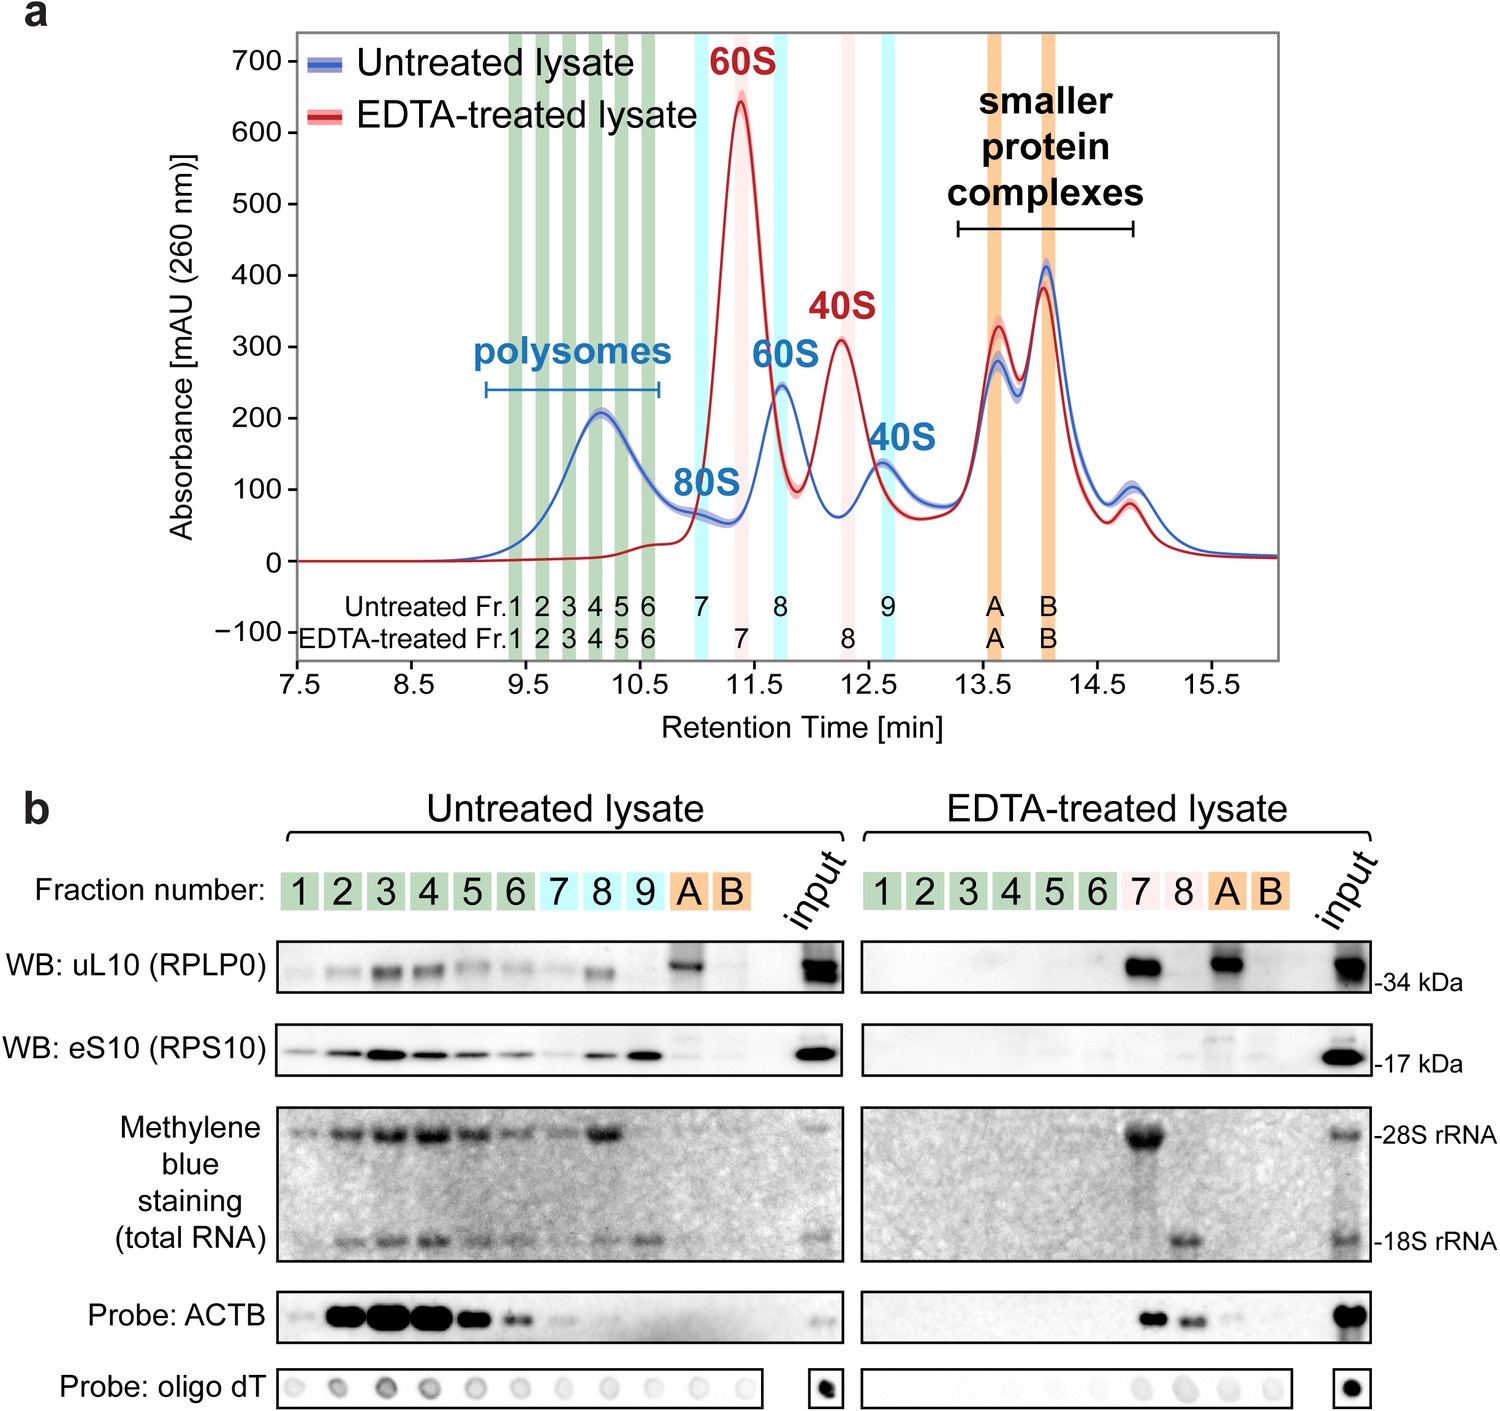
Ribo Mega-SEC chromatograms of polysomes and free ribosomal subunits.
(a) The UV chromatogram of HeLa cell lysates either untreated or treated with 30 mM EDTA (EDTA-treated) is shown. The line is the mean profile and the surrounding ribbon shows the standard deviation across the three biological replicates. The collected fractions (Fr.) are highlighted and numbered. The retention time is indicated on the x-axis and the UV absorbance of 260 nm is indicated on the y-axis. (b) The fractions were analyzed either by western blotting (WB) with the indicated primary antibodies, or by northern blotting with the probes indicated at the left. Methylene blue staining visualized rRNAs. Input: 20 μg of protein and 2 μg of RNA for Methylene blue staining and detecting ACTB mRNA or 250 ng of RNA for detecting polyA(+) mRNA, loaded for WB and NB, respectively.
Figure 2—figure supplement 1
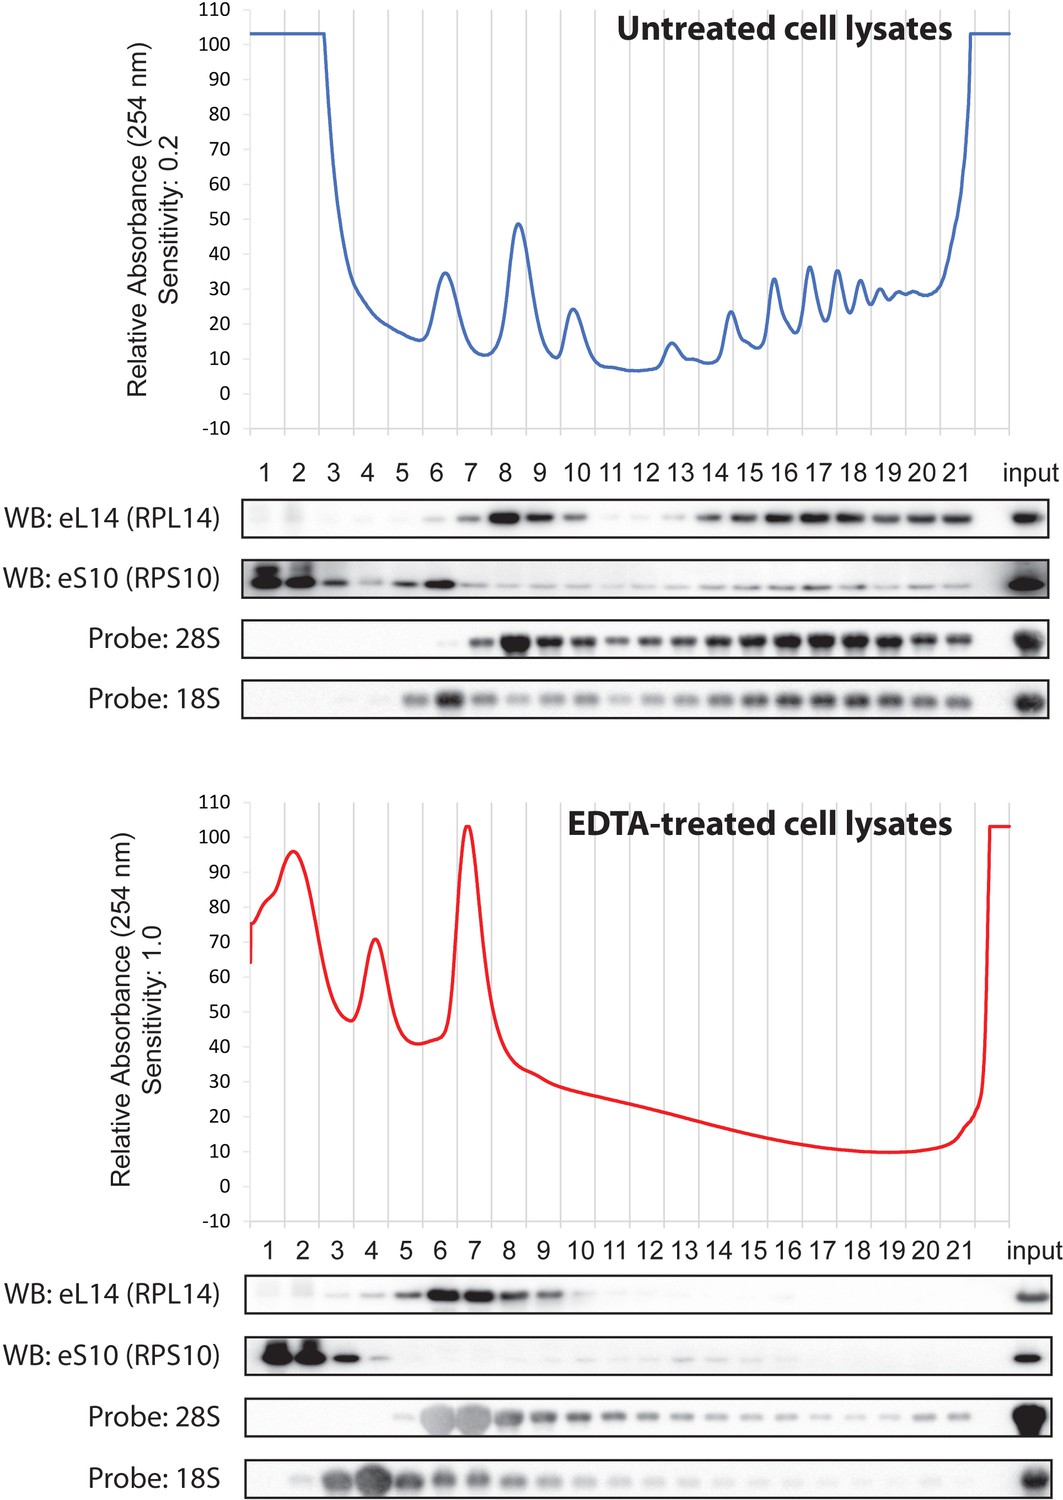
Polysome profile of untreated or EDTA-treated cell lysates by SDG analysis.
HeLa cell lysate containing 100 μg of RNA treated with or without EDTA was separated into 21 fractions by ultracentrifugation with a 10–45% sucrose density gradient. The absorbance at 254 nm was monitored continuously. Proteins in each fraction were analyzed by western blotting with the antibodies indicated at the left. RNAs in each fraction were also separated by agarose gel electrophoresis, transferred to a membrane, and hybridized with the biotin-labelled probes indicated at the left. Input: 20 μg of protein and 2 μg of RNA were loaded for western and northern blotting, respectively.
Figure 2—figure supplement 2

Ribo Mega-SEC chromatogram and fractions collected (Figure 2A).
The UV chromatogram of HeLa cell lysate either untreated or treated with 30 mM EDTA (EDTA-treated) from one of three biological replicates was shown. 48 fractions numbered at the top of chromatogram were collected from polysomes to smaller protein complexes and the fractions analysed by western and northern blotting shown in Figure 2B were highlighted and numbered at the bottom of chromatogram. The retention time is indicated on x-axis and the UV absorbance of 260 nm is indicated on y-axis.
Figure 2—figure supplement 3
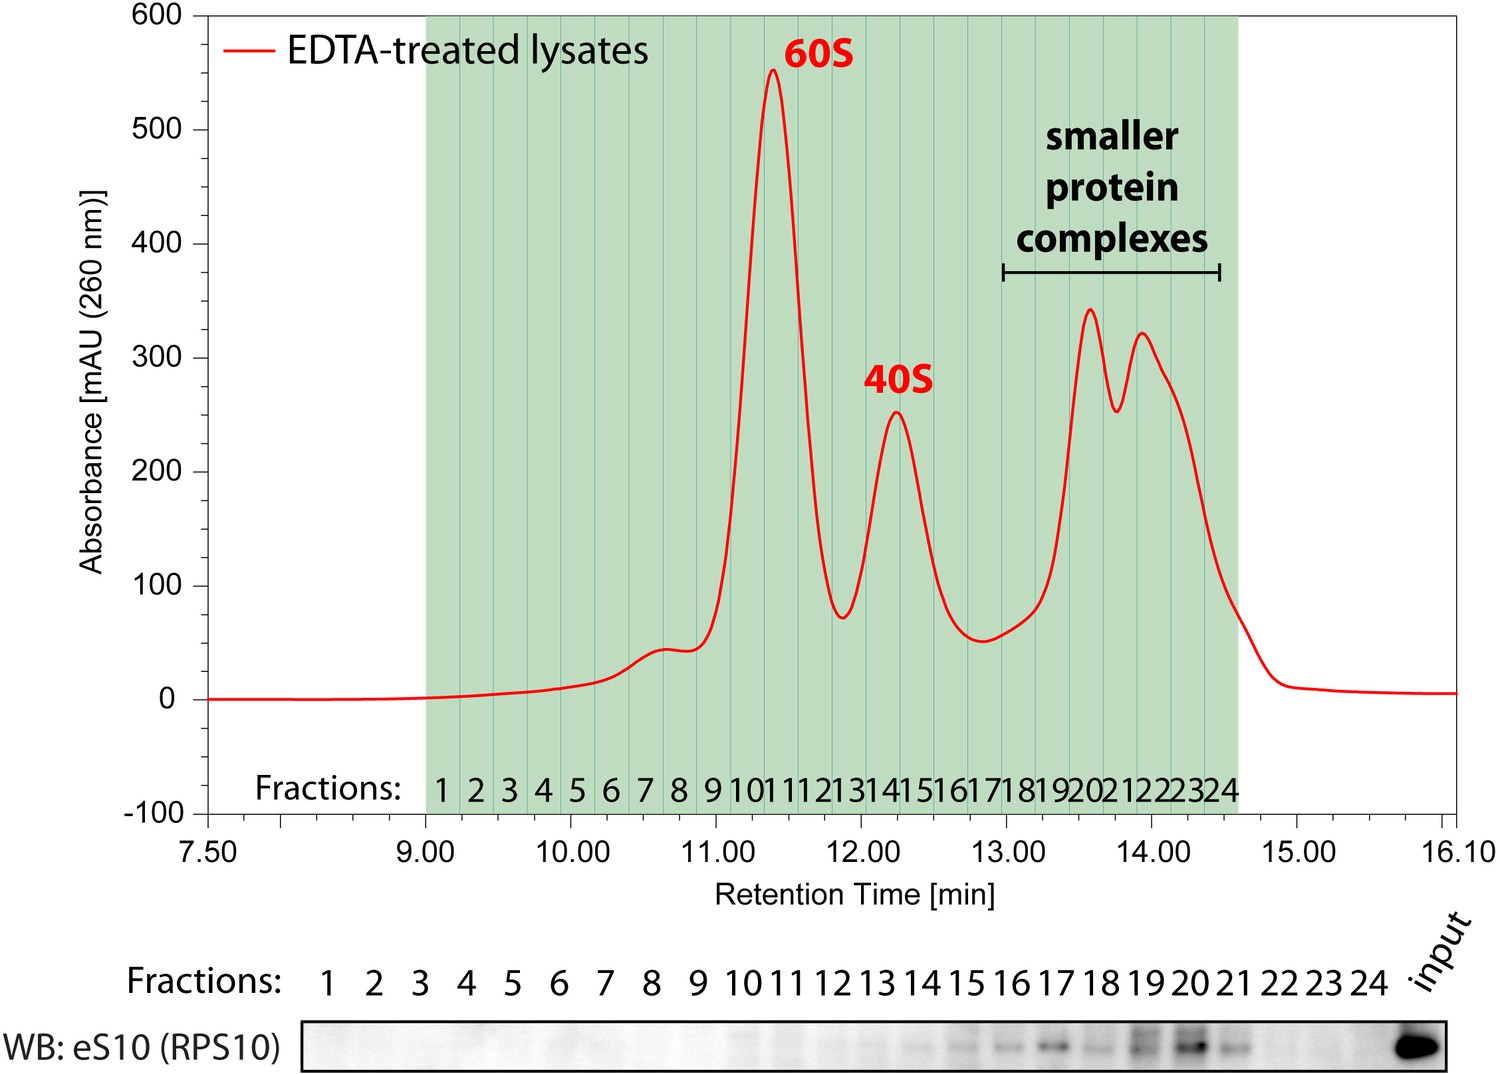
Western blotting with anti-eS10 antibody across the fractions separated from EDTA-treated cell lysates.
HeLa cell lysate treated with EDTA was separated into 24 fractions by Ribo Mega-SEC and the fractions were analyzed by western blotting with anti-eS10 antibody. Input: 20 μg of protein was loaded.
Figure 3 with 2 supplements
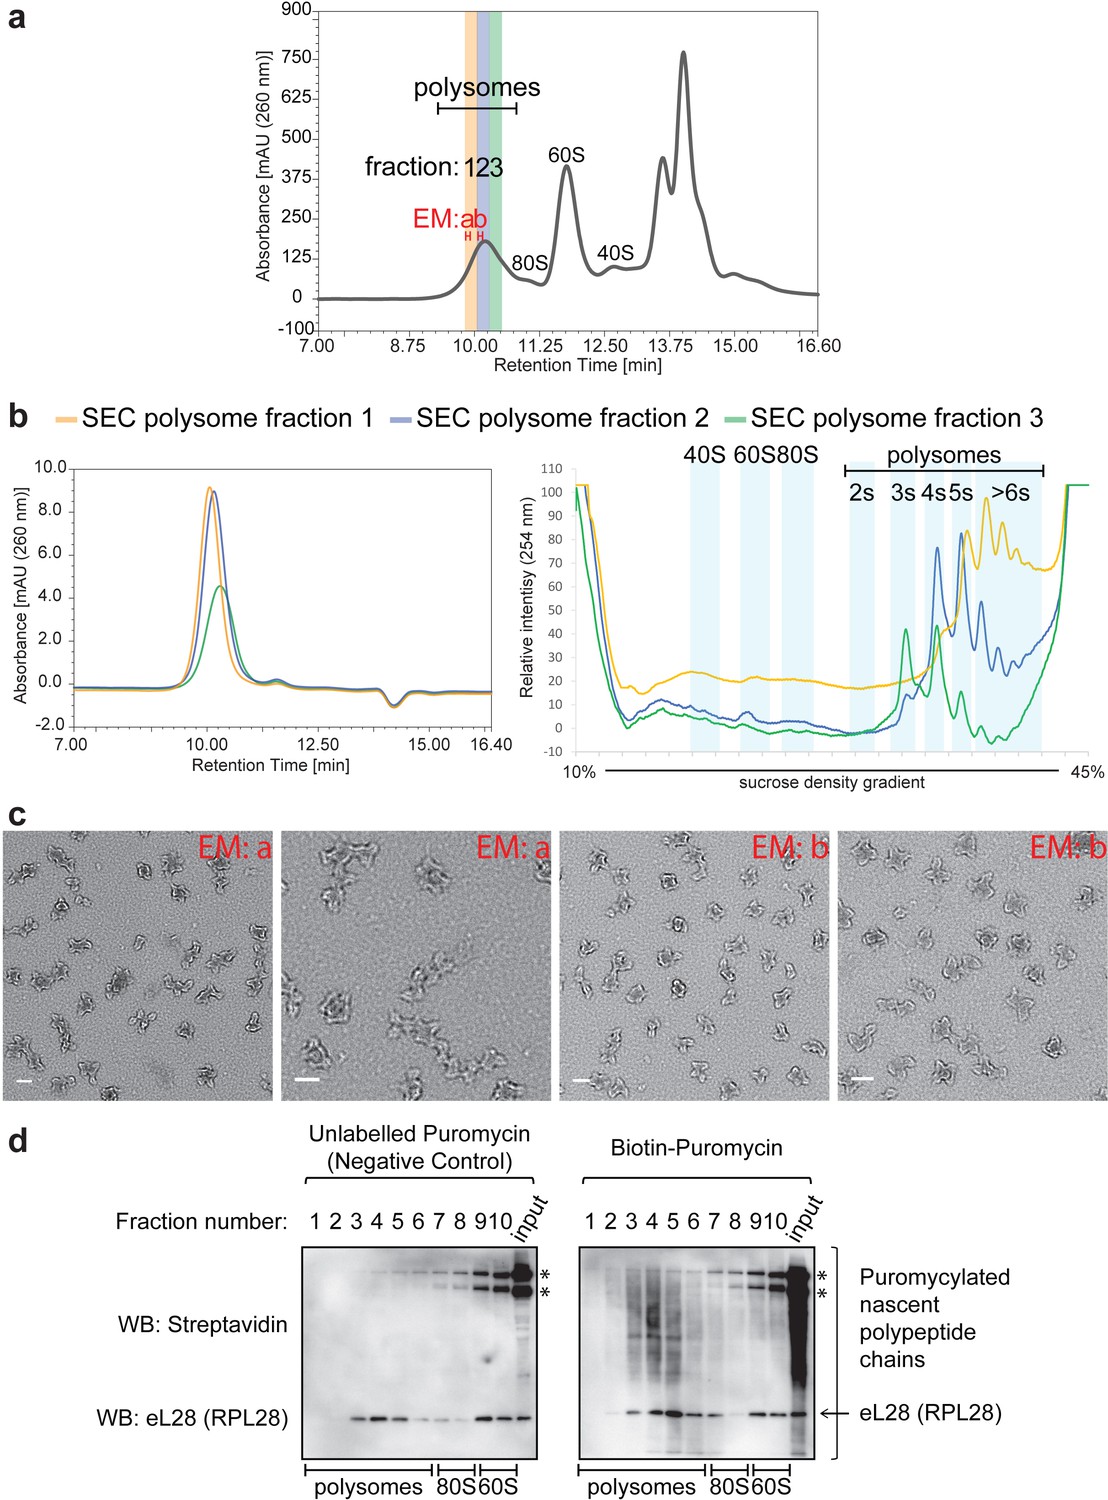
Stability of polysomes isolated by Ribo Mega-SEC.
(a) Fractions analyzed by the subsequent SDG analysis are numbered and highlighted in colors (yellow, blue, and green) in the Ribo Mega-SEC profile of HeLa cell lysate. Fractions analyzed by the subsequent EM analysis are termed as ‘EM a’ and ‘EM b’. The retention time is indicated on the x-axis and the UV absorbance of 260 nm is indicated on the y-axis. (b) Each fraction in (a) was analyzed by ultracentrifugation with a 10% to 45% sucrose density gradient. The regions where ribosomal subunits (40S, 60S and 80S) and the number of ribosomes (2 s, 3 s, 4 s, 5 s and >6 s) in polysomes sediment are labeled. (c) Fractions labeled as ‘EM a’ and ‘EM b’ in (a) were analyzed by EM analysis. Scale bar showing 100 nm is indicated at the bottom left in each image. (d) Each fraction in Figure 3—figure supplement 2 was incubated with either unlabelled puromycin (Negative control), or biotin-labelled puromycin. The biotin-puromycylated nascent polypeptide chains and eL28 (RPL28) were detected by WB with streptavidin and anti-RPL28 antibody. *endogenous biotinylated proteins. Input: 20 μg of protein in lysates incubated with either unlabeled puromycin, or biotin-labeled puromycin was loaded.
Figure 3—figure supplement 1
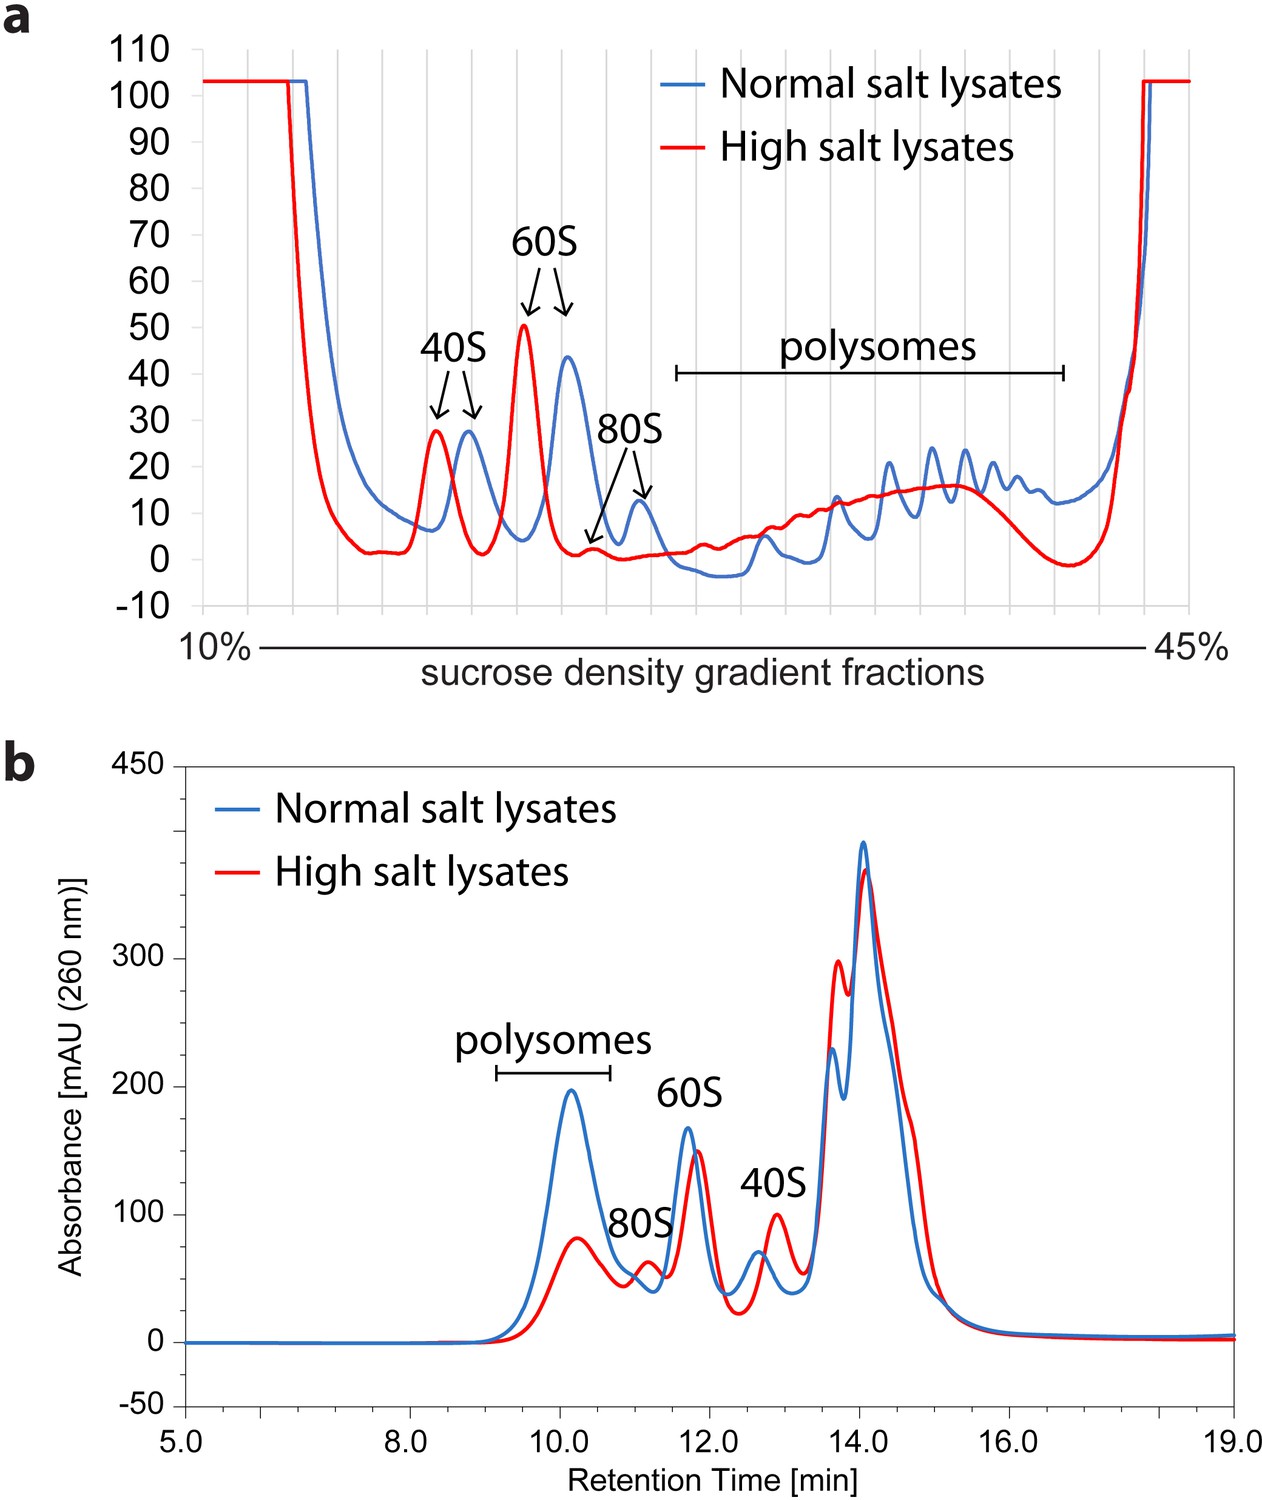
Comparison of polysome profiles of lysates extracted either by normal salt or by high-salt containing buffer.
HeLa cell lysate extracted by normal salt or by high-salt containing buffer was analyzed by SDG (a) or by SEC (b).
Figure 3—figure supplement 2
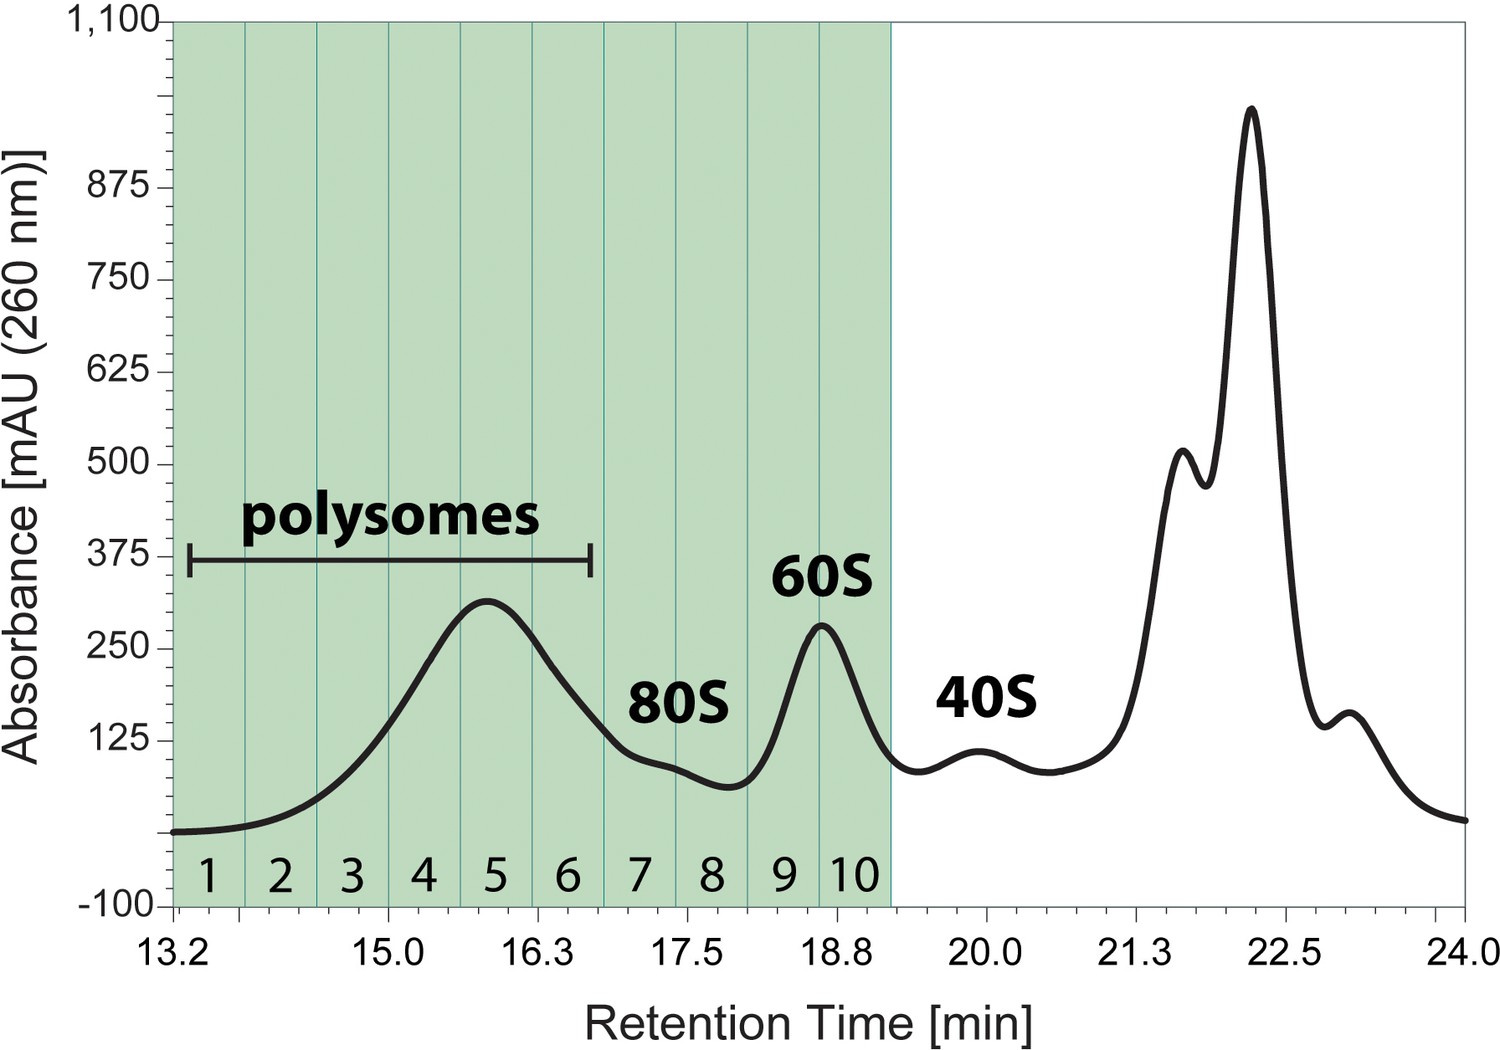
Ribo Mega-SEC profile for in vitro puromycylation (Figure 3D).
10 fractions from polysomes to 60S subunits highlighted in green were collected by the flow rate of 0.5 ml/min of Ribo Mega-SEC HPLC run and subjected to in vitro puromycylation. The retention time is indicated on x-axis and the UV absorbance of 260 nm is indicated on y-axis.
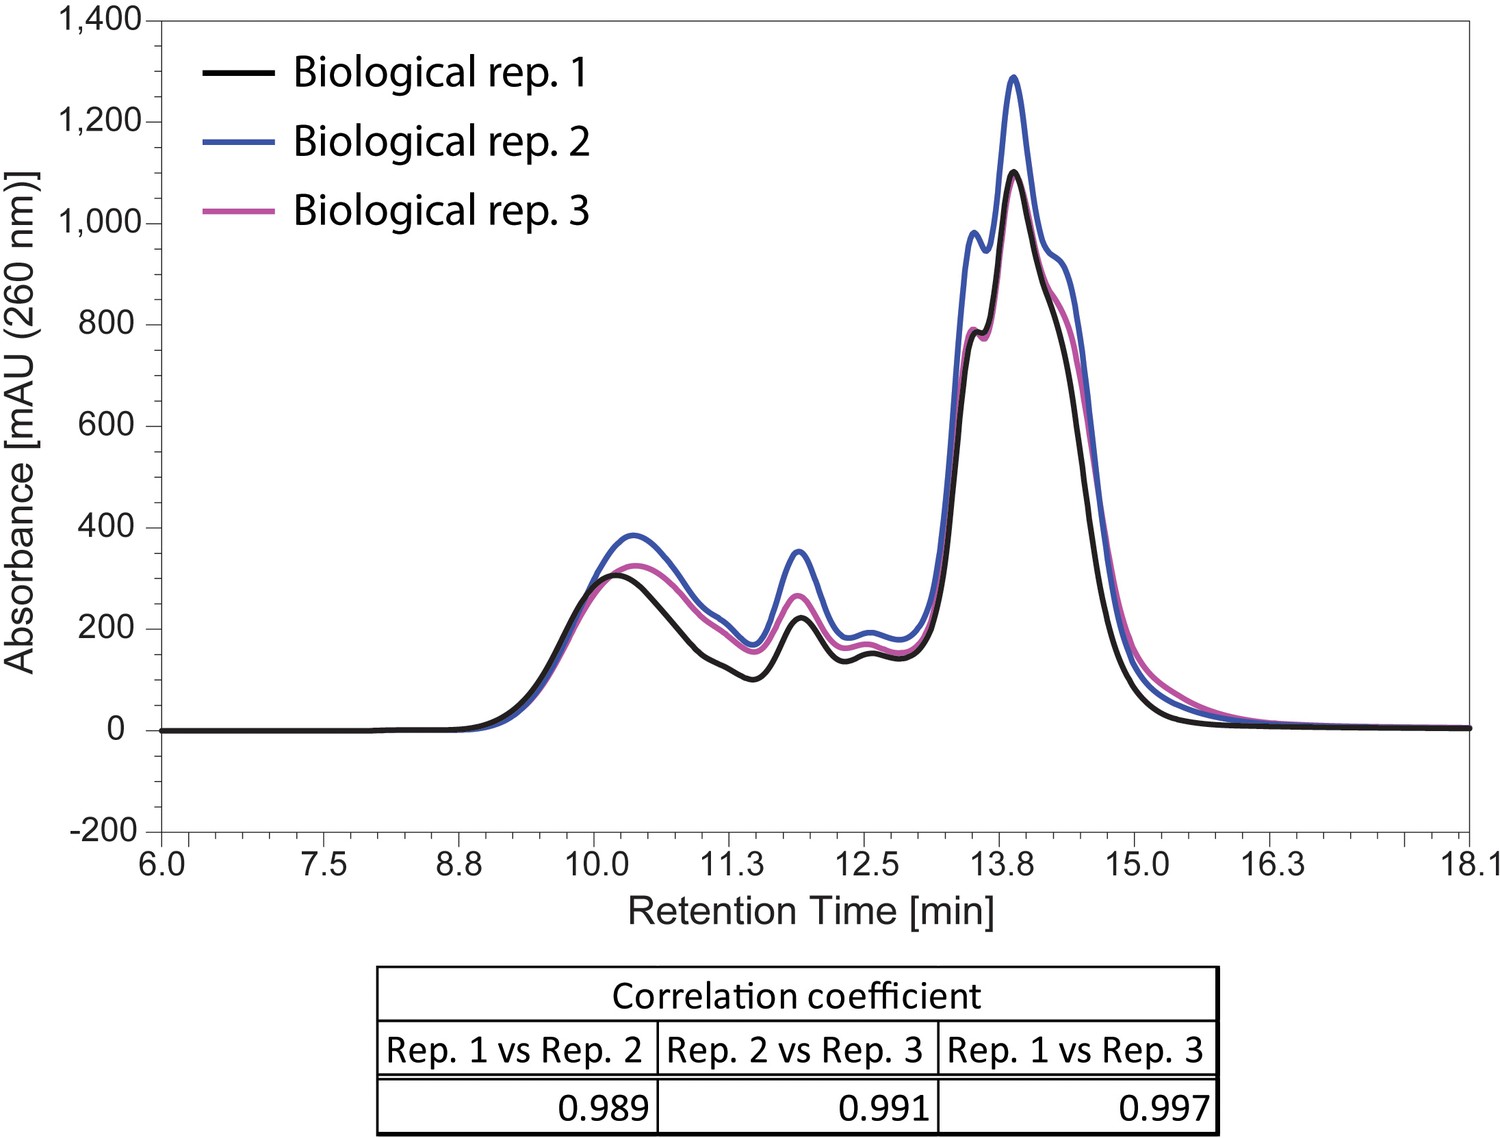
Figure 4 with 1 supplement
Reproducibility of Ribo Mega-SEC and SDG analysis.
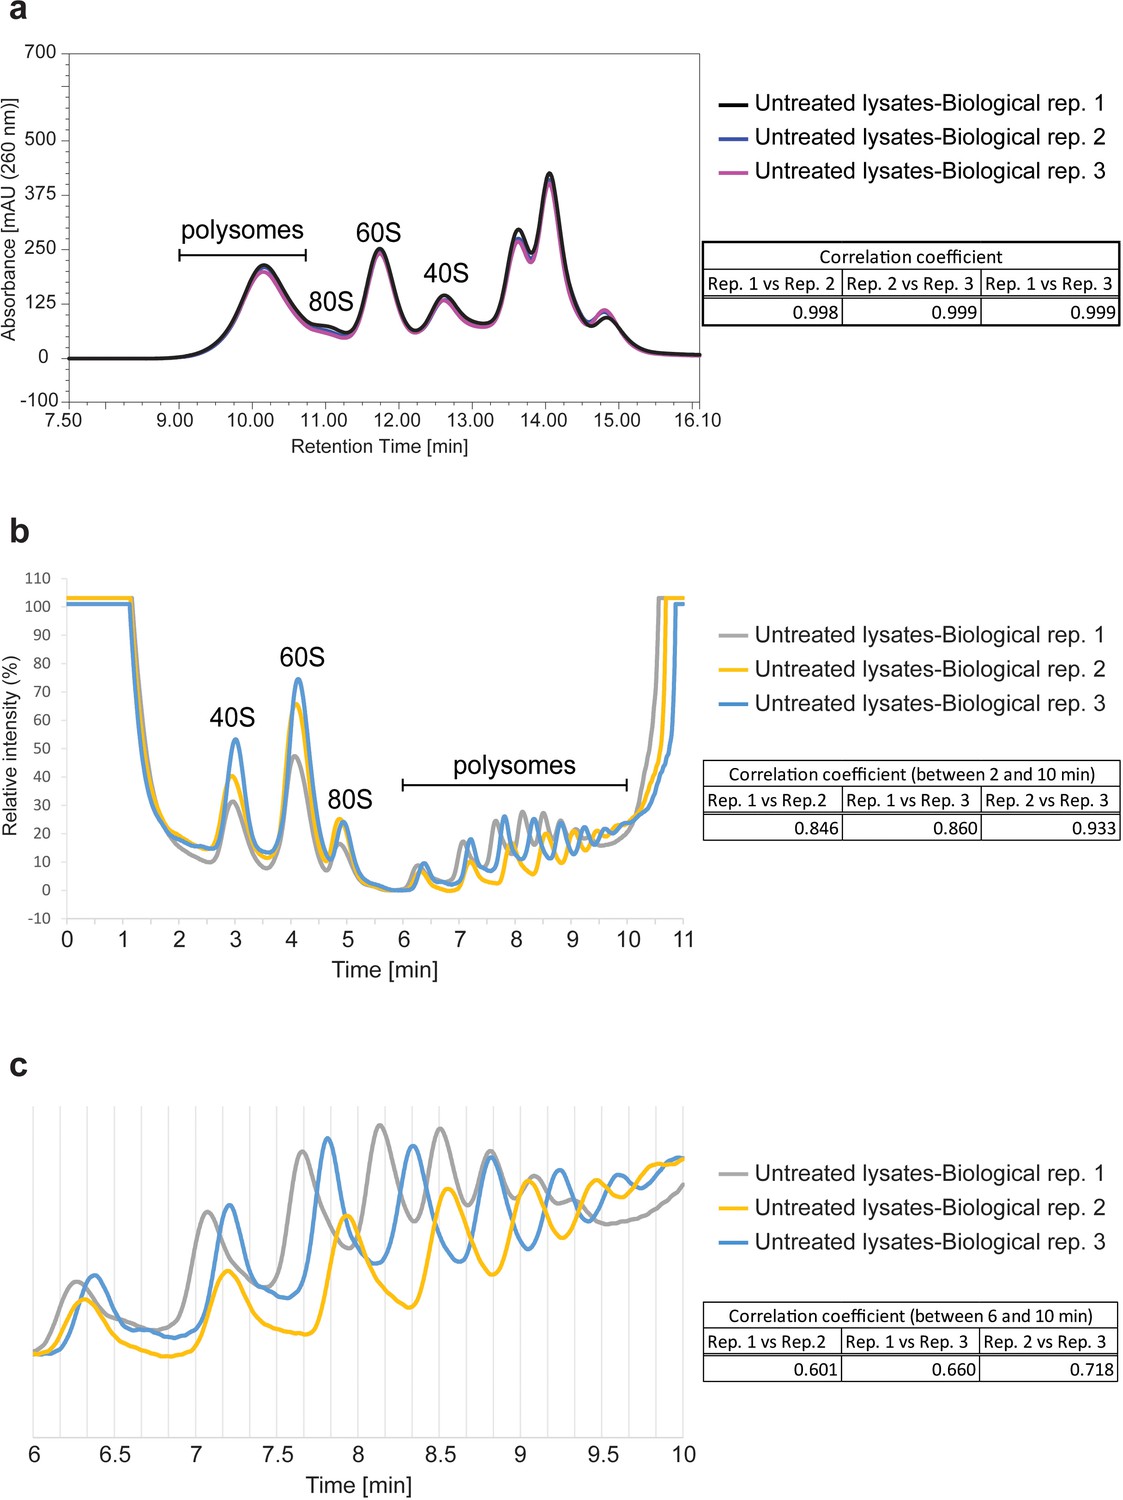
(a) The UV chromatograms of Ribo Mega-SEC from the three biological replicates of untreated cell lysates were showed. The retention time is indicated on the x-axis and the UV absorbance of 260 nm is indicated on the y-axis. The Pearson correlation coefficient calculated for the three biological replicates between 8.0 min and 16.1 min (replicate 1 versus replicate 2, replicate 1 versus replicate 3, and replicate 2 versus replicate 3) was also indicated at the right. (b) The polysome profiles of SDG analysis from the three biological replicates of untreated cell lysates are shown. The time is indicated on the x-axis and the UV absorbance of 254 nm is indicated on the y-axis. The Pearson correlation coefficient calculated for the three biological replicates between 2.0 min and 10.0 min (replicate 1 versus replicate 2, replicate 1 versus replicate 3, and replicate 2 versus replicate 3) is also indicated at the right. (c) The polysome region from 6.0 min to 10.0 min in (b) was expanded and the Pearson correlation coefficient was calculated between these time points.
Figure 4—figure supplement 1
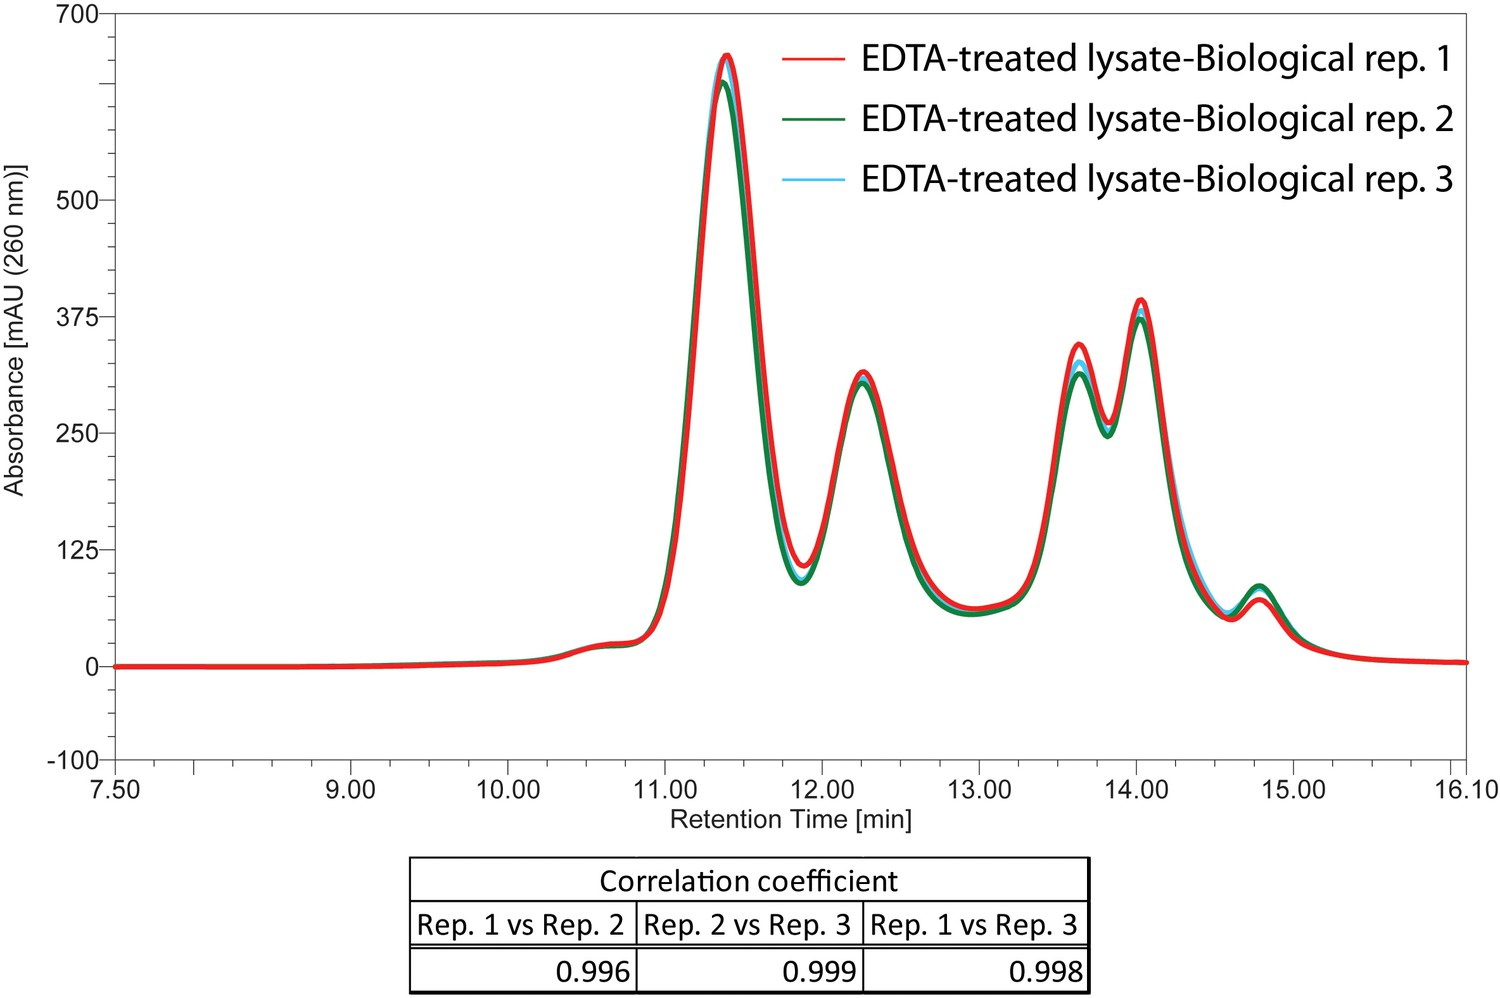
The three biological replicates showing elution profiles of EDTA-treated cell lysates by Ribo Mega-SEC.
The UV chromatograms from the three biological replicates of EDTA-treated cell lysate were showed. The retention time is indicated on x-axis and the UV absorbance of 260 nm is indicated on y-axis. The Pearson correlation coefficient calculated for the three biological replicates between 8.0 min and 16.1 min (replicate 1 versus replicate 2, replicate 1 versus replicate 3, and replicate 2 versus replicate 3) was also indicated at the bottom of chromatogram.
Figure 5
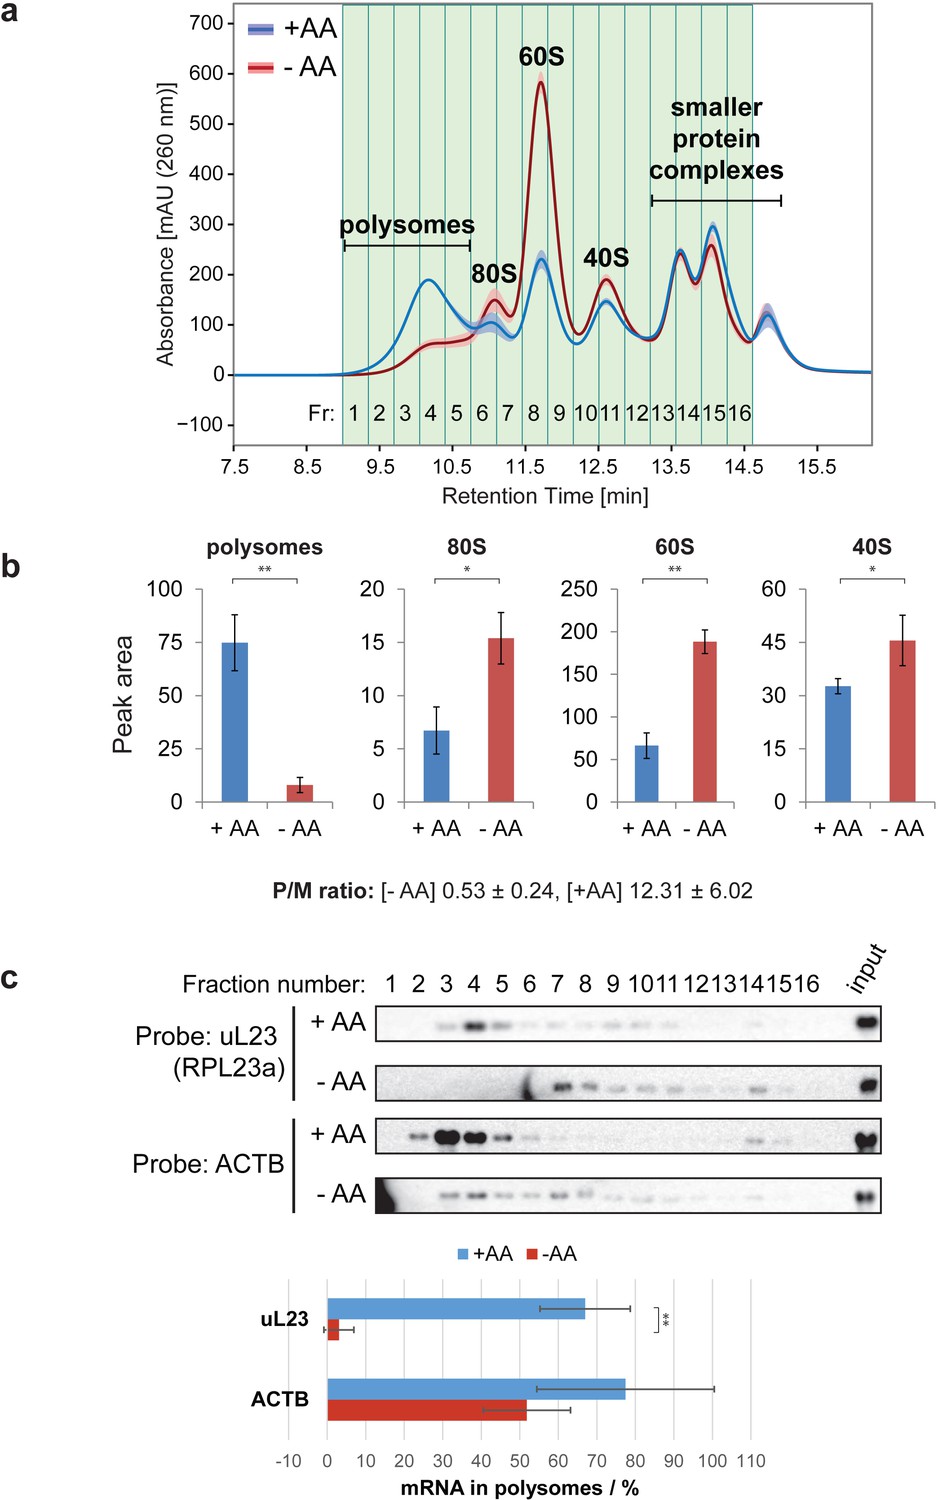
Ribo Mega-SEC profile with or without amino acid starvation.
(a) Sixteen fractions separated from the lysates of HeLa cells grown in EBSS, either with (+AA), or without (-AA), exogenous amino acids for 2 hr, were collected. The line is the mean profile and the surrounding ribbon shows the standard deviation across the three biological replicates. The collected fractions (Fr.) are highlighted and numbered. The retention time is indicated on the x-axis and the UV absorbance of 260 nm is indicated on the y-axis. (b) The area of each peak of either polysomes, or free ribosomal subunits, was quantified and graphed. The values are mean (±standard deviation) of three biological replicates. *p<0.05, **p<0.01. The P/M ratio from three biological replicates was also calculated and indicated. (c) The fractions were analyzed by northern blotting with the probes indicated at the left. Input: 2 μg of RNA from the lysate was loaded. Quantifications of the fraction (in percent of the total amount) of uL23 and ACTB mRNAs found in the polysome fractions were performed and the graphs are shown at the bottom. The values are mean (±standard deviation) of three biological replicates. **p<0.01.
Figure 6 with 3 supplements
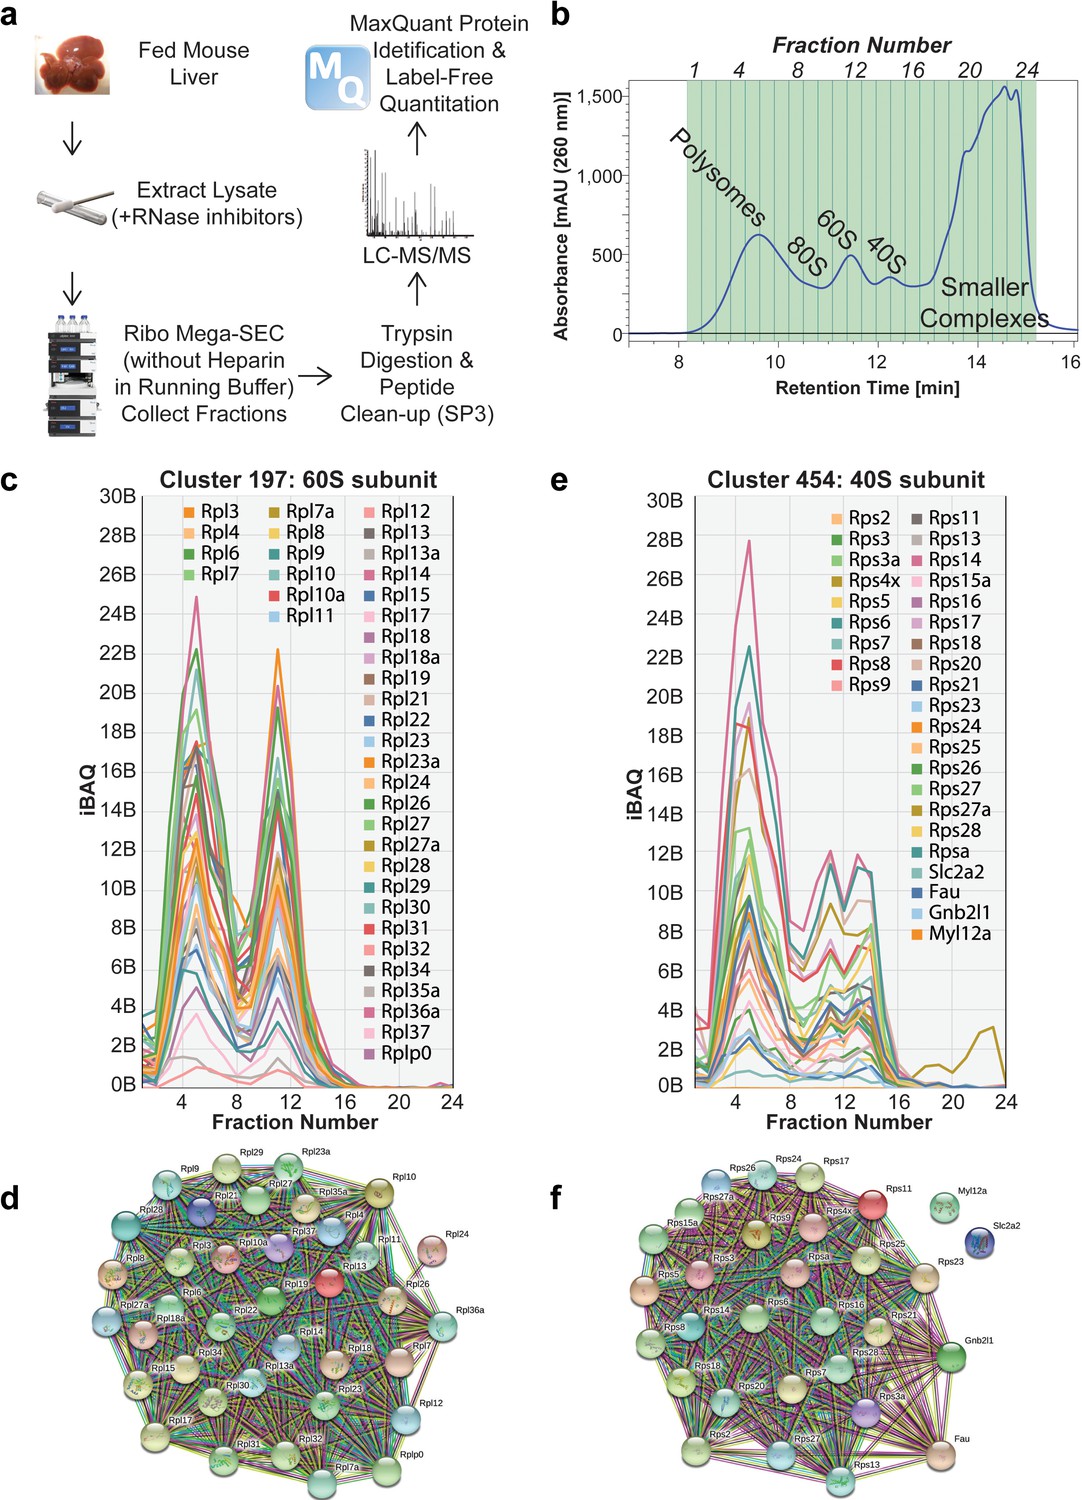
Proteomic analysis of Ribo Mega-SEC fractions from mouse liver tissue.
(a) Workflow for Ribo Mega-SEC analysis of mouse liver tissue and LC-MS/MS methodology. (b) Ribo Mega-SEC profile of mouse liver tissue. The collected fractions are highlighted and numbered at the top of the chromatogram. The retention time is indicated on the x-axis and the UV absorbance of 260 nm is indicated on the y-axis. (c) Ribo Mega-SEC elution profiles for all proteins identified in example cluster 197 were displayed as line graphs with the mean iBAQ intensity (y-axis) plotted against each elution fraction (x-axis). (d) STRING interaction network for proteins identified in example cluster 197. (e) Ribo Mega-SEC elution profiles for all proteins identified in example cluster 454 were displayed as line graphs with the mean iBAQ intensity (y-axis) plotted against each elution fraction (x-axis). (f) STRING interaction network for proteins identified in example cluster 454.
Figure 6—figure supplement 1
The three biological replicates of the elution profile of mouse liver extract analysed by Ribo Mega-SEC.
The UV chromatograms from the three biological replicates of the extract from mouse liver tissue were showed. The retention time is indicated on x-axis and the UV absorbance of 260 nm is indicated on y-axis. The Pearson correlation coefficient calculated for the three biological replicates between 8.0 min and 16.1 min (replicate 1 versus replicate 2, replicate 1 versus replicate 3, and replicate 2 versus replicate 3) was also indicated at the bottom of chromatogram.
Figure 6—figure supplement 2
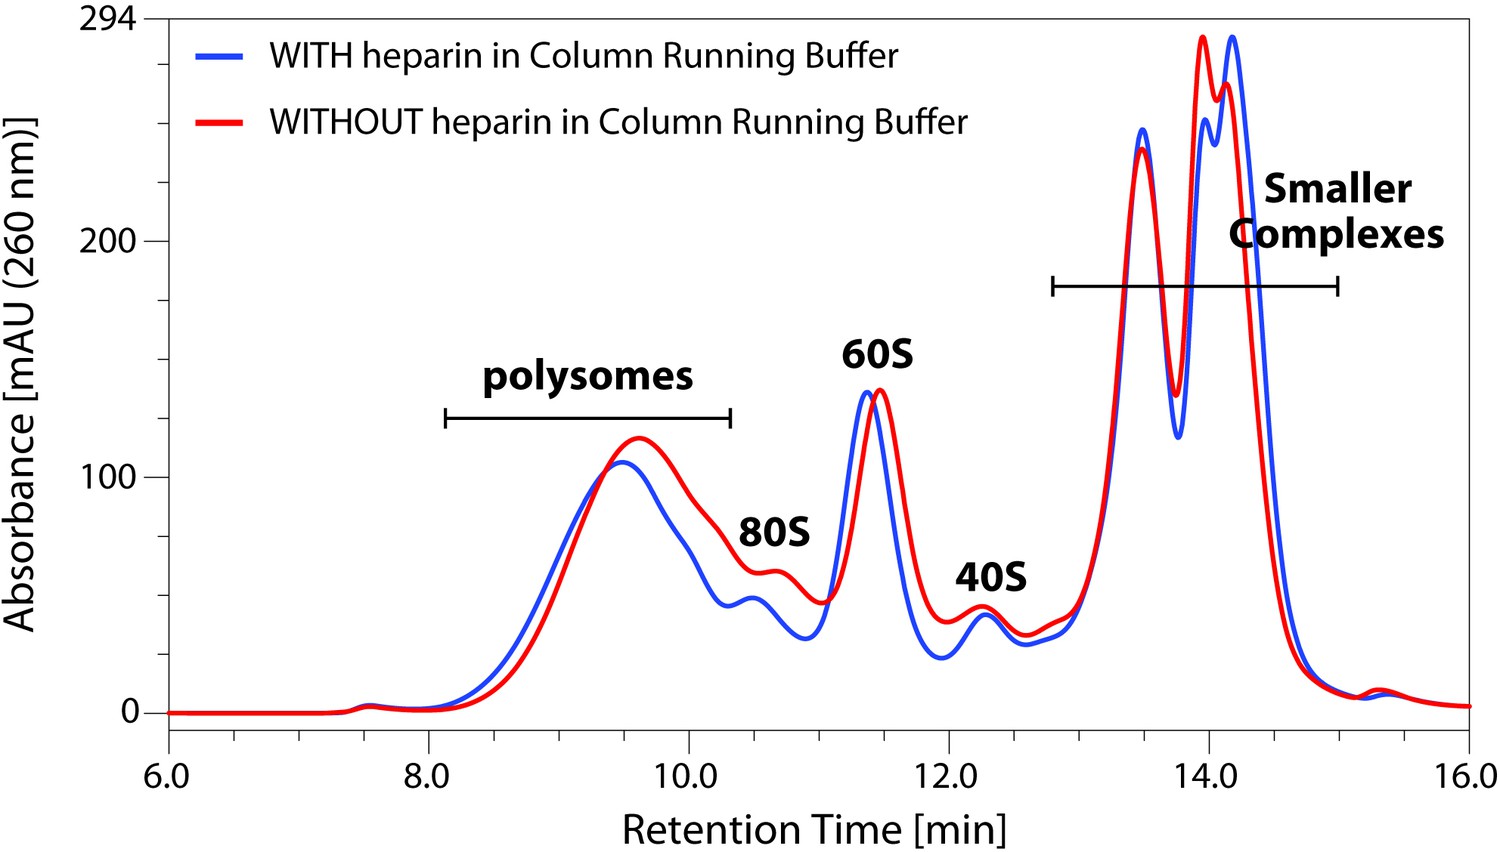
Comparison of Ribo Mega-SEC profiles using a mobile phase with or without heparin.
Mouse liver tissue extracts were analyzed by Ribo Mega-SEC using mobile phase with or without heparin. The retention time is indicated on x-axis and the UV absorbance of 260 nm is indicated on y-axis.
Figure 6—figure supplement 3
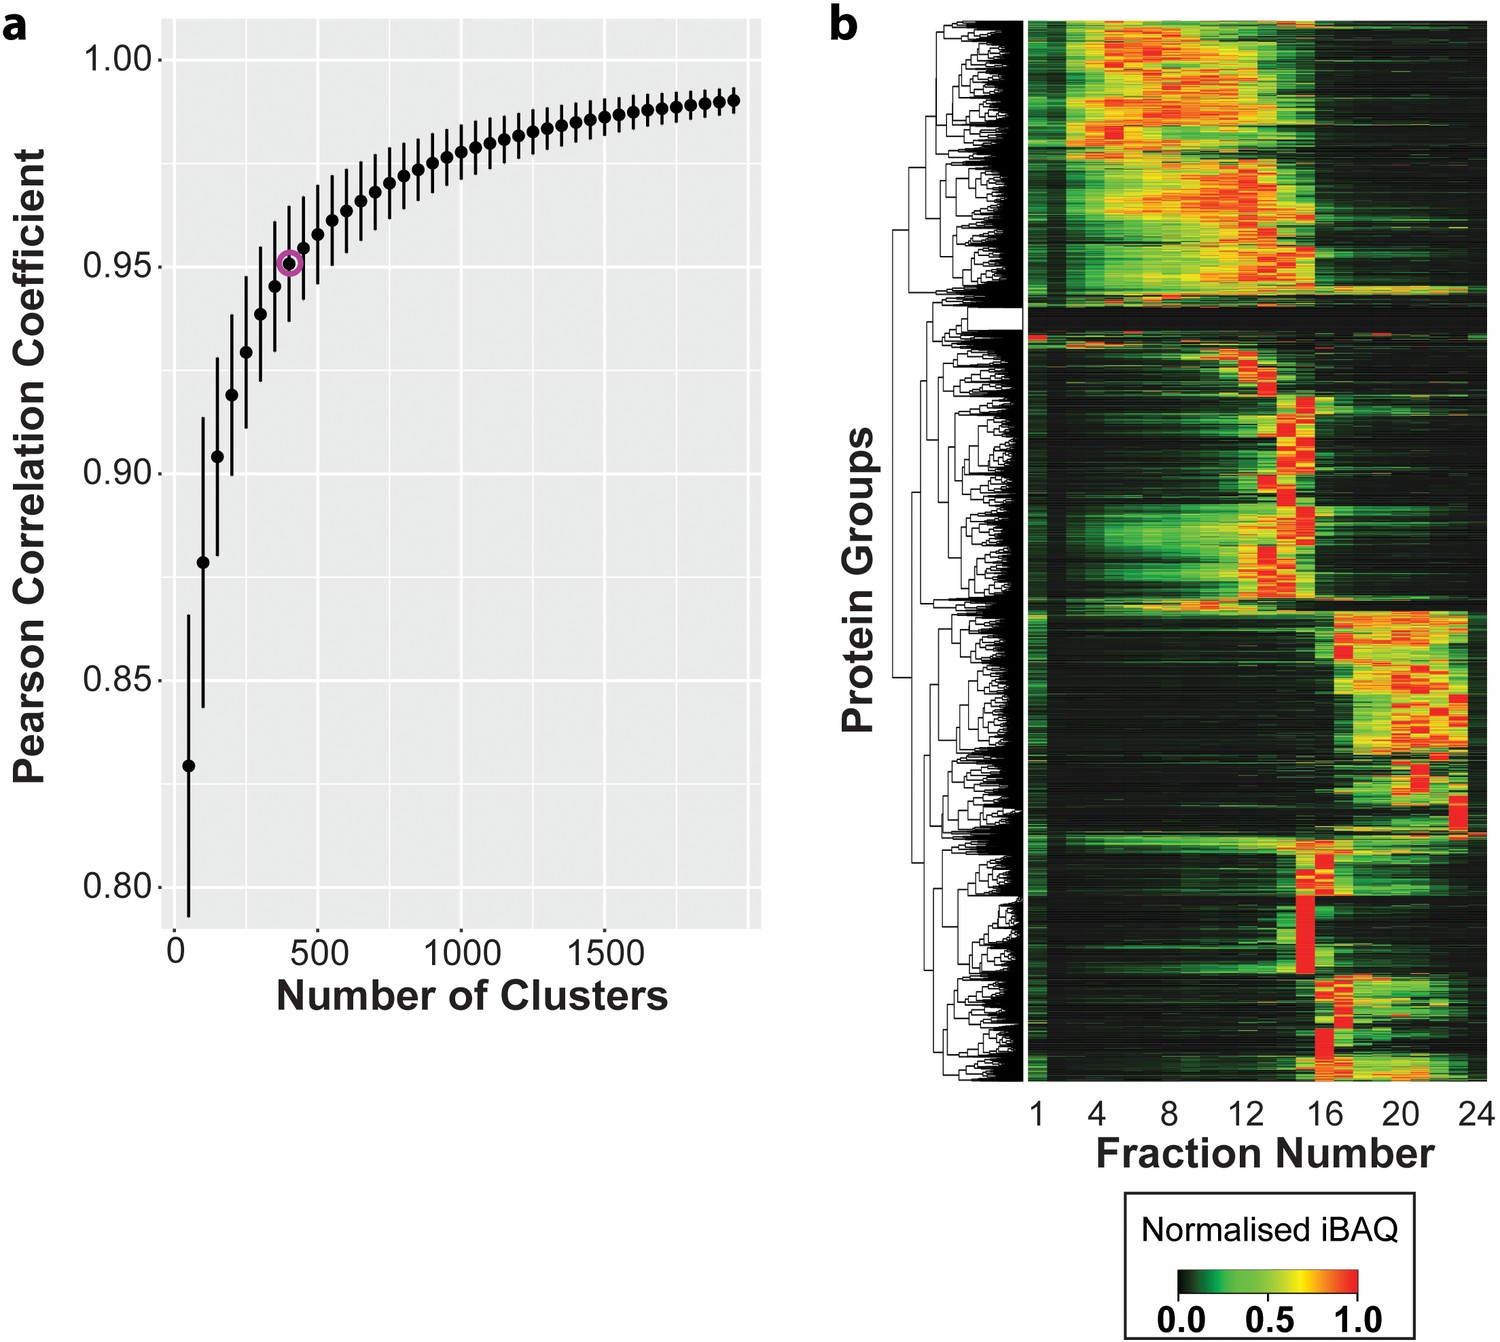
Hierarchical clustering of protein elution profiles in the mouse liver tissue.
(a) Optimum hierarchical cluster number was calculated and the average Pearson correlation coefficient (y-axis) was plotted over a range of cluster numbers between 50 and 2,000 (x-axis). (b) All 5158 proteins were clustered on the basis of their normalized elution profiles across 24 Ribo Mega-SEC fractions, and the results were presented as a heat map. The dendrogram cut-offs for 400 clusters were illustrated to the left of the heat map.
Figure 7
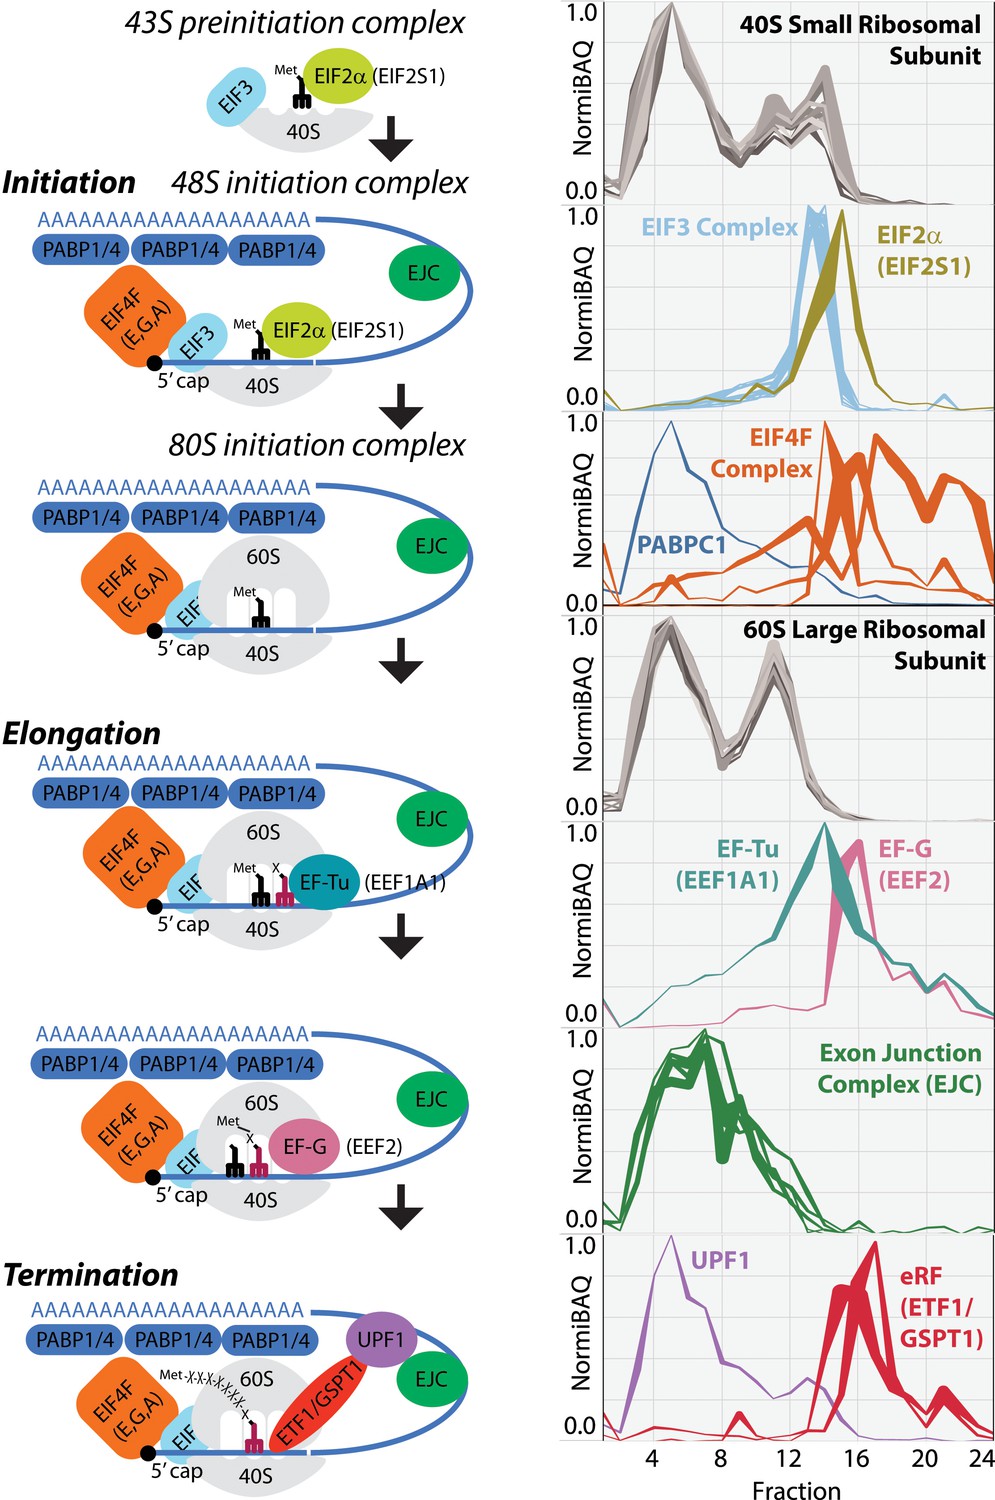
Schematic image of whole translation process highlighted with the identified proteins in mouse liver tissue.
Ribo Mega-SEC elution profiles for 40S small ribosomal subunit, EIF2alpha, EIF3 complex, EIF4F complex, PABPC1, 60S large ribosomal subunit, EF-Tu, EF-G, exon junction complex (EJC), UPF1, and eRF are displayed as line graphs with the mean normalized iBAQ intensity ± the standard deviation (y-axis) plotted against each elution fraction (x-axis).
Tables
Key resources table
| Reagent type (species) or resource | Designation | Source or reference | Identifiers | Additional information |
|---|---|---|---|---|
| Cell line (human) | HeLa | ATCC | RRID:CVCL_0030 | Tested negative for mycoplasma |
| Cell line (human) | U2OS | ATCC | RRID:CVCL_0042 | Tested negative for mycoplasma |
| Cell line (human) | HCT116 p53 +/+ | ATCC | RRID:CVCL_0291 | Tested negative for mycoplasma |
| Cell line (human) | HCT116 p53 -/- | Horizon | RRID:CVCL_S744 | Tested negative for mycoplasma |
| Biological sample (Mus musculus) | C57BL/6J | Australian BioResources | RRID:IMSR_JAX:000664 | |
| Antibody | Anti-Ribosomal protein S10 antibody [EPR8545] | Abcam Cat# ab151550 | RRID:AB_2714147 | |
| Antibody | Ribosomal Protein L28 (A-16) antibody | Santa Cruz Biotechnology Cat# sc-14151 | RRID:AB_2181749 | |
| Antibody | RPL14/Ribosomal Protein L14 Antibody | Bethyl Cat# A305-052A | RRID:AB_2621246 | |
| Antibody | RPLP0 antibody | Abcam Cat# ab88872 | RRID:AB_2042838 | |
| Antibody | Anti-mouse IgG, HRP-linked Antibody | Cell Signaling Technology Cat# 7076 | RRID:AB_330924 | |
| Antibody | Anti-rabbit IgG, HRP-linked Antibody | Cell Signaling Technology Cat# 7074 | RRID:AB_2099233 | |
| Antibody | Anti-Goat IgG (whole molecule) -Peroxidase antibody produced in rabbit | Sigma-Aldrich Cat# A5420 | RRID:AB_258242 |
Additional files
-
Supplementary file 1
Protein level data identified in mouse liver tissue, classified by cluster.
The table summarizes the proteins identified in mouse liver tissue and includes the following data for each protein identification: protein ID, protein name, Gene name, cluster number, total iBAQ intensities from two biological replicates and individual intensities.
- https://doi.org/10.7554/eLife.36530.023
-
Transparent reporting form
- https://doi.org/10.7554/eLife.36530.024
Download links
A two-part list of links to download the article, or parts of the article, in various formats.
Downloads (link to download the article as PDF)
Open citations (links to open the citations from this article in various online reference manager services)
Cite this article (links to download the citations from this article in formats compatible with various reference manager tools)
Efficient analysis of mammalian polysomes in cells and tissues using Ribo Mega-SEC
eLife 7:e36530.
https://doi.org/10.7554/eLife.36530


