NK cells inhibit Plasmodium falciparum growth in red blood cells via antibody-dependent cellular cytotoxicity
- National Institute of Allergy and Infectious Diseases, National Institutes of Health, United States
- University of Minnesota, United States
- International Center of Excellence in Research, University of Sciences, Techniques and Technologies of Bamako, Mali
Figures
Figure 1 with 1 supplement
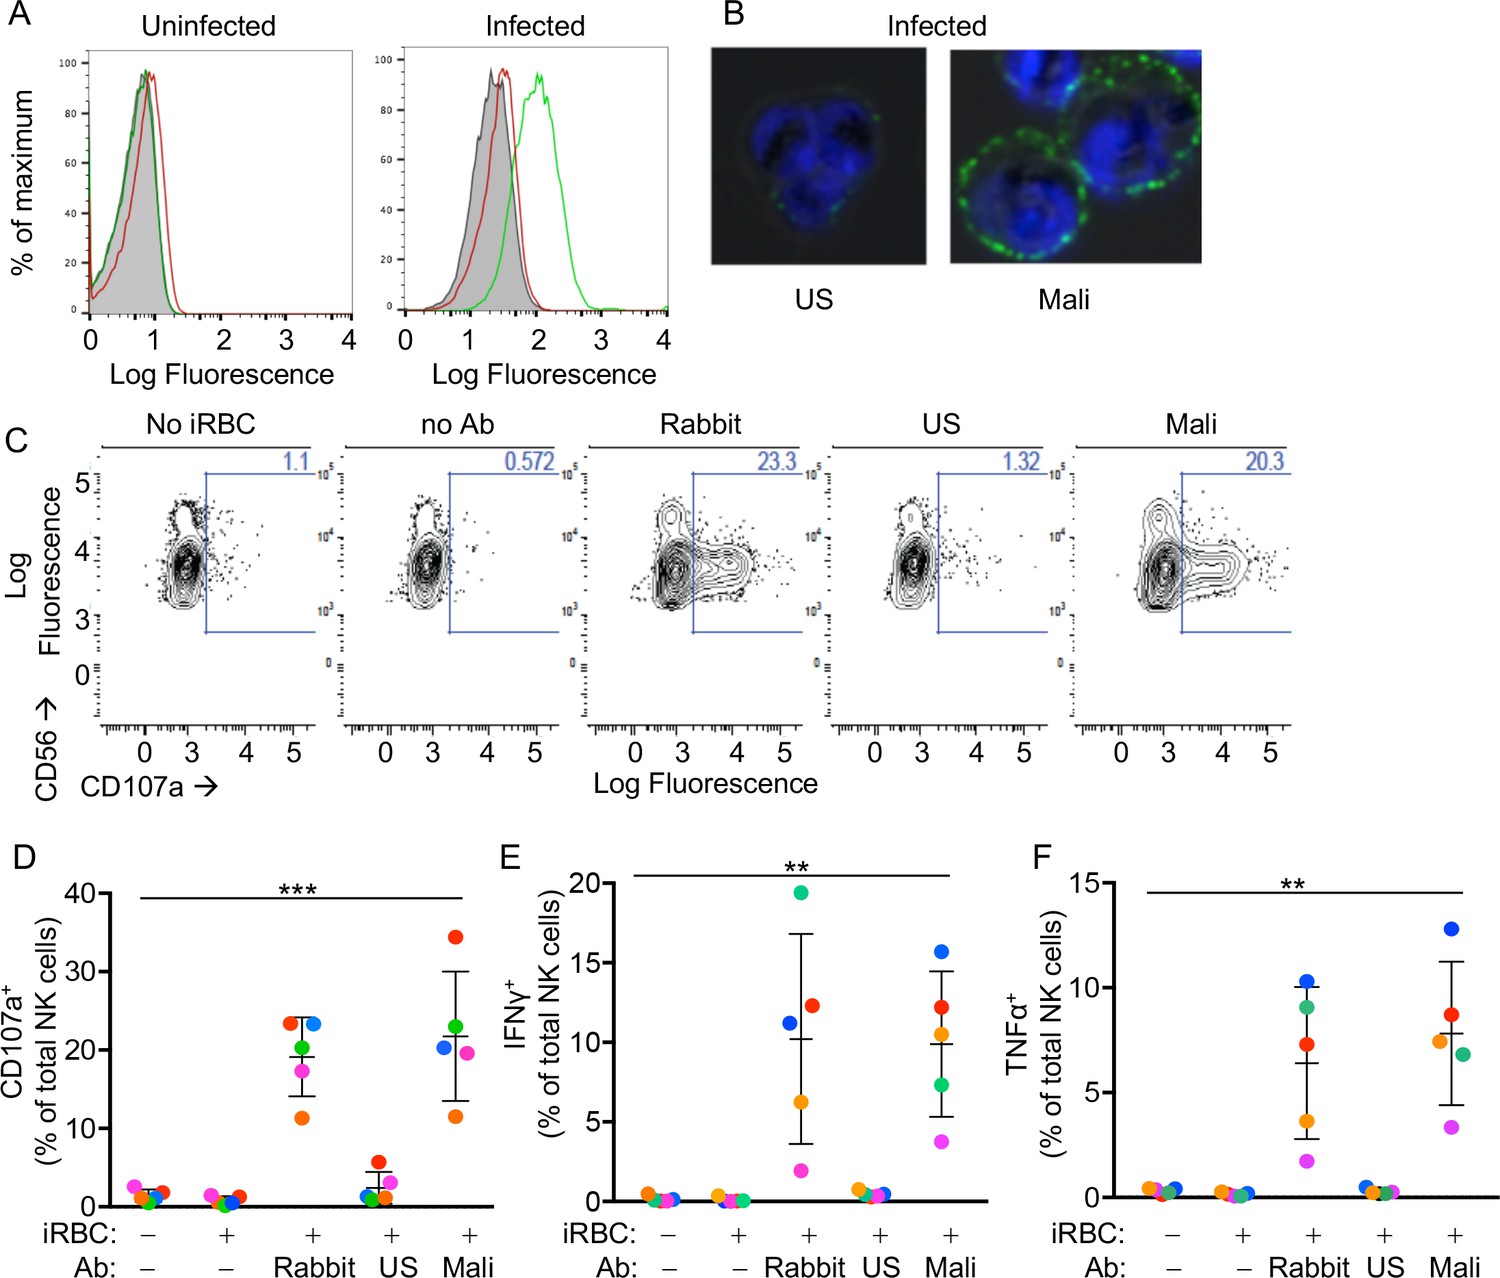
Primary human NK cells are activated by antibody-coated P.f.-iRBCs.
(A) Uninfected RBCs (left) and trophozoite-stage iRBCs (right) were stained with serum pooled from US individuals (red) and plasma pooled from individuals living in a malaria-endemic region of Mali (green). Bound Abs were detected with AF488-conjugated anti-human IgG (H + L) antiserum. (B) Immunofluorescence images of iRBCs stained with DAPI (blue) and with either US serum or Mali plasma, as indicated. Anti-human IgG (H + L) antiserum labeled with AF488 (green) was used to detect Ab-coated RBCs. (C) NK cells stained with PE-Cy5.5-conjugated CD56 and PE-conjugated CD107a Abs. The fraction of CD107a+ NK cells is indicated in each panel. (D) NK cell degranulation measured by CD107a Ab staining. NK cells alone or co-incubated with iRBCs, at a NK:RBC ratio of 1:1 for 4 hr, in the absence or presence of Abs, as indicated. Rabbit polyclonal anti-RBC serum (1:4000), US serum (1:10) and Mali plasma (1:10) were used. Circles indicate individual NK cell donors, each with its own color. Data from independent experiments are shown as mean ± SD (ANOVA, p=0.0009). (E, F) Intracellular staining of IFN-γ and TNF-α. Incubation conditions and Abs as in (D) (ANOVA, p=0.0061 for E, 0.0050 for F). Data from independent experiments are shown as mean ± SD.
Figure 1—figure supplement 1
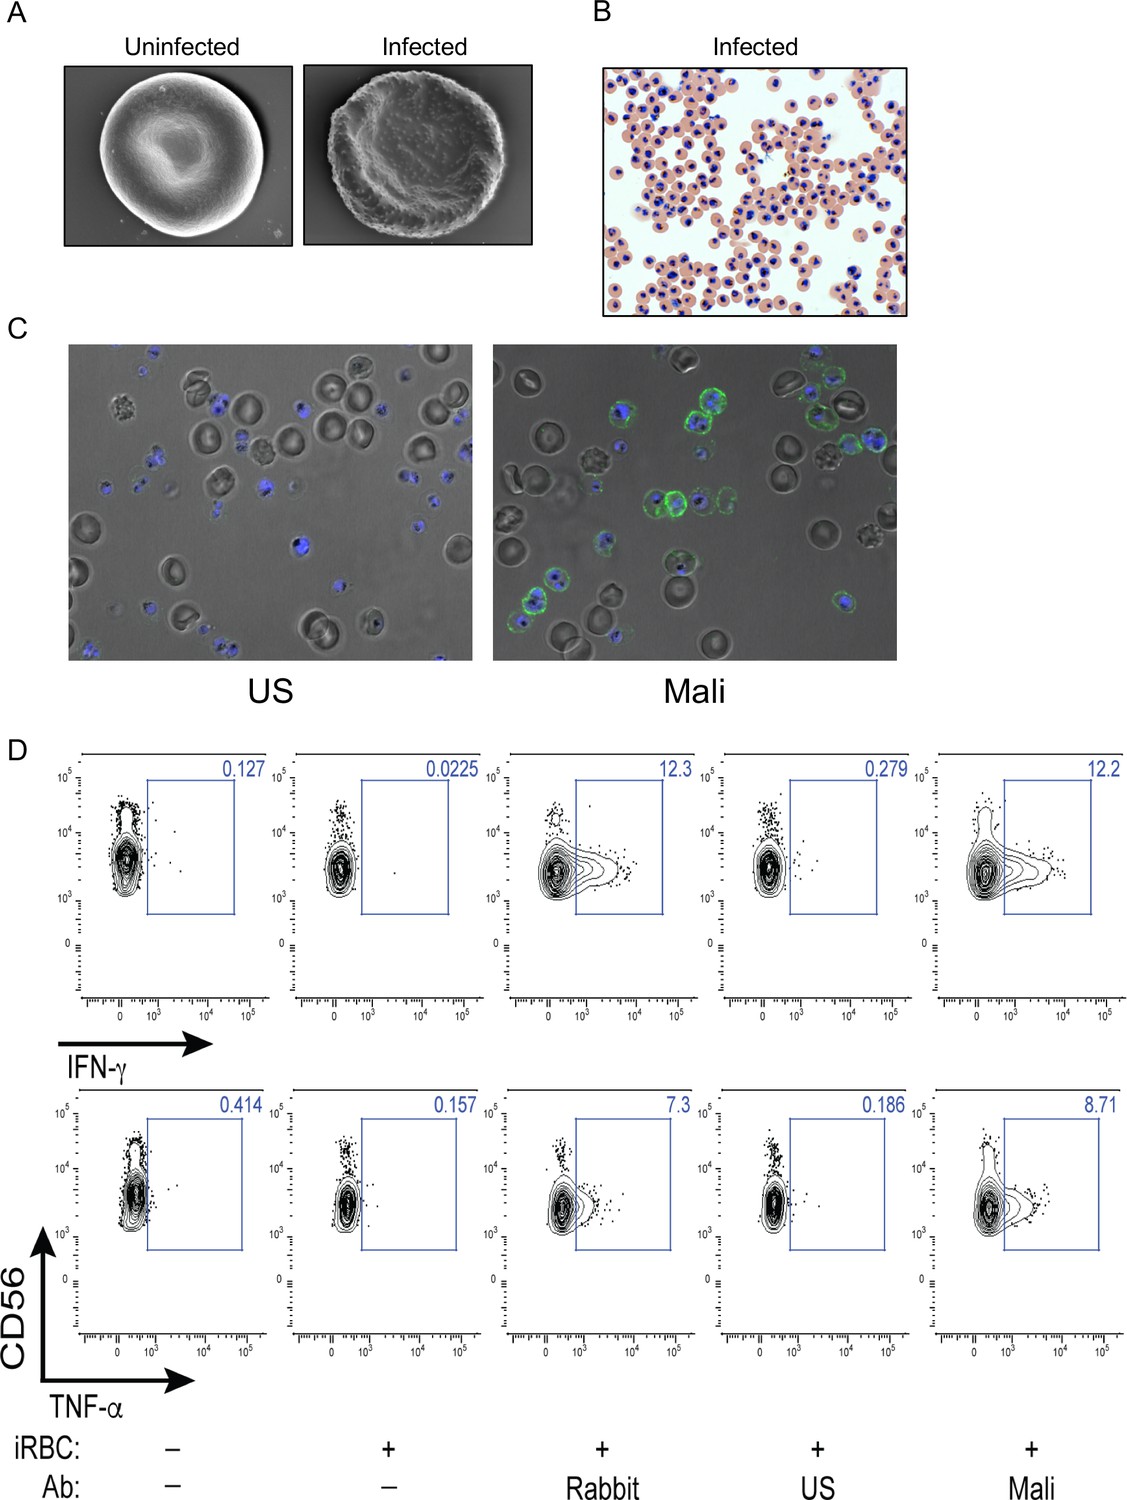
Antibody-dependent cytokine response of NK cells in response to iRBCs.
(A) Scanning electron micrographs of uRBC and P.f. 3D7-iRBC, as indicated. (B) Giemsa stain of iRBCs enriched at the trophozoite stage. (C) Immunofluorescence images of iRBCs and uRBCs, mixed at an equal ratio, and stained with DAPI (blue) and with either US serum or Mali plasma, as indicated. Anti-human IgG (H+L) antiserum labeled with AF488 (green) was used to detect Ab-coated RBCs. (D) NK cells alone or co-incubated with iRBCs, at a NK:RBC ratio of 1:1 for 4 h, in the absence or presence of Abs, as indicated. Rabbit polyclonal anti-RBC serum (1:4000), US serum (1:10) and Mali plasma (1:10) were used. After co-incubation NK cells were stained with PE-Cy5.5-conjugated CD56 Ab and with either APC-conjugated IFN-γ or PE-conjugated TNF-α Abs for intracellular cytokines. The fraction of cytokine-positive NK cells is indicated in each panel.
Figure 2 with 1 supplement
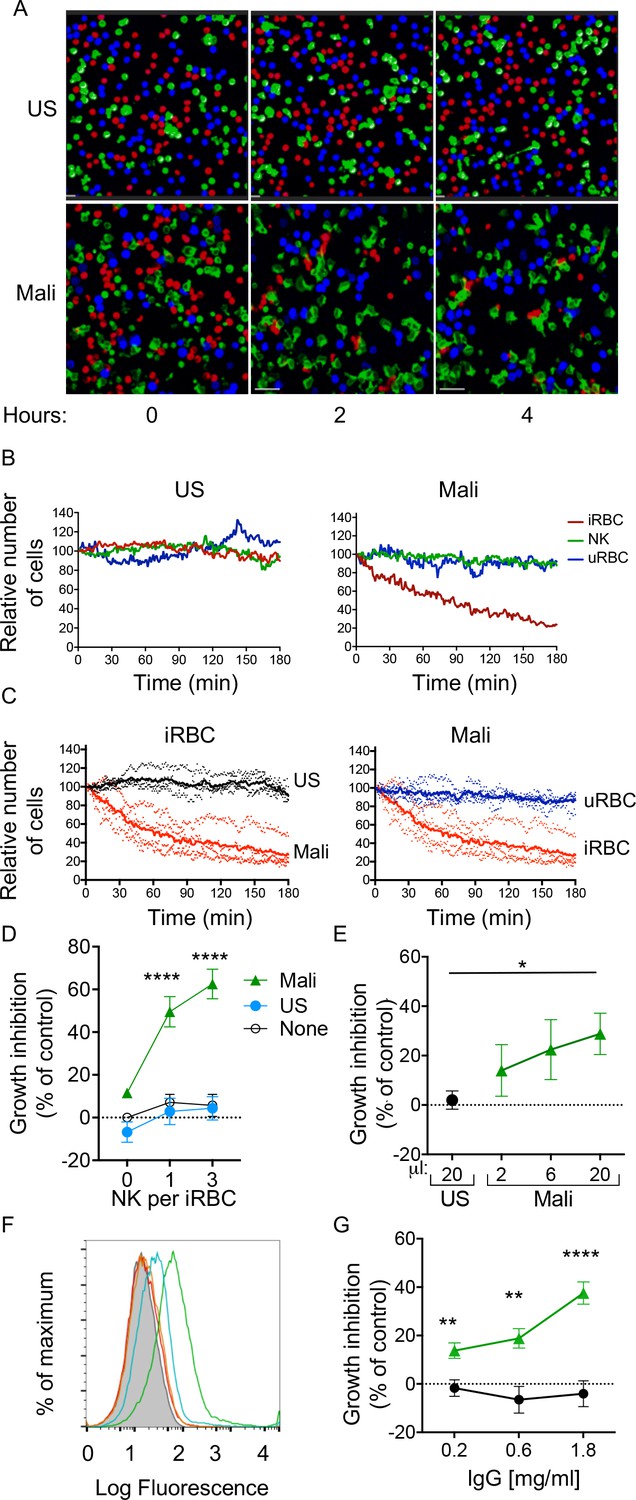
Selective lysis of P.f. 3D7-iRBCs and parasite growth inhibition by primary NK cells in the presence of immune plasma and IgG.
(A) Live imaging of primary NK cells (green) co-incubated with uRBCs (blue) and iRBCs (red) at an equal ratio (1:1:1) in the presence of US serum (1:10) and of Mali plasma (1:10). Representative snapshots taken at time 0, 2, and 4 hr are shown. (B) Quantitative analysis of cell numbers in the cultures shown in (A) in a 3 hr period. Cell numbers were normalized to 100 at the start of image acquisition. (C) Composite display of 4 independent experiments, each carried out with a different NK cell donor (dotted lines). The mean is shown as a solid line (t test, p<0.0001). (D) Inhibition of parasite growth measured by counting blood smears of iRBCs. A parasite culture containing 1% iRBCs was incubated for 48 hr in the absence (open circles) or presence of US serum (closed circles) or Mali plasma (triangles). Growth inhibition is represented as percent decrease in parasitemia relative to a culture with no NK cells and no Ab. Error bars represent standard deviation of the mean from four independent experiments (ANOVA, p<0.0001 for no NK or US serum group compared with Mali plasma groups in presence of NK cells). (E) Parasite growth inhibition measured by flow cytometry. Enriched trophozoite-stage iRBCs were incubated with NK cells at an NK:iRBC ratio of 3:1 for 6 hr with either 20 μl US serum or increasing amounts of Mali plasma in a final volume of 200 μl. Cells were washed and incubated for another 16 hr with a 100-fold excess of uRBCs (relative to the iRBC input). Inhibition is expressed as a percent decrease in parasitemia relative to parasitemia in iRBC cultures incubated with NK cells in the absence of Abs (ANOVA, p=0.0294). (F) Staining of iRBCs with IgG affinity-purified from US serum at 0.2 (orange) and 0.6 mg/ml (red), or from Mali plasma at 0.2 (blue) and 0.6 mg/ml (green). (G) Growth inhibition assay performed as in (E) in the presence of purified IgG from US (black circles) or Mali individuals (green triangles) at the indicated concentrations (t test p(0.2) = 0.008; p(0.6) = 0.003; p(1.8) = 0.00007).
Figure 2—figure supplement 1
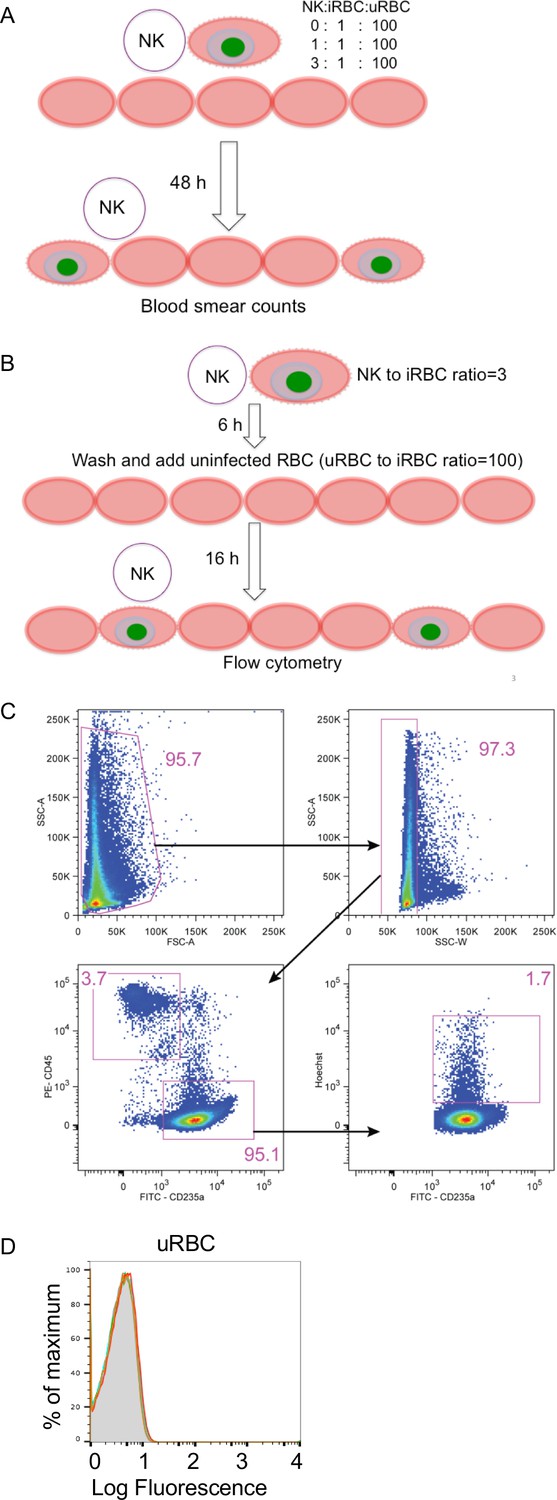
Assays for NK-dependent parasite growth inhibition.
(A) Diagram of a standard parasite GIA performed in a single 48 h culture. (B) Diagram of the modified GIA to test for inhibition by NK-dependent ADCC (GIA-ADCC). (C) Gating strategy of the flow cytometry assay for parasitemia. Cells were stained with PE- conjugated CD45 Ab and FITC-conjugated CD235a Ab (glycophorin A). Hoechst dye was used to identify iRBCs. (D) Staining of uRBCs with IgG affinity-purified from US serum at 0.2 mg/ml (orange) and 0.6 mg/ml (red) or Mali plasma at 0.2 mg/ml (blue) and 0.6 mg/ml (green).
Figure 3 with 1 supplement
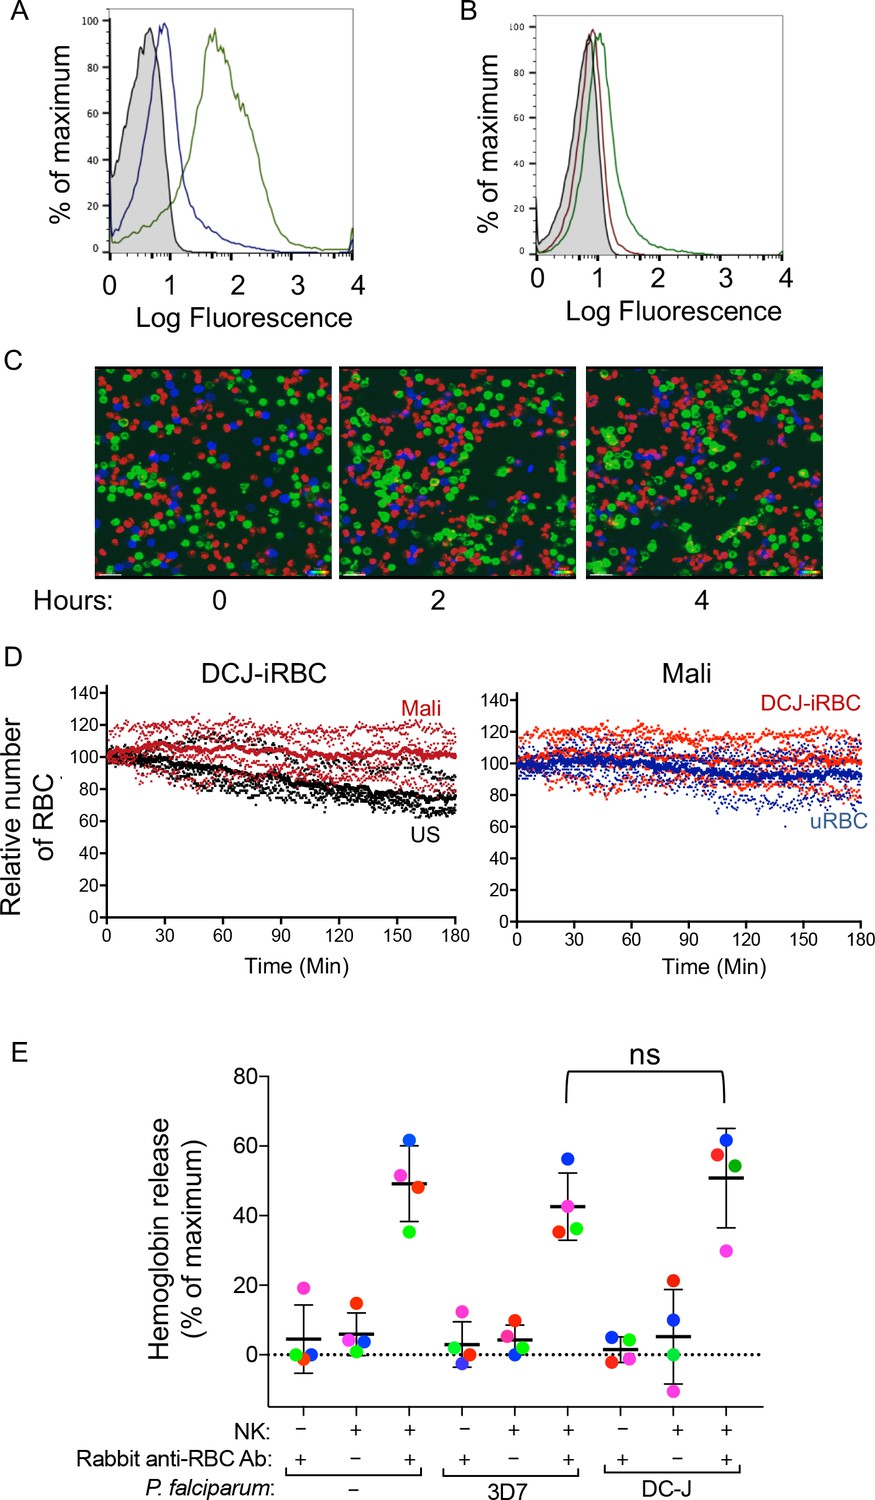
Naturally acquired antibodies to PfEMP1 have a predominant role in NK-mediated ADCC.
(A) Immunostaining of uRBCs with Mali plasma (shaded) and of RBCs infected with P.f. 3D7 (green) or with P.f. DC-J parasites (blue). Bound Abs were detected with AF488-conjugated anti-human IgG (H + L) antiserum. (B) Staining of DC-J iRBCs with Abs from US serum (red) and Mali plasma (green). Secondary staining was as in (A). The shaded histogram represents staining with secondary Ab alone. (C) Live imaging of primary NK cells (green) co-incubated with uRBCs (blue) and DC-J-iRBCs (red) at an equal ratio (1:1:1) in the presence of US serum (1:10) or Mali plasma (1:10). Cell counts for NK cells, DC-J-iRBCs and uRBCs were determined every minute for 3 hr. Representative snapshots taken at time 0, 2 and 4 hr are shown. (D) Cell numbers were normalized to 100 at the start of image acquisition. Composite display of 4 independent experiments, each carried out with a different NK cell donor (dotted lines). The mean is shown as a solid line. (E) NK cell-mediated ADCC towards uRBCs, P.f. 3D7 iRBCs and P.f. DC-J iRBCs. Cells were mixed at an NK:RBC ratio of 5:1 and incubated for 5 hr in the presence or absence of rabbit anti-RBC serum (1:4000), as indicated. Hemoglobin release, measured using a Quantichrom Hb assay, is shown relative to release from RBCs treated with 1% Triton X-100. Data are shown (mean ± SD) for NK cells from four independent donors (t-test, p=0.3743, comparing 3D7 and DC-J in presence of NK cells and Rabbit anti RBC Ab).
Figure 3—figure supplement 1

Hemoglobin release assay.
(A) Hemoglobin in supernatants of RBCs treated with 1% Triton X-100 was measured with a Quantichrom assay kit. Graph shows OD versus cell number from a representative experiment with uRBCs (black) and iRBCs (red). (B) Hemoglobin in the supernatant of iRBCs incubated for 5 hr in the presence or absence of rabbit anti-RBC serum (1:4000) and of NK cells, as indicated. Cells were mixed at an NK per iRBC ratio of five. Data are shown (mean ± SD) for NK cells from seven independent donors, relative to maximum hemoglobin release in 1% Triton X-100 (ANOVA, p<0.0001). (C) Hemoglobin in the supernatant of iRBCs incubated for 5 hr at different numbers of NK per iRBC in the presence (red) or absence (black) of rabbit anti-RBC serum (1:4000). Data are shown (mean ± SD) for NK cells from three independent donors (t test, p (0)=0.576; p (3)=0.022; p (10) = 0.0003).
Figure 4 with 1 supplement
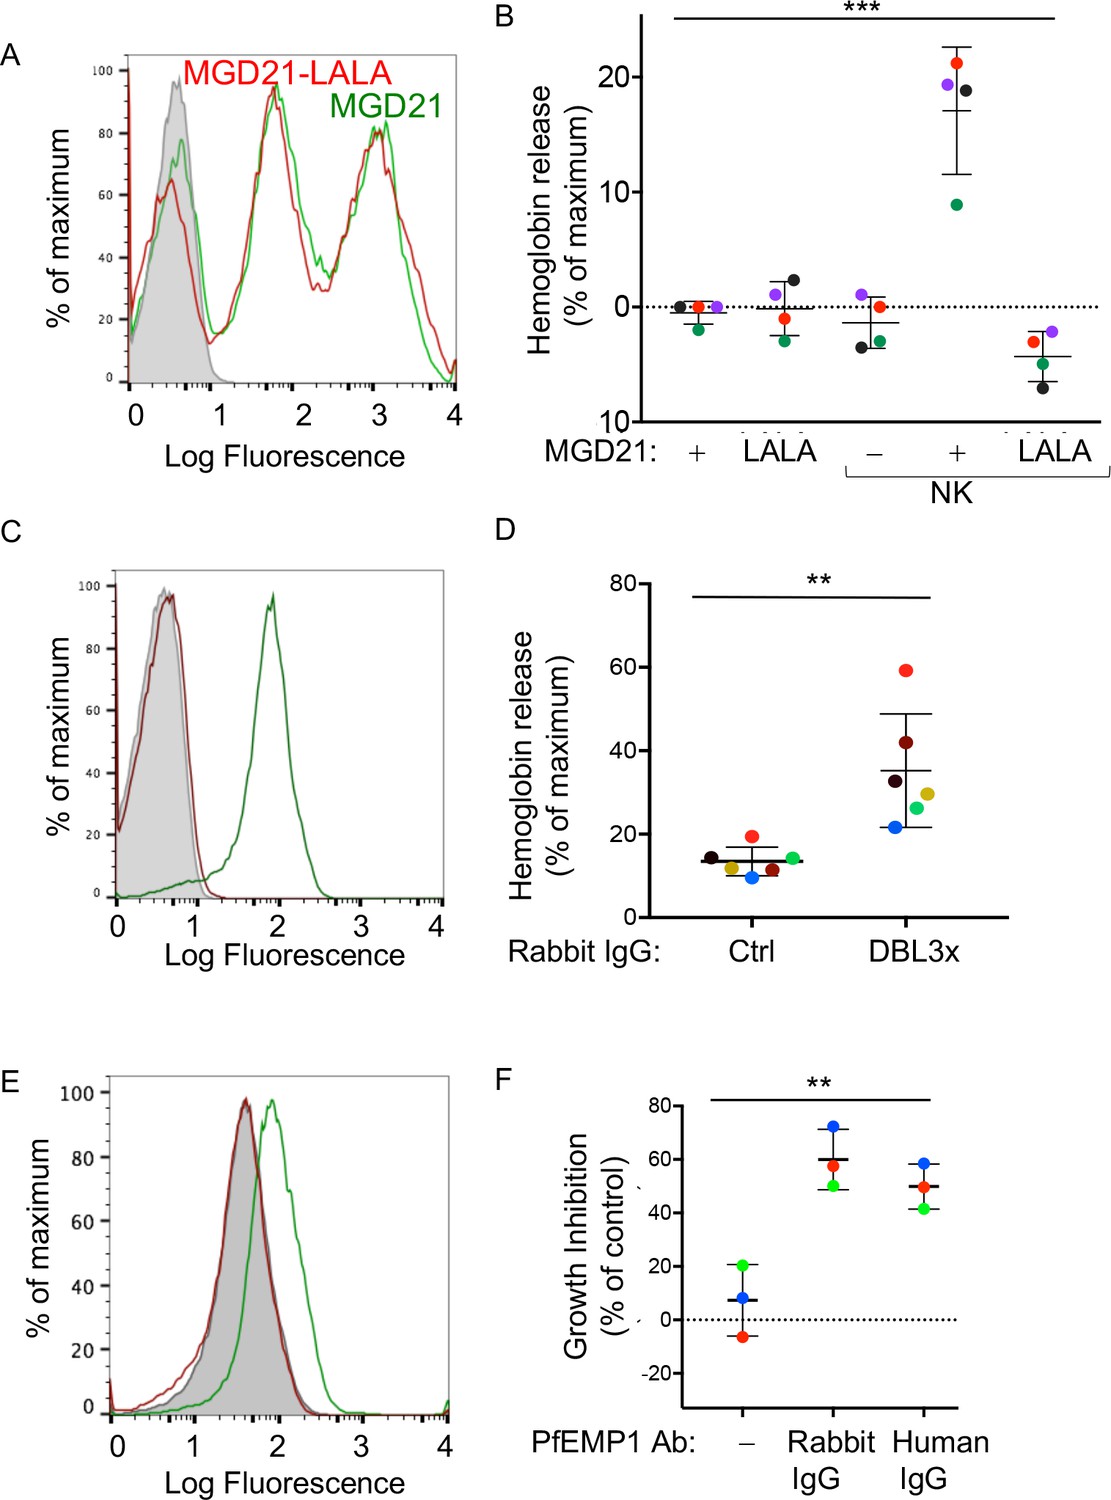
Human antibodies to RIFIN and to PfEMP1 promote NK-dependent lysis of iRBCs and inhibition of P.f. growth.
(A) Staining of RBCs infected with a P.f. 3D7 strain enriched for expression of a RIFIN family member (PF3D7_1400600) with human monoclonal Ab MGD21 (green) or variant MGD21-LALA (red). The shaded histogram represents staining with AF488-conjugated anti-human IgG (H + L) antiserum alone. (B) Lysis of RIFIN+ iRBCs incubated for 6 hr in the absence of NK cells or at an NK to iRBC ratio of 5:1 in presence or absence of MGD21 or MGD21 LALA Abs, as indicated. Data are shown (mean ± SD) for NK cells from four independent NK cell donors, as measured by Hb release (ANOVA, p=0.0005). (C) Staining of RBCs infected with P.f. FCR3 strain expressing VAR2CSA with rabbit polyclonal Ab to the DBL3X domain of PfEMP1 VAR2CSA (green) or with control rabbit serum (red). The shaded histogram represents staining with secondary FITC-labeled anti-rabbit IgG alone. (D) Hemoglobin release measured after incubation of NK cells with VAR2CSA-iRBCs, at an NK to iRBC ratio of 5:1 for 5 hr, in the presence of affinity-purified IgG from control rabbit serum or from serum of rabbit immunized with VAR2CSA PfEMP1. Each color represents a single NK cell donor tested in independent experiments (n = 6) (t-test, p=0.0049). (E) Staining of iRBCs expressing P.f. VAR2CSA with human polyclonal Abs to either AMA1 antigen as control (red), or to the DBL domains of PfEMP1 VAR2CSA (green). The shaded histogram represents staining with AF488-conjugated anti-human IgG (H + L) antiserum alone. (F) Parasite GIA-ADCC analyzed by flow cytometry. Enriched trophozoite-stage FCR3 VAR2CSA-iRBCs were incubated with NK cells, at an NK to iRBC ratio of 5 for 6 hr, in the presence of a control rabbit IgG (–), of rabbit anti-PfEMP1 IgG, and of human anti-PfEMP1 IgG, as indicated. A 100-fold excess of uRBCs (relative to the iRBCs input) was added, and incubation resumed for another 42 hr. Inhibition is expressed as percent decrease in parasitemia relative to iRBCs that were incubated with NK cells in the absence of Abs (ANOVA, p=0.0027).
Figure 4—figure supplement 1
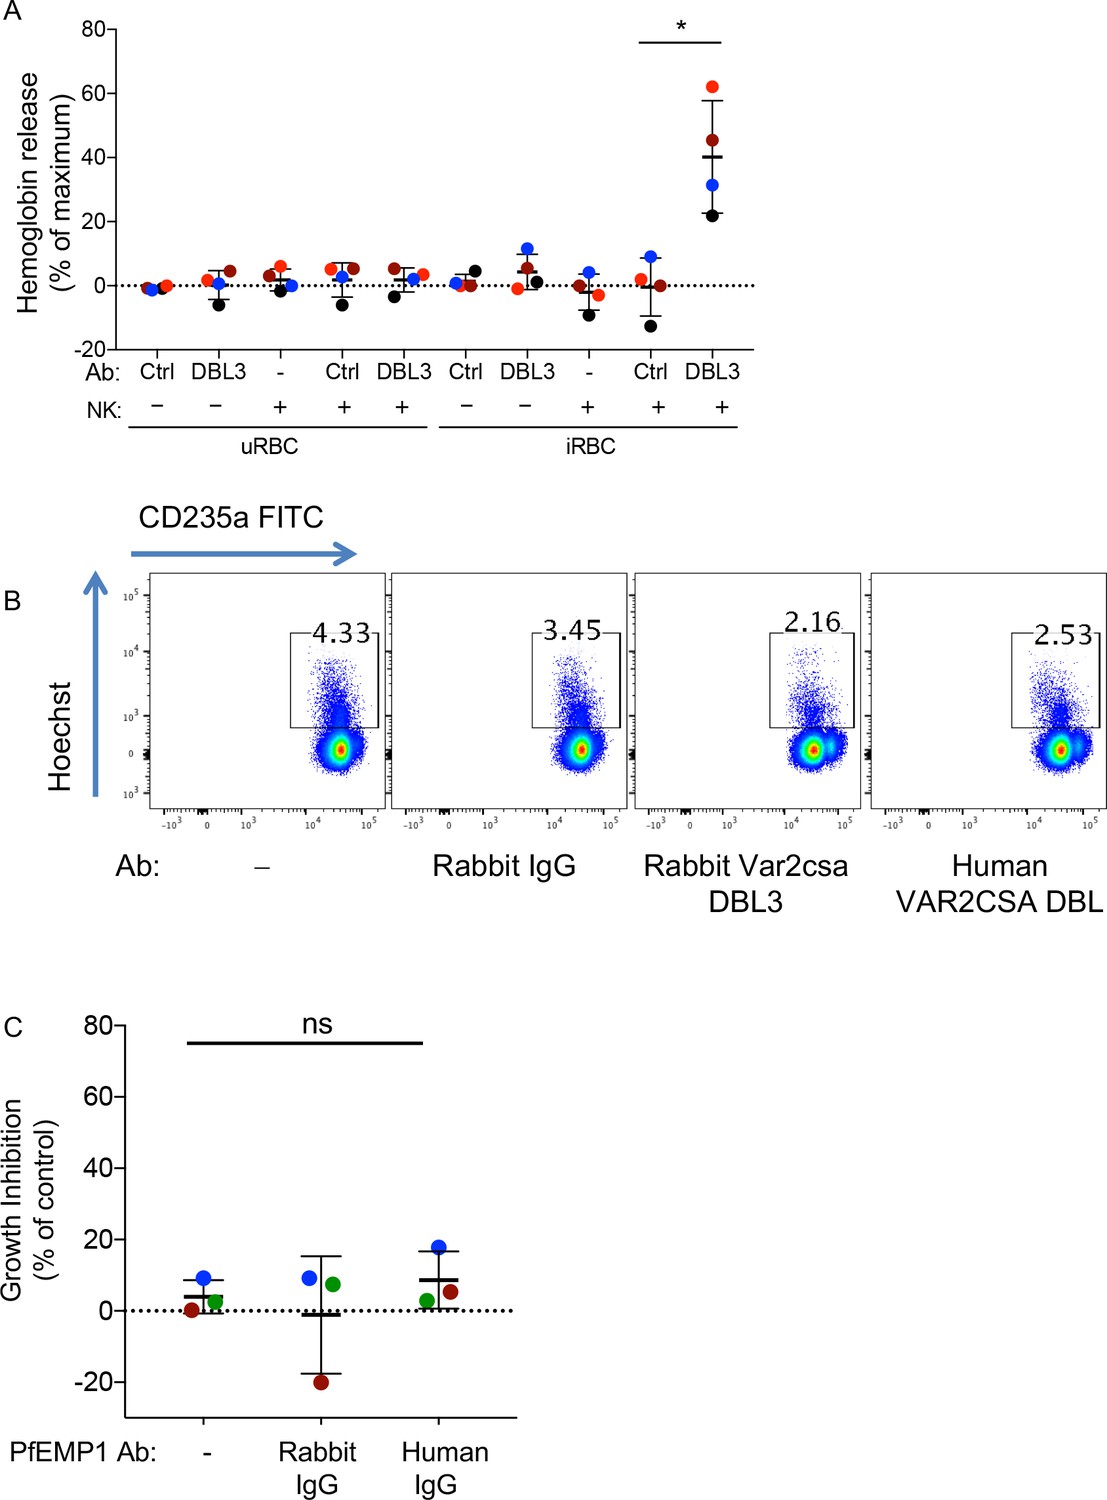
PfEMP1 antibodies activate NK-dependent lysis of iRBCs and inhibition of P.f. growth.
(A) Lysis of uRBCs or VAR2CSA-iRBCs, at an NK to RBC ratio of 5 for 5 hr, in the presence or absence of anti-VAR2CSA PfEMP1 DBL3X domain rabbit IgG or IgG from control rabbit serum (Ctrl), as indicated, was measured by hemoglobin release. Each color represents a single NK cell donor tested in independent experiments (n = 4) (t test, p=0.0151). (B) Analysis of parasite growth inhibition by one of the NK cell donors shown in Figure 4F by flow cytometry. The gating strategy was same as described in Figure 2—figure supplement 1C. (C) Parasite growth inhibition in the absence of NK cells for the experiment shown in Figure 4F (ANOVA, p=0.4222).
Videos
Video 1
shows a co-culture of NK cells, uRBC and iRBC in the presence of US serum, imaged for104 min.
https://doi.org/10.7554/eLife.36806.007
Video 2
shows a co-culture of NK cells, uRBC and iRBC in the presence of Mali plasma, imaged for 104 min.
https://doi.org/10.7554/eLife.36806.008
Video 3
shows a co-culture of NK cells, uRBC and RBC infected with the PfEMP1-deficient P.f. strain DC-J in the presence of Mali plasma, imaged for 106 min.
https://doi.org/10.7554/eLife.36806.011Tables
Key resources table
| Reagent type or resource | Designation | Source | Identifier | Additional information |
|---|---|---|---|---|
| Antibody | Human IgG (H + L) Alexa Fluor 488 | Thermo Fisher Scientific | A-11013 | |
| Antibody | Goat anti Rabbit Ig, FITC | Southern Biotech, AL | 4010–02 | |
| Antibody | Anti human CD56 PE Cy5.5 | Beckman Coulter, CA | Clone N901, | |
| Antibody | Anti human CD235a FITC | Biolegend, CA | Clone H1264 | |
| Antibody | Anti human CD45 PE | Biolegend, San Diego, CA | Clone H130 | |
| Antibody | Anti human IFN-γ−APC | BD Biosciences | Clone B27 | |
| Antibody | Anti human TNF-α−PE | BD Bioscience | Clone 6401.1111, | |
| Antibody | Anti human CD107a-PE | BD Biosciences | Clone H4A3, | |
| Antibody | Rabbit polyclonal anti-human red blood cell antibody | Rockland Immunochemicals Inc. PA | 209–4139 | |
| Antibody | VAR2CSA human Ab | Patrick E Duffy | Doritchamou et al., 2016 | |
| Antibody | AMA1 human Ab | Patrick E Duffy | Doritchamou et al., 2016 | |
| Antibody | DBL3X rabbit Ab | David L Narum | Obiakor et al. (2013) | |
| Antibody | Control IgG rabbit | David L Narum | Obiakor et al. (2013) | |
| Chemical compound, drug | eFluor 670 dye | Thermo Fisher Scientific | eBioscience Cell Proliferation Dye eFluor 670 Catologue no 65-0840-85 | |
| Chemical compound, drug | eFluor 450 dye | Thermo Fisher Scientific | eBioscience Cell Proliferation Dye eFluor 450 Catologue no 65-0842-85 | |
| Chemical compound, drug | PKH 67 dye | SIGMA Aldrich | PKH67 Green Fluorescent Cell Linker Kit for General Cell Membrane Labeling Catologue no. PKH67GL SIGMA | |
| Strain, strain background (Plasmodium falciparum) | 3D7 | Aaron T Neal | ||
| Strain, strain background (Plasmodium falciparum) | NF54 DC-J | Kirk W Deitsch | Dzikowski et al. (2006) | |
| Strain, strain background (Plasmodium falciparum) | FCR3 VAR2CSA | Patrick E Duffy | Doritchamou et al. (2016) | |
| Strain, strain background (Plasmodium falciparum) | 3D7-MGD21+ | Antonio Lanzavecchia | Tan et al. (2016) | |
| Biological samples (Human) | Human peripheral blood mononuclear cells | Department of Transfusion Medicine, NIH | ||
| Biological samples (Human) | Serum | Valley Biomedical (Winchester, VA) | ||
| Biological samples (Human) | Plasma | Malaria Research and Training Centre, Bamako, Mali | Crompton et al. (2008) | |
| Software, algorithm | Imaris | Bitplane | http://www.bitplane.com | |
| Software, algorithm | Zen | Carl Zeiss | ||
| Software, algorithm | FlowJo | FlowJo, LLC | ||
| Software, algorithm | Graphpad PRISM 7.0 | GraphPad Software, Inc. | ||
| Commercial Assay or kit | Quantichrom hemoglobin assay kit | BioAssay Systems, CA | DIHB-250 |
Additional files
-
Transparent reporting form
- https://doi.org/10.7554/eLife.36806.014
Download links
A two-part list of links to download the article, or parts of the article, in various formats.
Downloads (link to download the article as PDF)
Open citations (links to open the citations from this article in various online reference manager services)
Cite this article (links to download the citations from this article in formats compatible with various reference manager tools)
NK cells inhibit Plasmodium falciparum growth in red blood cells via antibody-dependent cellular cytotoxicity
eLife 7:e36806.
https://doi.org/10.7554/eLife.36806


