The influence of the descending pain modulatory system on infant pain-related brain activity
- University of Oxford, United Kingdom
- The University of Nottingham, United Kingdom
Figures
Figure 1 with 3 supplements
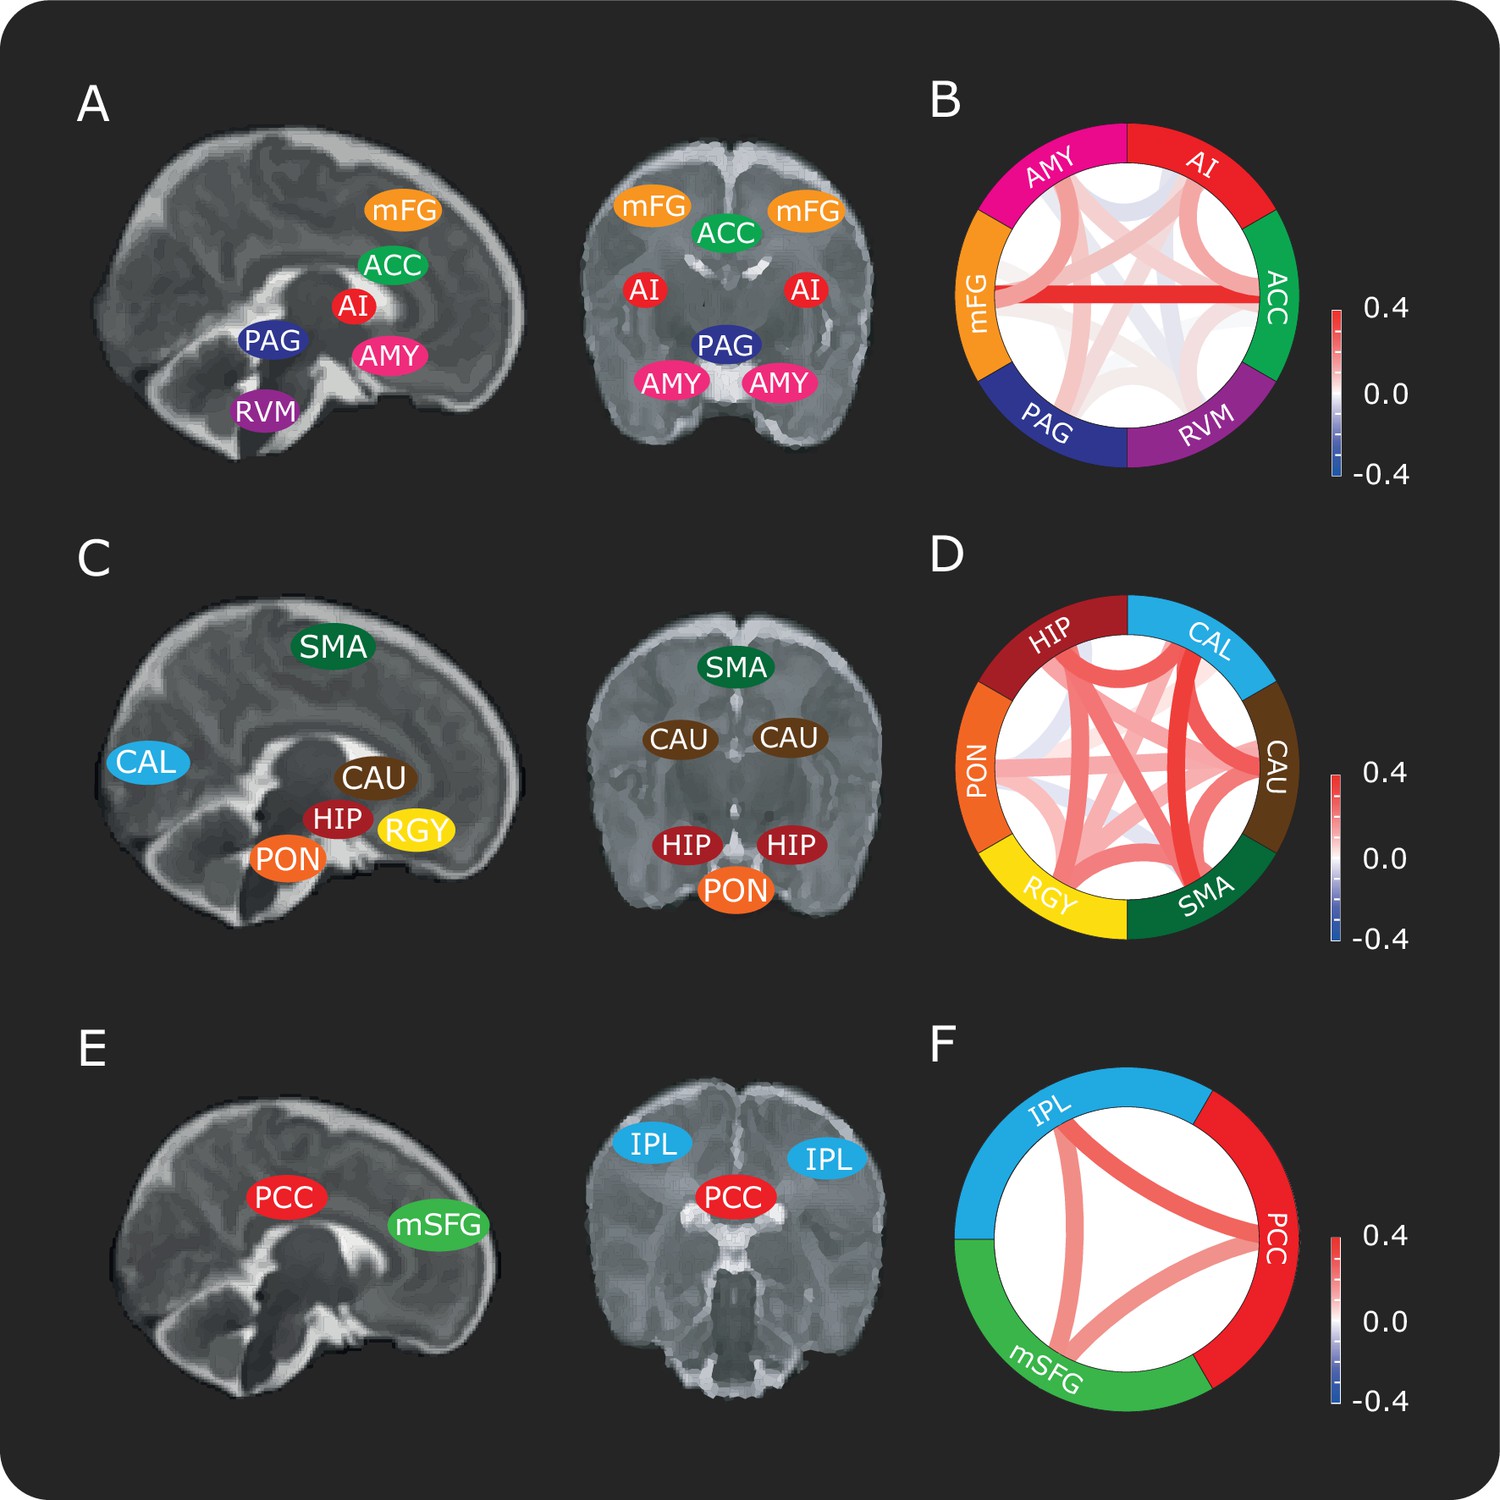
Connectivity between brain regions in the DPMS and control networks.
Schematic representation showing approximate locations of brain regions in sagittal and coronal slices in the (A) DPMS Network, (C) Control Network and (E) Default Mode Network. Each anatomical region of interest is identified in Figure 1—figure supplement 1 and the source data is provided in Figure 1—source data 1. Figure 1—figure supplement 2 shows the registration of two example masks from template to functional space and example time series. Network schematics of the mean pre-stimulus functional connectivity between pairs of regions in the (B) DPMS Network, (D) Control Network and (F) Default Mode Network. For abbreviations see main text.
-
Figure 1—source data 1
All region-of-interest masks in standard space.
- https://doi.org/10.7554/eLife.37125.006
Figure 1—figure supplement 1
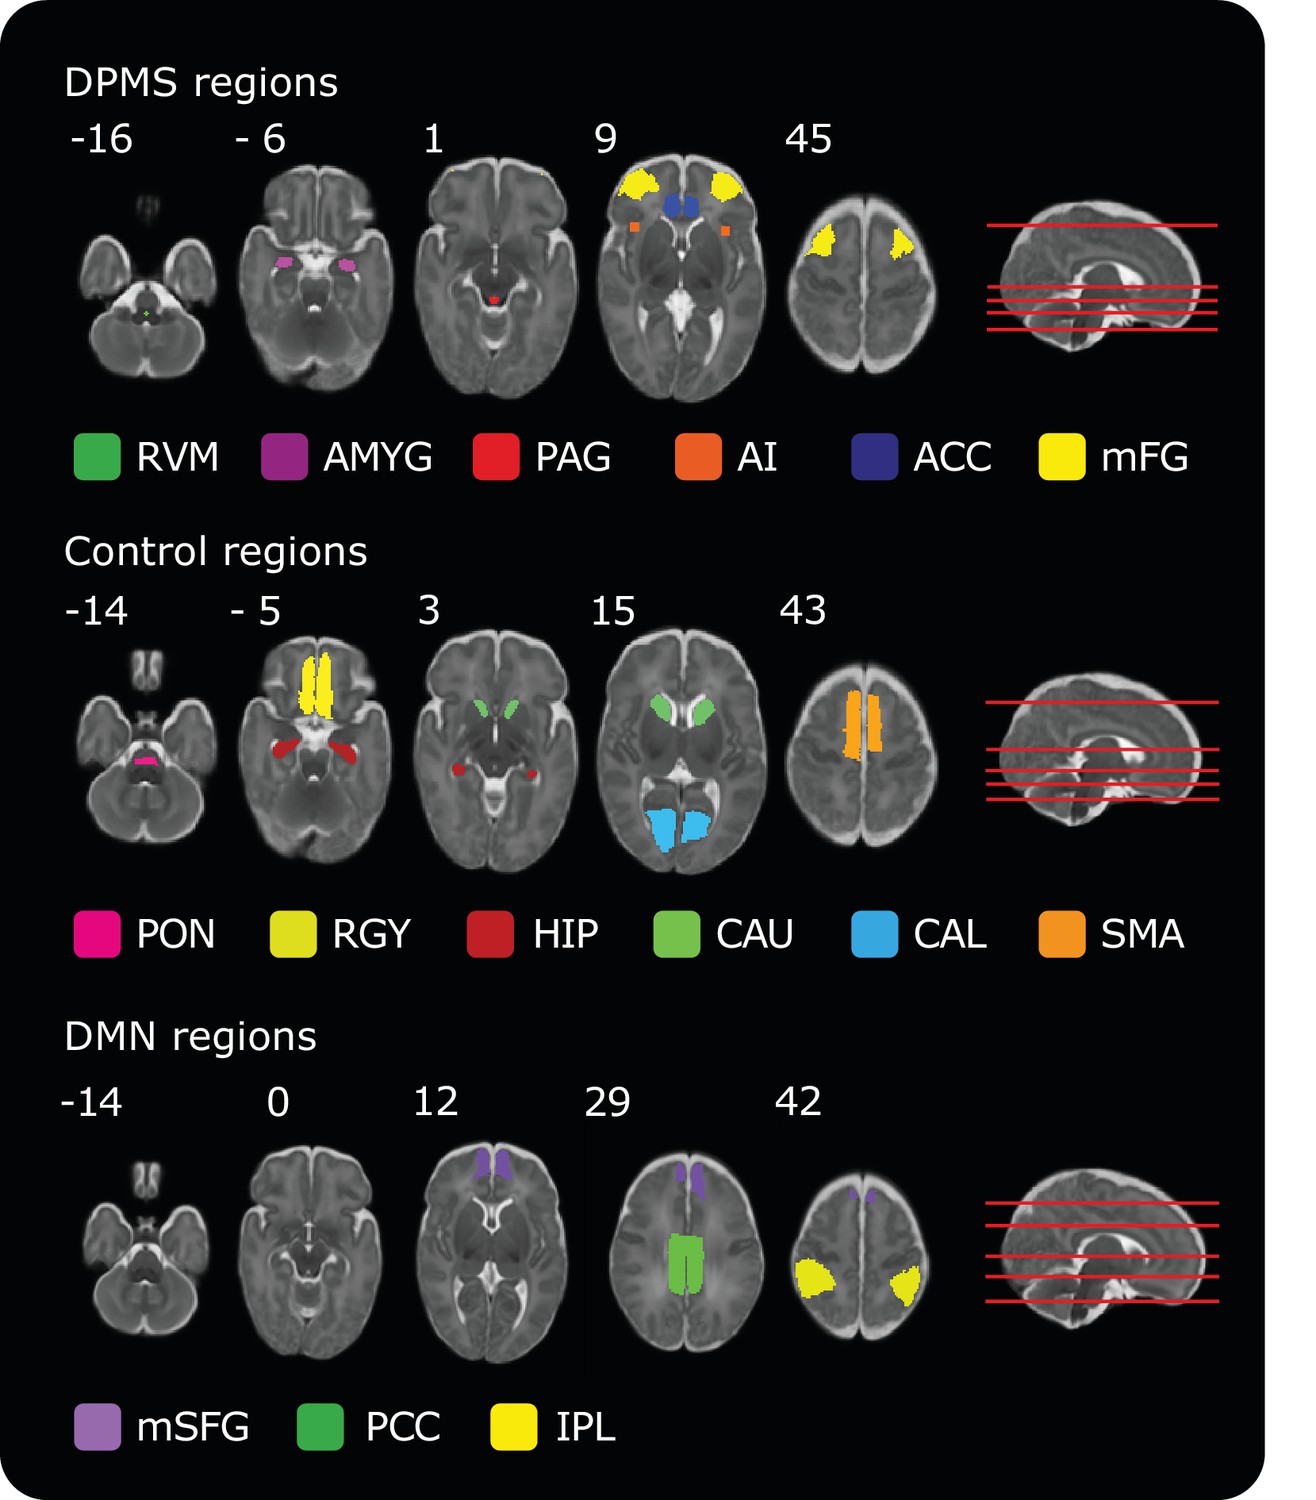
Masks of regions included in the DPMS, Control Network and Default Mode Network.
Numbers by the top left of each transverse image represent coordinate locations in infant template space. The location of each transverse slice is demonstrated (red lines) on the sagittal template brain on the right. The source data (Figure 1—source data 1) contains all the brain regions in standard space for all networks.
Figure 1—figure supplement 2
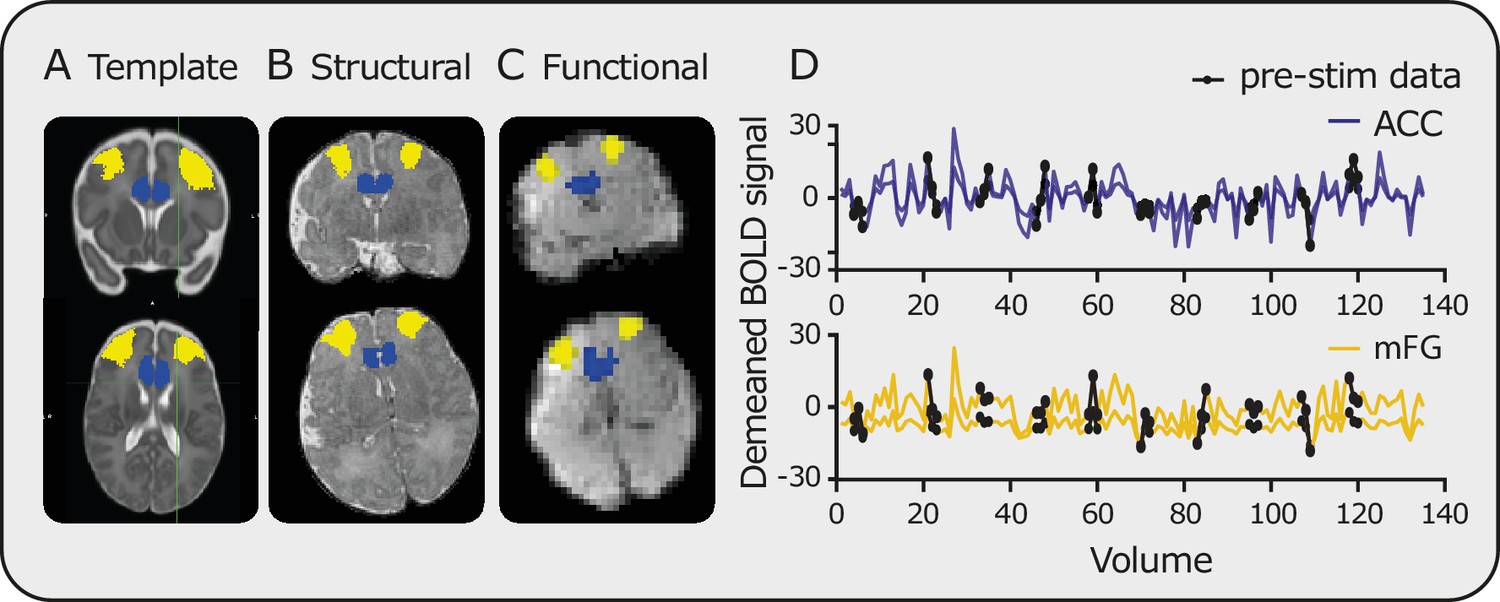
Registration and time series data.
Registration of masks from (A) template to (B) structural and finally to (C) functional space (blue mask = ACC, yellow mask = mFG). (D) Examples of the resulting time series within the ACC (blue) and mFG (yellow). Black circles highlight the pre-stimulus data points.
Figure 1—figure supplement 3
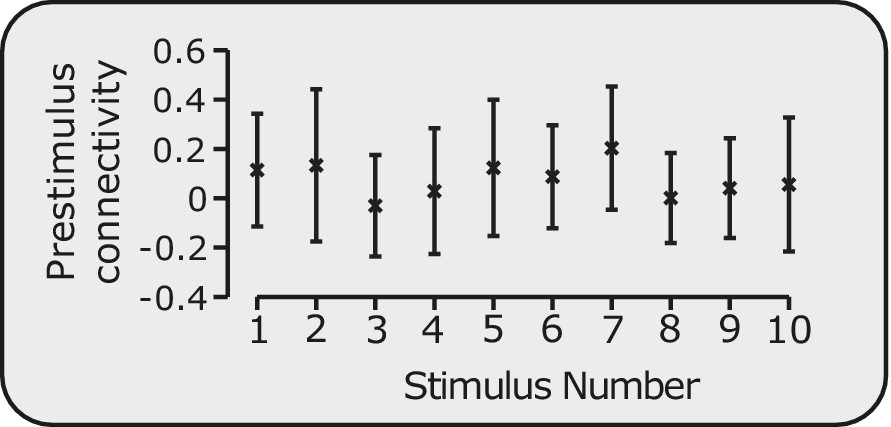
Pre-stimulus connectivity is stable.
Average pre-stimulus connectivity in the DPMS Network across infants prior to each of the 10 stimuli. Error bars indicate mean and standard deviation.
Figure 2
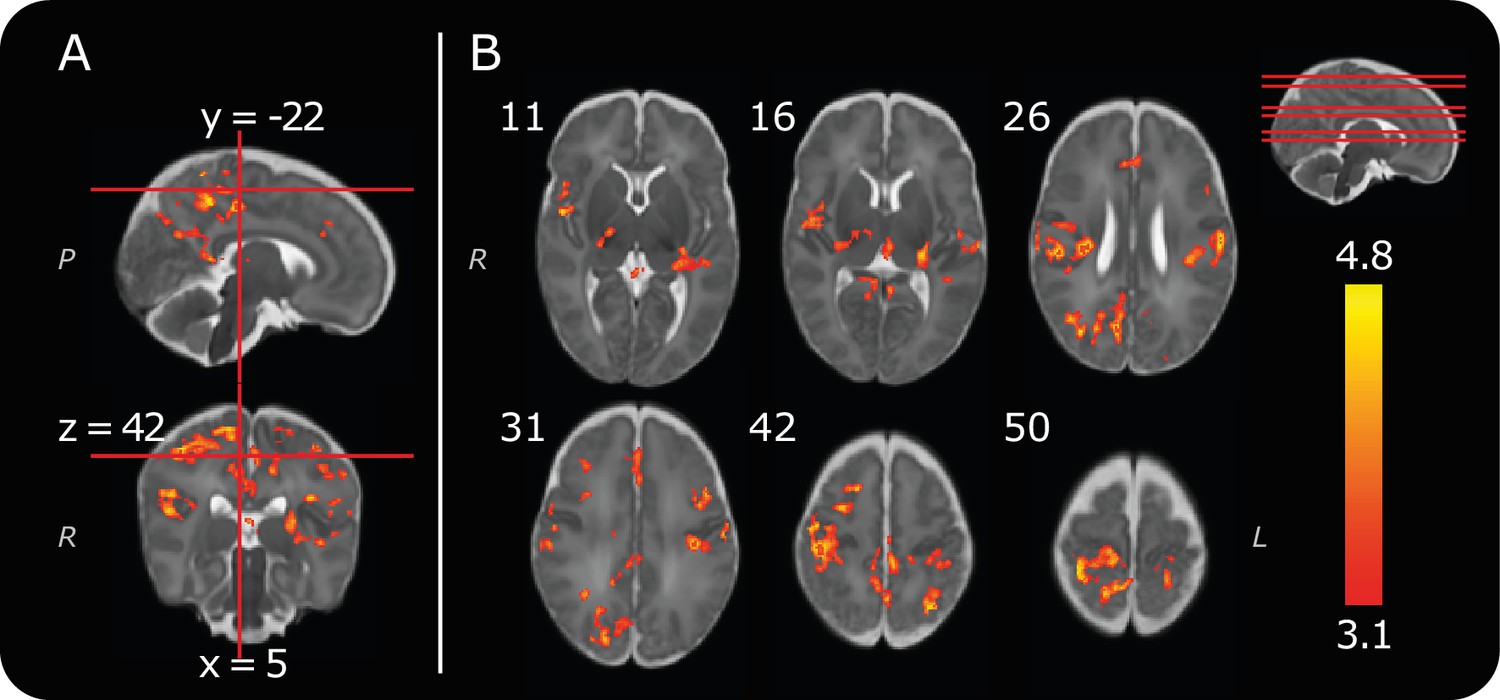
Group noxious-evoked brain activity.
(A) Sagittal and coronal views of the significant group activity from the 13 infants. Red lines indicate how the two images (and the transverse image at z = 42, in B) relate to one another. (B) Transverse images showing significant group activity. The source data is provided in Figure 2—source data 1). Numbers by the top left of each image represent coordinate locations in infant template space. The location of each transverse slice is demonstrated (red lines) on the sagittal template brain in the top right. The activity map is overlaid on a standard template of an infant brain at 40 weeks’ gestational age (Serag et al., 2012). Letters in italics depict axis labels: L = left, R = right, P = posterior. Statistical maps are of cluster thresholded z-statistics (z > 3.1, cluster significance threshold p < 0.05).
-
Figure 2—source data 1
Thresholded group activity map.
- https://doi.org/10.7554/eLife.37125.008
Figure 3 with 2 supplements
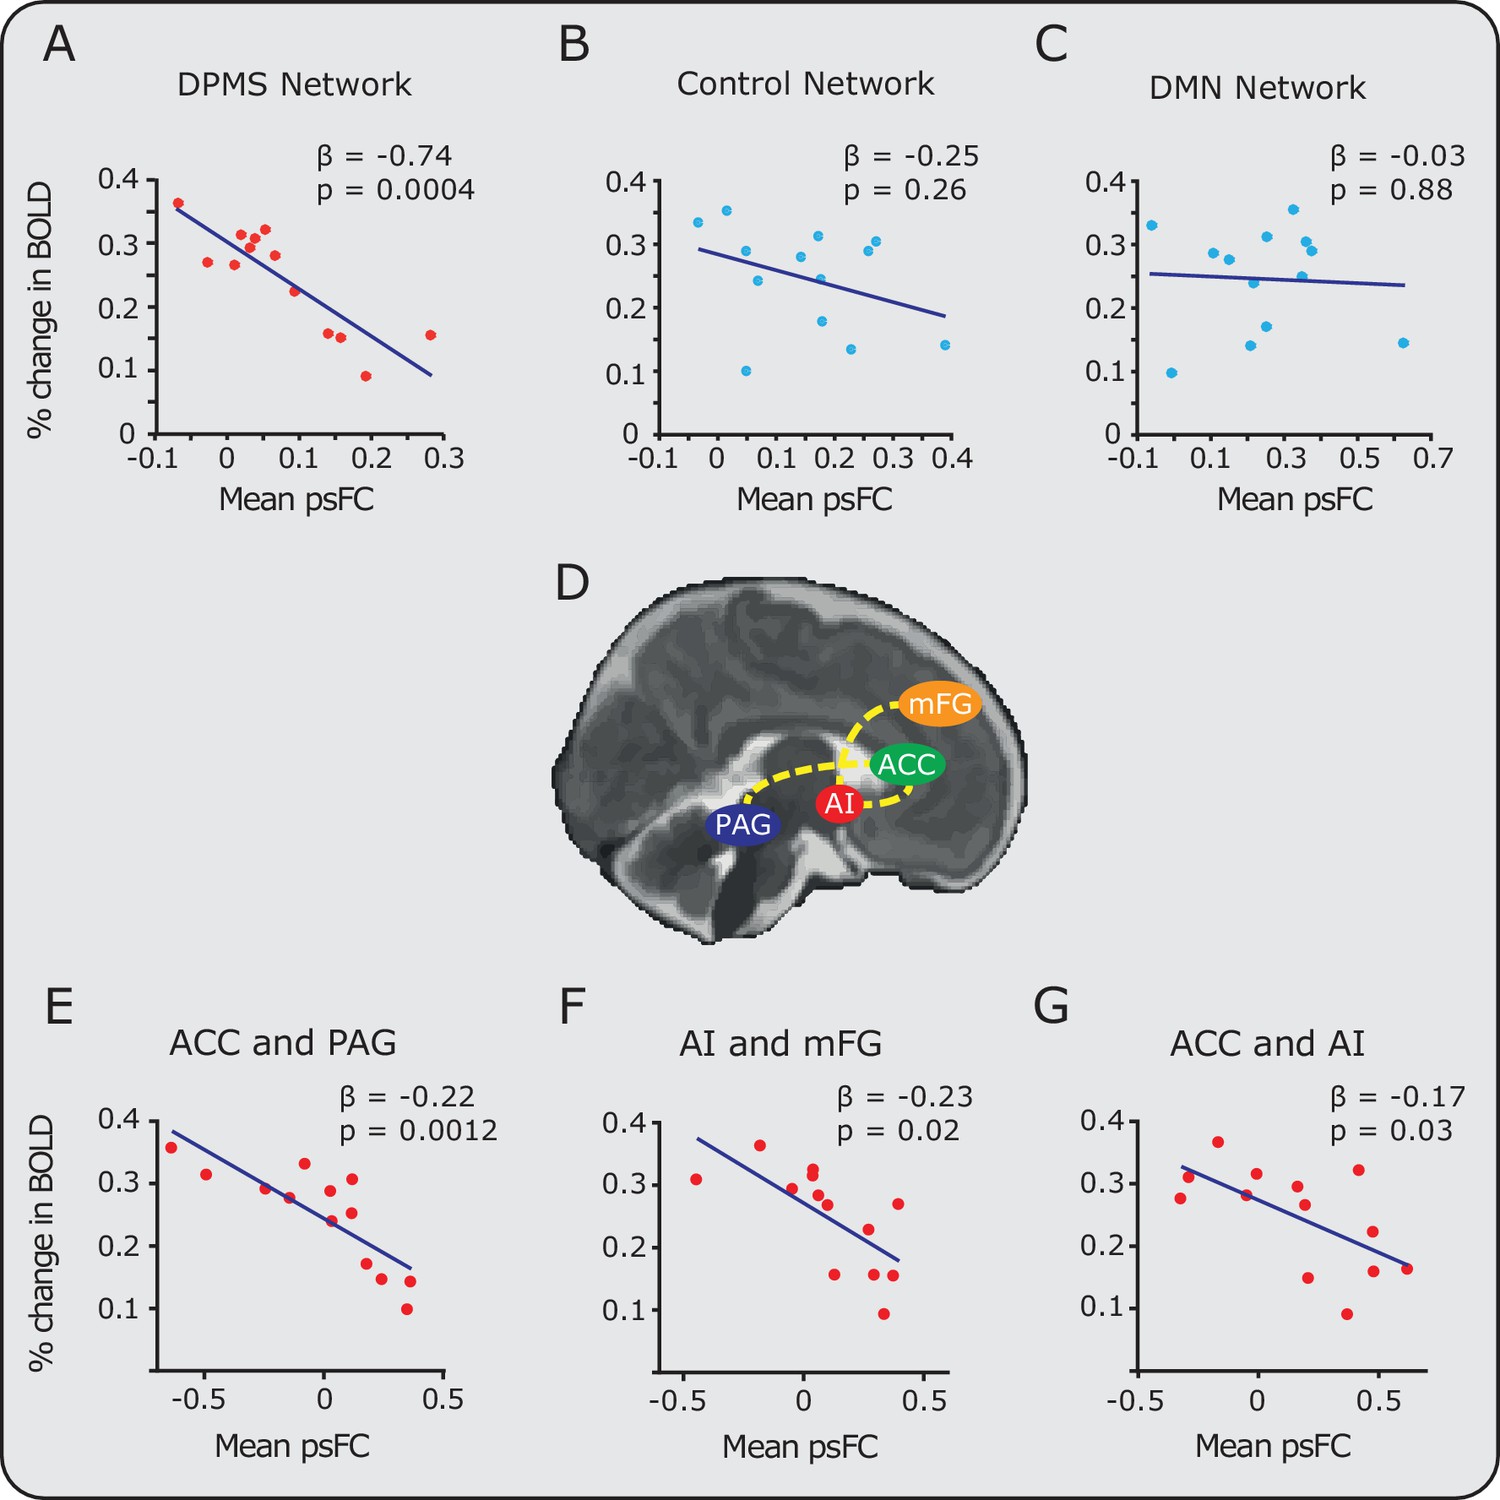
Relationship between noxious-evoked brain activity and pre-stimulus functional connectivity in the DPMS and control networks.
Linear regression models (blue lines) were used to compare pre-stimulus functional connectivity (psFC) with the percentage change in BOLD activity in the (A) DPMS Network, (B) Control Network and (C) the Default Mode Network (DMN). Noxious-evoked brain activity for each infant (calculated within a mask of the group activity, see Figure 2) was adjusted for gestational age (in weeks) at the time of study. Coloured circles represent data from individual infants within the DPMS (red) and control networks (light blue). Figure 3—source data 1 provides the individual PAG and RVM functional masks for each infant. Figure 3—figure supplement 1 shows the relationship between the percentage change in BOLD activity and the psFC in the DPMS Network and Control Network with the brainstem regions removed. (D) The brain schematic highlights the pairs of brain regions where psFC was significantly correlated with percentage change in the BOLD response (dashed yellow lines). (E,F,G) The three pairs of regions within the DPMS Network which demonstrated strong correlations between mean psFC and noxious-evoked brain activity.
-
Figure 3—source data 1
Individual DPMS brainstem masks in functional space.
- https://doi.org/10.7554/eLife.37125.013
Figure 3—figure supplement 1
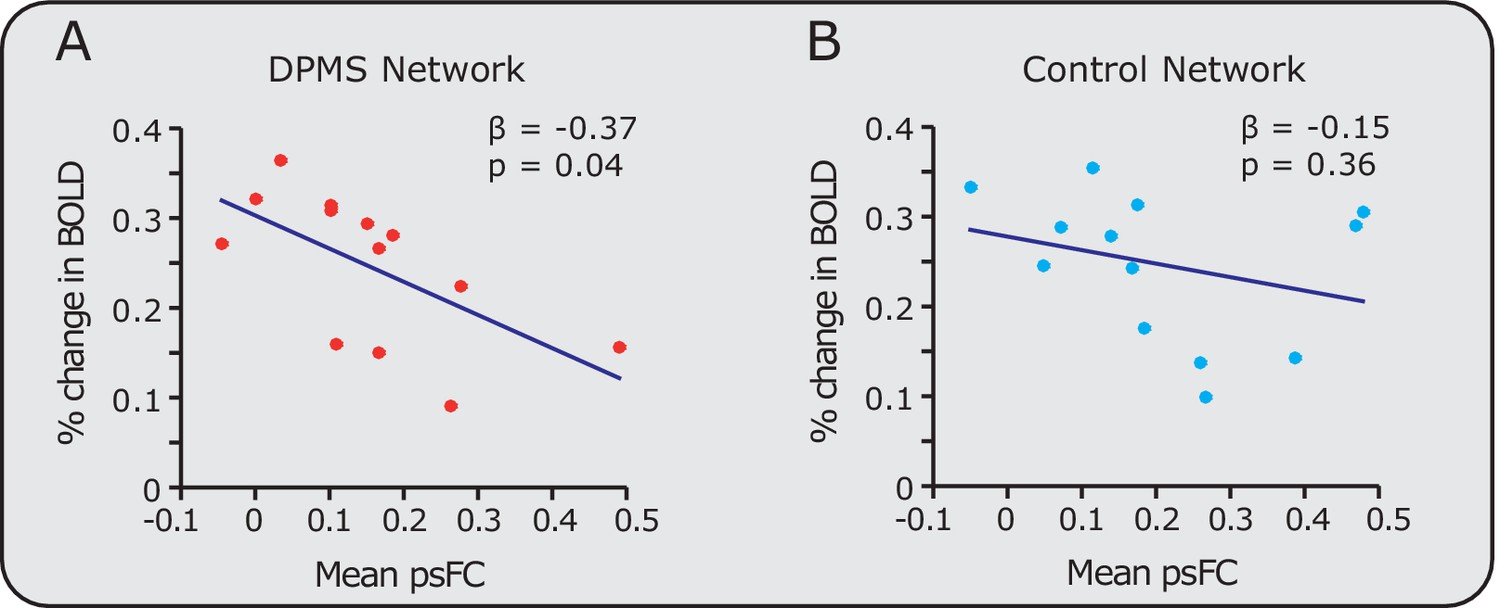
Relationship between percentage change in noxious-evoked brain activity and pre-stimulus functional connectivity in the DPMS Network and Control Network with the brainstem regions removed.
Linear regression model (blue lines) comparison of the pre-stimulus functional connectivity (psFC) with the percentage change in BOLD activity in the (A) DPMS Network and (B) Control Network with the brainstem regions removed. The DPMS psFC was calculated between the AI, ACC, amygdala and middle frontal gyri, and the Control Network psFC was calculated in the bilateral calcarine cortices, caudate, hippocampus, recti gyri and the supplementary motor areas. Coloured circles represent data from individual infants within the DPMS Network (red) and Control Network (light blue) .
Figure 3—figure supplement 2
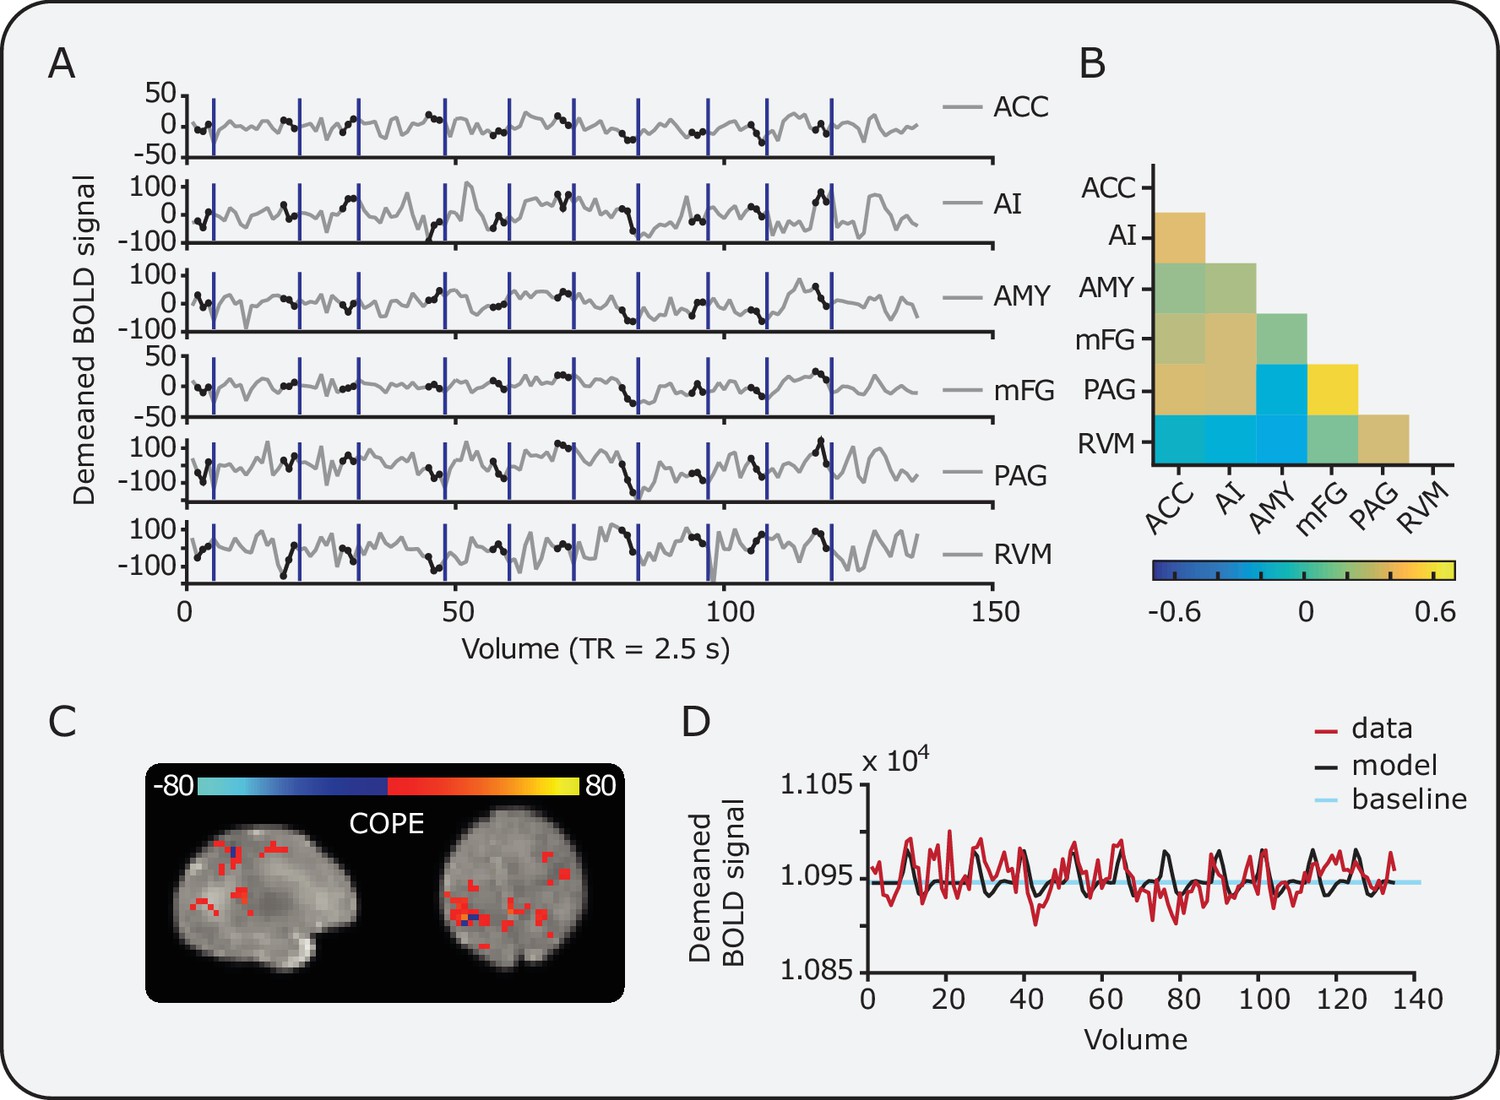
Example data from individual infants.
Data from an individual infant showing (A) the mean time series within all DPMS brain regions and (B) the resulting connectivity matrix. Black circles overlaid on the time series indicate pre-stimulus points. Vertical blue lines indicate the point of stimulation. The minimum inter-stimulus interval was 25 s. (C) Examples of statistical COPE values related to the magnitude of noxious-evoked brain activity and (D) the change in BOLD signal within a single voxel (red) plotted over the expected model fit (black). The statistical COPE map has been masked with the group activity mask (see Figure 2); therefore, coloured regions represent voxels that survive cluster thresholding at the group level. The baseline (light blue) is the temporal mean used to calculate percentage change in BOLD.
Tables
Table 1
Significant positive clusters of noxious-evoked brain activity, observed across the whole group (n = 13, cluster forming threshold: z = 3.1, cluster significance threshold, p = 0.05).
This table provides an anatomical description and the location of the peak z-statistic within each active brain region. The group activity reported consisted of 14 distinct clusters, some of which spanned multiple brain regions.
| Anatomical description of location of activity | Maximum z-statistic within cluster | Coordinates of maximum z-statistic in infant template space | |||
|---|---|---|---|---|---|
| X | Y | Z | |||
| Post-central gyrus | Contra | 4.8 | 7.7 | −27.5 | 50.7 |
| Ipsi | 4.7 | −23.2 | −27.5 | 43.8 | |
| Posterior cingulate sulcus | Contra | 4.8 | 6.9 | −23.2 | 36.0 |
| Ipsi | 3.8 | −6.0 | −20.6 | 34.3 | |
| Superior parietal lobule | Contra | 4.8 | 12.9 | −44.6 | 47.2 |
| Ipsi | 4.7 | −14.6 | −43.8 | 43.8 | |
| Thalamus | Contra | 4.7 | 16.3 | −19.7 | 12.0 |
| Ipsi | 4.6 | −13.8 | −24.0 | 16.3 | |
| Supra-marginal gyrus | Ipsi | 4.7 | −25.8 | −29.2 | 37.8 |
| Contra | 4.6 | 30.1 | −24.9 | 28.3 | |
| Superior frontal sulcus | Contra | 4.7 | 16.3 | −4.3 | 44.6 |
| Middle frontal gyrus | Ipsi | 4.7 | −27.5 | 0.9 | 30.0 |
| Contra | 4.0 | 24.1 | 5.2 | 33.5 | |
| Cuneus | Contra | 4.7 | 7.7 | −53.2 | 26.6 |
| Ipsi | 4.2 | −5.1 | −50.7 | 23.2 | |
| Superior parietal lobe / Precuneus | Contra | 4.7 | 5.2 | −35.2 | 39.5 |
| Ipsi | 4.0 | −0.9 | −43.8 | 41.2 | |
| Pre-central gyrus / Central sulcus | Contra | 4.6 | 24.1 | −14.6 | 45.5 |
| Ipsi | 3.9 | −8.6 | −23.2 | 53.2 | |
| Posterior insula | Contra | 4.6 | 19.0 | −19.7 | 24.0 |
| Parietal operculum | Ipsi | 4.6 | −34.4 | −21.4 | 18.0 |
| Superior temporal gyrus / Posterior operculum | Contra | 4.6 | 31.0 | −27.5 | 22.3 |
| Occipital gyrus | Ipsi | 4.6 | −12.0 | −63.5 | 21.4 |
| Anterior cingulate cortex | Ipsi | 4.2 | −1.7 | 14.7 | 24.0 |
| Contra | 3.9 | 4.3 | 12.1 | 25.7 | |
| Superior temporal gyrus | Ipsi | 4.2 | −27.5 | −28.3 | 12.8 |
Additional files
-
Transparent reporting form
- https://doi.org/10.7554/eLife.37125.014
Download links
A two-part list of links to download the article, or parts of the article, in various formats.
Downloads (link to download the article as PDF)
Open citations (links to open the citations from this article in various online reference manager services)
Cite this article (links to download the citations from this article in formats compatible with various reference manager tools)
The influence of the descending pain modulatory system on infant pain-related brain activity
eLife 7:e37125.
https://doi.org/10.7554/eLife.37125


