A complex peripheral code for salt taste in Drosophila
- University of British Columbia, Canada
Figures
Figure 1 with 1 supplement
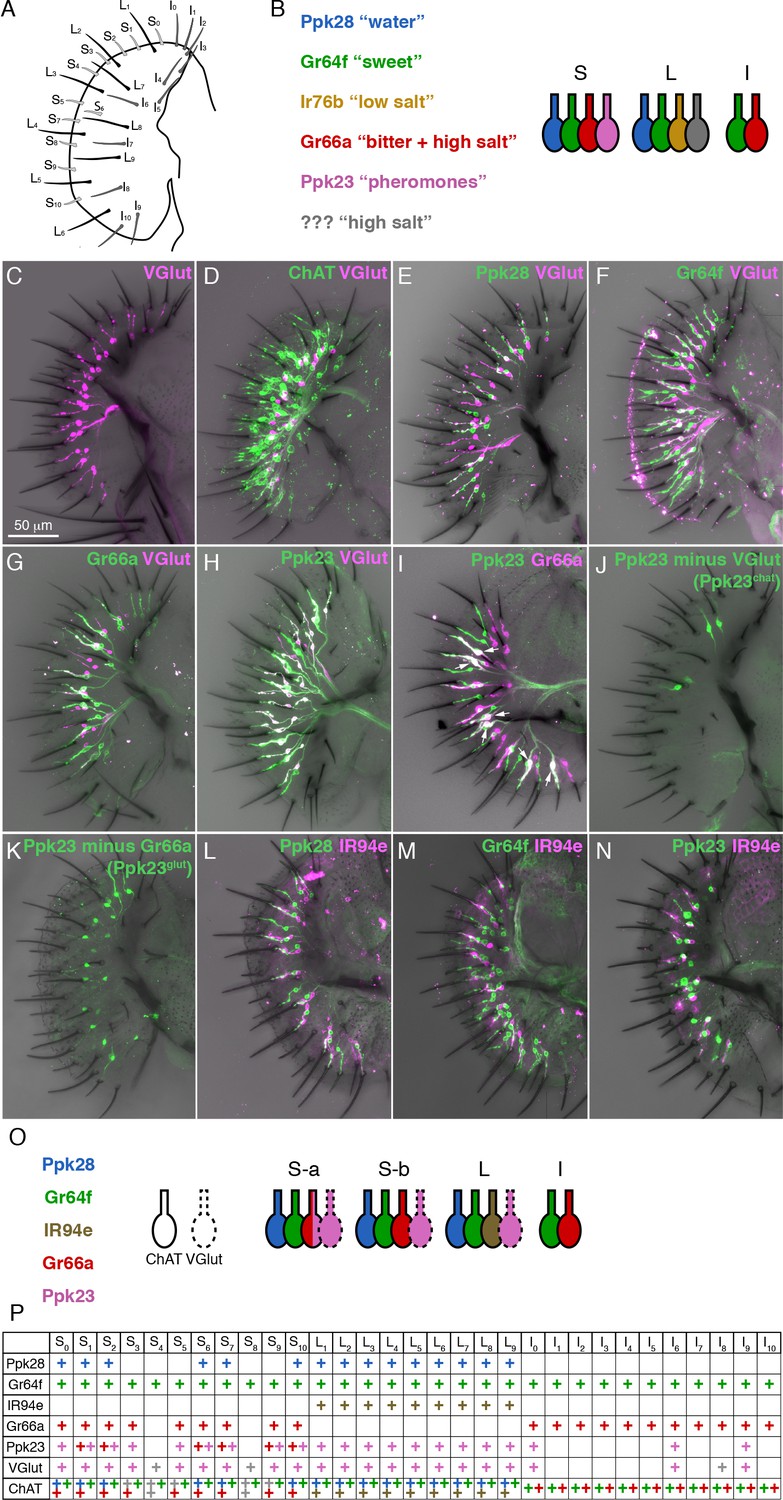
A molecular map of the fly labellum.
(A) A schematic of sensillum identities in the fly labellum. (B) A summary of how GRN identities are currently viewed across the three sensillum types, with each color representing a GRN class with its most notable molecular label (if known) and its ascribed response properties. (C–H) Single labellar palps immunolabelled for VGlut-Gal4 driving UAS-tdTomato (magenta) alone (C) or in combination with LexAop-CD2::GFP (green) under the control of ChAT-LexA (D), Ppk28-LexA (E), Gr64f-LexA (F), Gr66a-LexA (G), or Ppk23-LexA (H). (I) Ppk23-LexA (green) and Gr66a-Gal4 (magenta) label partially overlapping populations. Arrows indicate sensilla where two Ppk23 GRNs exist, one of which co-expresses Gr66a. (J–K) Ppk23 subpopulations displayed by restricting Ppk23-Gal4 expression with VGlut-Gal80 (J), or Gr66a-LexA and LexAop-Gal80 (K). (L–N) IR94e-Gal4 labellum expression (magenta), co-labelled with Ppk28-LexA (L), Gr64f-LexA (M), and Ppk23-LexA (N). (O) Summary of newly defined GRN types following our mapping experiments. (P) Detailed map of each sensillum. Colors of ‘+' in chart indicate cell type. Grey denotes unknown identity. The VGlut +GRNs observed in I-type sensilla were sporadic and small, which is why they are not considered in the summary.
Figure 1—figure supplement 1
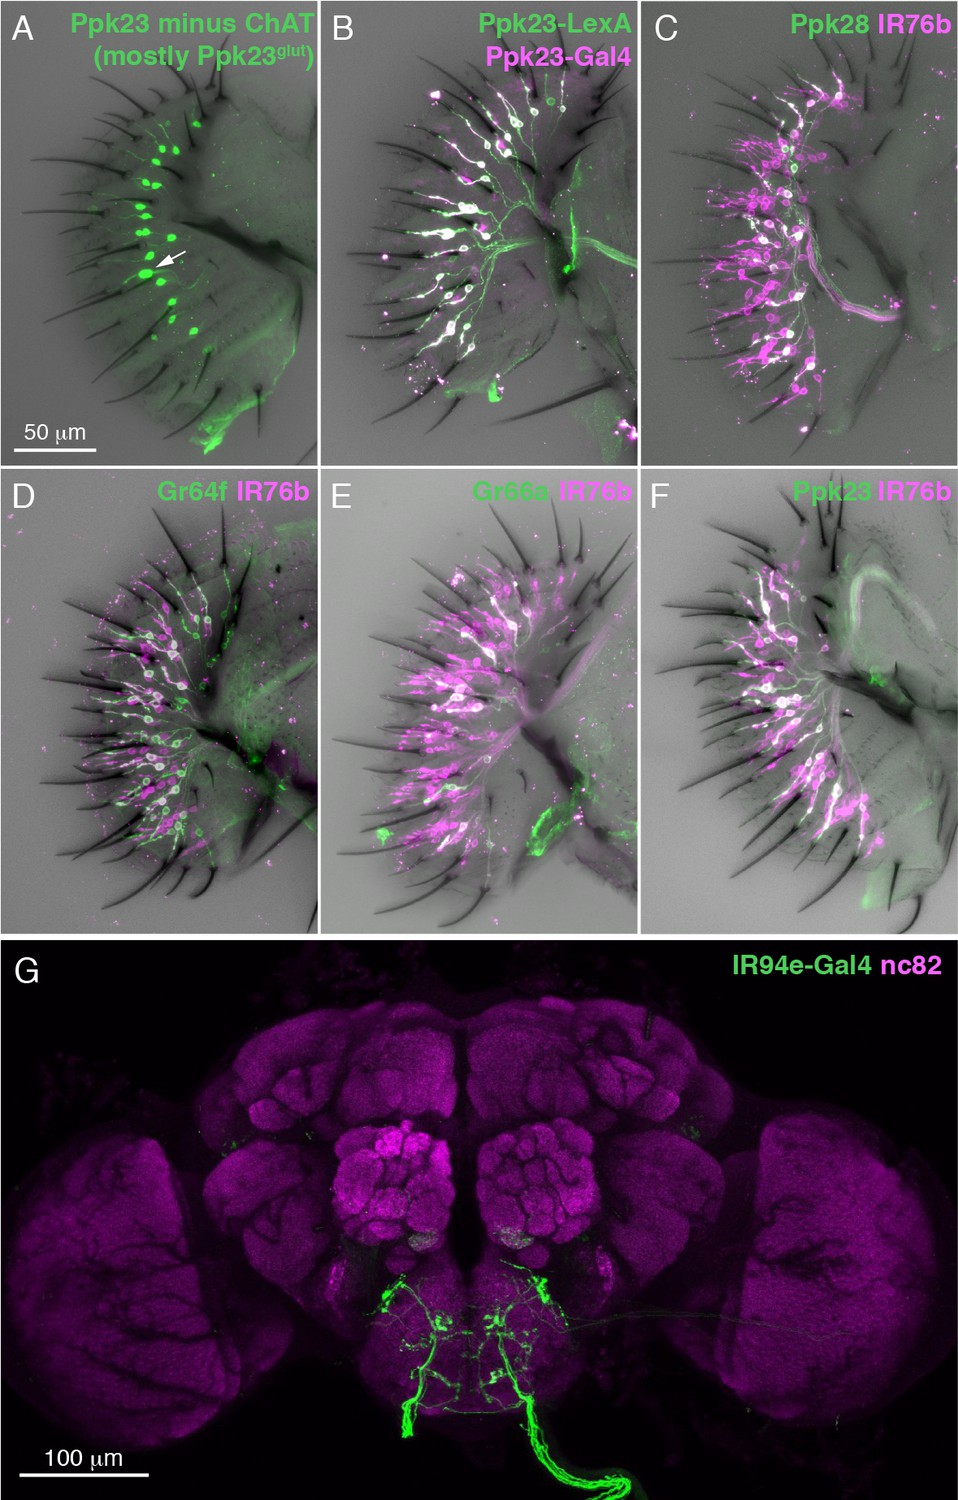
Molecular mapping of characterized and uncharacterized labellar GRN types.
(A) Labellum expression of Ppk23-Gal4 restricted with ChAT-Gal80. Arrow indicates an S-type sensillum with two Ppk23 +GRNs, indicating incomplete elimination of Ppk23chat expression. (B) Ppk23-Gal4 (magenta) and Ppk23-LexA (green) label nearly identical labellar GRN populations. (C–F) IR76b-Gal4 expression (magenta) in labella co-labelled with markers for different GRN populations (green): Ppk28-LexA (C), Gr64f-LexA (D), Gr66a-LexA (E), and Ppk23-LexA (F). (G) IR94e projections to the brain revealed by IR94e-Gal4 driving UAS-CsChrimson (green). Neuropil is labelled with nc82 (magenta).
Figure 2 with 2 supplements
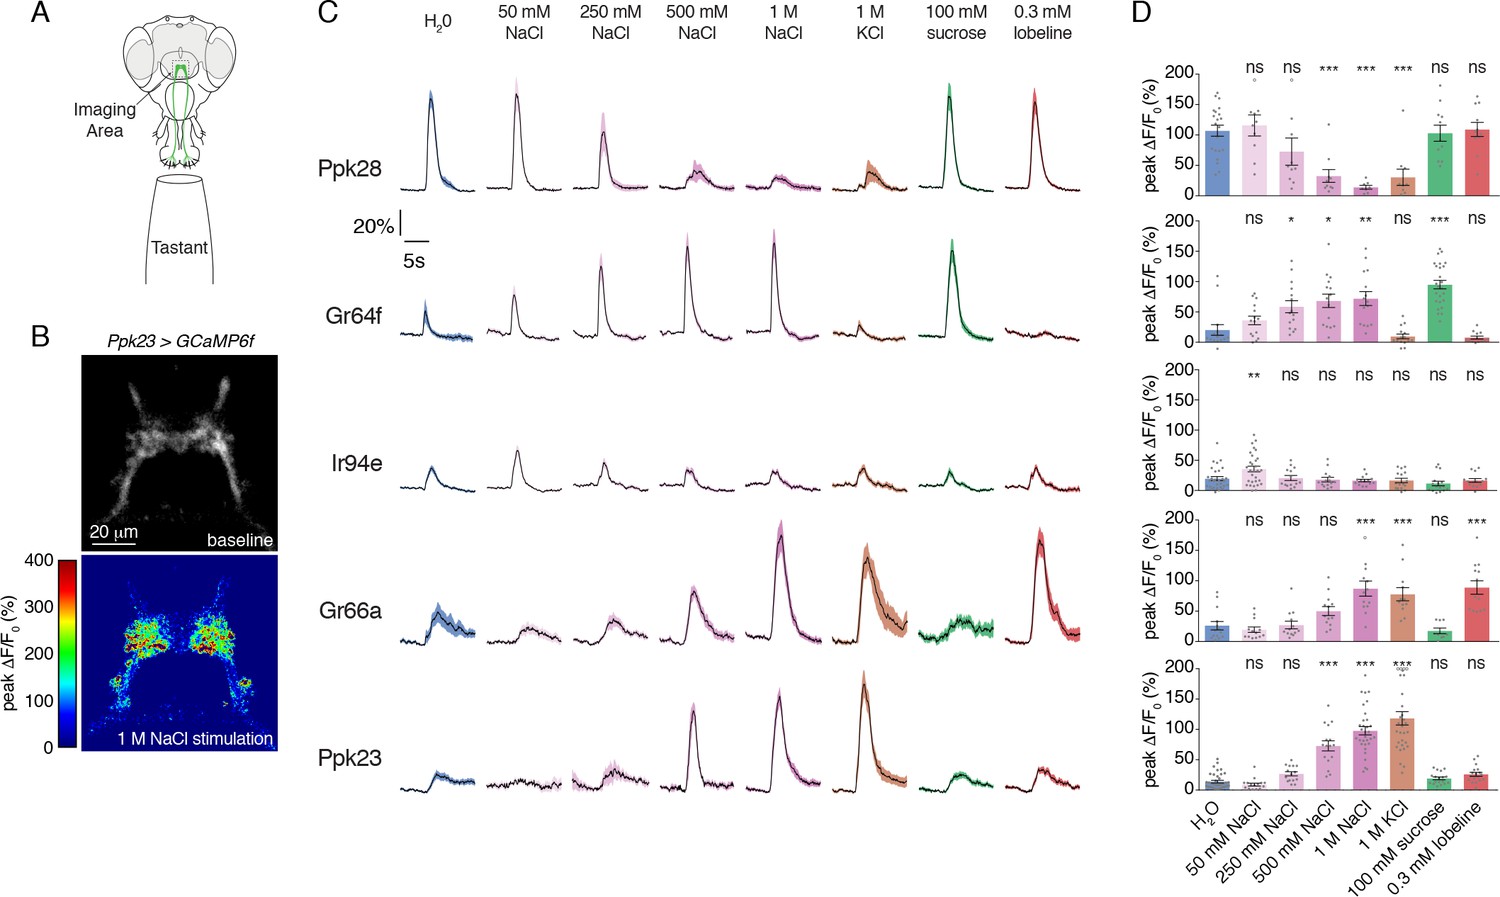
Salt activates or inhibits every GRN class.
(A) Schematic of calcium imaging preparation. Taste neurons are stimulated on the proboscis, while GCaMP6f fluorescence is recorded at the synaptic terminals in the SEZ. (B) Representative heat map showing activation of Ppk23 GRNs with 1 M NaCl. (C) GCaMP6f fluorescence changes over time, following stimulation of each GRN class with the indicated tastants. Lines and shaded regions represent mean ±SEM, with stimulation occurring at 5 s. In each case, UAS-GCaMP6f is expressed under the control of the indicated GRN-Gal4, with the exception of Ppk28, which is from Ppk28-LexA and LexAop-GCaMP6f. (D) Peak fluorescence changes during each stimulation. Bars represent mean ±SEM. n = 8 – 37. Open circles indicate values that were higher than the y-axis maximum. Asterisks indicate significant difference from water by one-way ANOVA with Bonferroni post hoc test, *p<0.05, **p<0.01, ***p<0.001.
-
Figure 2—source data 1
Raw numerical data for Figure 2 and associated figure supplements.
- https://doi.org/10.7554/eLife.37167.008
Figure 2—figure supplement 1
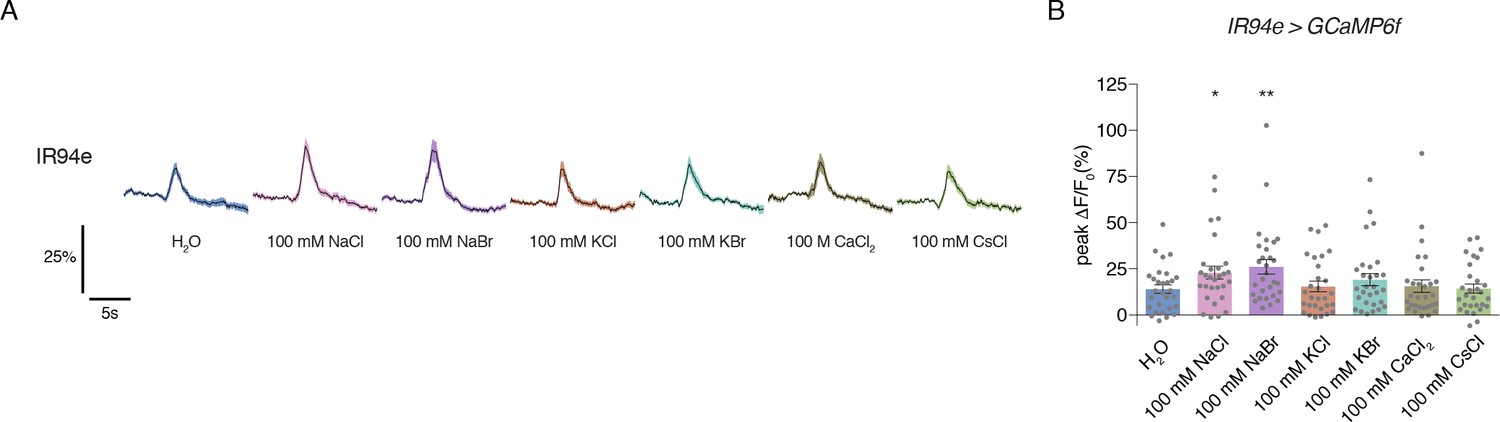
IR94e neurons show weak, low sodium-specific responses to salt.
(A) Time curves of GCaMP6f signal in IR94e GRNs following stimulation with indicated tastants. Lines and shaded regions indicate mean ±SEM. (B) Peak changes during stimulation of IR94e neurons with each tastant. Bars represent mean ±SEM, n = 29. Asterisks indicate significant difference from water by one-way ANOVA with Bonferroni post hoc test, *p<0.05, **p<0.01.
Figure 2—figure supplement 2
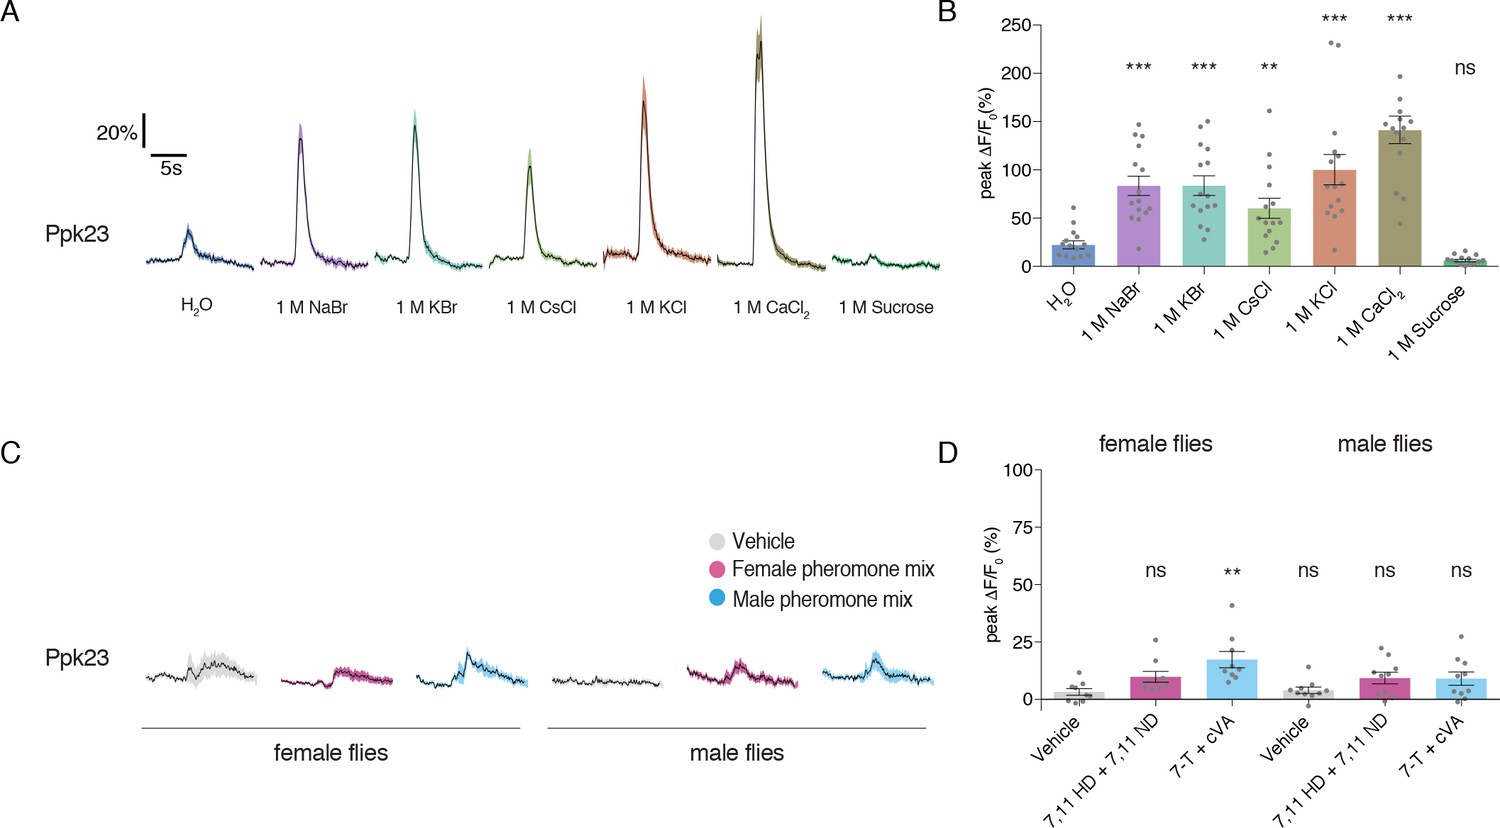
Ppk23 neurons respond strongly to all salts and only weakly to pheromones.
(A) Time curves of GCaMP6f activation in Ppk23 GRNs following stimulation with 1 M solutions of various salts and sucrose. Lines and shaded regions indicate mean ±SEM. (B) Peak changes during stimulation with each tastant. Bars represent mean ±SEM, n = 15. Asterisks indicate significant difference from water by one-way ANOVA with Bonferroni post hoc test, *p<0.05, **p<0.01, ***p<0.001. (C) Time curves of GCaMP6f activation in Ppk23 GRNs following stimulation with male or female pheromone mixtures. Lines and shaded regions indicate mean ±SEM. Female pheromone mixture is 7,11 HD plus 7,11 ND; male mixture is 7 T and cVA. (D) Peak changes during stimulation with each pheromone mix. Bars represent mean ±SEM, n = 9–10. Asterisks indicate significant difference from vehicle stimulations by one-way ANOVA with Bonferroni post hoc test, *p<0.05, **p<0.01, ***p<0.001.
Figure 3 with 1 supplement
Morphological and functional distinction between Ppk23 subclasses.
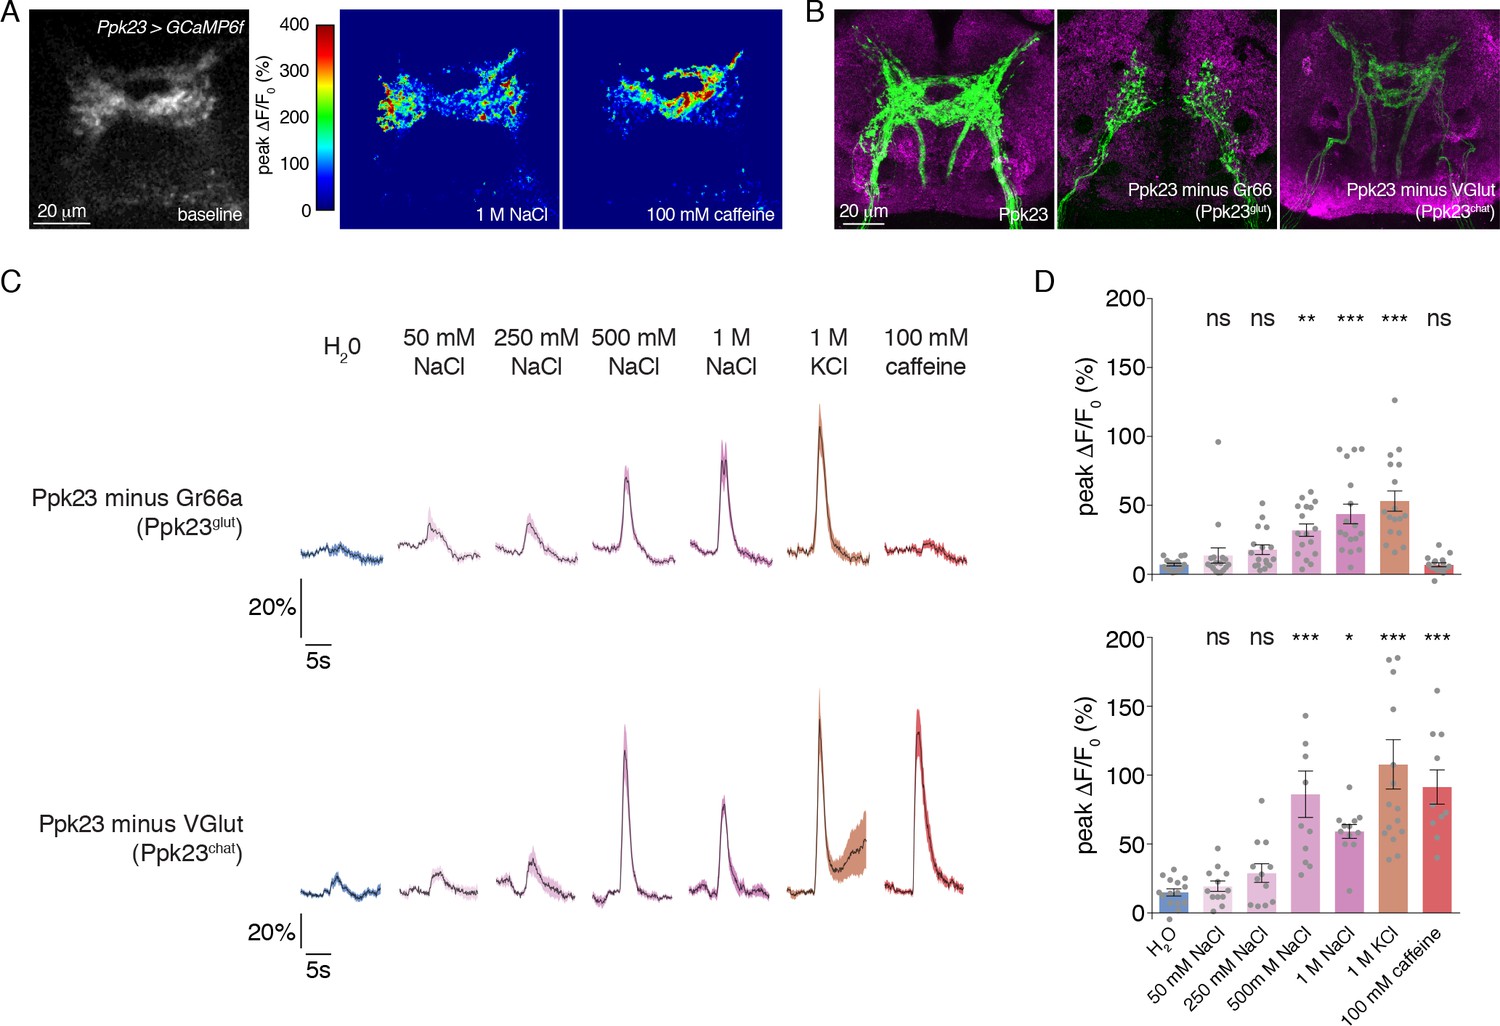
(A) Representative heat maps showing the activation Ppk23 GRNs in a single fly stimulated with 1 M NaCl and 100 mM caffeine. Salt primarily results in lateral activation, while bitter activates medial projections. (B) The projections of Ppk23 subsets targeting the SEZ, as revealed by immunofluorescent detection of GFP (green). Neuropil is labeled by nc82 (magenta). The full Ppk23 population targets both medial and lateral regions (left panel). Ppk23glut GRNs, revealed by restriction of Ppk23-Gal4 with Gr66a-LexA and LexAop-Gal80, target only lateral areas (middle panel). Ppk23chat projections, revealed by restriction of Ppk23-Gal4 with VGlut-Gal80, project to medial targets (right panel). (C) GCaMP6f fluorescence changes over time, following stimulation of each Ppk23 subset with the indicated tastants. Each fly has Ppk23-Gal4 driving UAS-GCaMP6f, restricted by either Gr66a-LexA and LexAop-Gal80 (top row) or Vglut-Gal80 (bottom row). Lines and shaded regions represent mean ±SEM, with stimulation occurring at 5 s. (D) Peak fluorescence changes during each stimulation. Bars represent mean ±SEM, n = 10–17. Asterisks indicate significant difference from water by one-way ANOVA with Bonferroni post hoc test, *p<0.05, **p<0.01, ***p<0.001.
-
Figure 3—source data 1
Raw numerical data for Figure 3 and associated figure supplements.
- https://doi.org/10.7554/eLife.37167.011
Figure 3—figure supplement 1

Ppk23glut GRNs respond to high salt.
(A) GCaMP6f expression was primarily restricted to Ppk23glut GRNs using Ppk23-Gal4 in combination with ChAT-Gal80. Lines and shaded regions represent mean ±SEM of responses over time, with stimulation occurring at 5 s. (B) Peak fluorescence changes during each stimulation. Bars represent mean ±SEM, n = 17. Asterisks indicate significant difference from water by one-way ANOVA with Bonferroni post hoc test, *p<0.05, **p<0.01, ***p<0.001.
Figure 4 with 3 supplements
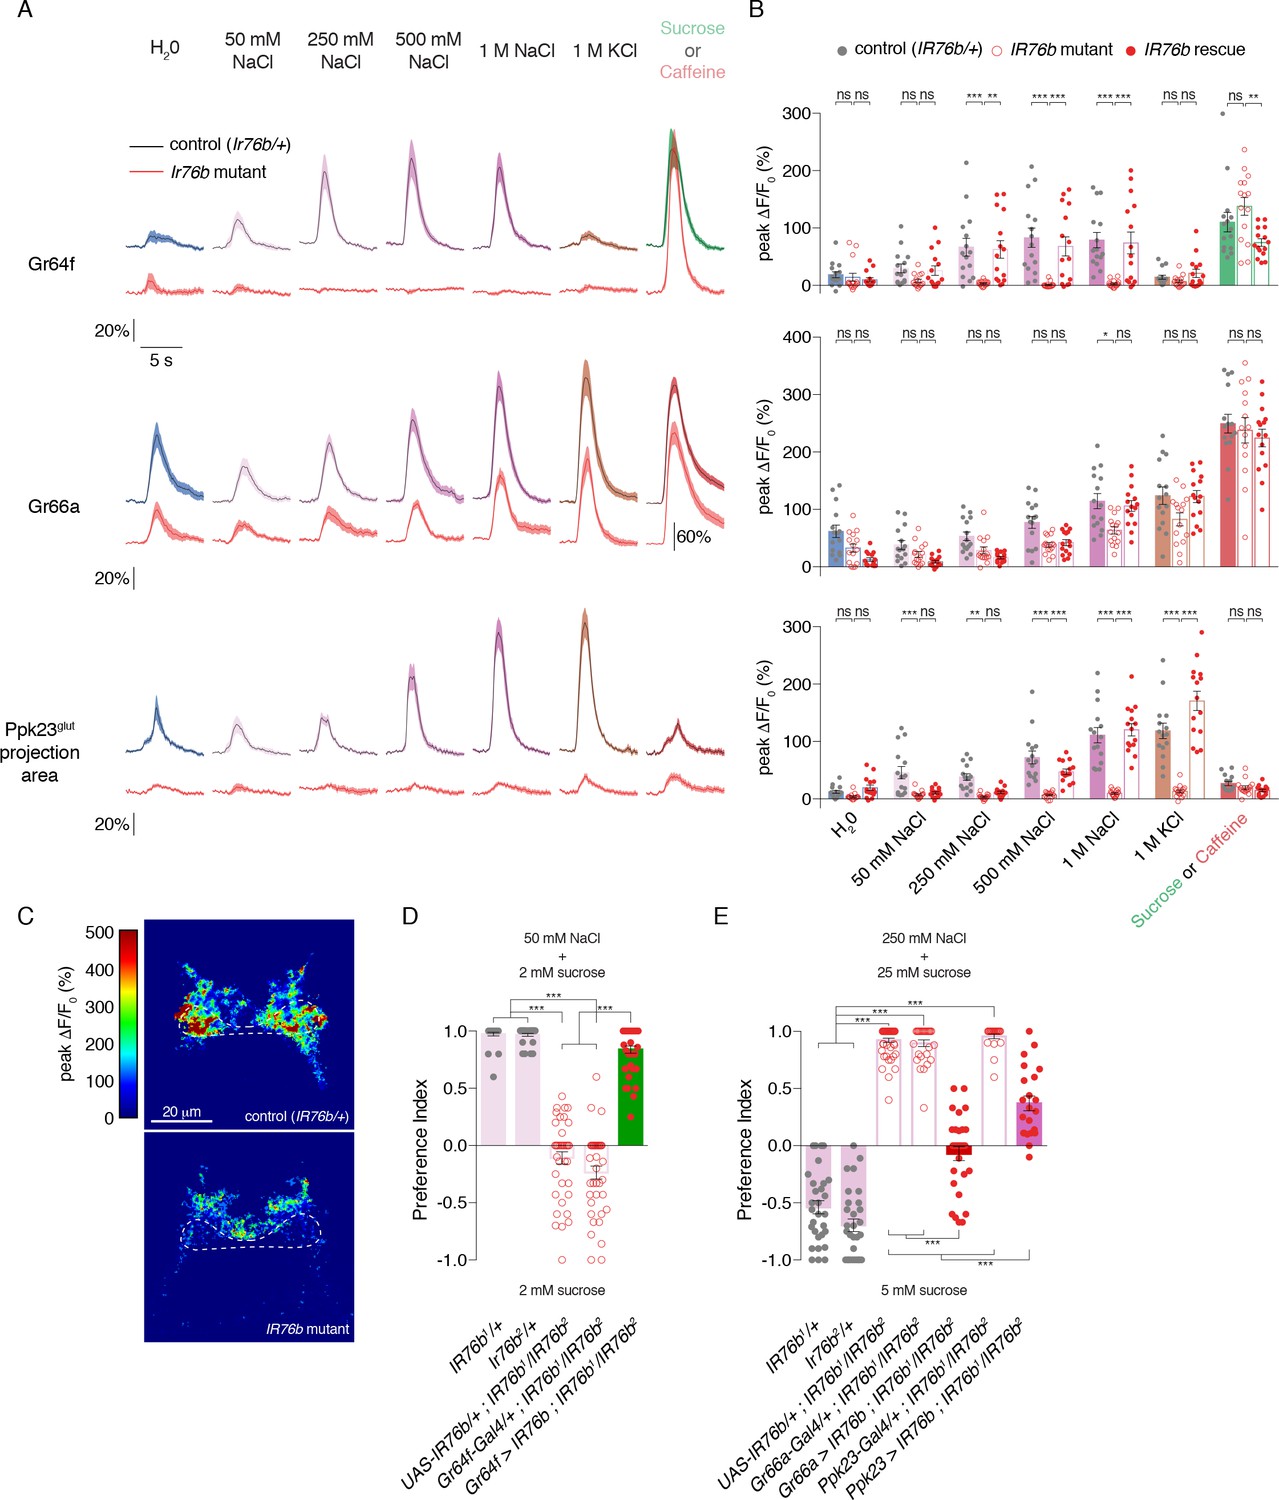
IR76b is necessary for Gr64f and Ppk23glut, but not Gr66a, salt responses.
(A) GCaMP6f fluorescence changes over time for each indicated GRN type, following stimulation with the denoted tastants. Black lines are for control genotypes (IR76b1/+ background), red lines for IR76b1/IR76b2 mutants. ‘20%’ scale bar refers to all curves except for the Gr66a caffeine curves, which are scaled by the ‘60%’ bar. For Ppk23glut, GCaMP6f was expressed under the control of Ppk23-LexA, but only the lateral regions corresponding to Ppk23glut projections were quantified. The pre-stimulus and post-stimulus periods were truncated in all curves to more clearly illustrate stimulus phase. (B) Peak fluorescence changes during each stimulation. Bars represent mean ±SEM, n = 15 for each stimulus. Filled grey circles (control), open red circles (IR76b mutants), and filled red circles (cell-specific IR76b rescue in imaged GRN population) indicate values for individual replicates. Asterisks indicate significant difference between control and mutant or mutant and rescue responses for each stimulus by two-way ANOVA with Bonferroni post hoc test, *p<0.05, **p<0.01, ***p<0.001. (C) Representative heat maps of salt-evoked activity in Ppk23 neurons from control (top) and IR76b mutant (bottom) animals. Activation is predominantly lateral in controls and medial in mutants. Dotted line demarks representative area quantified to measure Ppk23glut-specific response (see Materials and methods). (D) Low salt attraction of IR76b mutants, heterozygous controls, and cell-specific rescue of IR76b in Gr64f sweet neurons. Preference measured in binary choice assay with 50 mM NaCl plus 2 mM sucrose versus 2 mM sucrose alone. Bars represent mean ±SEM. n = 30 – 40 groups of 10 flies each, with filled grey circles (controls), open red circles (IR76b mutants), or filled red circles (rescues) indicating values for individual groups. Asterisks denote significance by one-way ANOVA with Bonferroni post hoc test, ***p<0.001. (E) High salt avoidance of IR76b mutants, heterozygous controls, and cell-specific rescue of IR76b in Gr66a bitter neurons or Ppk23 neurons. Preference measured in binary choice assay with 250 mM NaCl plus 25 mM sucrose versus 5 mM sucrose alone. Bars represent mean ±SEM. n = 22 – 52 groups of 10 flies each, with filled grey circles (controls), open red circles (IR76b mutants), or filled red circles (rescues) indicating values for individual groups. Asterisks denote significance by one-way ANOVA with Bonferroni post hoc test, ***p<0.001.
-
Figure 4—source data 1
Raw numerical data for Figure 4 and associated figure supplements.
- https://doi.org/10.7554/eLife.37167.016
Figure 4—figure supplement 1
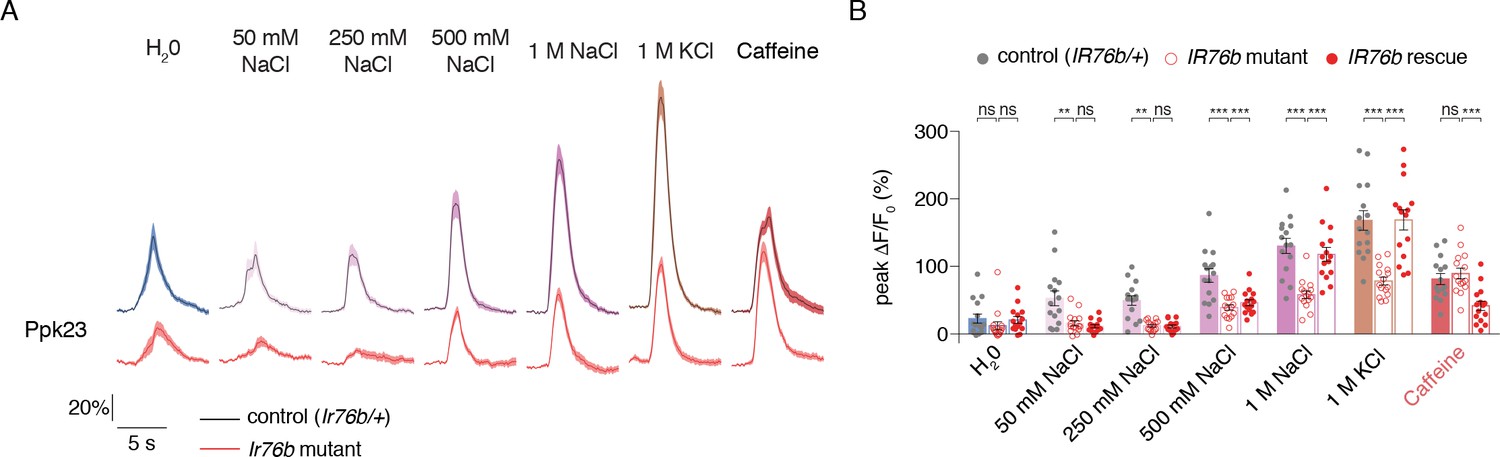
Ppk23 GRN salt responses require IR76b.
(A) GCaMP6f fluorescence changes over time for full Ppk23 projections. Black lines are for control genotypes (IR76b1/+ background), red lines for IR76b1/IR76b2 mutants. (B) Peak fluorescence changes during each stimulation. Bars represent mean ±SEM, n = 15. Filled grey circles (control), open red circles (IR76b mutants), and filled red circles indicate values for individual replicates. Asterisks indicate significant difference between control and mutant responses for each stimulus by two-way ANOVA with Bonferroni post hoc test, *p<0.05, **p<0.01, ***p<0.001.
Figure 4—figure supplement 2
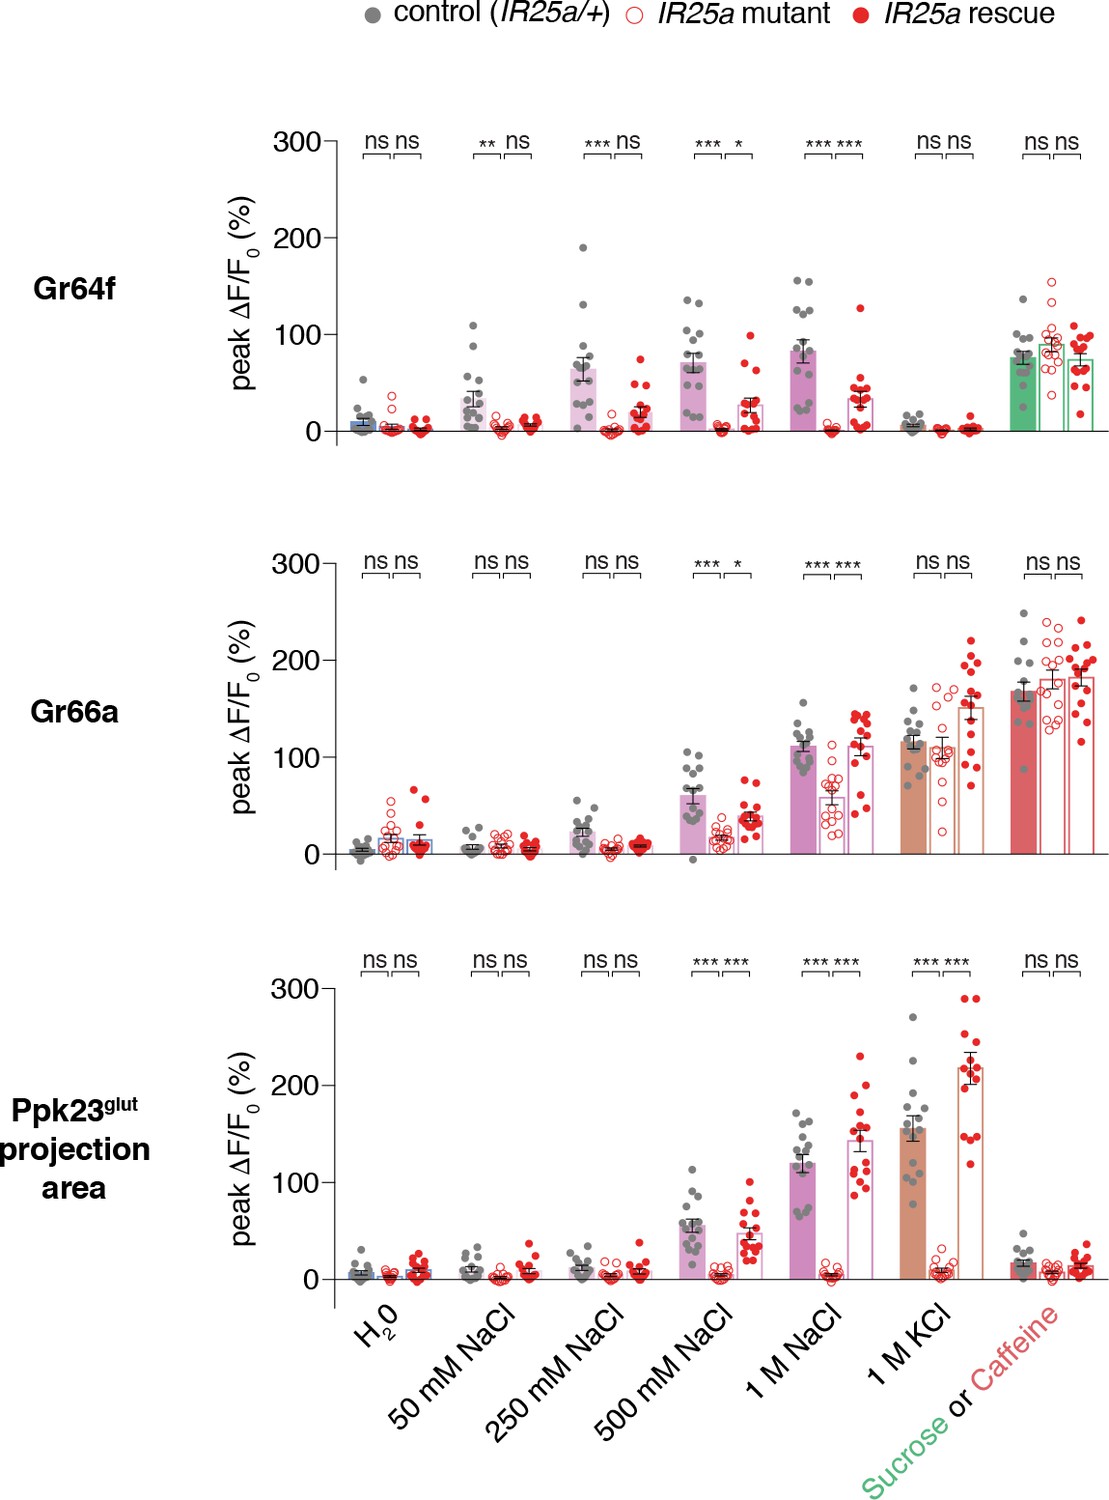
A subset of GRN salt responses requires IR25a.
Peak values of GCaMP6f fluorescence changes for each GRN type in heterozygous controls (filled grey circles), IR25a mutants (open red circles), and rescues (filled red circles), following stimulation with the indicated tastants. Bars represent mean ±SEM, n = 15. Asterisks indicate significant difference between control and mutant or mutant and rescue responses for each stimulus by two-way ANOVA with Bonferroni post hoc test, *p<0.05, **p<0.01, ***p<0.001.
Figure 4—figure supplement 3

Ppk23 GRN salt responses do not require Ppk23 or Ppk29.
(A–B) Response curves (A) and peak values (B) for Ppk23 calcium responses in a Ppk23, Ppk29 mutant background. Values represent mean ±SEM, n = 14. Asterisks denote significant different from water stimulus by one-way ANOVA with Bonferroni post hoc test. ***p<0.001.
Figure 5 with 3 supplements
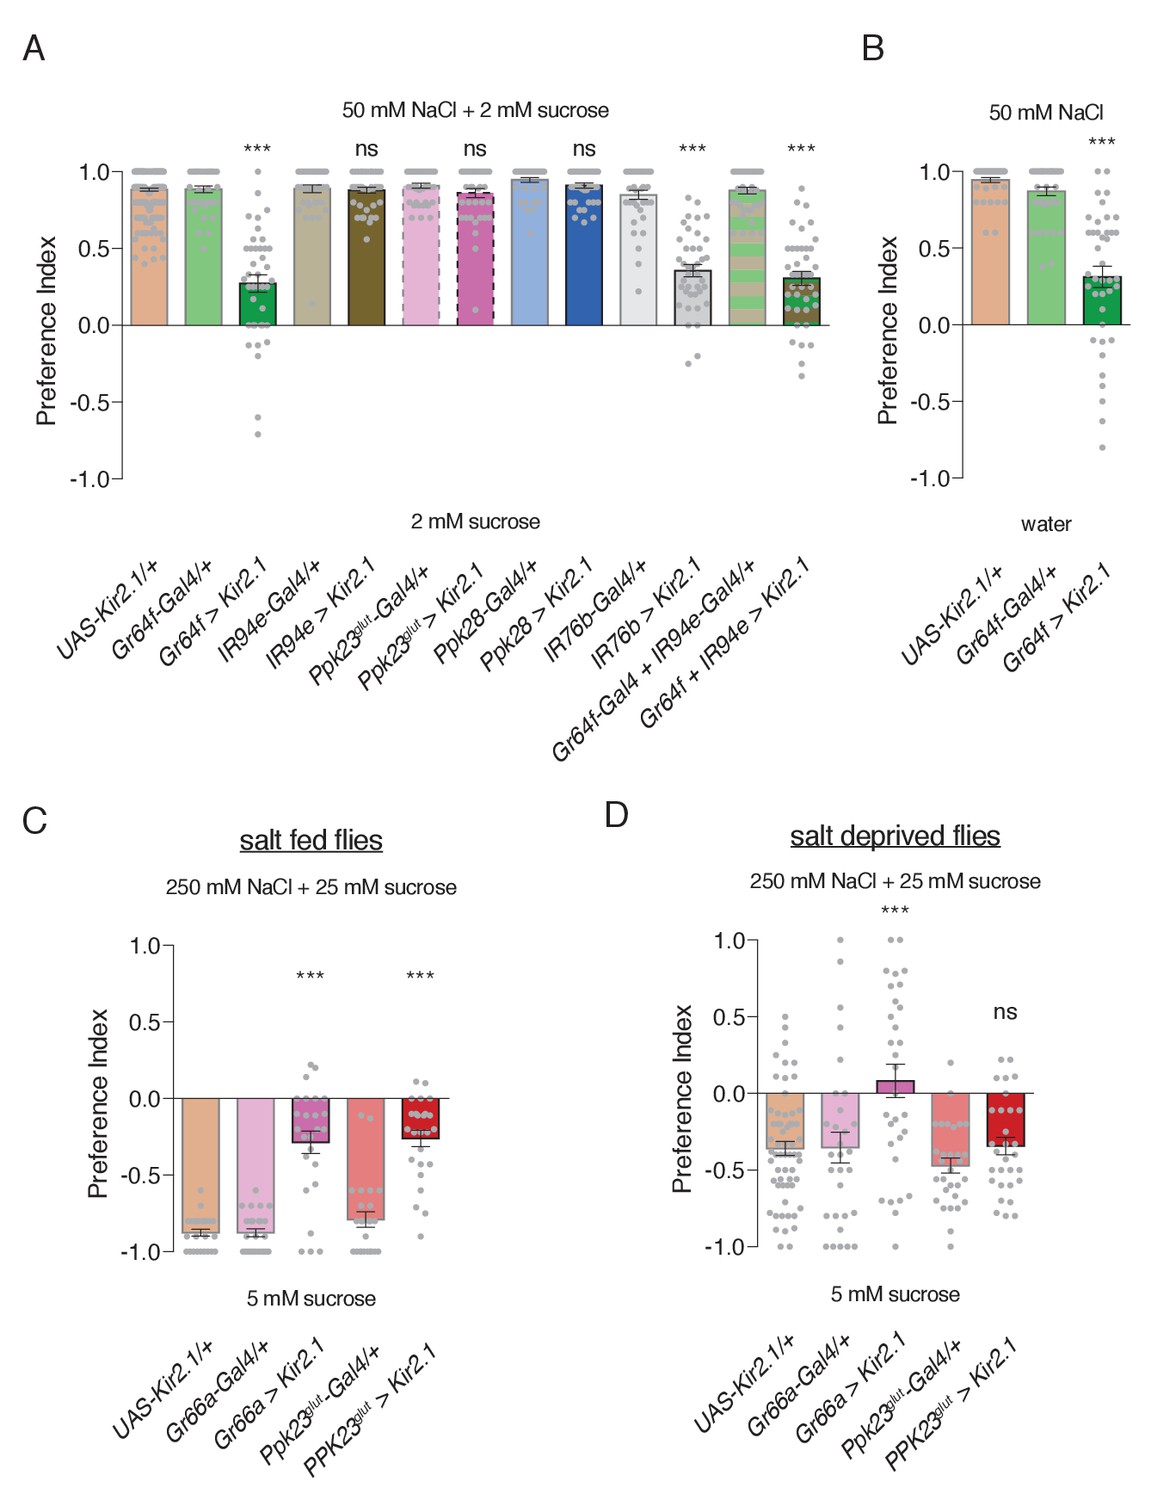
Specific GRN contributions to salt attraction and avoidance.
(A) Low salt attraction in binary choice assay, following silencing of different GRN populations with Kir2.1. Positive values indicate preference for 50 mM NaCl plus 2 mM sucrose; negative values indicate preference for 2 mM sucrose alone. Bars represent mean ±SEM. n = 40 groups of 10 flies each for all genotypes except the UAS-Kir2.1/+ control, where n = 200. Filled grey circles indicate values for individual groups. Asterisks denote significant difference from both UAS-Kir2.1/+ and corresponding Gal4/+ controls by one-way ANOVA with Bonferroni post hoc test, ***p<0.001. (B) Low salt attraction tested in the absence of sugar. Bars represent mean ±SEM. n = 40 groups of 10 flies each. Asterisks denote significant difference from both UAS-Kir2.1/+ and corresponding Gal4/+ controls by one-way ANOVA with Bonferroni post hoc test, ***p<0.001. (C–D) Requirements of aversive GRNs in high salt avoidance under salt fed (C) or salt deprived (D) conditions. Positive values indicate preference for 250 mM NaCl plus 25 mM sucrose; negative values indicate preference for 5 mM sucrose. Bars represent mean ±SEM. n = 25 (C) or 30 (D) groups of 10 flies each for all genotypes except the UAS-Kir2.1/+ control in (D), where n = 60. Filled grey circles indicate values for individual groups. Asterisks denote significant difference from both UAS-Kir2.1/+ and corresponding Gal4/+ controls by one-way ANOVA with Bonferroni post hoc test, ***p<0.001. For all panels, ‘Ppk23glut-Gal4’ indicates Ppk23-Gal4 with Gr66a-LexA and LexAop-Gal80; and ‘>' denotes indicated Gal4 driving UAS-Kir2.1 with temporal restriction by tub-Gal80ts.
-
Figure 5—source data 1
Raw numerical data for Figure 5 and associated figure supplements.
- https://doi.org/10.7554/eLife.37167.021
Figure 5—figure supplement 1
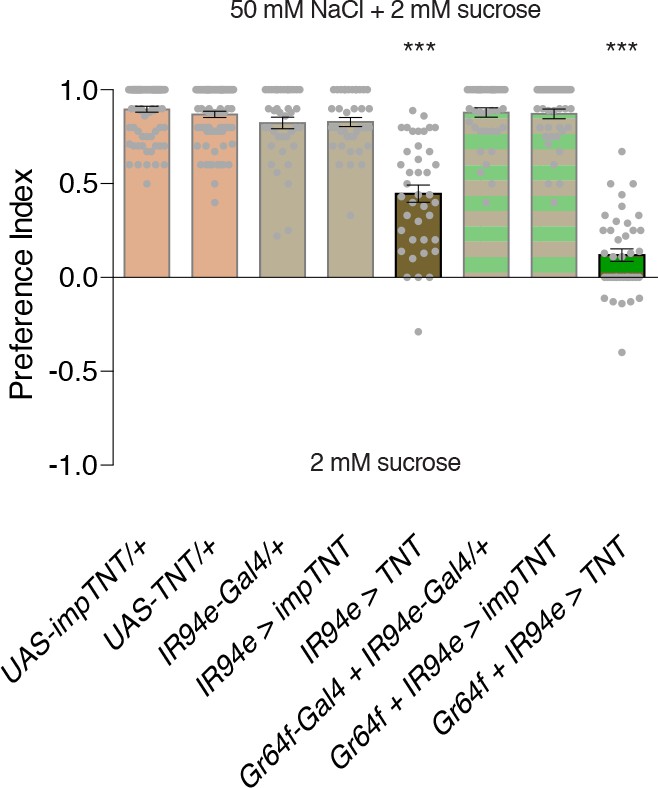
Silencing with tetanus toxin reveals a role for IR94e in low salt attraction.
Low salt attraction in binary choice assay, following silencing of different GRN populations with Tetanus toxin (TNT). Positive values indicate preference for 50 mM NaCl plus 2 mM sucrose; negative values indicate preference for 2 mM sucrose alone. Bars represent mean ±SEM. n = 40 groups of 10 flies each for all genotypes. Filled grey circles indicate values for individual groups. Asterisks denote significant difference from UAS-TNT/+ and corresponding Gal4/+ and impTNT controls by one-way ANOVA with Bonferroni post hoc test, ***p<0.001.
Figure 5—figure supplement 2
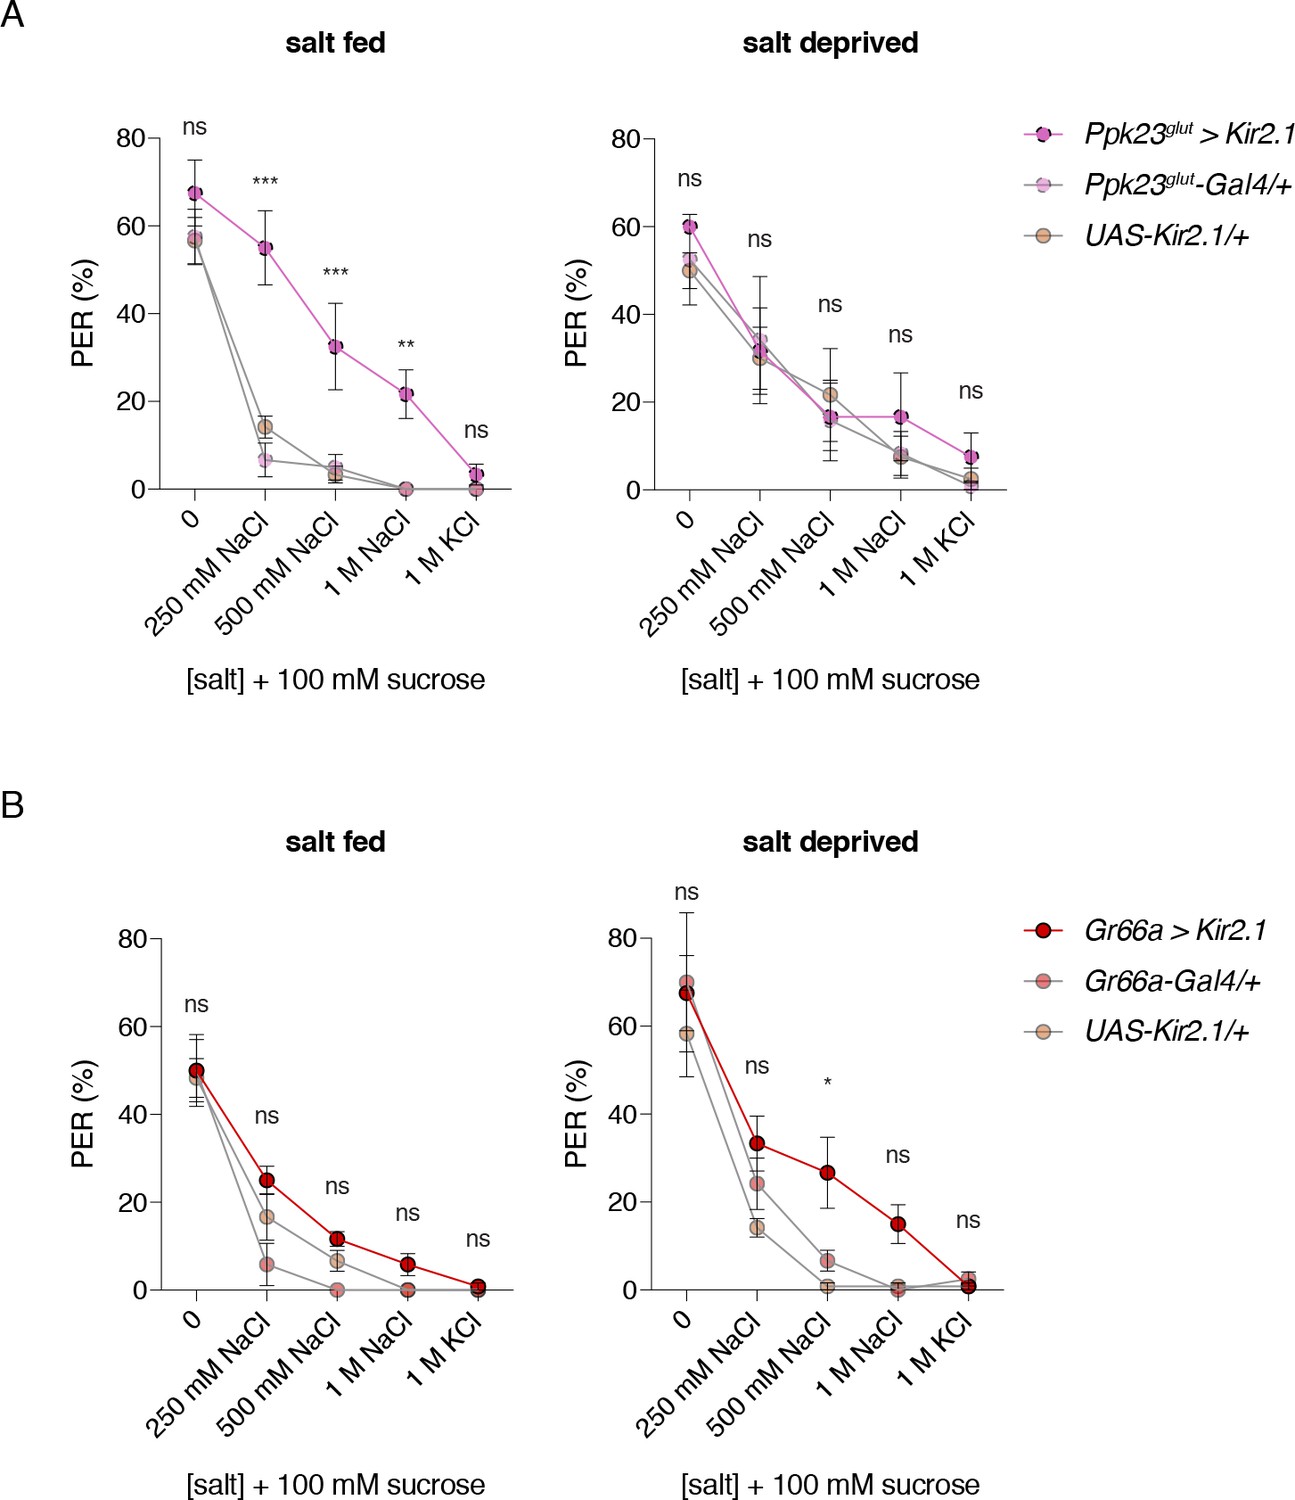
Ppk23glut and Gr66a GRNs differentially function in PER suppression by high salt, depending on internal state.
(A–B) High salt inhibition of PER in salt fed (left) or salt deprived (right) flies following silencing of Ppk23glut (A) or Gr66a (B) GRNs. Labellar PER was measured to 100 mM sucrose plus the indicated salt. Flies were either salt fed or salt deprived prior to the experiment. Values indicate mean ±SEM. n = 4 groups of 10 flies for each genotype. Asterisks denote significance from both control groups by two-way ANOVA with Bonferroni post hoc test, **p<0.01, ***p<0.001. ‘Ppk23glut-Gal4’ indicates Ppk23-Gal4 with Gr66a-LexA and LexAop-Gal80; and ‘>' denotes Gal4 driving UAS-Kir2.1 with temporal restriction by tub-Gal80ts.
Figure 5—figure supplement 3
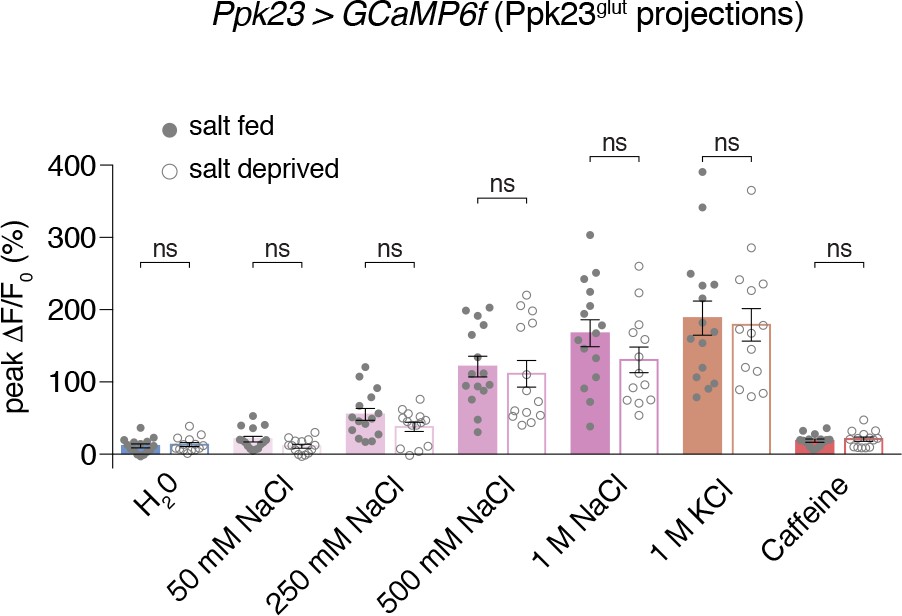
Ppk23glut calcium responses are not modulated by salt deprivation.
GCaMP imaging of Ppk23glut GRN responses in flies that have been salt fed (filled grey circles) or salt deprived (open grey circles). Bars represent mean ±SEM of peak fluorescence changes during each stimulation, n = 13 – 15. No significant differences were observed between the fed and deprived groups.
Figure 6
Salt deprivation modulates salt avoidance downstream of Ppk23glut.
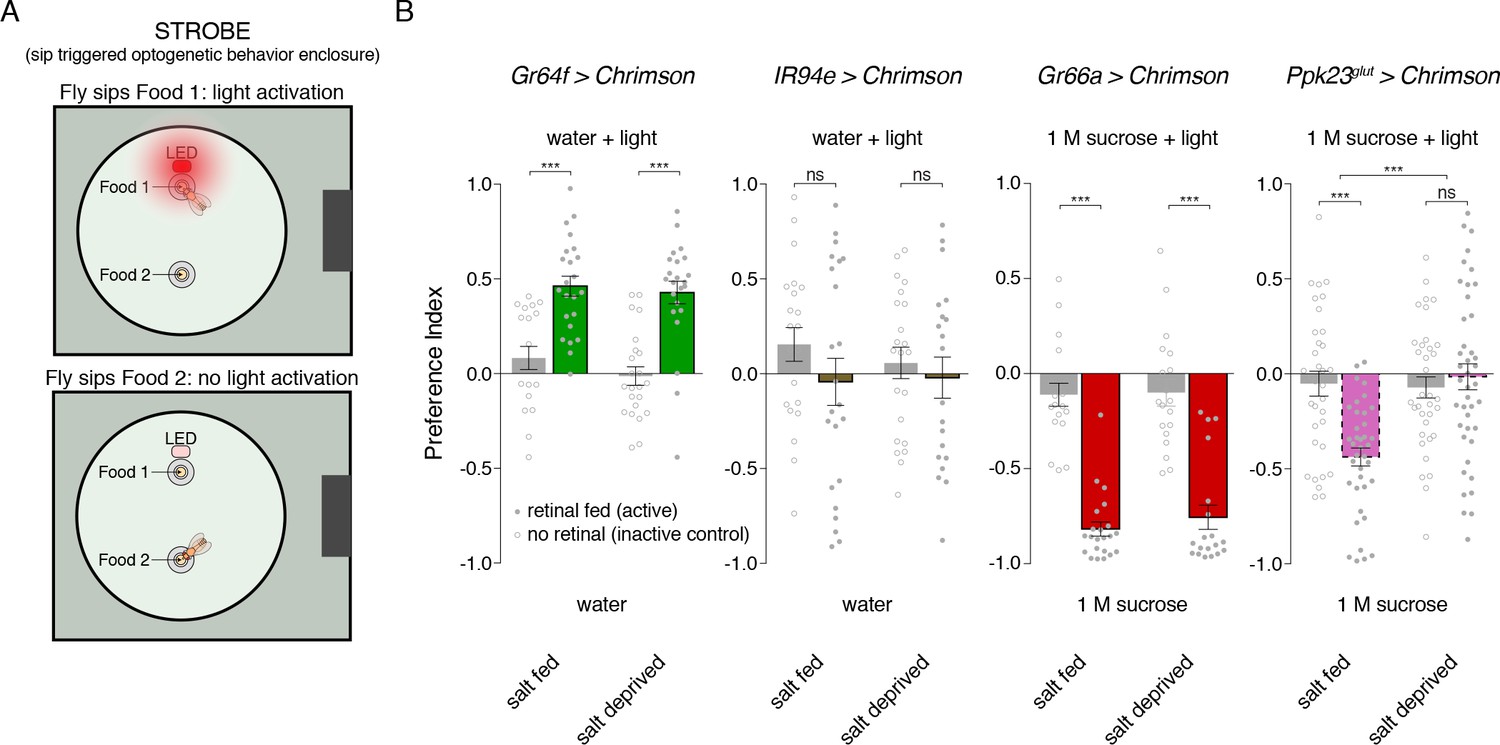
(A) Schematic of closed-loop optogentic feeding assay, called the ‘sip triggered optogenetic behavior enclosure’ (STROBE). Each food is presented as a small drop containing 1% agar. Interactions with Food 1 that are recorded as ‘sips’ trigger illumination of an LED in the roof of the enclosure, above Food 1. Light triggering is temporally coupled to sip onset with minimal latency. Sips on Food 2 are recorded, but no light is triggered. (B) STROBE results for optogenetic stimulation of each salt-responsive GRN class. CsChrimson was expressed in each indicated GRN class, and the preference for Food 1 (light triggering) vs Food 2 (no light triggered) is plotted. Food 1 and Food 2 were otherwise the same in each experiment: plain agar (‘water’) for Gr64f and IR94e activation, and 1M sucrose for Gr66a and Ppk23glut activation. 1 M sucrose was used for aversive GRN tests because we observe more robust avoidance in this context. Bars represent mean ±SEM. Colored bars represent flies fed retinal (active CsChrimson) and gray bars represent flies not fed retinal (inactive controls). n = 19 – 24 for Gr64f, IR94e and Gr66a experiments, and n = 34 – 42 for Ppk23glut experiment. Filled (retinal fed) or open (not retinal fed) circles indicate values for individual flies. Asterisks indicate significant differences between retinal and no retinal groups for each condition by two-way ANOVA with Bonferroni post hoc test, ***p<0.001. Asterisks between fed and deprived conditions for Ppk23glut experiment represent a significant interaction between salt feeding and ±retinal conditions, ***p<0.001.
-
Figure 6—source data 1
Raw numerical data for Figure 6.
- https://doi.org/10.7554/eLife.37167.023
Figure 7
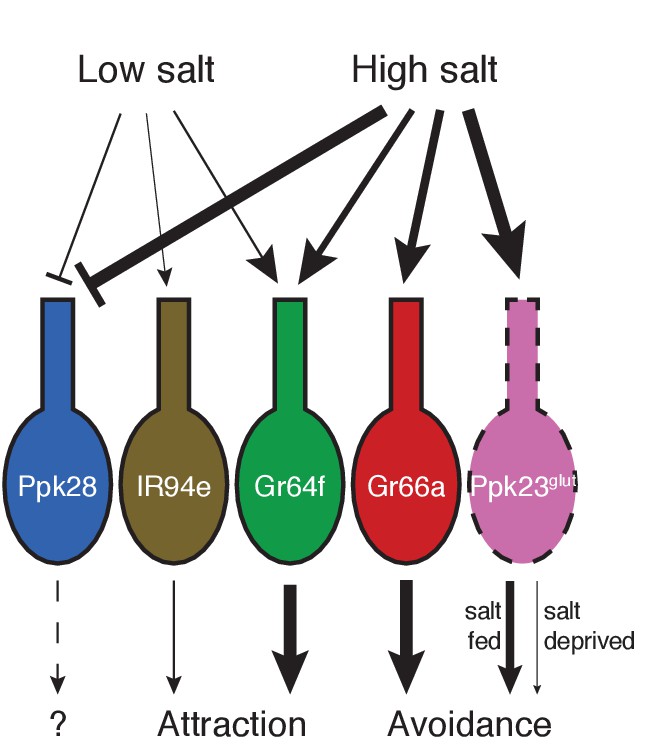
Model for salt encoding across different GRN classes in the labellum.
Line thickness indicates strength of the excitatory (arrows) or inhibitory (bars) effects of high and low salt on each GRN class, as well as the impact of each cell type on behavior.
Tables
Key resources table
| Reagent type (species) or resource | Designation | Source or reference | Identifiers | Additional information |
|---|---|---|---|---|
| Genetic reagent (D. melanogaster) | vGlutMI04979-Gal4 | Diao et al. (2015) | BDSC: 60312; RRID:BDSC_60312 | |
| Genetic reagent (D. melanogaster) | ChATMI04508-Gal4 | Diao et al. (2015) | BDSC: 60317; RRID:BDSC_60317 | |
| Genetic reagent (D. melanogaster) | vGlutMI04979-LexA::QFAD | Diao et al. (2015) | BDSC: 60314; RRID:BDSC_60314 | |
| Genetic reagent (D. melanogaster) | ChATMI04508- LexA::QFAD | Diao et al. (2015) | BDSC: 60319; RRID:BDSC_60319 | |
| Genetic reagent (D. melanogaster) | vGlutMI04979-Gal80 | Diao et al. (2015) | BDSC: 60316; RRID:BDSC_60316 | |
| Genetic reagent (D. melanogaster) | ChATMI04508-Gal80 | Diao et al. (2015) | BDSC: 60321; RRID:BDSC_60321 | |
| Genetic reagent (D. melanogaster) | ΔPpk23 | Thistle et al. (2012) | Flybase: FBal0277047 | |
| Genetic reagent (D. melanogaster) | ΔPpk29 | Thistle et al. (2012) | Flybase: FBal0277049 | |
| Genetic reagent (D. melanogaster) | Gr66a-LexA | Thistle et al. (2012) | Flybase: FBal0277069 | |
| Genetic reagent (D. melanogaster) | ppk28-LexA | Thistle et al. (2012) | Flybase: FBal0277050 | |
| Genetic reagent (D. melanogaster) | ppk23-Gal4 | Thistle et al. (2012) | Flybase: FBal0277044 | |
| Genetic reagent (D. melanogaster) | Gr64fLexA | Miyamoto et al. (2012) | Flybase: FBti0168176 | |
| Genetic reagent (D. melanogaster) | ppk23-LexA | Toda et al. (2012) | Flybase: FBst0051311 | |
| Genetic reagent (D. melanogaster) | IR76b-Gal4 | Zhang et al. (2013) | Flybase: FBtp0085485 | |
| Genetic reagent (D. melanogaster) | IR76b1 | Zhang et al. (2013) | Flybase: FBst0051309 | |
| Genetic reagent (D. melanogaster) | IR76b2 | Zhang et al. (2013) | Flybase: FBst0051310 | |
| Genetic reagent (D. melanogaster) | UAS-IR76b | Zhang et al. (2013) | Flybase: FBtp0085485 | |
| Genetic reagent (D. melanogaster) | IR25a1 | Benton et al. (2009) | Flybase: FBst0041736 | |
| Genetic reagent (D. melanogaster) | IR25a2 | Benton et al. (2009) | Flybase: FBst0041737 | |
| Genetic reagent (D. melanogaster) | UAS-IR25a | Abuin et al., 2011 | Flybase: FBst0041747 | |
| Genetic reagent (D. melanogaster) | Gr66a-Gal4 | Wang et al. (2004) | Flybase: FBtp0014660 | |
| Genetic reagent (D. melanogaster) | Gr64f-Gal4 | Dahanukar et al. (2007) | Flybase: FBti0162678 | |
| Genetic reagent (D. melanogaster) | Gr64f-Gal4 | Dahanukar et al. (2007) | Flybase: FBtp0057275 | |
| Genetic reagent (D. melanogaster) | Ppk28-Gal4 | Cameron et al. (2010) | Flybase: FBtp0054514 | |
| Genetic reagent (D. melanogaster) | LexAop-CD2::GFP | Lai and Lee (2006) | Flybase: FBti0186090 | |
| Genetic reagent (D. melanogaster) | UAS-Kir2.1 | Baines et al. (2001) | Flybase: FBti0017552 | |
| Genetic reagent (D. melanogaster) | tub-Gal80ts | McGuire et al. (2004) | Flybase: FBti0027797 | |
| Genetic reagent (D. melanogaster) | IR94e-Gal4 | Tirián and Dickson, 2017 | VDRC: v207582 | |
| Genetic reagent (D. melanogaster) | w1118 | Bloomington Drosophila Stock Center | BDSC: 3605; RRID:BDSC_3605 | |
| Genetic reagent (D. melanogaster) | LexAop-Gal80 | Bloomington Drosophila Stock Center | BDSC: 32214; RRID:BDSC_32214 | |
| Genetic reagent (D. melanogaster) | LexAop-GCaMP6f | Bloomington Drosophila Stock Center | BDSC: 44277; RRID:BDSC_44277 | |
| Genetic reagent (D. melanogaster) | UAS-GCaMP6f | Bloomington Drosophila Stock Center | BDSC: 42747; RRID:BDSC_42747 | |
| Genetic reagent (D. melanogaster) | UAS-GCaMP6f | Bloomington Drosophila Stock Center | BDSC: 52869; RRID:BDSC_52869 | |
| Genetic reagent (D. melanogaster) | UAS-CsChrimson | Bloomington Drosophila Stock Center | BDSC: 55135; RRID:BDSC_55135 | |
| Genetic reagent (D. melanogaster) | UAS-TNT | Bloomington Drosophila Stock Center | BDSC: 28838; RRID:BDSC_28838 | |
| Genetic reagent (D. melanogaster) | UAS-impTNT | Bloomington Drosophila Stock Center | BDSC: 28840; RRID:BDSC_28840 | |
| Antibody | anti-GFP | Abcam, Cambridge, UK, | #13970; RRID:AB_300798 | (1:1000 dilution) |
| Antibody | anti-RFP | Rockland Immunochemicals, Pottstown, PA, | #600-401-379; RRID:AB_2209751 | (1:200 dilution) |
| Antibody | anti-chicken Alexa 488 | Abcam | #150169; RRID:AB_2636803 | (1:200 dilution) |
| Antibody | anti-rabbit Alexa 647 | Thermo Fisher Scientific, Waltham, MA, | #A21245; RRID:AB_2535813 | (1:200 dilution) |
| Antibody | anti-brp | Developmental Studies Hybridoma Bank | #nc82; RRID:AB_2314866 | (1:50 dilution) |
| Antibody | anti-rabbit Alexa 568 | Thermo Fisher Scientific, Waltham, MA, | #A11036; RRID:AB_10563566 | (1:200 dilution) |
| Chemical compound, drug | All trans-Retinal | Sigma-Aldrich | #R2500 | |
| Chemical compound, drug | Sucrose | Sigma-Aldrich | #S7903 | |
| Chemical compound, drug | NaCl | Sigma-Aldrich | #S7653 | |
| Chemical compound, drug | KCl | Sigma-Aldrich | #P9541 | |
| Chemical compound, drug | NaBr | Sigma-Aldrich | #S4547 | |
| Chemical compound, drug | KBr | Sigma-Aldrich | #221864 | |
| Chemical compound, drug | CsCl | Sigma-Aldrich | #289329 | |
| Chemical compound, drug | CaCl2 | BDH chemicals | #BDH4524 | |
| Chemical compound, drug | Lobeline hydrochloride | Sigma-Aldrich | #141879 | |
| Chemical compound, drug | Caffeine | Sigma-Aldrich | #C0750 | |
| Chemical compound, drug | 7,11-heptacosadiene (7,11-HC) | Caymen chemical company | #10012567 | |
| Chemical compound, drug | 7,11-nonacosadiene (7,11-NC) | Caymen chemical company | #9000314 | |
| Chemical compound, drug | 7-tricosene (7 T) | Caymen chemical company | #9000313 | |
| Chemical compound, drug | Cis-vaccenyl acetate (c-VA) | Caymen chemical company | #10010101 | |
| Chemical compound, drug | Erioglaucine | Spectrum chemical | #FD110 | |
| Chemical compound, drug | Amaranth | Sigma-Aldrich | #A1016 | |
| Software, algorithm | STROBE executable | Chan, 2018a | github: https://github.com/rcwchan/STROBE_software/ (copy archived at https://github.com/elifesciences-publications/STROBE_software) | |
| Software, algorithm | STROBE post- processing | Chan, 2018a | github: https://github.com/rcwchan/STROBE_software/ (copy archived at https://github.com/elifesciences-publications/STROBE_software) | |
| Software, algorithm | STROBE VHDL code | Chan, 2018b | github: https://github.com/rcwchan/STROBE-fpga (copy archived at https://github.com/elifesciences-publications/STROBE-fpga) | |
| Software, algorithm | ImageJ | Schneider et al. (2012) | https://imagej.nih.gov/ij; RRID:SCR_003070 | |
| Software, algorithm | Prism 6 | Graphpad | RRID:SCR_002798 | |
| Software, algorithm | Photoshop | Adobe | RRID:SCR_014199 | |
| Software, algorithm | Illustrator | Adobe | RRID:SCR_010279 |
Additional files
-
Transparent reporting form
- https://doi.org/10.7554/eLife.37167.025
Download links
A two-part list of links to download the article, or parts of the article, in various formats.
Downloads (link to download the article as PDF)
Open citations (links to open the citations from this article in various online reference manager services)
Cite this article (links to download the citations from this article in formats compatible with various reference manager tools)
A complex peripheral code for salt taste in Drosophila
eLife 7:e37167.
https://doi.org/10.7554/eLife.37167


