Tumor copy number alteration burden is a pan-cancer prognostic factor associated with recurrence and death
- Haley Hieronymus

- Rajmohan Murali
- Amy Tin
- Kamlesh Yadav
- Wassim Abida
- Henrik Moller
- Daniel Berney
- Howard Scher
- Brett Carver
- Peter Scardino
- Nikolaus Schultz
- Andrew Vickers
- Charles L Sawyers
- Memorial Sloan Kettering Cancer Center, United States
- Icahn School of Medicine at Mount Sinai, United States
- King's College London, United Kingdom
- Barts Cancer Institute, Queen Mary University of London, United Kingdom
- Weill Cornell Medical College, United States
- Queen Mary University of London, United Kingdom
- Howard Hughes Medical Institute, United States
Figures
Figure 1
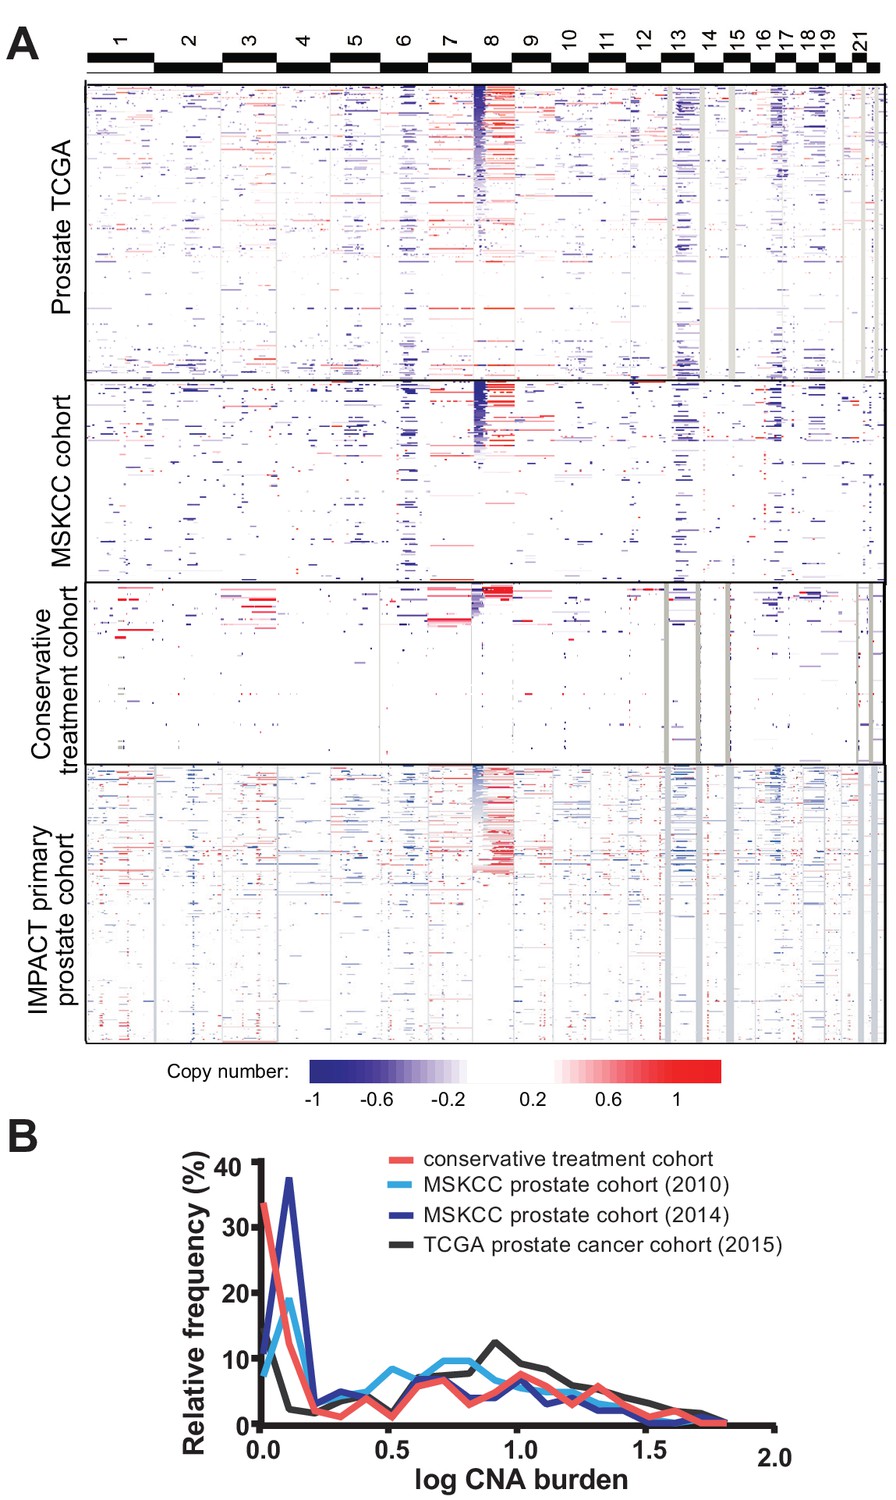
Tumor copy number landscape of conservatively treated primary prostate cancer, compared to other primary prostate cancer cohorts.
(a) Heat map of copy number alterations in conservative treatment CNA cohort, as well as TCGA, MSKCC, and IMPACT primary prostate cancer cohorts. (b) Frequency distribution of CNA burden, as log of percentage of genome copy number altered, for the conservative treatment prostate cancer cohort and three other primary prostate cancer cohorts.
Figure 2 with 5 supplements

Tumor copy number alteration burden is associated with death from prostate cancer in conservatively treated patients.
(a) Cumulative Incidence of death from disease (dashed lines) and death from other causes (solid lines) based in cases with high CNA burden (red lines, CNA Burden greater than or equal to the median CNA burden of this cohort, 1.48) or non-high CNA burden (black lines, CNA Burden < median). (b) Risk for death from prostate cancer within 5 years of diagnosis. Univariate risk for 5 year prostate cancer-specific death, calculated by locally weighted Kaplan–Meier estimates (solid black line) with 95% confidence interval (dashed black lines) overlaid on the distribution of CNA burden (gray). (c) Association of tumor CNA burden with available cancer outcomes in the conservative treatment primary prostate cancer TAPG1 cohort, TCGA primary cancer cohorts, and the MSK-IMPACT clinical sequencing prostate and pan-cancer cohorts of primary and metastatic tumors. Forest plot of hazard ratio (per 5% CNA burden) with 95% confidence interval shown for cancer-specific mortality (dark blue), overall mortality (light blue), and cancer recurrence (green). Supplementary Tables and Figures.
Figure 2—figure supplement 1
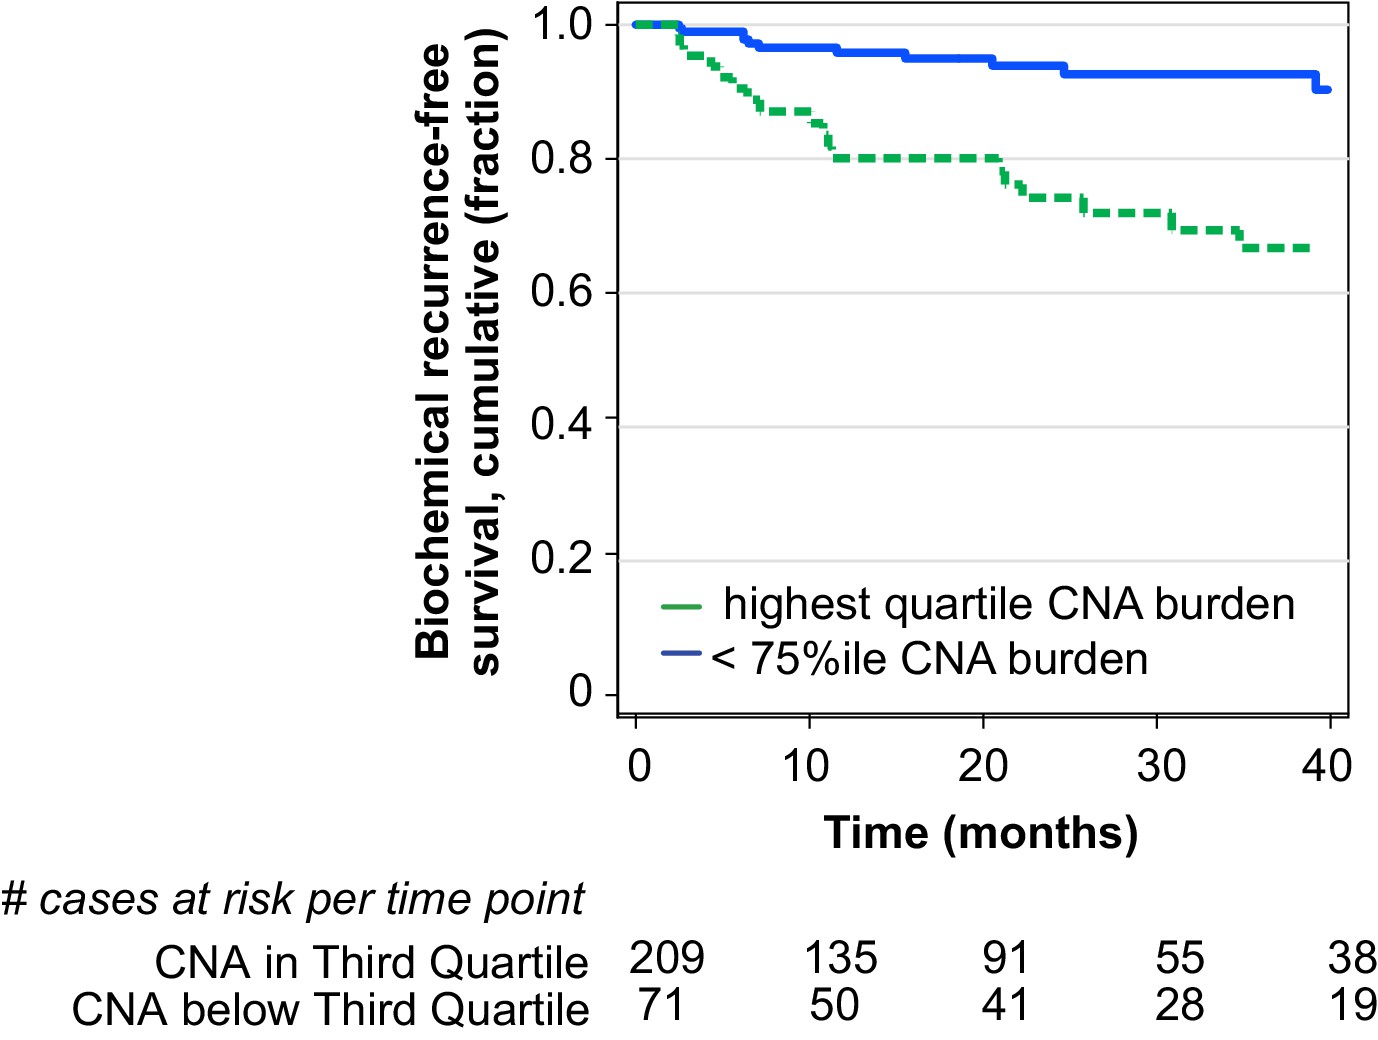
Kaplan-Meier plot of biochemical recurrence in TCGA primary prostate cohort.
The highest quartile tumor CNA burden (above 75 percentile CNA burden, green) is compared to lower three quartiles (blue) with risk table showing the number of patients present at each time point.
Figure 2—figure supplement 2
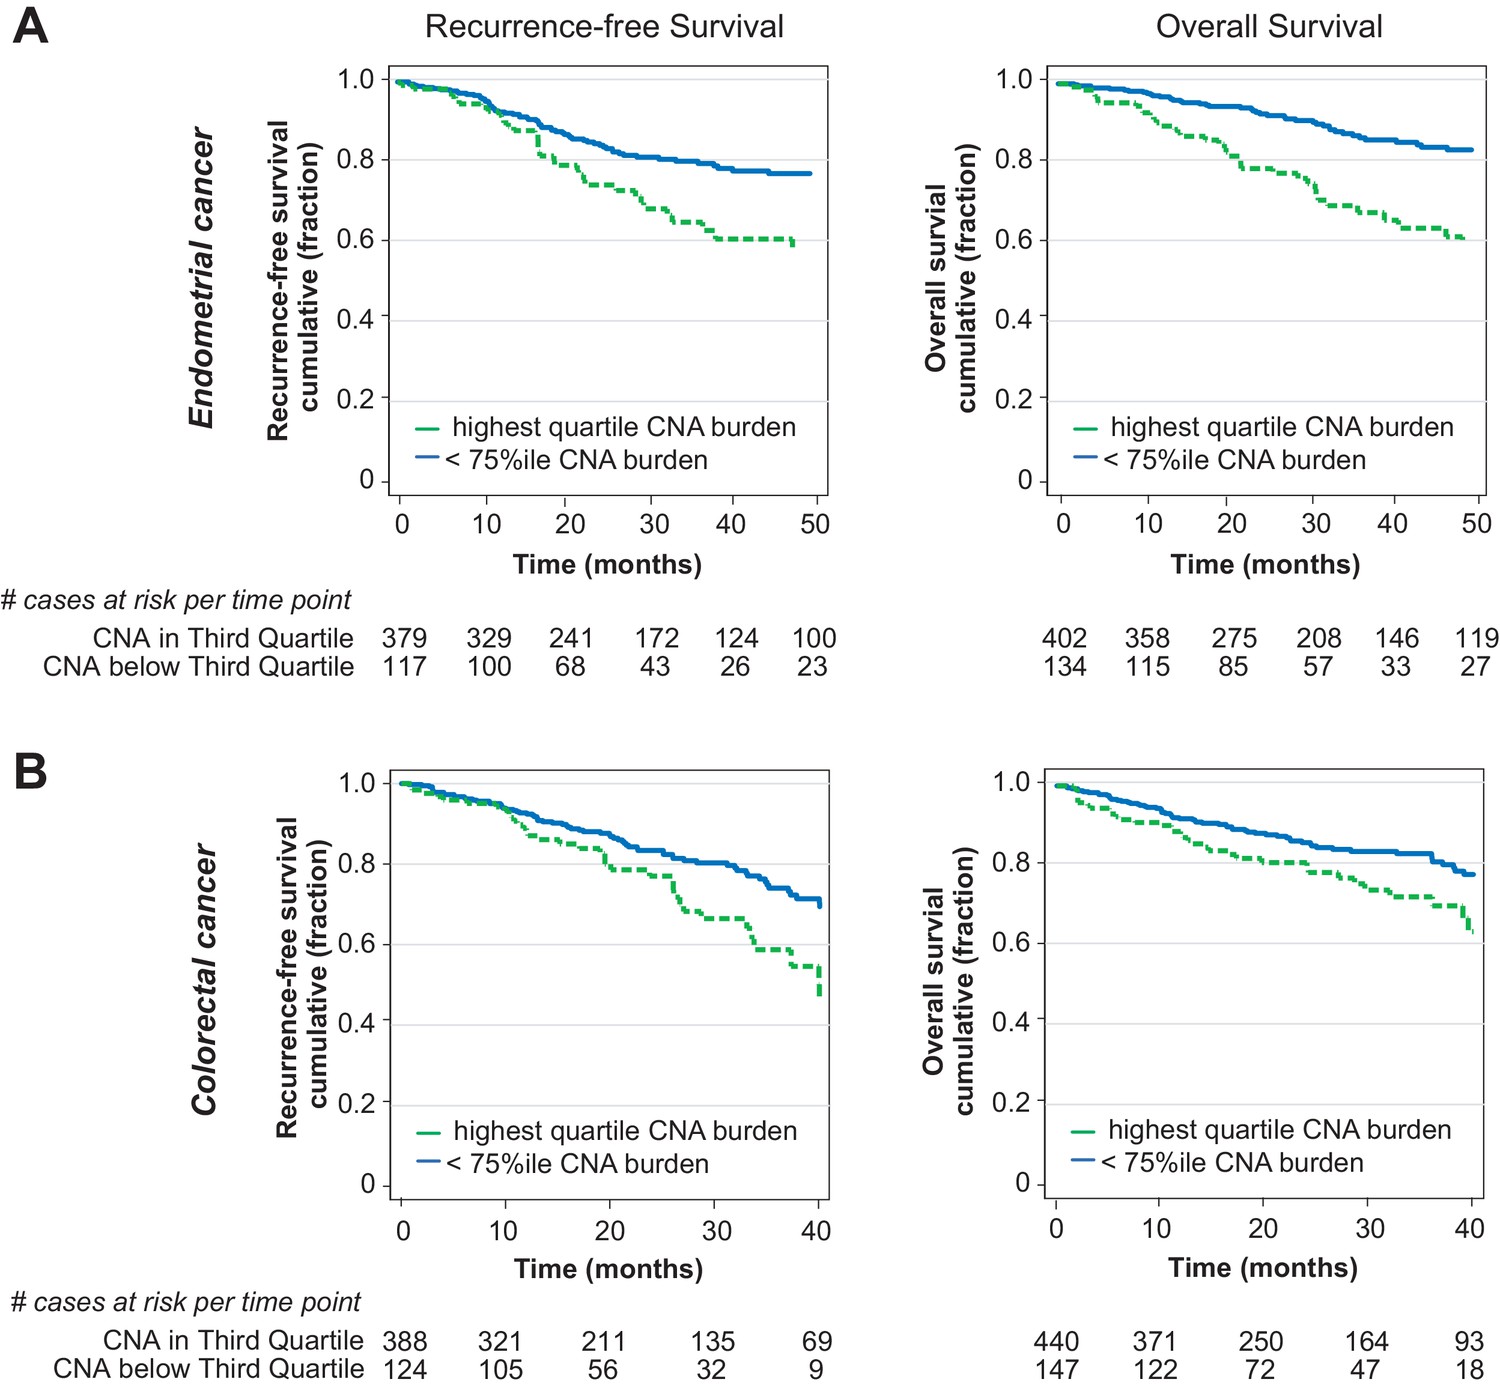
Tumor CNA burden in multiple cancers is associated with disease free survival and overall survival.
Kaplan-Meier plot of disease free survival (left) and overall survival (right) of TCGA cohorts of (a) endometrial cancer and (b) colorectal cancer. The highest quartile CNA (above 75 percentile CNA burden, green) is compared to lower three quartiles (blue).
Figure 2—figure supplement 3
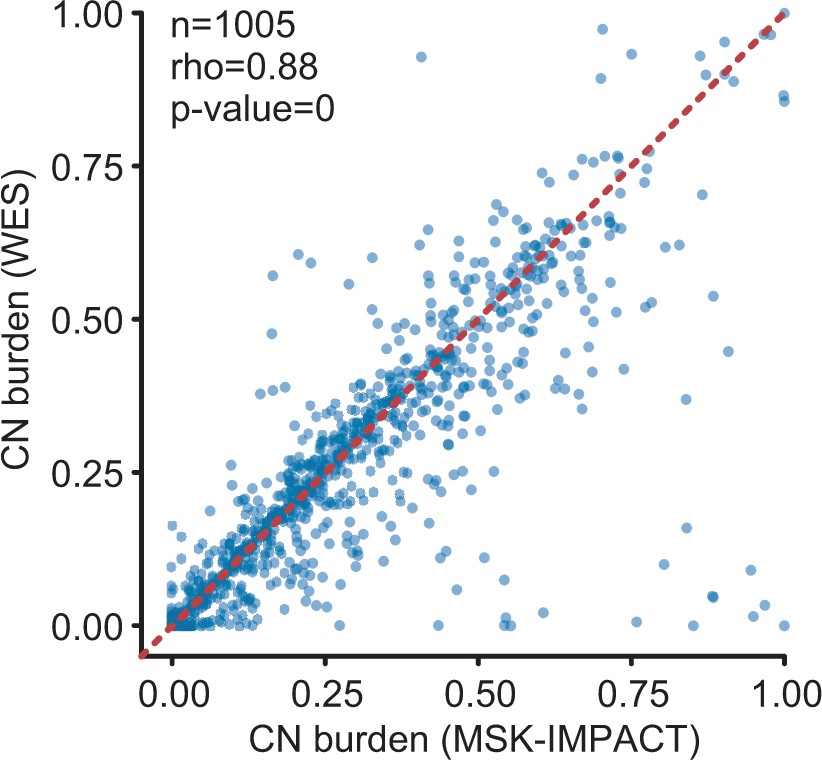
Correlation between CNA burden from IMPACT targeted sequencing assay and whole exome sequencing (WES) of same samples, pan-cancer.
The relationship between CNA burden determined by IMPACT targeted sequencing and WES in a subset of pan-cancer IMPACT cohort samples analyzed by both approaches (n = 1005) is shown (rho = 0.88, p-value=0).
Figure 2—figure supplement 4
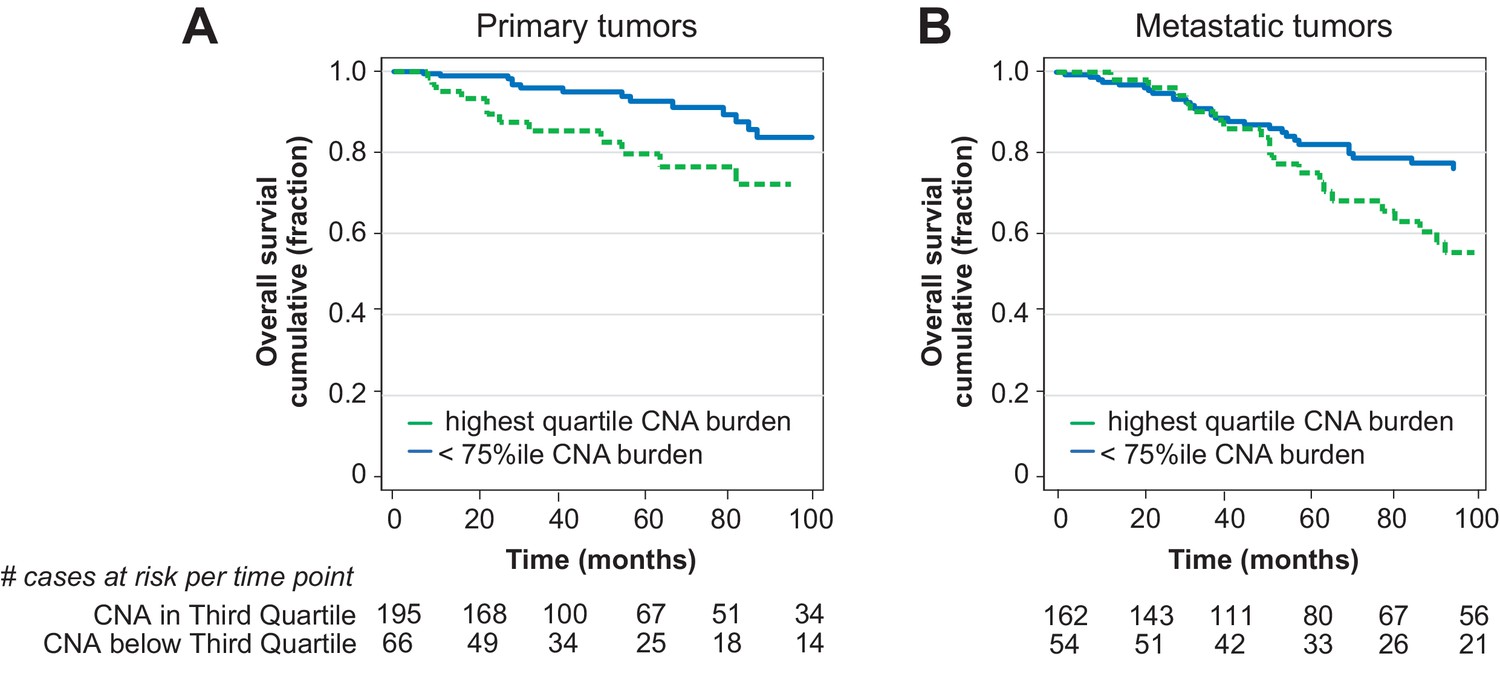
Tumor CNA burden in primary prostate cancer is prognostic for overall survival when assayed by clinically approved sequencing panel.
Kaplan-Meier plot of overall survival of IMPACT primary prostate cancer cohort by CNA burden quartile in (a) primary and (b) metastatic tumors. The highest quartile CNA (above 75 percentile CNA burden, green) is compared to lower three quartiles (blue).
Figure 2—figure supplement 5
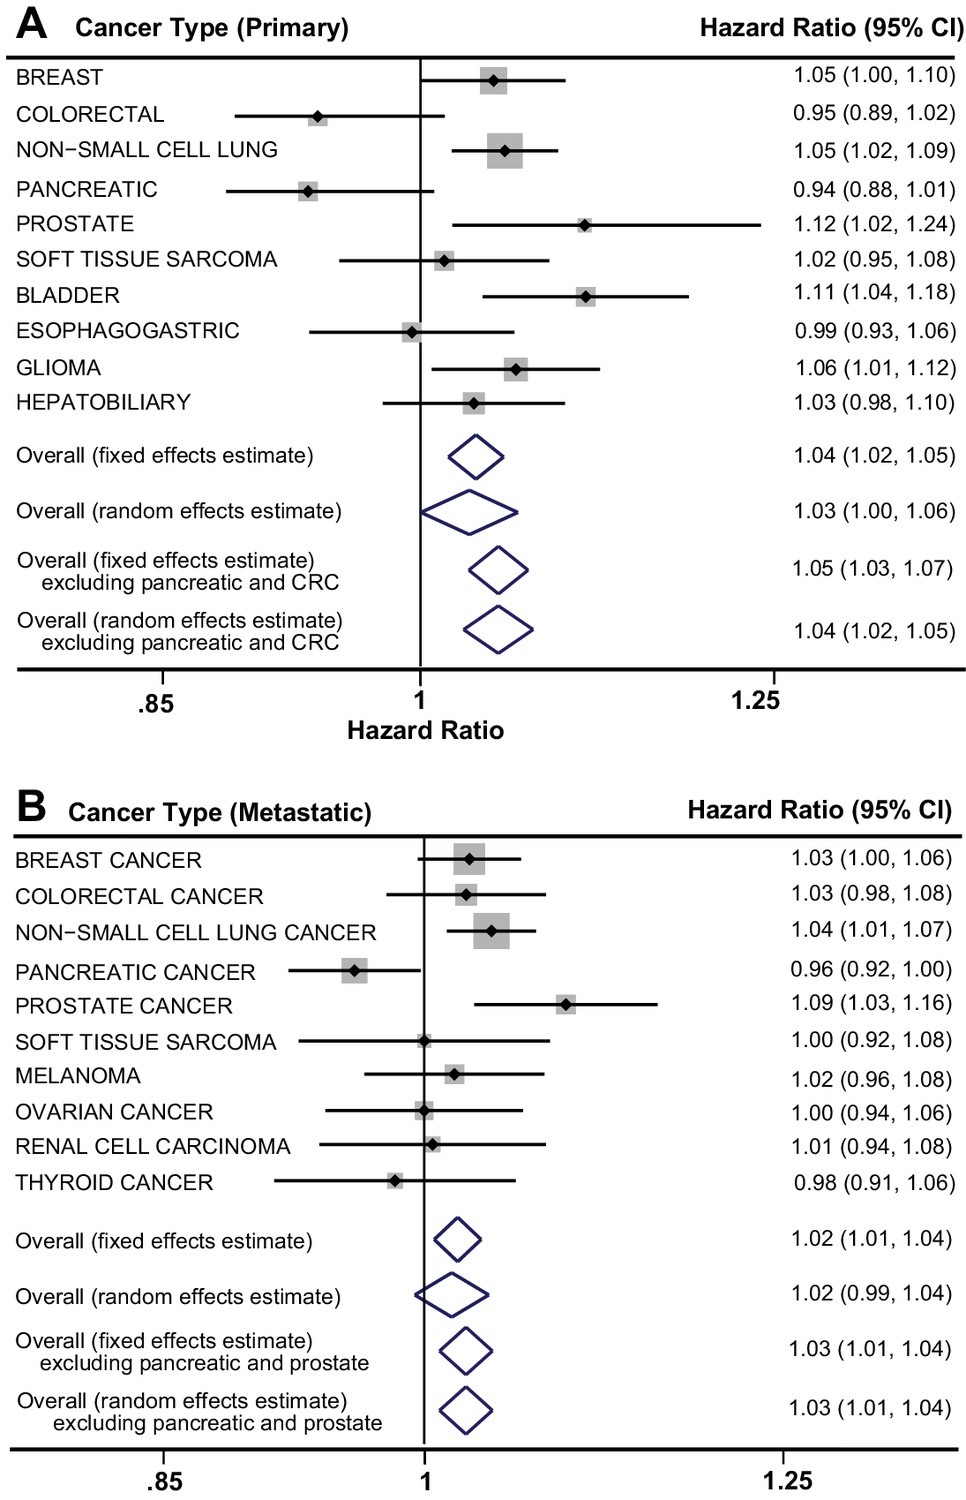
Forest Plot of Hazard Ratios (individual and pooled) for meta-analysis assessing the association between tumor CNA burden and overall survival in (a) primary cancer and (b) patients with metastatic cancer in the pan-cancer IMPACT cohort.
https://doi.org/10.7554/eLife.37294.009Tables
Table 1
Tumor CNA burden is associated with prostate cancer-specific death in conservative treatment cohort independent of Gleason sum score and CAPRA score.
Cox Regression model assessing the association between CNA burden (per 5%) and cancer specific survival. N = 107*
| Model | HR | 95% CI | P-value |
|---|---|---|---|
| Univariate, tumor CNA burden | 1.49 | 1.30, 1.70 | <0.0001 |
| Multivariable – adjusting for Gleason sum (≤6, 7, ≥8) | 1.44 | 1.24, 1.67 | <0.0001 |
| Multivariable – adjusting for UCSF-CAPRA score utilizing multiple imputation | 1.44 | 1.24, 1.68 | <0.0001 |
| Multivariable – adjusting for UCSF-CAPRA score without utilizing multiple imputation * N = 60 (excludes 47 patients with unknown stage) | 1.57 | 1.29, 1.92 | <0.0001 |
Table 2
Tumor CNA burden is associated with recurrence and overall survival independent of disease stage in multiple cancer types
https://doi.org/10.7554/eLife.37294.011| Cohort | Model | Disease free Time | Overall Survival | ||||||
|---|---|---|---|---|---|---|---|---|---|
| Cases | HR | 95% CI | P | Cases | HR | 95% CI | P | ||
| Prostate cancer TCGA | Tumor CNA burden, per 5% tumor CNA burden, univariate | 280 | 1.27 | 1.13, 1.42 | <0.0001 | Insufficient events | |||
| Tumor CNA burden, per 5% tumor CNA burden, adjusted for Gleason grade and mutation burden | 279 | 1.18 | 1.03, 1.35 | 0.015 | |||||
| Tumor CNA burden, per 5% tumor CNA burden, adjusted for purity (ABSOLUTE)* | 243 | 1.22 | 1.07, 1.40 | 0.003 | |||||
| Tumor CNA burden, per 5% tumor CNA burden, adjusted for ploidy | 243 | 1.32 | 1.11, 1.56 | 0.002 | |||||
| Breast cancer TCGA | Tumor CNA burden, per 5% tumor CNA burden, univariate | 709 | 1.07 | 1.01, 1.14 | 0.028 | 794 | 1.08 | 1.03, 1.13 | 0.0005 |
| Tumor CNA burden, per 5% tumor CNA burden, Multivariable, adjusted for disease stage | 695 | 1.07 | 1.00, 1.14 | 0.049 | 777 | 1.08 | 1.03, 1.13 | 0.002 | |
| Endometrial Cancer TCGA | Tumor CNA burden, per 5% tumor CNA burden, univariate | 496 | 1.10 | 1.06, 1.14 | <0.0001 | 536 | 1.13 | 1.08, 1.17 | <0.0001 |
| Tumor CNA burden, per 5% tumor CNA burden, multivariable, adjusted for disease stage | 496 | 1.08 | 1.04, 1.13 | <0.0001 | 536 | 1.10 | 1.05, 1.15 | <0.0001 | |
| Renal clear cell cancer TCGA | Tumor CNA burden, per 5% tumor CNA burden, univariate | 425 | 1.05 | 1.01, 1.09 | 0.028 | 525 | 1.02 | 0.98, 1.06 | NS (0.4) |
| Tumor CNA burden, per 5% tumor CNA burden, multivariable, adjusted for disease stage | 423 | 1.05 | 1.00, 1.11 | 0.035 | 522 | 1.01 | 0.97, 1.06 | NS (0.7) | |
| Thyroid cancer TCGA | Tumor CNA burden, per 5% tumor CNA burden, univariate | 483 | 1.17 | 1.01, 1.35 | 0.033 | 497 | 1.30 | 1.04, 1.63 | 0.021 |
| Tumor CNA burden, per 5% tumor CNA burden, multivariable, adjusted for disease stage | 481 | 1.18 | 1.00, 1.39 | 0.048 | Insufficient events | ||||
| Colorectal cancer TCGA | Tumor CNA burden, per 5% tumor CNA burden, univariate | 512 | 1.05 | 1.00, 1.11 | 0.037 | 587 | 1.06 | 1.01, 1.12 | 0.012 |
| Tumor CNA burden, per 5% tumor CNA burden, multivariable, adjusted for disease stage | 496 | 1.03 | 0.98, 1.09 | NS (0.3) | 567 | 1.03 | 0.97, 1.09 | NS (0.3) | |
| Tumor CNA burden, per 5% tumor CNA burden, multivariable, adjusted for tumor stage | 511 | 1.06 | 1.01, 1.12 | 0.028 | 585 | 1.07 | 1.02, 1.13 | 0.009 | |
-
*Result differed with similar adjustment in IMPACT prostate cancer cohort utilizing FACETS, see Supplementary file 3.
Table 3
Tumor CNA burden determined by clinically approved sequencing panel is associated with overall survival in primary and metastatic tumors
https://doi.org/10.7554/eLife.37294.012| Model | Overall Survival | |||||||||||
|---|---|---|---|---|---|---|---|---|---|---|---|---|
| Primary tumors | Metastatic tumors | |||||||||||
| HR | 95% | P | HR | 95% | P | |||||||
| Prostate Cancer*,† | ||||||||||||
| Univariate, tumor CNA burden, per 5% | 1.17 | 1.04, 1.31 | 0.007 | 1.07 | 1.01, 1.14 | 0.020 | ||||||
| Multivariable Tumor CNA burden, per 5% Mutation burden (per mutation) | 1.11 1.22 | 0.98, 1.26 1.12, 1.33 | 0.10 <0.0001 | 1.08 1.05 | 1.02, 1.15 1.02, 1.08 | 0.011 0.001 | ||||||
| Multivariable Tumor CNA burden, per 5% TP53 CN loss or mutation | 1.17 4.12 | 1.04, 1.31 2.02, 8.41 | 0.007 <0.0001 | 1.06 1.24 | 1.00, 1.13 0.76, 2.02 | NS (0.069) NS (0.4) | ||||||
| Multivariable Tumor CNA burden, per 5% RB1 CN loss or mutation | 1.15 3.24 | 1.02, 1.30 0.70, 14.98 | 0.026 NS (0.13) | 1.06 1.68 | 0.99, 1.13 0.94, 2.99 | NS (0.091) NS (0.080) | ||||||
| Multivariable Tumor CNA burden, per 5% PTEN CN loss or mutation | 1.17 2.38 | 1.04, 1.32 1.03, 5.51 | 0.008 0.042 | 1.07 1.15 | 1.01, 1.14 0.70, 1.89 | 0.023 NS (0.6) | ||||||
| Pan- Cancer | ||||||||||||
| Univariate, tumor CNA burden, per 5%ठ| 1.04 | 1.02, 1.05 | <0.0001 | 1.02 | 1.01, 1.03 | 0.005 | ||||||
| Univariate, mutation burden (per five units)ठ| 0.98 | 0.97, 1.00 | NS (0.072) | 0.99 | 0.97, 1.01 | NS (0.4) | ||||||
| Meta-analysis, tumor CNA burden (per 5%)# | 1.04 | 1.02, 1.05 | <0.0001** | 1.02 | 1.01, 1.04 | 0.005†† | ||||||
| Meta-analysis, tumor CNA burden (per 5%), excluding outlier cancer types‡‡ | 1.05 | 1.03, 1.07 | <0.0001§§ | 1.03 | 1.01, 1.04 | 0.002## | ||||||
-
*Prostate primary tumors: patient n = 261 for all models except multivariable model with mutation burden, where n = 227; event n = 33; median follow-up time for survivors 40 (IQR 25,81) months.
†Prostate metastatic tumors: patient n = 216 for all models except multivariable model with mutation burden, where n = 205; event n = 80; median follow-up time for survivors 59.5 (IQR 32, 129) months.
-
‡Pan-cancer primary tumors, univariate models: patient n = 6610, event n = 1535, median follow-up time for survivors 24 (IQR 11, 61) months
§Pan-cancer metastatic tumors, univariate models: patient n = 4864, event n = 1467, median follow-up time for survivors 51 (IQR 23, 109) months.
-
#Pan-cancer meta-analysis, among ten most prevalent cancer types: primary tumor patient n = 4863, metastatic tumor patient n = 3676. Estimates are based on overall fixed effects.
**p-value corresponds with test of effects size. Chi-square test for heterogeneity p-value=0.003.
-
††p-value corresponds with test of effects size. Chi-square test for heterogeneity p-value=0.024.
‡‡Exclusion of cancer types to reduce heterogeneity: primary tumor patient n = 3887, metastatic tumor patient n = 3098. Estimates are based on overall fixed effects.
-
§§Excluding pancreatic and colorectal cancer, test of effects size p-value. Chi-square test for heterogeneity p-value=0.3.
##Excluding pancreatic and prostate cancer, test of effects size p-value. Chi-square test for heterogeneity p-value=0.8.
Additional files
-
Supplementary file 1
Cohort characteristics.
- https://doi.org/10.7554/eLife.37294.013
-
Supplementary file 2
Distribution of cancer types in IMPACT cohorts.
- https://doi.org/10.7554/eLife.37294.014
-
Supplementary file 3
Association between overall survival and CNA burden after adjustment for purity in IMPACT prostate and pan-cancer cohorts.
Purity was determined by FACETS (Shen and Seshan, 2016).
- https://doi.org/10.7554/eLife.37294.015
-
Supplementary file 4
TAPG1 conservative treatment primary prostate CNA cohort.
- https://doi.org/10.7554/eLife.37294.016
-
Supplementary file 5
MSK-IMPACT primary prostate tumor cohort annotation.
- https://doi.org/10.7554/eLife.37294.017
-
Supplementary file 6
MSK-IMPACT metastatic prostate tumor cohort annotation.
- https://doi.org/10.7554/eLife.37294.018
-
Supplementary file 7
MSK-IMPACT primary pan-cancer cohort annotation.
- https://doi.org/10.7554/eLife.37294.019
-
Supplementary file 8
MSK-IMPACT metastatic pan-cancer cohort annotation.
- https://doi.org/10.7554/eLife.37294.020
-
Supplementary file 9
TCGA Cohort statistics: patient exclusion, events, and follow-up.
- https://doi.org/10.7554/eLife.37294.021
-
Transparent reporting form
- https://doi.org/10.7554/eLife.37294.022
Download links
A two-part list of links to download the article, or parts of the article, in various formats.
Downloads (link to download the article as PDF)
Open citations (links to open the citations from this article in various online reference manager services)
Cite this article (links to download the citations from this article in formats compatible with various reference manager tools)
Tumor copy number alteration burden is a pan-cancer prognostic factor associated with recurrence and death
eLife 7:e37294.
https://doi.org/10.7554/eLife.37294


