Excitatory and inhibitory synapse reorganization immediately after critical sensory experience in a vocal learner
- University of Zurich and ETH Zurich, Switzerland
- Neuroscience Center Zurich, Switzerland
- Wellesley College, United States
- University of Zurich, Switzerland
Figures
Figure 1 with 6 supplements
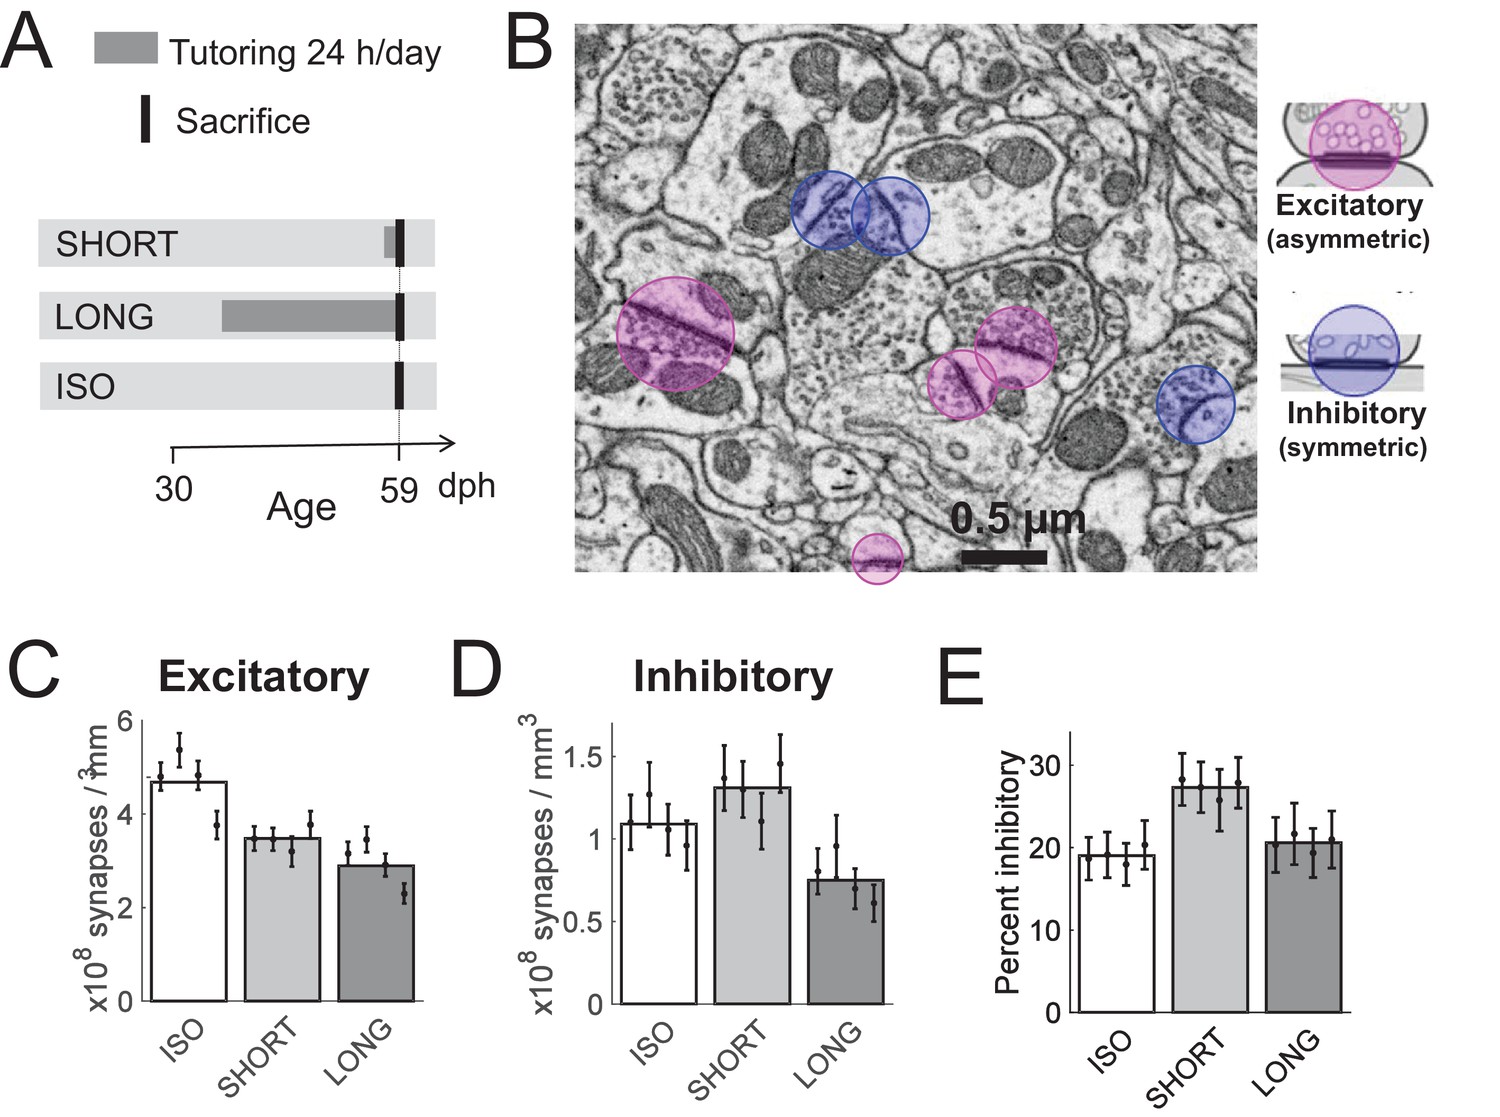
Effect of tutoring on HVC synapse densities, experiment I.
(A) Experiment timeline. Male zebra finches were either tutored for one day (SHORT), for 24 days (LONG), or not at all (ISO), before being sacrificed at 59 days post hatch (dph). (B) We identified excitatory and inhibitory synapses in HVC tissue imaged with serial section electron microscopy (ssEM). (C) The excitatory synapse density decreases with increasing tutor exposure. (D) The inhibitory synapse density increases in briefly tutored birds, but it decreases in chronically tutored birds. (E) Tutoring induces a transient increase in the percentage of inhibitory synapses. (C-E) White/gray bars represent group means and the error bars represent the means in individual birds ± the standard deviations.
Figure 1—figure supplement 1

HVC volume in Experiment II.
HVC sizes in different animal groups (bars), reported for each animal (whiskers depict means across the two hemispheres ± the standard deviations).
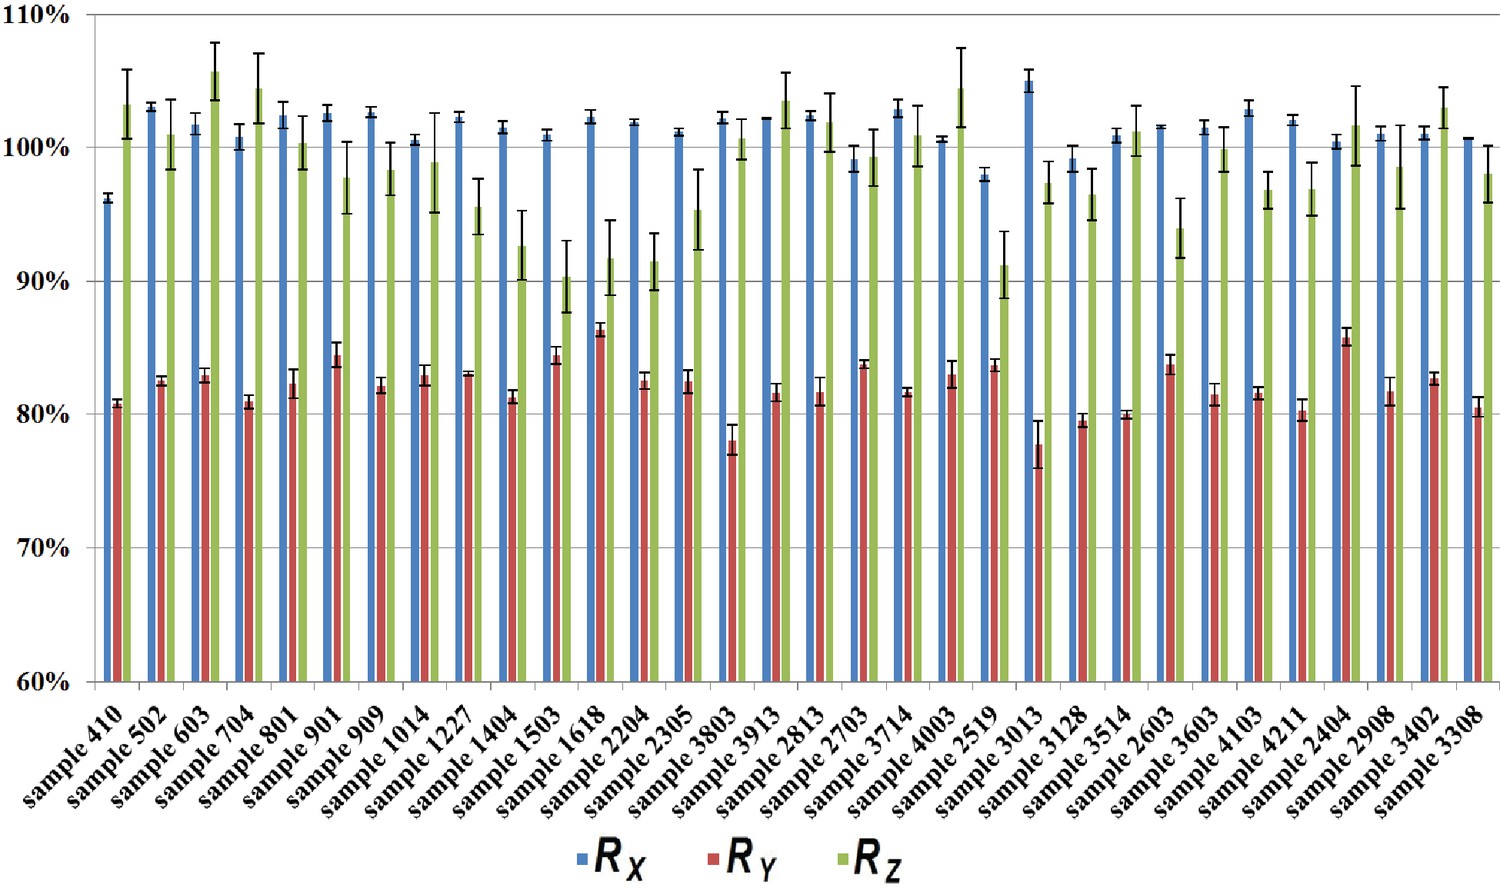
Figure 1—figure supplement 2

Estimated tissue deformation caused by EM embedding, reported for each of the 32 samples.
Error bars stem from 3 measurements per sample.
Figure 1—figure supplement 3
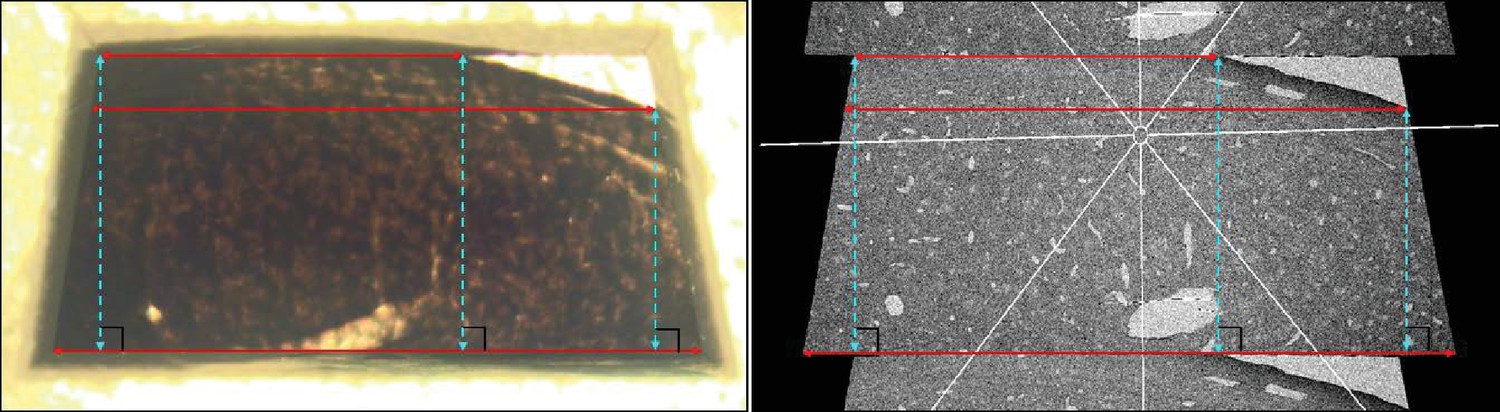
Estimation of tissue deformation caused by ultramicrotomy.
Left, LM image of a sample block face after ultramicrotomy. Right, SEM overview of an ultrathin section cut from that block face. The red solid lines represent three distance measurements along the X- axis. Based on such measurement pairs, we estimated the tissue deformation . The blue dashed lines represent three distance measurements along the Y- axis, used to estimate the deformation .
Figure 1—figure supplement 4

Thickness estimation of ultrathin sections using cylindrical objects.
We drew 3D spherical objects with TrakEM2 into mitochondria. (a – f) are consecutive 2D images of a sample mitochondrion that was longitudinally dissected. The yellow, blue, and red circles represent 2D sections of the spherical objects, which denote center (yellow), pre-center (blue), and post-center (red) Z positions.
Figure 1—figure supplement 5
Tissue deformations (blue), (red), (green) caused by ultramicrotomy.
The bars depict averages of 3 measurements for each animal and the whiskers depict standard errors from these 3 measurements.
Figure 1—figure supplement 6

Cumulative tissue deformation caused by EM embedding and ultramicrotomy, seperately reported for each sample.
https://doi.org/10.7554/eLife.37571.009
Figure 2
Effect of aging on HVC synapse densities, experiment II.
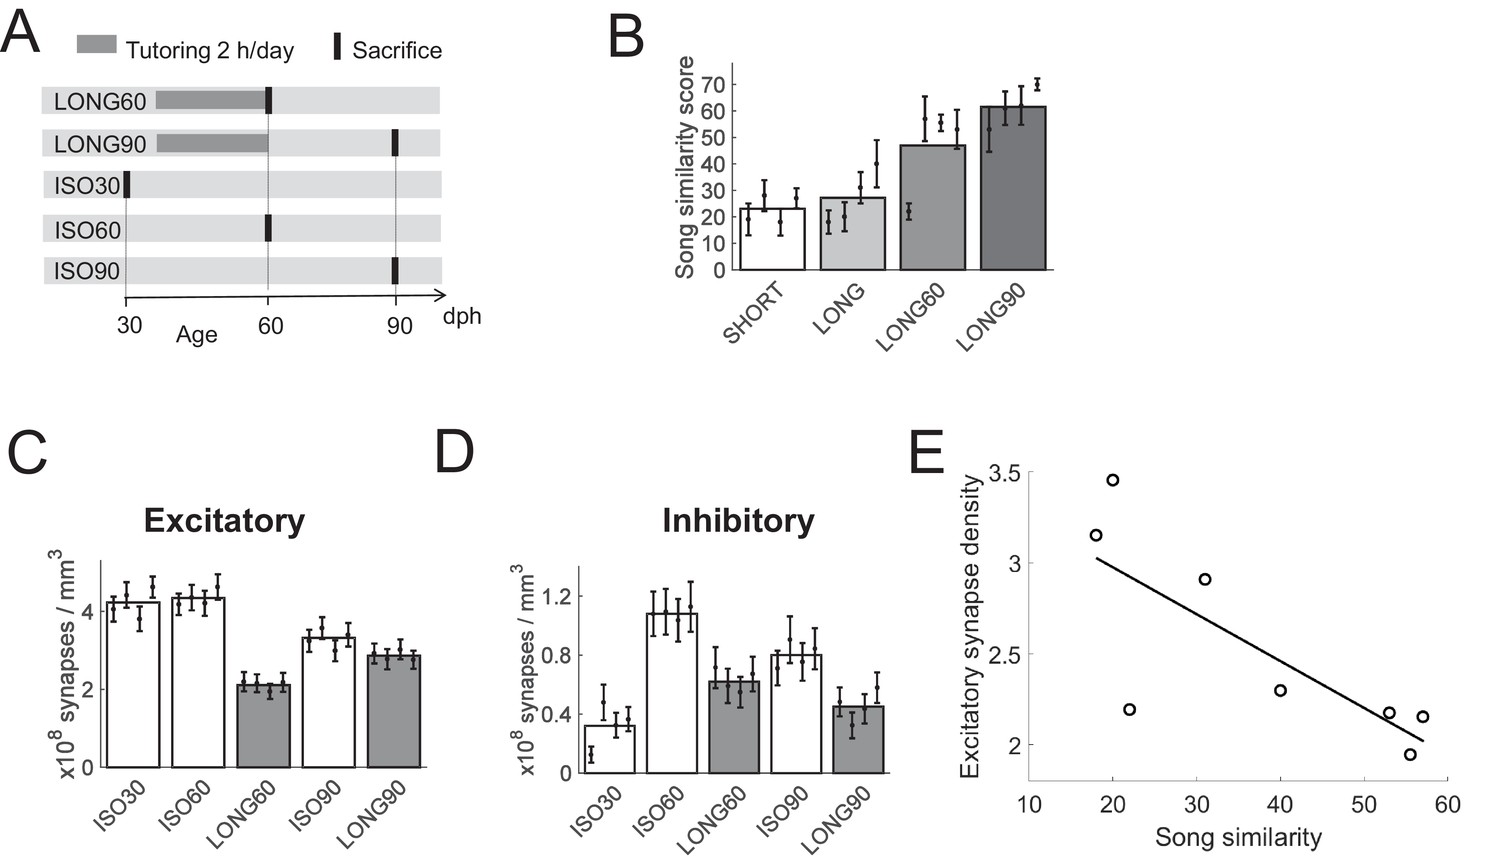
(A) Experiment timeline. Male zebra finches were either tutored for 24 days (LONG), or not at all (ISO). Birds were sacrificed at 30, 60, or 90 dph. (B) Sparsely tutored (LONG60) birds produced good song copies at 60 dph, their similarity score with tutor song was higher on average than in densely tutored (LONG) birds. (C) Bar plots of excitatory and D) of inhibitory synapse densities. B-D White/gray bars represent group means and the error bars represent means in individual birds ± the standard deviations. (E) At 60 dph, there was a negative correlation between song similarity and excitatory synapse density, r = −0.77, p = 0.026.
Figure 3
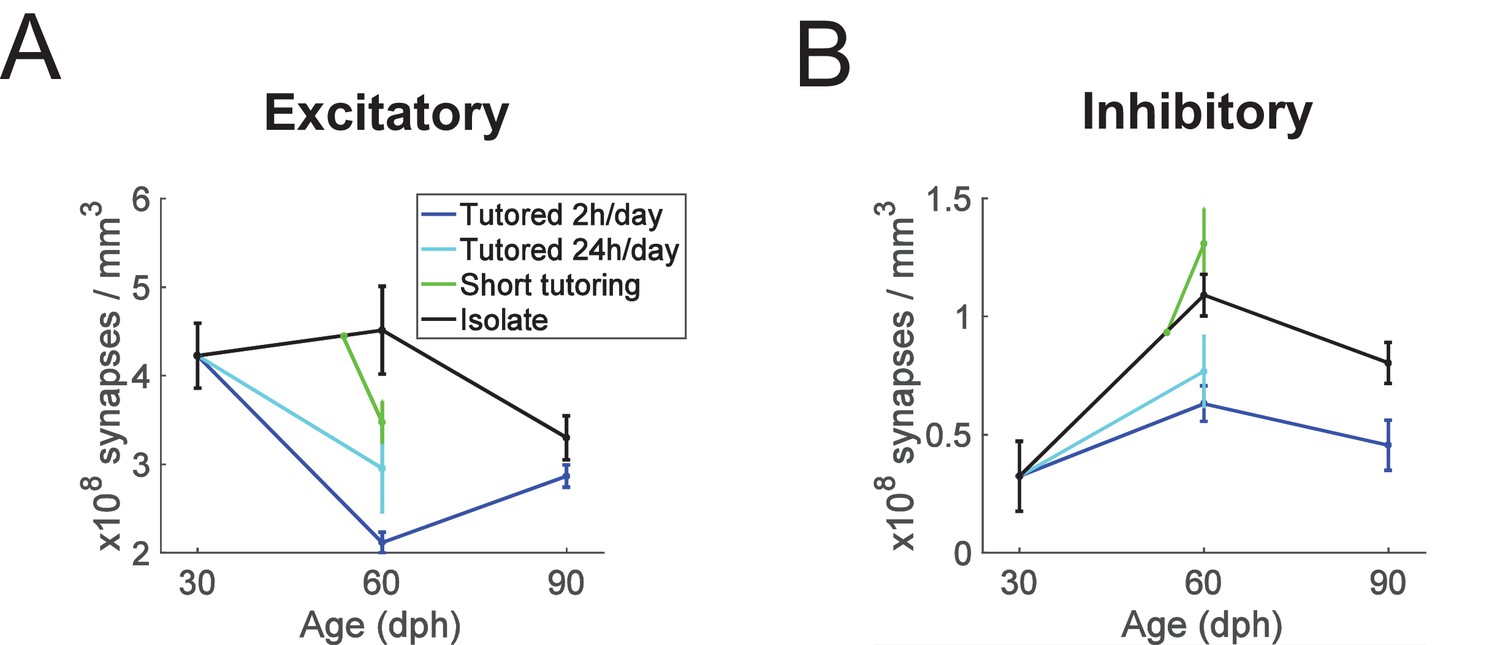
Summary plots showing age and experience dependence of excitatory and inhibitory synapse densities.
(A) excitatory synapses, (B) inhibitory synapses. Error bars depict stand deviations.
Figure 4 with 2 supplements
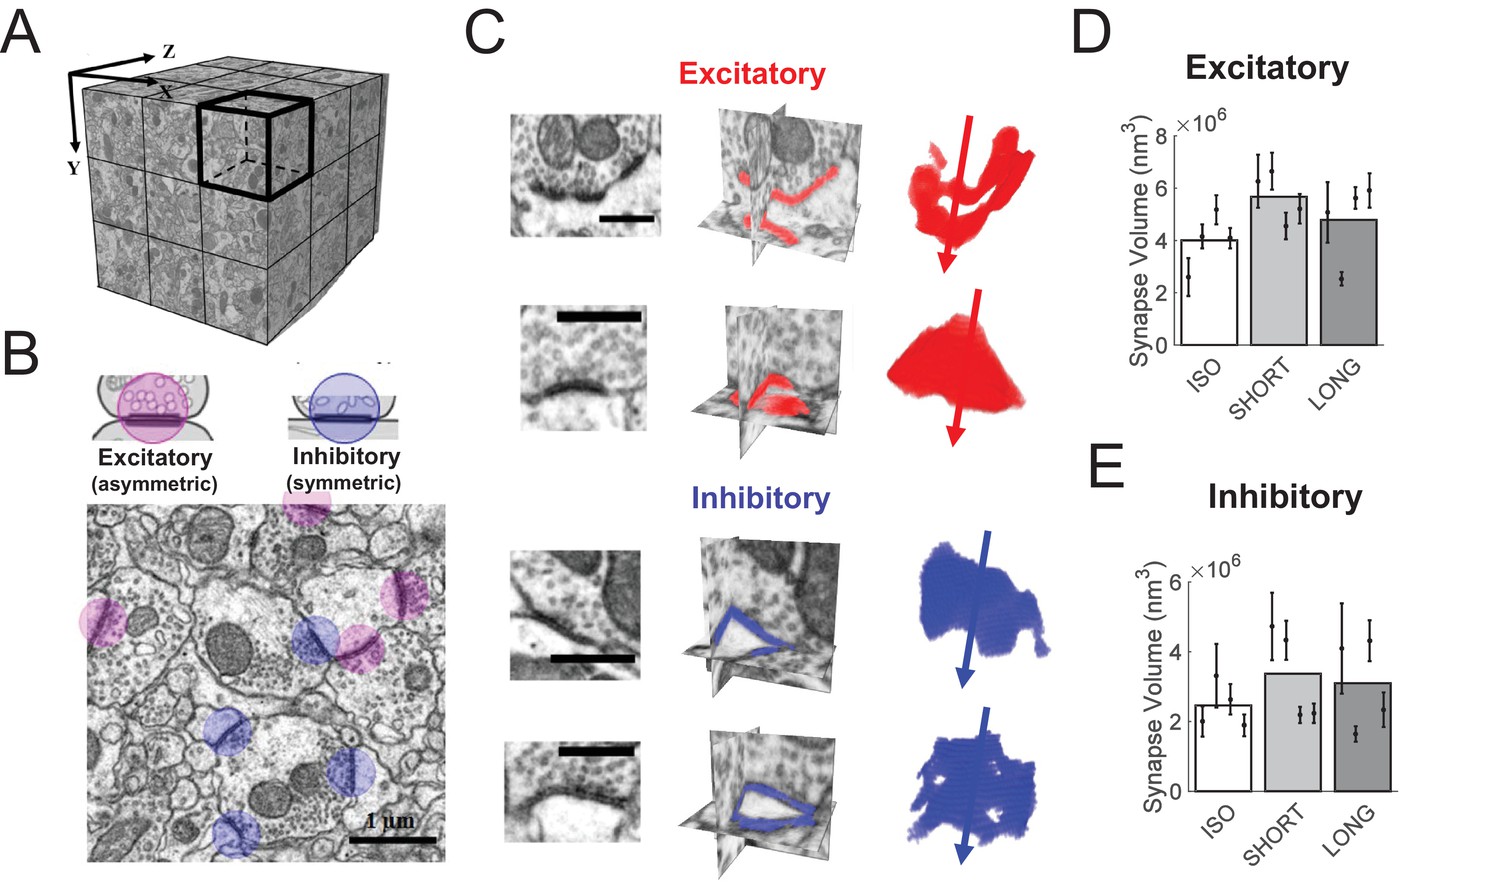
HVC synapse sizes are variable and weakly affected by tutoring.
(A) We acquired close to isotropic imagery of an (8 μm)3 cube of HVC tissue using focused ion beam electron microscopy (FIBSEM). (B) Example image of excitatory (red) and inhibitory (blue) synapses. (C) Example reconstructed excitatory (red) and inhibitory (blue) synapses. Shown are the synapses in the original FIBSEM dataset (left), 3D orthoslices intersected at the synapse centers with the segmented synapse voxels shown in color (middle), and 3D reconstruction of the segmented voxels with arrows pointing to the postsynaptic side (right). Scale bars: 0.5 μm. (D) Excitatory (asymmetric) synapses in tutored (SHORT) birds were larger than in untutored (ISO) birds, no significant change in synapse size was associated with extensive tutoring (LONG birds). (E) Neither SHORT nor LONG tutoring was associated with significant changes in inhibitory synapse sizes. C-D White/gray bars represent group means and the error bars represent the means in individual birds ± the standard deviations.
Figure 4—figure supplement 1
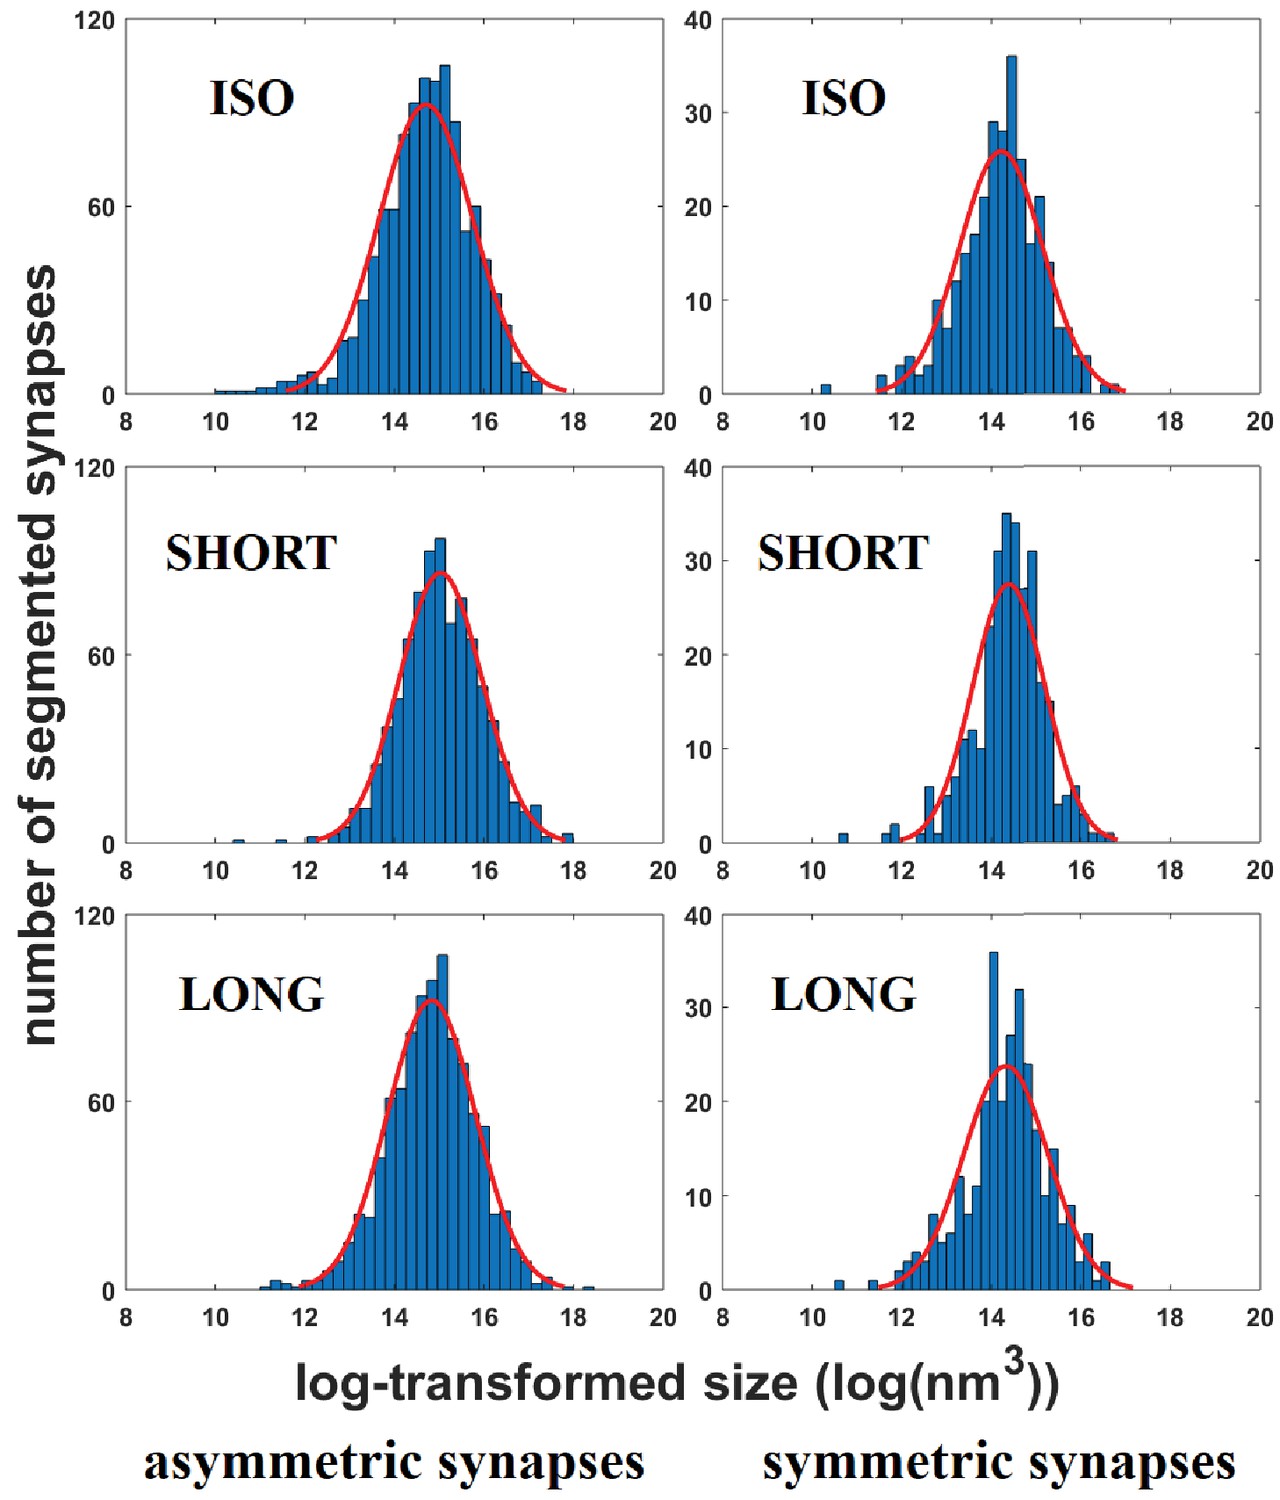
Histograms of synapse sizes per bird group and synapse type.
Sizes (X-axis) were log-transformed. Gaussian fits are shown in red.
Figure 4—figure supplement 2

Segmenting synapses in FIBSEM imagery using Ilastik.
(a) This sample image served as a reference for panels (b) – (d). (b) Objects (synapses in red, membranes in green, vesicles in purple, mitochondria in blue, and remainder in yellow) were manually labeled and served as ground truth for automated segmentation. (c) Ilastik-predicted pixel identities in corresponding colors. Note that despite the small mistake in b of labeling parts of a mitochondrion as ‘remainder’, the predicted pixel classification is robust and mitochondria are mostly correctly identified. (d) Binary image of segmented synapses. Pixels segmented as synapses are shown in red, superimposed on the original EM image.
Figure 5

Synapse elimination model of tutor song memorization.
Exposure to tutor song leads to insertion of those inhibitory synapses and strengthening of those excitatory synapses (green arrows) that are part of the HVC subnetwork (middle) involved in production of a note resembling a tutor note (full blue arrow). By contrast, excitatory synapses associated with notes and note transitions unlike in tutor song (dashed blue arrows) are eliminated (red crosses) right after tutoring. The HVC subnetworks associated with diverse notes in the juvenile’s song need not to be topographically organized as shown here.
Figure 6
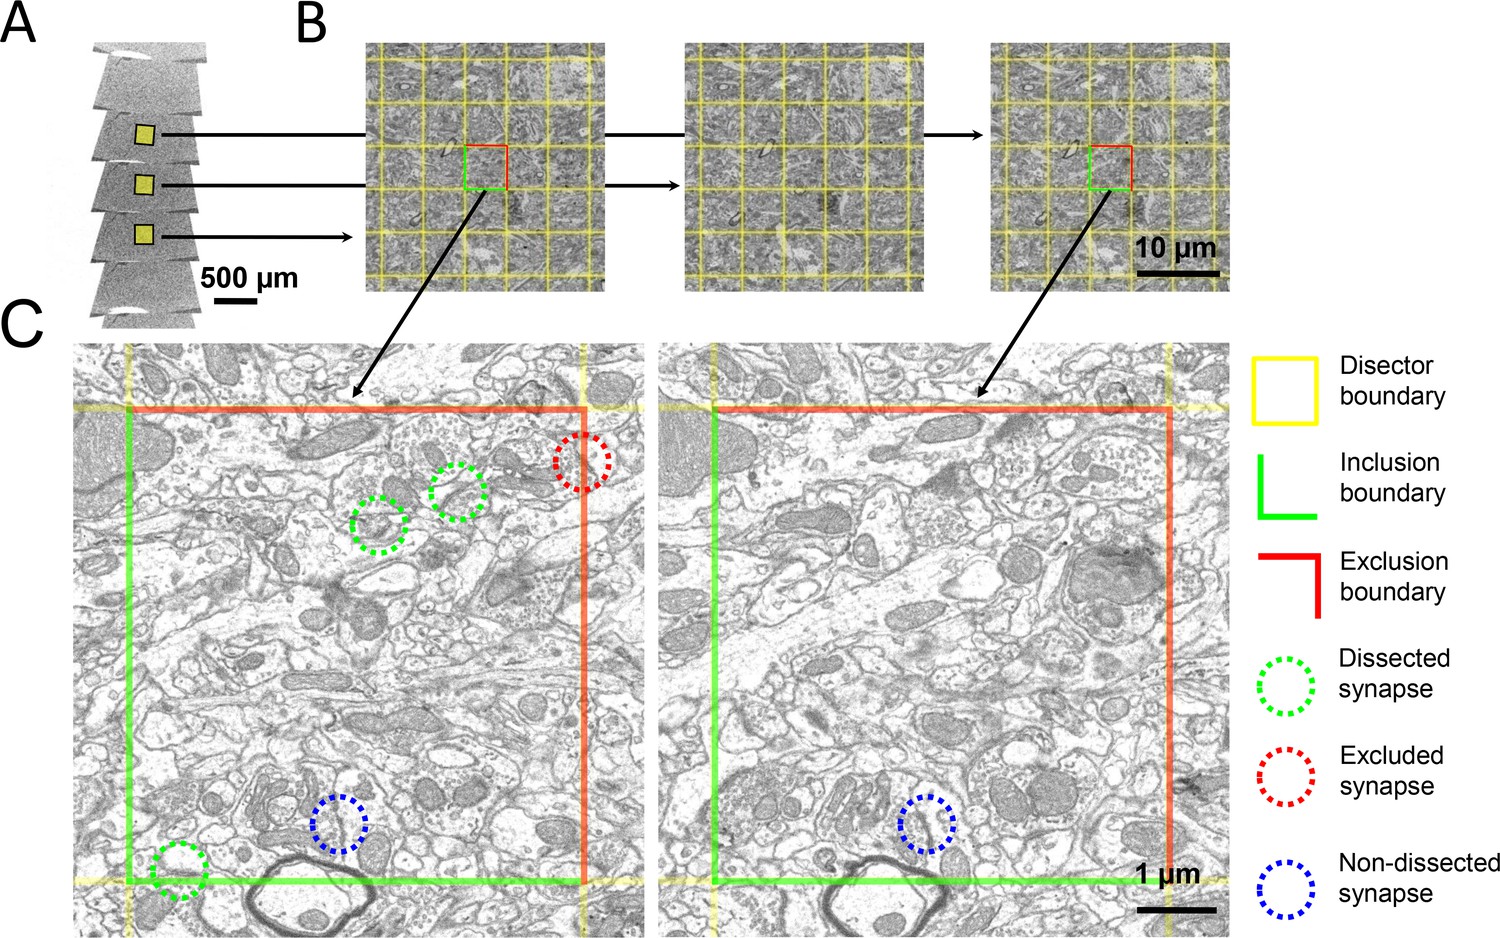
The disector method for counting synapses in ssSEM datasets.
(a) Ribbons of serial ultrathin brain sections were scanned with an electron microscope. (b) A pair of aligned sections were chosen as reference (left) and look-up (right) sections. A 5 × 5 µm grid (yellow) was superimposed onto corresponding regions of the reference and look-up sections to delineate the boundaries of the disectors. (c) In this zoom-in, the green lines delineate the inclusion boundaries, and the red lines delineate the exclusion boundaries. Dissected, excluded, and non-dissected example synapses are color-circled in green, red, and blue, respectively.
Tables
Table 1
Bird groups used in Experiments I (ISO, SHORT, and LONG) and in Experiment II (ISO30, ISO60, ISO90, LONG60, LONG90)
https://doi.org/10.7554/eLife.37571.010| Bird group | Tutoring (dph) | Tutoring H/day | Sacrifice (dph) |
|---|---|---|---|
| ISO | - | - | 59 |
| SHORT | 58 | 24 | 59 |
| LONG | 35–58 | 24 | 59 |
| ISO30 | - | 60 | |
| ISO60 | - | - | 60 |
| ISO90 | - | - | 90 |
| LONG60 | 35–59 | 2 | 60 |
| LONG90 | 35–39 | 2 | 90 |
Additional files
-
Transparent reporting form
- https://doi.org/10.7554/eLife.37571.018
Download links
A two-part list of links to download the article, or parts of the article, in various formats.
Downloads (link to download the article as PDF)
Open citations (links to open the citations from this article in various online reference manager services)
Cite this article (links to download the citations from this article in formats compatible with various reference manager tools)
Excitatory and inhibitory synapse reorganization immediately after critical sensory experience in a vocal learner
eLife 7:e37571.
https://doi.org/10.7554/eLife.37571


