Changes in mRNA abundance drive shuttling of RNA binding proteins, linking cytoplasmic RNA degradation to transcription
- University of California, United States
- Princeton University, United States
- Howard Hughes Medical Institute, United States
Figures
Figure 1 with 1 supplement
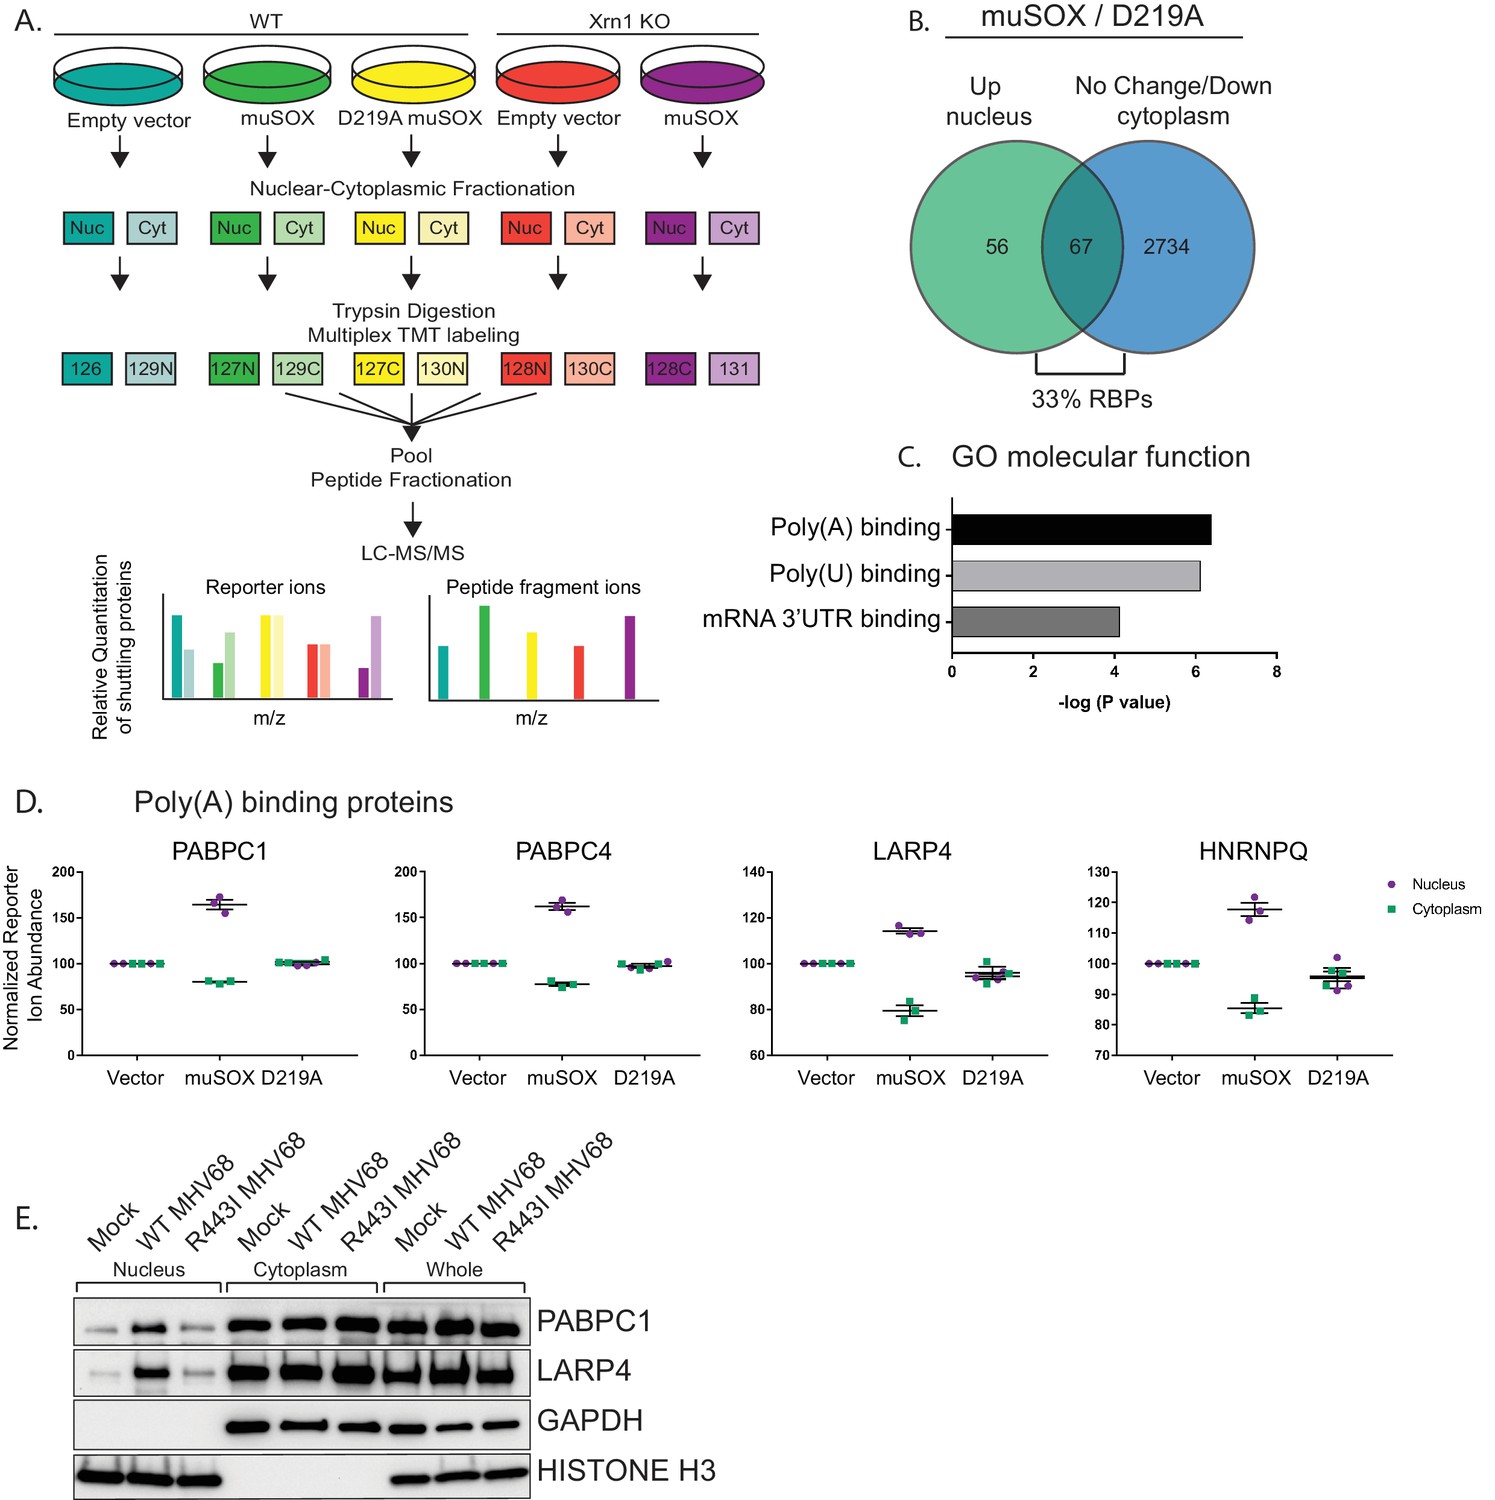
RNA binding proteins are translocated from the cytoplasm to the nucleus in cells undergoing enhanced cytoplasmic mRNA decay.
(A) Diagram depicting the experimental setup. (B) Venn diagram of nuclear proteins that are specifically and significantly (p<0.05) enriched in muSOX-expressing cells compared to D219A-expressing cells that also show either no change or a decrease in cytoplasmic abundance. (C) Gene ontology molecular function overrepresentation analysis by Pantherdb, graphed according to their P value. (D) Graphs showing the nuclear and cytoplasmic distribution of poly(A) binding proteins from the TMT-MS data. Graphs display the mean with SEM of 3 biological replicates. (E) Western blot of nuclear, cytoplasmic, and whole cell fractions of NIH3T3 fibroblasts mock infected or infected with WT or R443I MHV68 for 24 hr. GAPDH and histone H3 serve as fractionation and loading controls. Shown is a representative example of 3 biological replicates.
Figure 1—figure supplement 1

RNA binding proteins are translocated from the cytoplasm to the nucleus in cells undergoing enhanced mRNA decay.
(A) Western blots of nuclear, cytoplasmic, and whole cell fractions of HEK293T cells transfected with either empty vector control, WT muSOX, or D219A muSOX. Shown are two independent biological replicates. GAPDH and histone H3 serve as fractionation and loading controls. (B, C) Graphs showing poly(U) (B) and 3' UTR (C) binding protein distributions in the nucleus and cytoplasm from the TMT-LC/MS-MS data. Graphs display the mean with SEM of 3 biological replicates.
Figure 2 with 1 supplement
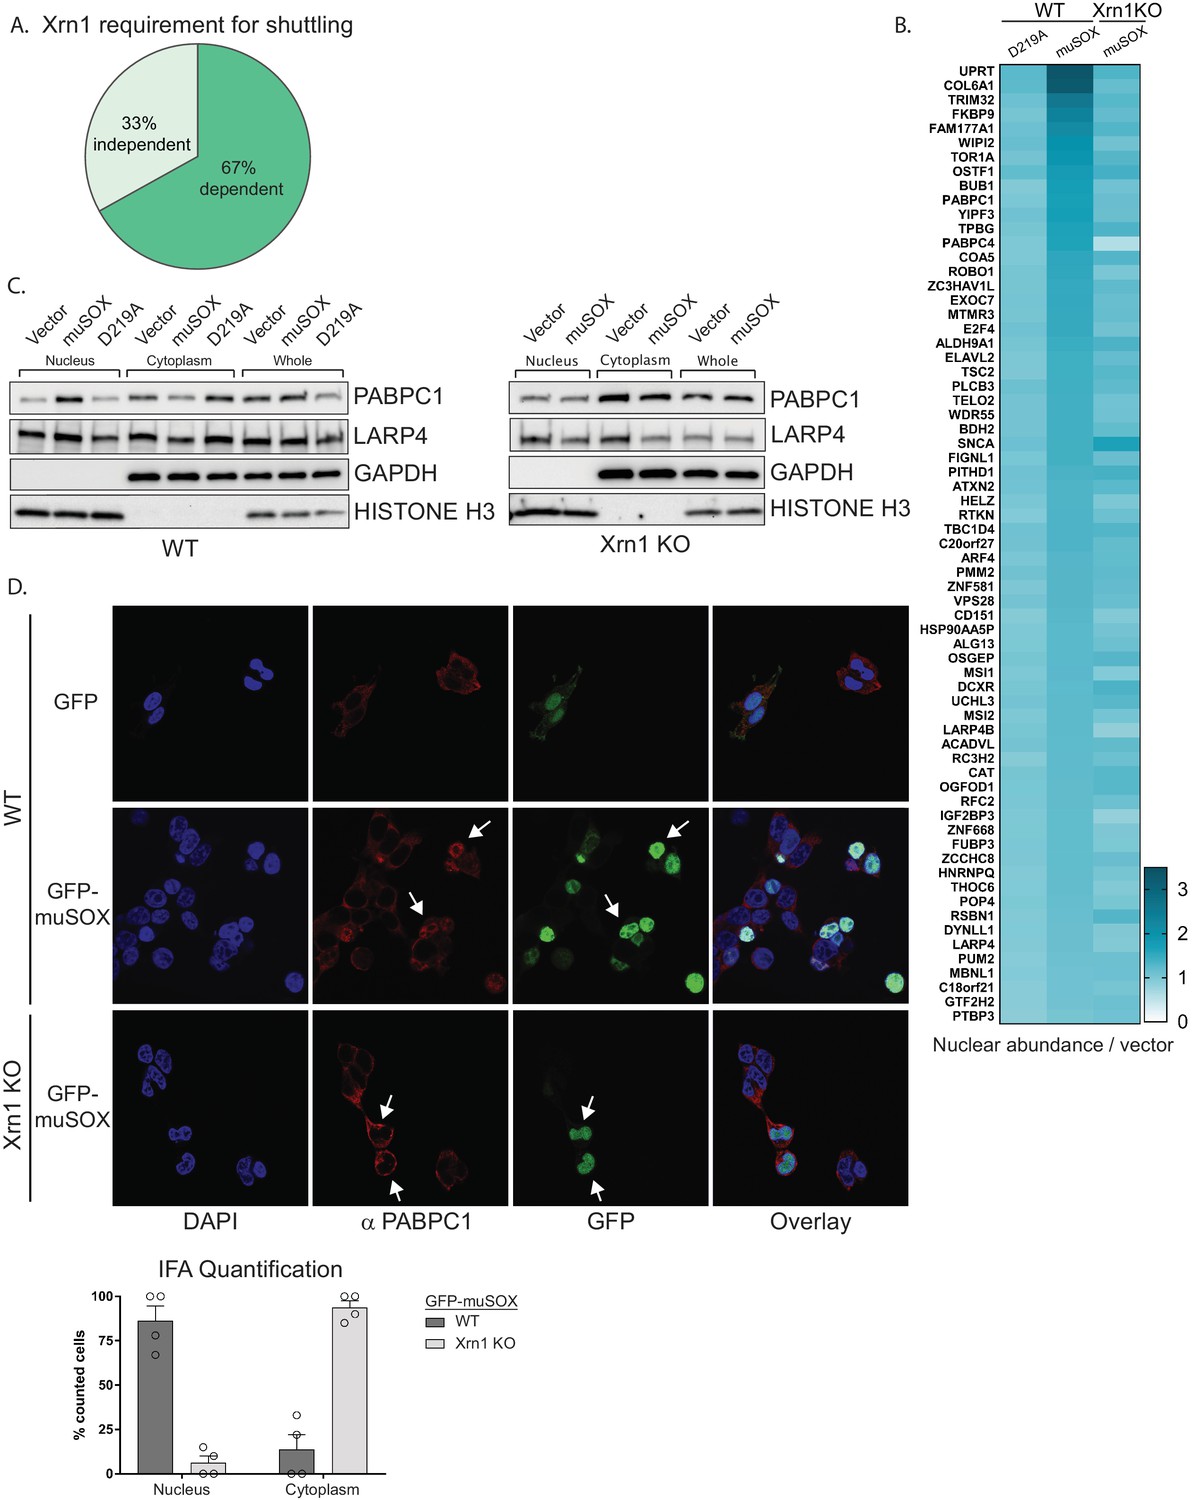
Nuclear translocation of RNA binding proteins is dependent on mRNA degradation by Xrn1.
(A) Pie chart showing the percent of shuttling proteins that fail to translocate in Xrn1 KO cells. (B) Heat map depicting the average nuclear abundance in WT or Xrn1 KO HEK293T cells of the 67 significantly shifted proteins in samples expressing muSOX or D219A, relative to the empty vector control. (C) Western blots of nuclear, cytoplasmic, and whole cell fractions of WT (left panel) or Xrn1 KO (right panel) HEK293T cells transfected with the indicated plasmid. GAPDH and histone H3 serve as fractionation and loading controls. (D) Confocal microscopy and quantification of WT or Xrn1 KO HEK293T cells transfected with GFP or GFP-muSOX, showing signals for DAPI stained nuclei (blue), PABPC (red), GFP (green), and the merged images (overlay). Arrow heads point to representative GFP-muSOX expressing cells. The number of cells displaying either cytoplasmic or nuclear PABPC localization by immunofluorescence (IFA) was quantified for WT or Xrn1 KO cells expressing GFP-muSOX. A total of 75 GFP-muSOX WT cells and 80 GFP-muSOX Xrn1 KO cells were counted. The graph displays individual biological replicates as dots, with the mean and SEM.
Figure 2—figure supplement 1

Nuclear translocation of RNA binding proteins is dependent on mRNA degradation by Xrn1.
(A) Western blots showing the levels of Xrn1 or the GAPDH loading control in WT or Xrn1 KO HEK293T cells. (B) WT or Xrn1 KO HEK293T cells transfected with either empty vector or muSOX were subjected to ChIP using antibodies to RNAPII or IgG. Purified chromatin was quantified by qPCR. Graphs display individual biological replicates as dots, with the mean and SEM. Statistical significance was determined using Student’s t test *p<0.05 **p<0.005 ***p<0.0005. (C) Growth curve of WT or Xrn1 KO HEK293T cells. Statistical significance was determined using Student’s t test *p<0.05 **p<0.005 ***p<0.0005. (D) Confocal microscopy of WT or Xrn1 KO HEK293T cells transfected with GFP or GFP-muSOX, showing signals for DAPI stained nuclei (blue), LARP4 (red), GFP (green), and the merged images (overlay). Arrow heads point to representative GFP-muSOX expressing cells.
Figure 3 with 1 supplement
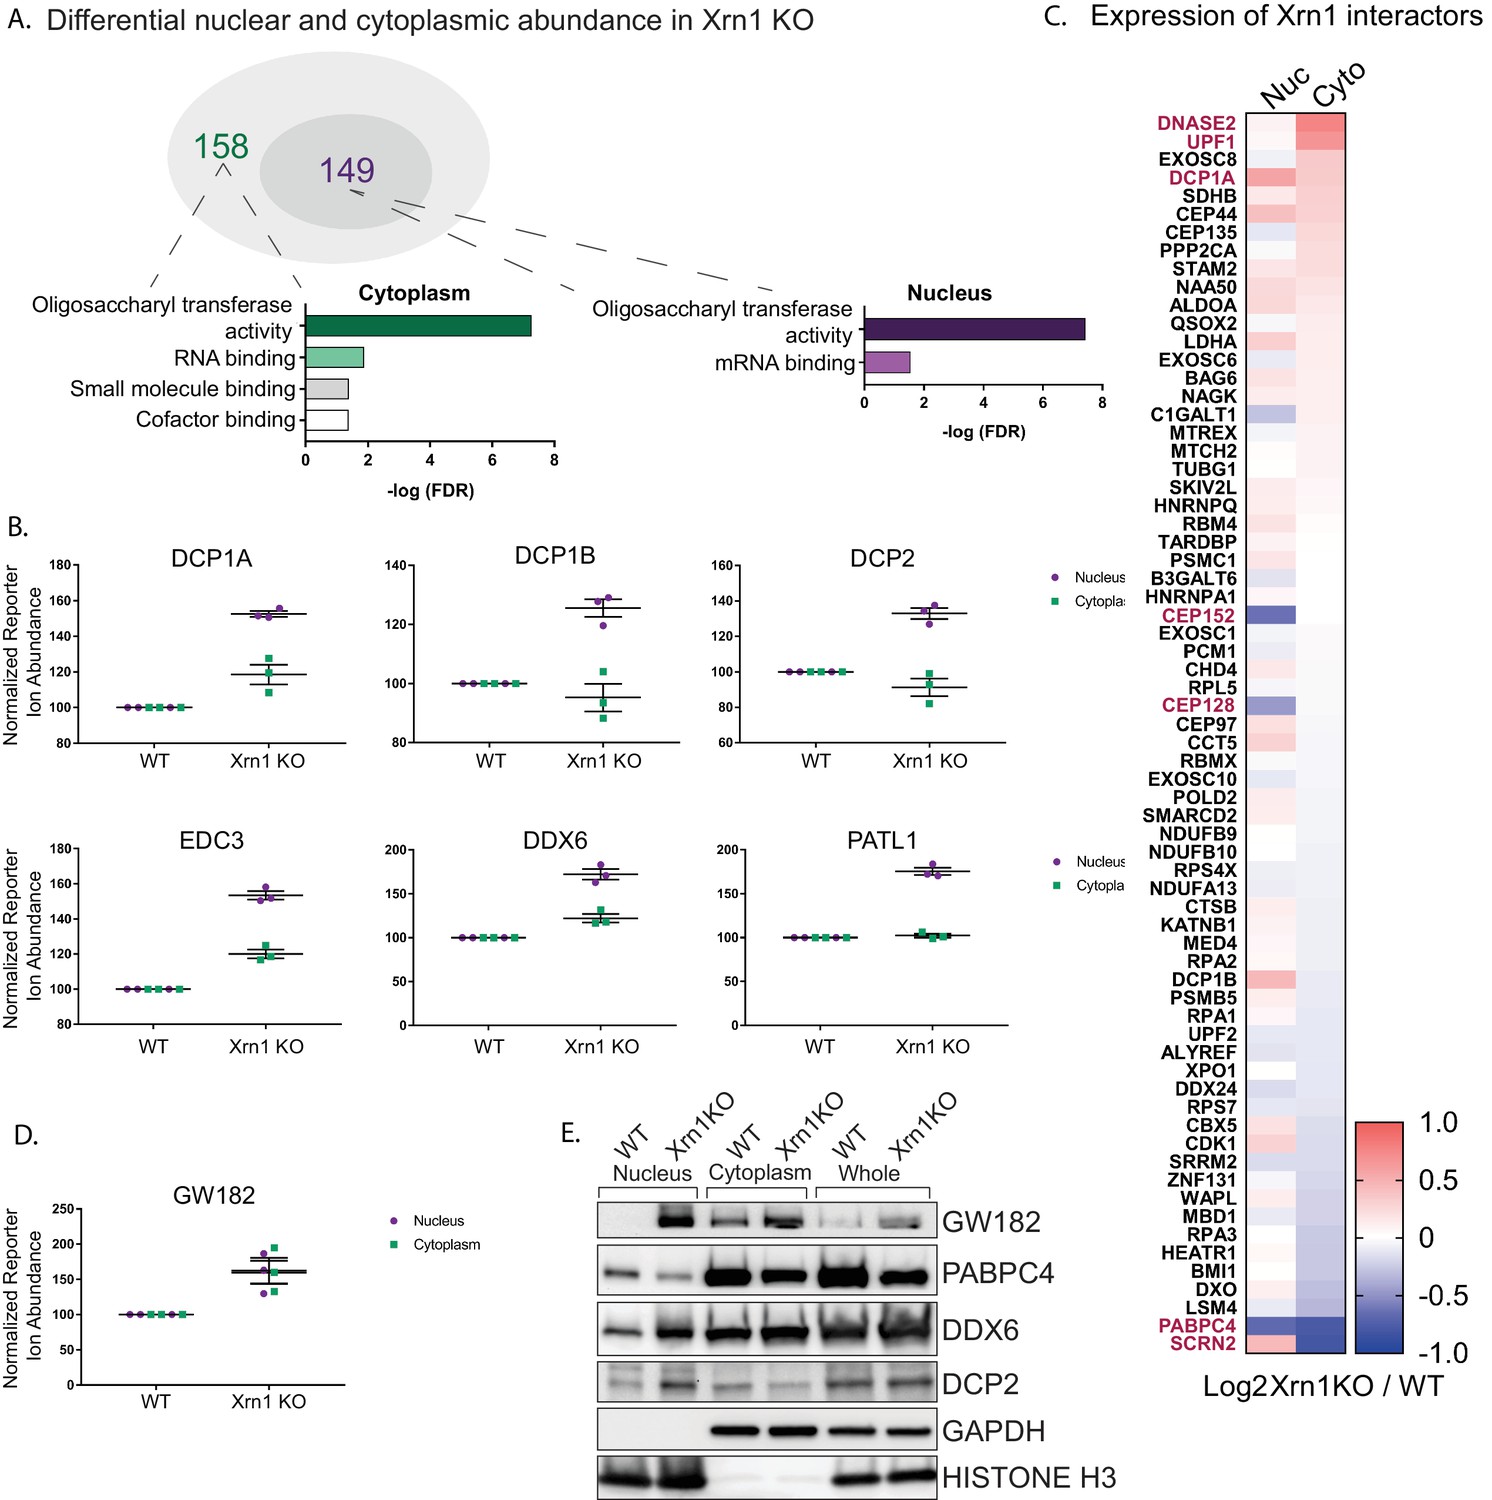
Xrn1 knockout leads to subcellular redistribution of proteins functionally associated with RNA.
(A) The number of proteins that are differentially expressed in Xrn1 knockout (KO) cells from the nucleus (149) and the cytoplasm (158). Gene ontology molecular function overrepresentation analysis by Pantherdb is shown for each compartment, graphed according to their false discovery rate (FDR). (B) Graphs showing the nuclear and cytoplasmic distribution of decapping-related proteins from the TMT-LC/MS-MS data. Graphs display the mean with SEM of 3 biological replicates. (C) Heatmap depicting the Log2 abundance ratio in Xrn1 KO HEK293T cells compared to WT HEK293T cells of proteins identified as Xrn1 interactors using the BioGRID database. Proteins with a significant difference in abundance between WT and Xrn1 KO are listed in red. (D) Graph of nuclear and cytoplasmic distribution of GW182 from the TMT-LC/MS-MS data. Graph displays the mean with SEM of 3 biological replicates. (E) Western blot of nuclear, cytoplasmic, and whole cell fractions of WT and Xrn1 KO HEK293T cells. GAPDH and histone H3 serve as fractionation and loading controls.
Figure 3—figure supplement 1
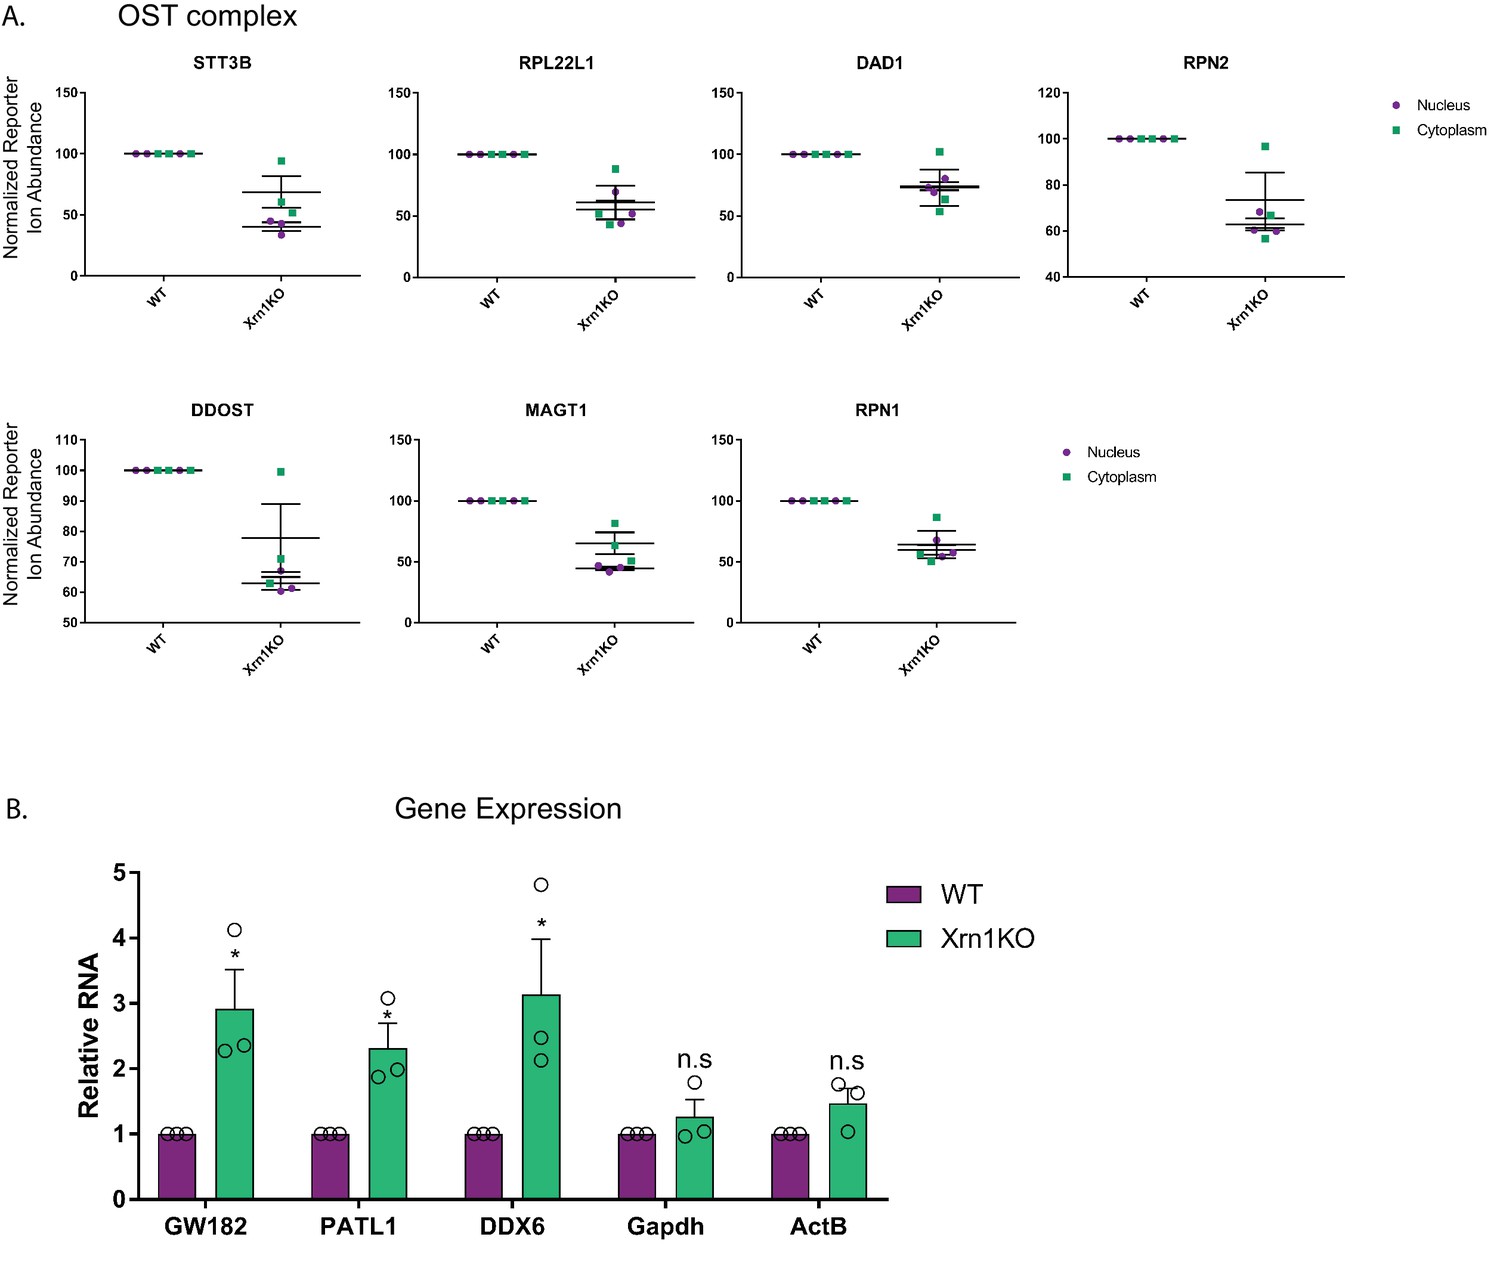
Xrn1 knockout leads to subcellular redistribution of proteins functionally associated with RNA.
(A) Graphs showing the distribution of proteins of the oligosaccharyltransferase (OST) complex in the nucleus and cytoplasm from the TMT-LC/MS-MS data. Graphs display the mean with SEM of 3 biological replicates. (B) mRNA levels from WT and Xrn1 KO HEK293T cells were measured by RT-qPCR. Graphs display individual biological replicates as dots, with the mean and SEM. Statistical significance was determined using Student’s t test *p<0.05 **p<0.005 ***p<0.0005.
Figure 4
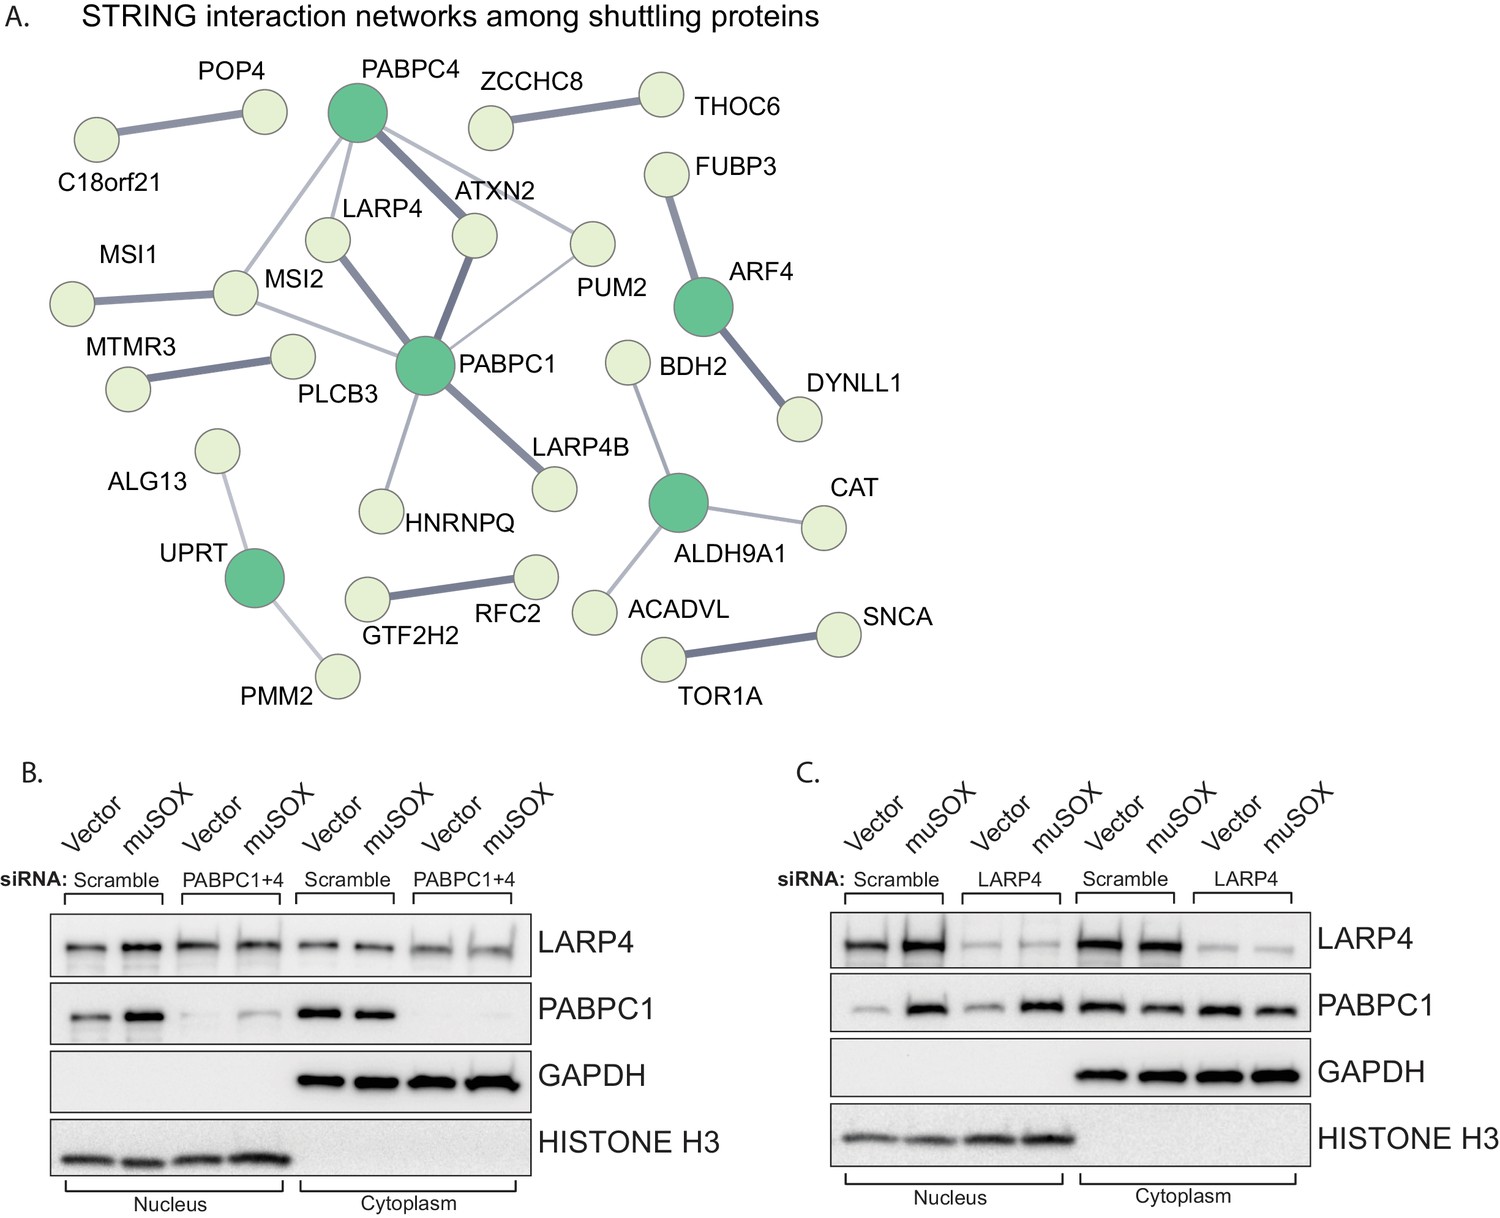
LARP4 translocates to the nucleus in a PABPC-dependent manner.
(A) STRING network of reported protein-protein interactions between the 67 proteins that shuttle in muSOX-expressing cells. Medium and high confidence interactions are shown with thin and thick connector lines, respectively. (B, C) Western blots of nuclear and cytoplasmic fractions of vector- or muSOX-transfected HEK293T cells treated with the indicated siRNA. GAPDH and histone H3 serve as fractionation and loading controls.
Figure 5 with 2 supplements
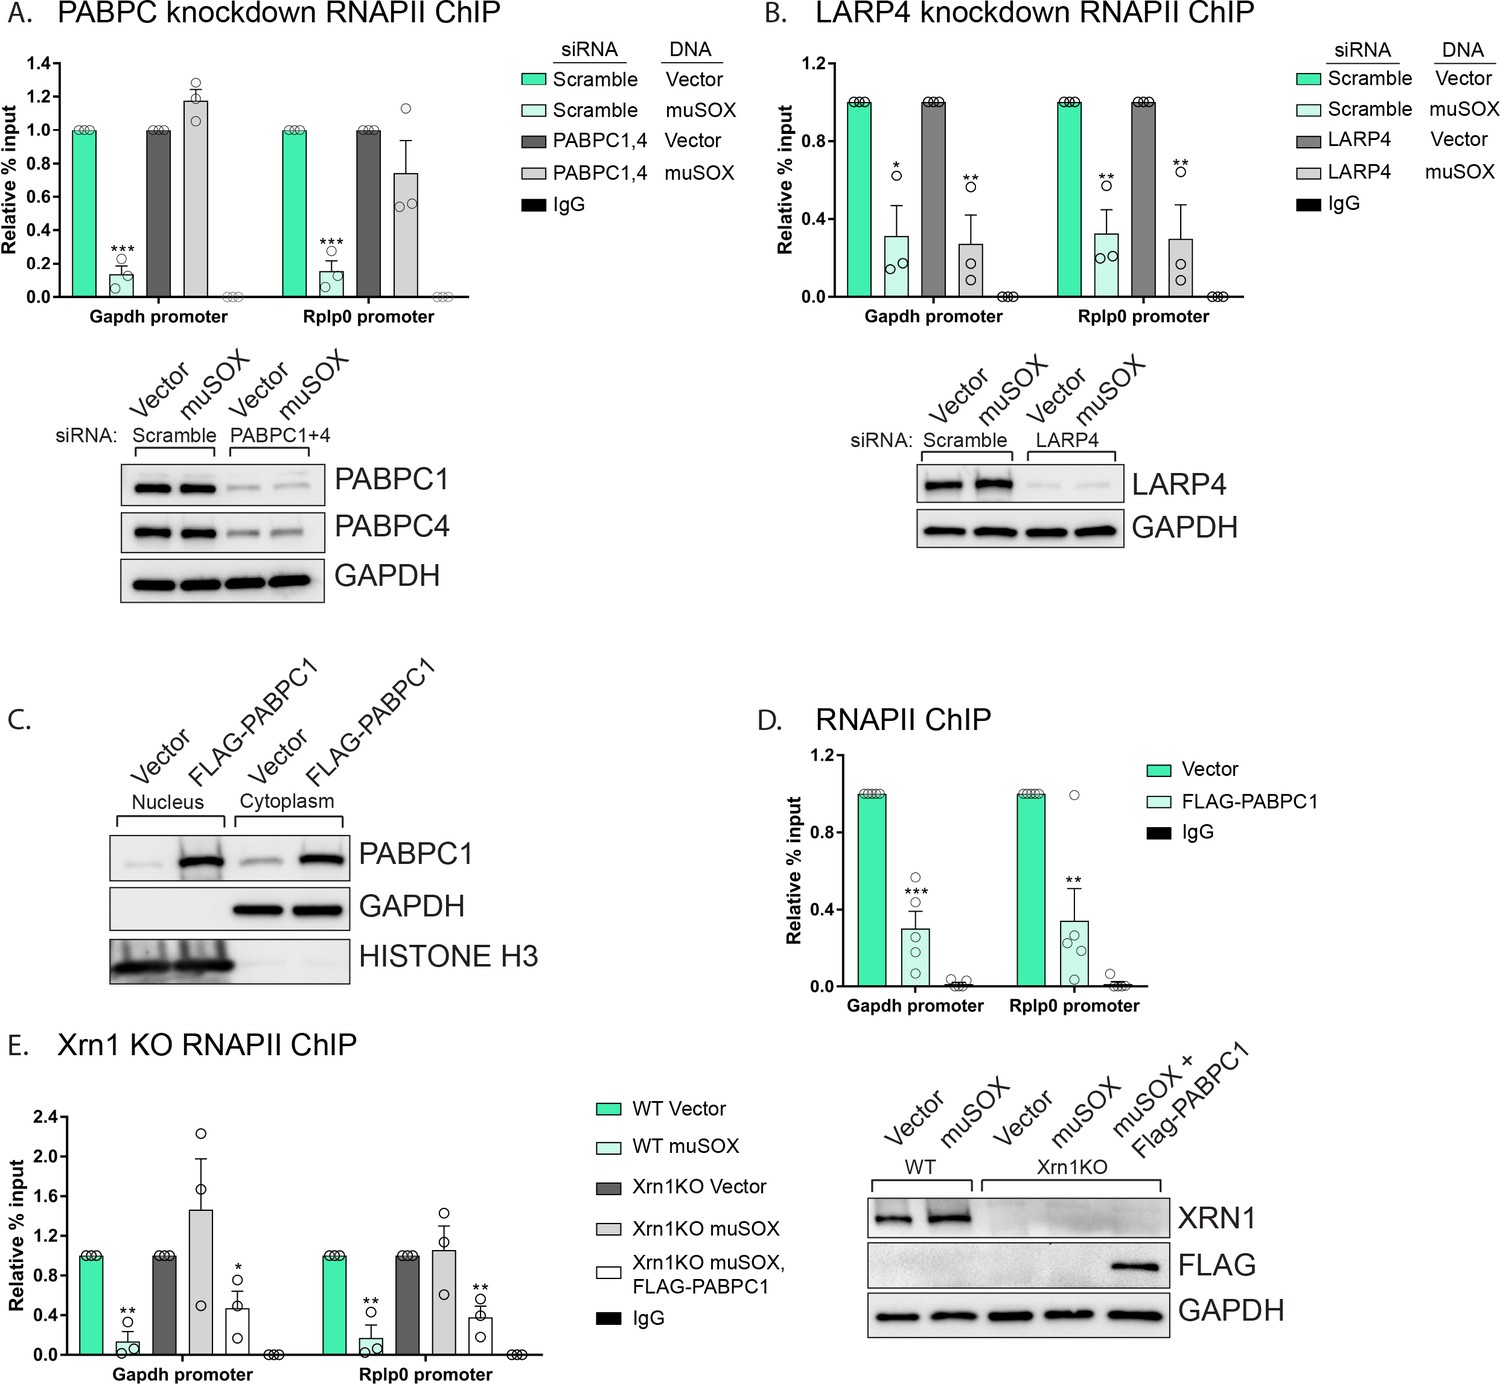
PABPC depletion prevents muSOX-induced repression of RNAPII recruitment.
(A, B) HEK293T cells treated with siRNAs targeting PABPC1 and 4 (A), LARP4 (B), or non-targeting scramble siRNAs were subsequently transfected with either empty vector or muSOX, then subjected to chromatin immunoprecipitation (ChIP) using antibodies to RNAPII or IgG. Western blots showing protein levels of PABPC1, PABPC4, and Larp4 after siRNA depletion are shown in the lower panels, along with a GAPDH loading control. (C) Western blots of nuclear and cytoplasmic fractions of HEK293T cells transfected with an empty vector or a plasmid containing FLAG-PABPC1. GAPDH and histone H3 serve as fractionation and loading controls. (D) HEK293T cells transfected with either empty vector or FLAG-PABPC1 were subjected to ChIP using antibodies to RNAPII or IgG. (E) WT or Xrn1 KO HEK293T cells transfected with either empty vector or FLAG-PABPC1 alone or together with muSOX were subjected to ChIP using antibodies to RNAPII or IgG. Purified chromatin in each of the above experiments was quantified by qPCR. Western blots showing the levels of Xrn1 in WT or Xrn1KO HEK293Ts are shown, along with a GAPDH loading control. All graphs display individual biological replicates as dots, with the mean and SEM. Statistical significance was determined using Student’s t test *p<0.05 **p<0.005 ***p<0.0005.
Figure 5—figure supplement 1
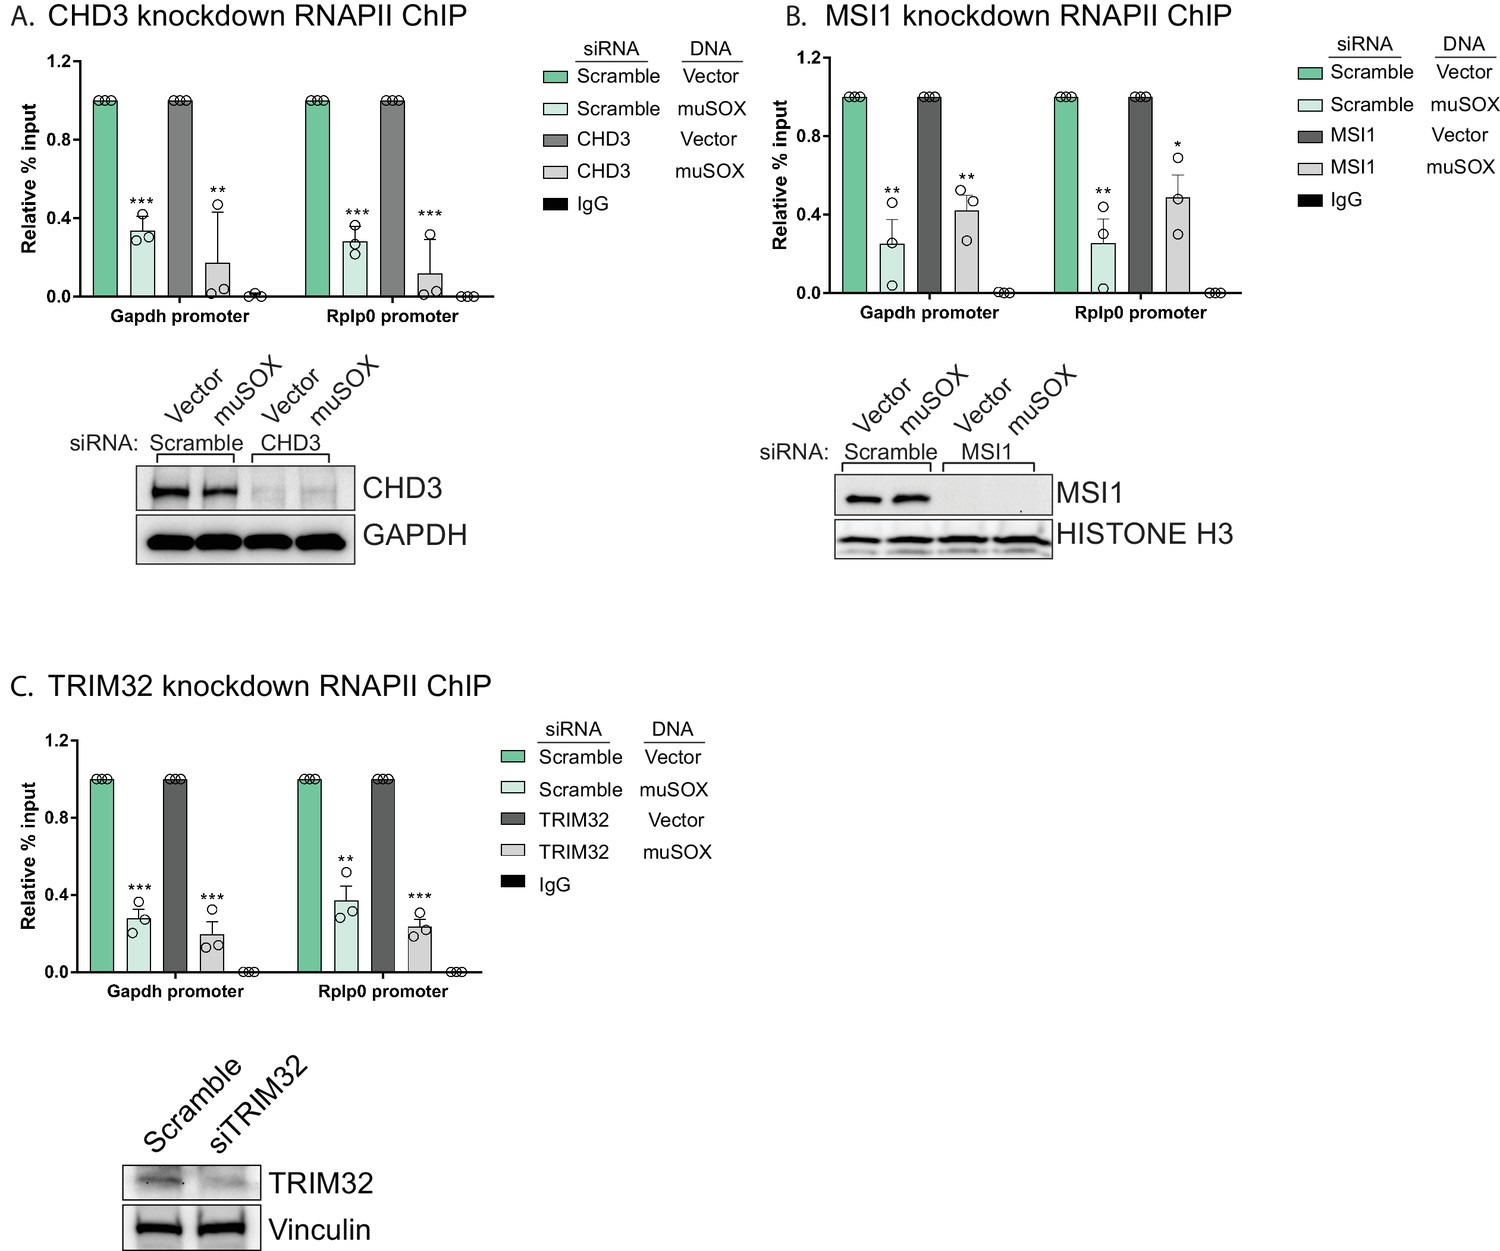
PABPC is required for the connection between cytoplasmic mRNA decay and RNAPII promoter occupancy.
(A,C) HEK293T cells were treated with siRNAs targeting CHD3 (A), MSI1 (B), or TRIM32 (C), or non-targeting scramble siRNAs, then transfected with either empty vector or muSOX and subjected to chromatin immunoprecipitation (ChIP) using antibodies to RNAPII or IgG. Purified chromatin was quantified by qPCR. Western blots showing the levels of CHD3 and MSI1 after siRNA depletion, along with a GAPDH or histone H3 loading control are shown below. Graphs display individual biological replicates as dots, with the mean and SEM. Statistical significance was determined using Student’s t test *p<0.05 **p<0.005 ***p<0.0005.
Figure 5—figure supplement 2

Effects of depleting PABPC, LARP4, CHD3, MSI1 and TRIM32 on RNAPII promoter occupancy.
(A–E) HEK293T cells were treated with siRNAs targeting PABPC1 and PABPC4 (A), LARP4 (B), CHD3 (C), MSI1 (D), or TRIM32 (E), and subjected to ChIP using antibodies to RNAPII or IgG. Purified chromatin was quantified by qPCR. All graphs display individual biological replicates as dots, with the mean and SEM. Statistical significance was determined using Student’s t test *p<0.05 **p<0.005 ***p<0.0005.
Figure 6 with 1 supplement
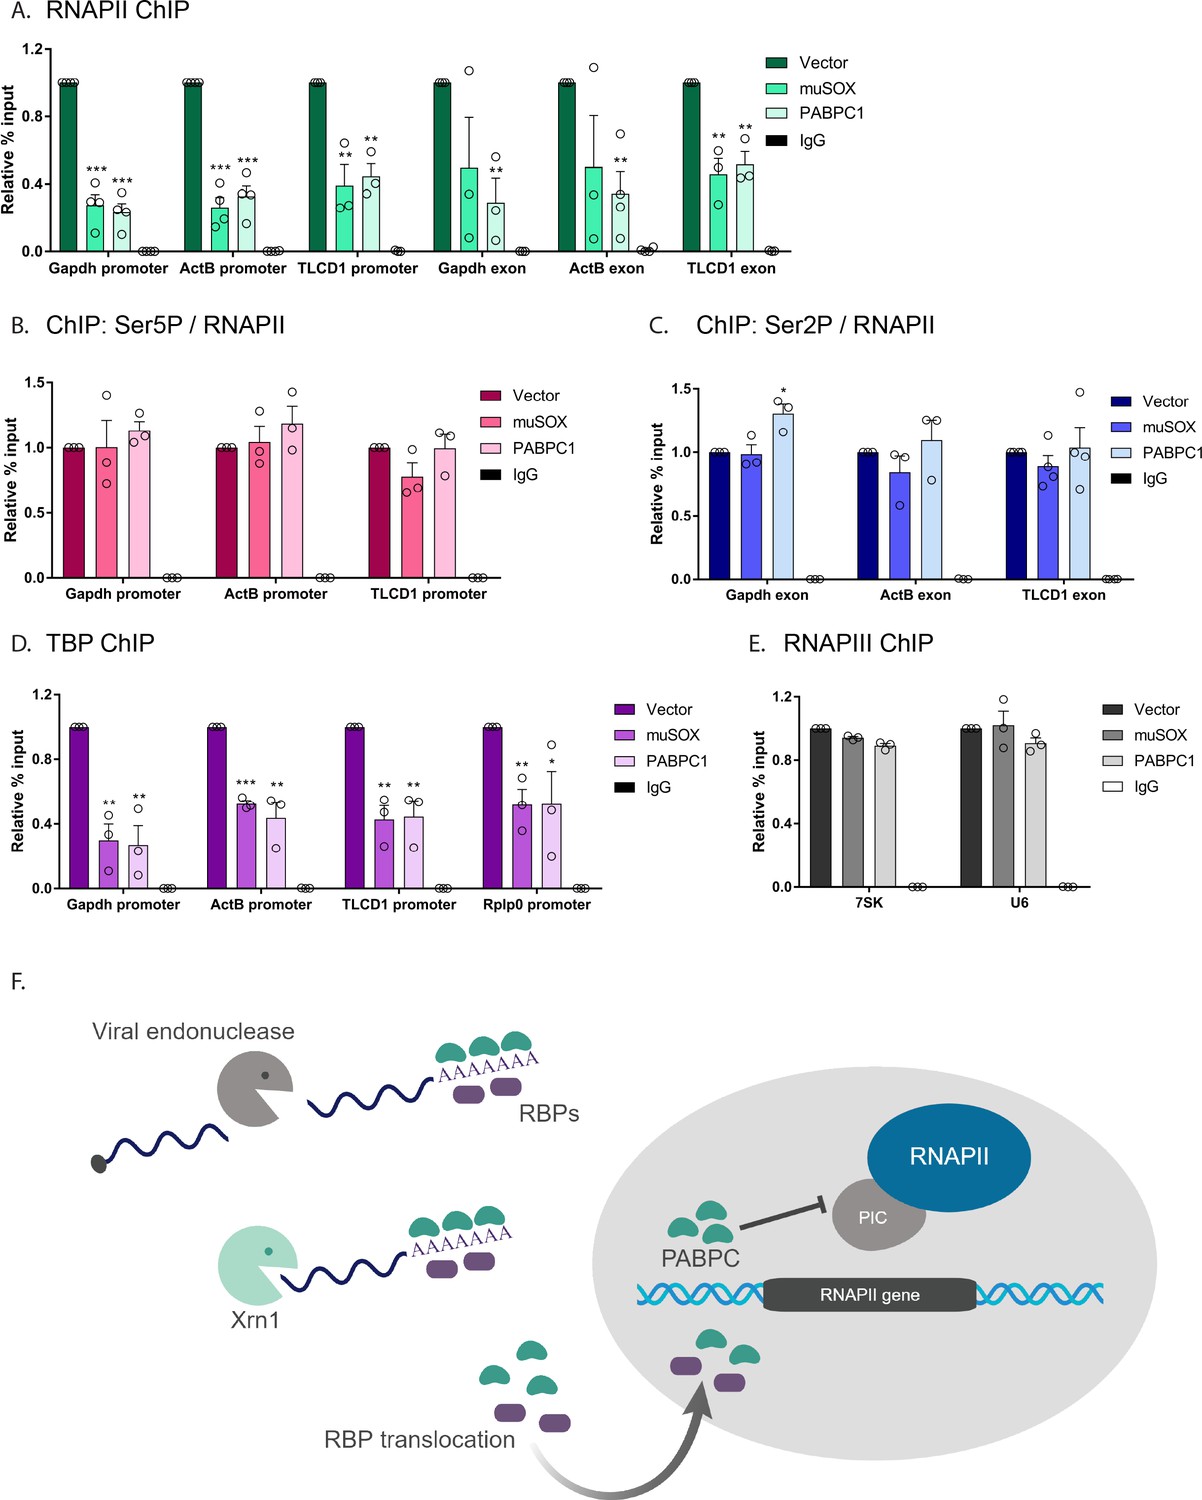
Nuclear translocation of PABPC selectively impacts early stages of transcription.
(A) HEK293T cells transfected with empty vector, muSOX, or FLAG-PABPC1 were subjected to ChIP using antibodies to RNAPII or IgG at the indicated gene matched promoters and exons. (B) ChIP using antibodies to serine 5-phosphorylated (Ser5P) RNAPII or IgG at gene promoters. The level of Ser5P RNAPII was determined by dividing the Ser5P values over the total RNAPII values within the same region of the gene in HEK293T cells transfected with empty vector, muSOX, or FLAG-PABPC1. (C) ChIP was performed as described in (B), but using antibodies to serine 2-phosphorylated (Ser2P) RNAPII or IgG at gene exons. The level of Ser2P RNAPII was determined by dividing the Ser2P values over the total RNAPII values within the same region of the gene. (D) ChIP was performed as described in (B), but using antibodies to TATA-binding protein (TBP) or IgG at gene promoters. (E) ChIP was performed as described in (B), but using antibodies to the POLR3A subunit of RNAPIII or IgG. In each experiment, chromatin was quantified by qPCR and all graphs display individual biological replicates as dots, with the mean and SEM. Statistical significance was determined using Student’s t test *p<0.05 **p<0.005 ***p<0.0005. (F) Model summarizing the impact of SOX and Xrn1-driven mRNA degradation on RBP trafficking and RNAPII transcription. See text for details.
Figure 6—figure supplement 1
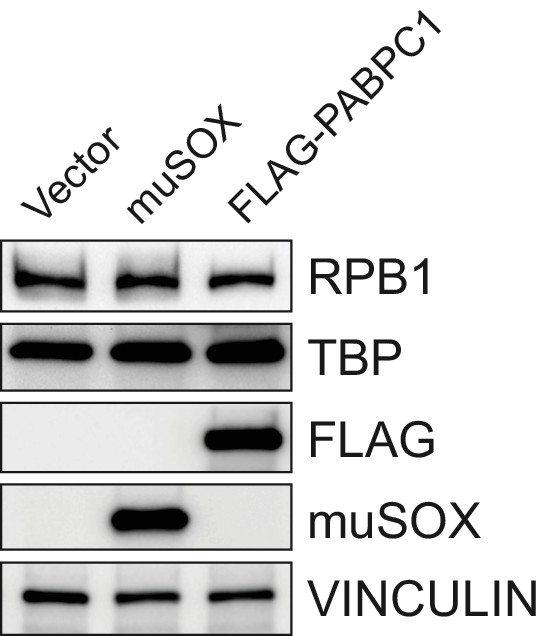
RNAPII Rpb1 and TBP protein levels are unchanged in cells expressing muSOX or FLAG-PABPC1.
Western blot of cells expressing empty vector, muSOX, or FLAG-PABPC1, with VINCULIN serving as a loading control.
Tables
Key resources table
| Reagent type (species) or resource | Designation | Source or reference | Identifiers | Additional information |
|---|---|---|---|---|
| Strain, strain background (murine herpesvirus 68) | MHV68 | PMID: 10888635 | NCBI_refseq ID: NC_001826.2 | Koszinowski Lab |
| Strain, strain background (murine herpesvirus 68) | R443I MHV68 | PMID: 21811408 | Glaunsinger Lab | |
| Cell line (Homo sapiens) | HEK293T | American Type Culture Collection | Cat# CRL-11268; RRID: CVCL_1926 | |
| Cell line (Mus musculus) | NIH3T3 | American Type Culture Collection | Cat# CRL-1658; RRID: CVCL_0594 | |
| Transfected construct (synthesized) | Xrn1 knockout (KO) cells | This paper | HEK293T clone stably expressing Cas9 and Xrn1 single-guide RNA. | |
| Transfected construct (synthesized) | Cas9-expressing WT cells | This paper | HEK293T clone stably expressing Cas9 alone with no guide RNA. | |
| Recombinant DNA reagent | GFP-muSOX (plasmid) | This paper | Progenitors: pcDNA3-HA-muSOX ( Covarrubias et al., 2009); Gateway vector peGFP-C1 | |
| Recombinant D NA reagent | Thy1.1-muSOX (plasmid) | This paper | Progenitors: GFP-muSOX | |
| Recombinant DNA reagent | Thy1.1-muSOX D219A (plasmid) | This paper | Progenitors: Thy1.1-muSOX | |
| Recombinant DNA reagent | Thy1.1-GFP (plasmid) | This paper | Progenitors: Thy1.1-muSOX | |
| Recombinant DNA reagent | pCDEF3-FLAG-PABPC1 (plasmid) | PMID: 20823266 | Glaunsinger Lab | |
| Recombinant DNA reagent | lentiCas9-Blast (lentiviral vector) | Addgene; PMID: 25075903; PMID: 24336571 | 52962 | |
| Recombinant DNA reagent | lentiGuide-Puro (lentiviral vector) | Addgene; PMID: 25075903; PMID: 24336571 | 52963 | |
| Antibody | Mouse monoclonal anti-PABPC | Santa Cruz Biotechnologies | Clone 10 E 10; SC32318 | IFA (1:25) |
| Antibody | Rabbit polyclonal anti-LARP4 | Thermofisher | PA5-58727 | IFA (1:200); Western (1:1000) |
| Antibody | Rabbit polyclonal anti-PABPC | Cell Signaling Technology | 4992S | Western (1:1000) |
| Antibody | Rabbit polyclonal anti-PABPC4 | Bethyl | A301-466A-M | Western (1:1000) |
| Antibody | Mouse monoclonal anti-Gapdh | Abcam | Clone 6C5; ab8245 | Western (1:5000) |
| Antibody | Rabbit monoclonal anti-Histone H3 | Cell Signaling Technology | Clone D1H2; 4499S | Western (1:2000) |
| Antibody | Rabbit polyclonal anti-LYRIC | Abcam | ab124789 | Western (1:1000) |
| Antibody | Rabbit polyclonal anti-RRBP1 | Bethyl | A303-996A-T | Western (1:1000) |
| Antibody | Rabbit polyclonal anti-MSI1 | Abcam | ab52865 | Western (1:1000) |
| Antibody | Rabbit polyclonal anti-LIN28B | Abcam | ab71415 | Western (1:1000) |
| Antibody | Rabbit polyclonal anti-RPP20 | Novus Biologicals | NBP15707220 | Western (1:1000) |
| Antibody | Rabbit polyclonal anti-CHD3 | Cell Signaling Technology | 4241T | Western (1:1000) |
| Antibody | Rabbit polyclonal anti-THOC6 | Life Technologies | PA543172 | Western (1:1000) |
| Antibody | Rabbit polyclonal anti-PNN | Life Technologies | PA535053 | Western (1:1000) |
| Antibody | Rabbit polyclonal anti-EXO4 | This paper | Western (1:1000) | |
| Antibody | Rabbit polyclonal anti-NPM | Abcam | ab10530 | Western (1:1000) |
| Antibody | Rabbit polyclonal anti-TRIM32 | Abcam | ab131223 | Western (1:1000) |
| Antibody | Mouse monoclonal anti-GW182 | Abcam | Clone 4B6; ab70522 | Western (1:1000) |
| Antibody | Rabbit polyclonal anti-DDX6 | Bethyl | A300-460 | Western (1:1000) |
| Antibody | Rabbit polyclonal anti-DCP2 | Bethyl | A302-597A-M | Western (1:1000) |
| Antibody | Mouse monoclonal anti-RNAPII Rpb1 | BioLegend | 8WG16 | Western (1:2000); ChIP (10 mg) |
| Antibody | Rabbit polyclonal anti-TBP | Abcam | ab28175 | Western (1:2000); ChIP (10 mg) |
| Antibody | Rabbit polyclonal anti-RNAPII phospho S5 | Abcam | ab5131 | ChIP (10 mg) |
| Antibody | Rabbit polyclonal anti-RNAPII phospho S2 | Abcam | ab5095 | ChIP (10 mg) |
| Antibody | Rabbit polyclonal anti-POLR3A | Abcam | ab96328 | ChIP (10 mg) |
| Sequence-based reagent (H. sapiens) | siPABPC1 | PMID: 20823266 | Custom siRNA; see Table S5 for sequence | |
| Sequence-based reagent (H. sapiens) | siPABPC4 | PMID: 20823266 | Custom siRNA; see Table S5 for sequence | |
| Sequence-based reagent (H. sapiens) | siLARP4 | Dharmacon | M-016523-00-0020 | |
| Sequence-based reagent (H. sapiens) | siCHD3 | Dharmacon | M-023015-01-0020 | |
| Sequence-based reagent (H. sapiens) | siMSI1 | Dharmacon | M-011338-01-0010 | |
| Sequence-based reagent (H. sapiens) | siTRIM32 | Dharmacon | M-006950-01-0010 | |
| Commercial assay or kit | Protein G dynabeads | Thermofisher | 10004D | |
| Commercial assay or kit | Protein A dynabeads | Thermofisher | 10002D | |
| Commercial assay or kit | 10-plex TMT kit | Thermofisher | 90113 | |
| Chemical compound, drug | Alexa Fluor 594, goat anti-rabbit | Thermofisher | A-11072 | |
| Chemical compound, drug | Alexa Fluor 594, goat anti-mouse | Thermofisher | A-11020 | |
| Software, algorithm | Proteome Discoverer | Thermofisher | v2.2.0.388 |
Additional files
-
Supplementary file 1
contains the following:
- https://doi.org/10.7554/eLife.37663.015
-
Transparent reporting
- https://doi.org/10.7554/eLife.37663.016
Download links
A two-part list of links to download the article, or parts of the article, in various formats.
Downloads (link to download the article as PDF)
Open citations (links to open the citations from this article in various online reference manager services)
Cite this article (links to download the citations from this article in formats compatible with various reference manager tools)
Changes in mRNA abundance drive shuttling of RNA binding proteins, linking cytoplasmic RNA degradation to transcription
eLife 7:e37663.
https://doi.org/10.7554/eLife.37663


