Ryanodine receptor dispersion disrupts Ca2+ release in failing cardiac myocytes
- Oslo University Hospital and University of Oslo, Norway
- University of Oslo, Norway
- Simula Research Laboratory, Norway
- University of Glasgow, Great Britain
- Bjørknes College, Norway
Figures
Figure 1

dSTORM imaging enables quantification of RyR localization within Ca2+ release units (CRUs).
RyR imaging was performed with antibody labelling of isolated and fixed rat ventricular cardiomyocytes. (A). Imaging of RyRs with confocal microscopy (left panel) or Structured Illumination Microscopy (SIM, centre panel) revealed a predominantly striated pattern of RyR localization across cells, but individual CRUs could not be discerned (magnified regions in lower panels). dSTORM imaging provided markedly improved spatial resolution enabling identification of RyR clusters (scale bars = 5 µm). (B). Quantification of RyR localization was performed by fitting raw images to a 30 × 30 nm grid (Baddeley et al., 2009), and performing thresholding to create binary images; an RyR was counted as present if > half the area of a 30 nm square was suprathreshold. CRUs were defined as collections of RyR clusters with an edge-to-edge distance < 150 nm (Macquaide et al., 2015) (red boundaries) or < 100 nm (Baddeley et al., 2009; Hou et al., 2015). (Scale bar = 2 µm).
Figure 2 with 1 supplement

RyRs are dispersed in failing cardiomyocytes.
Alterations in nanoscale RyR organization were examined in cardiomyocytes from rats with post-infarction heart failure (HF). Representative images show that macroscale organization of RyRs was similar in HF and Sham-operated controls (A), upper panels). However, nanoscale examination revealed that RyR clusters were broken apart in HF. For the magnified regions in (A), conversion from raw dSTORM to binary images is shown in the middle and lower panels (saturation levels indicated by high-low look-up table). Mean measurements showed fewer RyRs per cluster in failing cells, with an increased fraction of small clusters (B). Dispersion of RyR clusters into smaller fragments resulted in an increased overall number of clusters (D), reduced inter-cluster distances (E) and inclusion of more clusters in each CRU (F). Overall CRU composition became less solid in failing cells ((G), assessed by convex-hull analysis), as the average CRU contained fewer RyRs (C). See Figure 2—source data 1 for analysis of 100 nm vs 150 nm CRU inclusion criterion (ncells = 46, 50 in Sham, HF; *=P < 0.05 vs Sham).
-
Figure 2—source data 1
Quantification of RyR organization using 150 vs 100 nm CRU inclusion criteria.
RyR cluster and CRU data were compared in Sham and HF myocytes, with data cumulated across cells or animals. Two CRU definitions were also compared, with maximum edge-to-edge distances of 150 nm or 100 nm. Significant differences within data cumulated across cells were determined by t-test, while data cumulated across animals were tested with linear mixed effects models (Lindstrom and Bates, 1988).
- https://doi.org/10.7554/eLife.39427.006
Figure 2—figure supplement 1
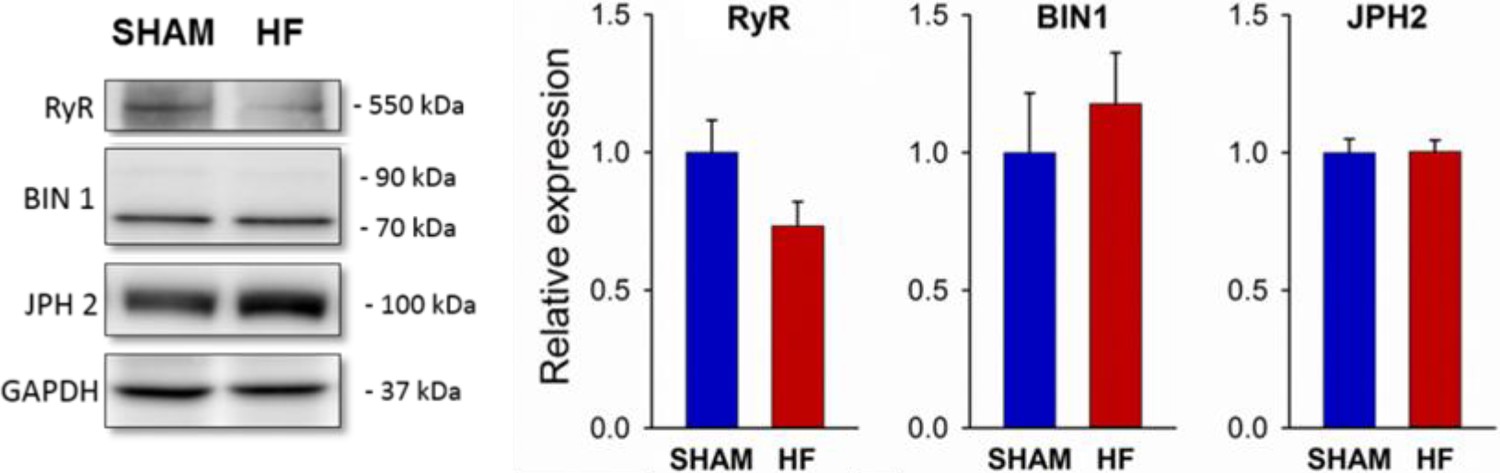
HF in post-infarction rats is not associated with altered expression of RyR, BIN1, or Junctophilin-2.
Western blotting was performed on homogenates of left ventricles from post-MI HF rats and Sham-operated controls. Representative immunoblots are shown at left, with mean values at right, normalized to Sham. (JPH2 = junctophilin 2; nhearts = 5, five5 in Sham, HF; P = NS).
Figure 3
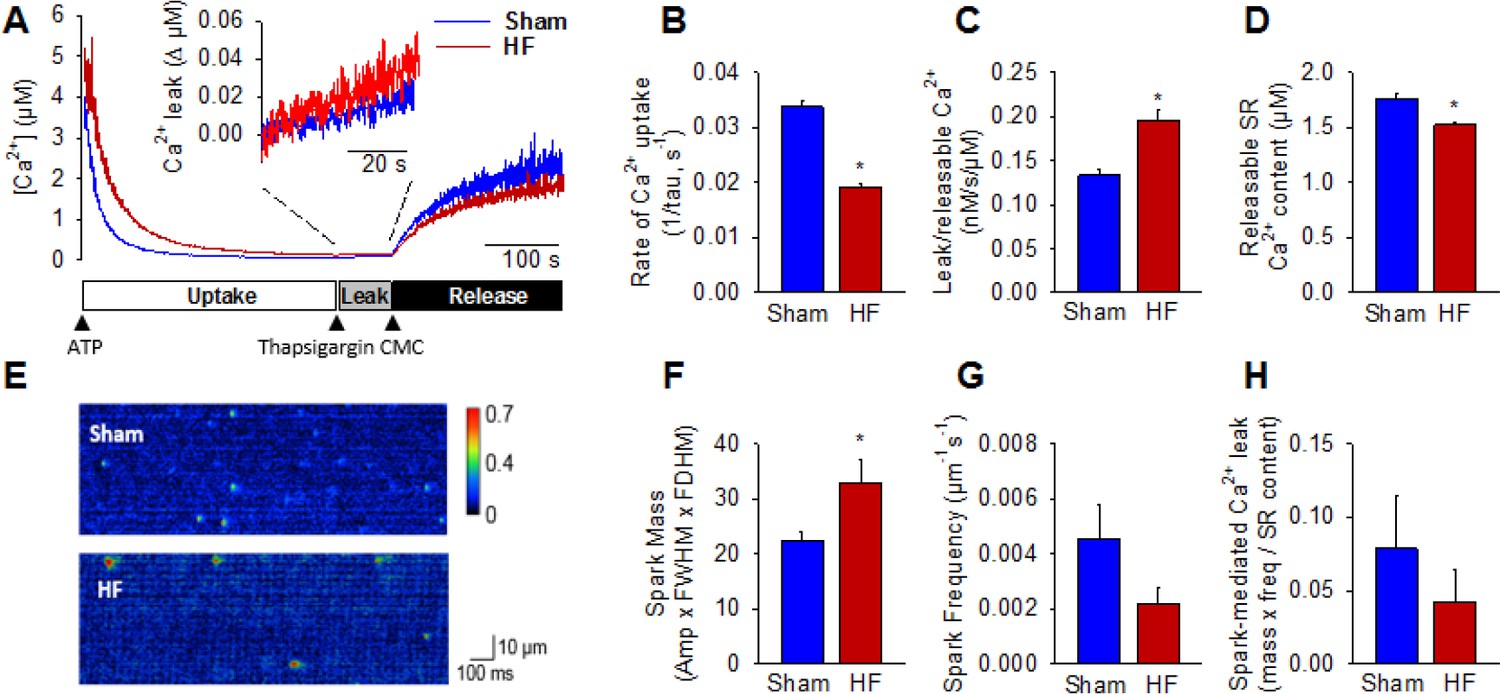
Failing cardiomyocytes exhibit increased ‘silent’ RyR leak.
Total RyR-mediated Ca2+ leak was assessed in SR microsomes using fura-2 fluorescence (A). Vesicular Ca2+ uptake was initiated by addition of ATP, and halted by addition of thapsigargin. SR Ca2+ leak was estimated as the thapsigargin-induced rate of rise of [Ca2+], normalized to releasable SR content (rise in [Ca2+] induced by the RyR opener 4-chloro-m-cresol, CMC). While the rate of SR Ca2+ uptake was reduced in HF relative to Sham (B), total RyR leak was increased (C) even with a slight reduction in the releasable Ca2+ store (D). (n = 8 from 3 Sham hearts, 7 from 3 HF hearts; *=P < 0.05 vs Sham). To assess whether elevated SR leak in failing cells could be attributed to Ca2+ sparks, line-scan confocal imaging of resting cardiomyocytes was employed (E). Ca2+ spark mass was increased in HF relative to Sham (F), due to augmented spark geometry (Figure 5B). However, since spark frequency tended to be reduced (G), overall Ca2+ spark-mediated leak was similar in Sham and HF (H). These results are consistent with increased ‘silent’ non-spark-mediated SR leak in HF cardiomyocytes. (FWHM = full width at half maximum, FDHM = full duration at half maximum; ncells = 43 in Sham, 50 in HF; *=P < 0.05 vs Sham).
Figure 4 with 1 supplement
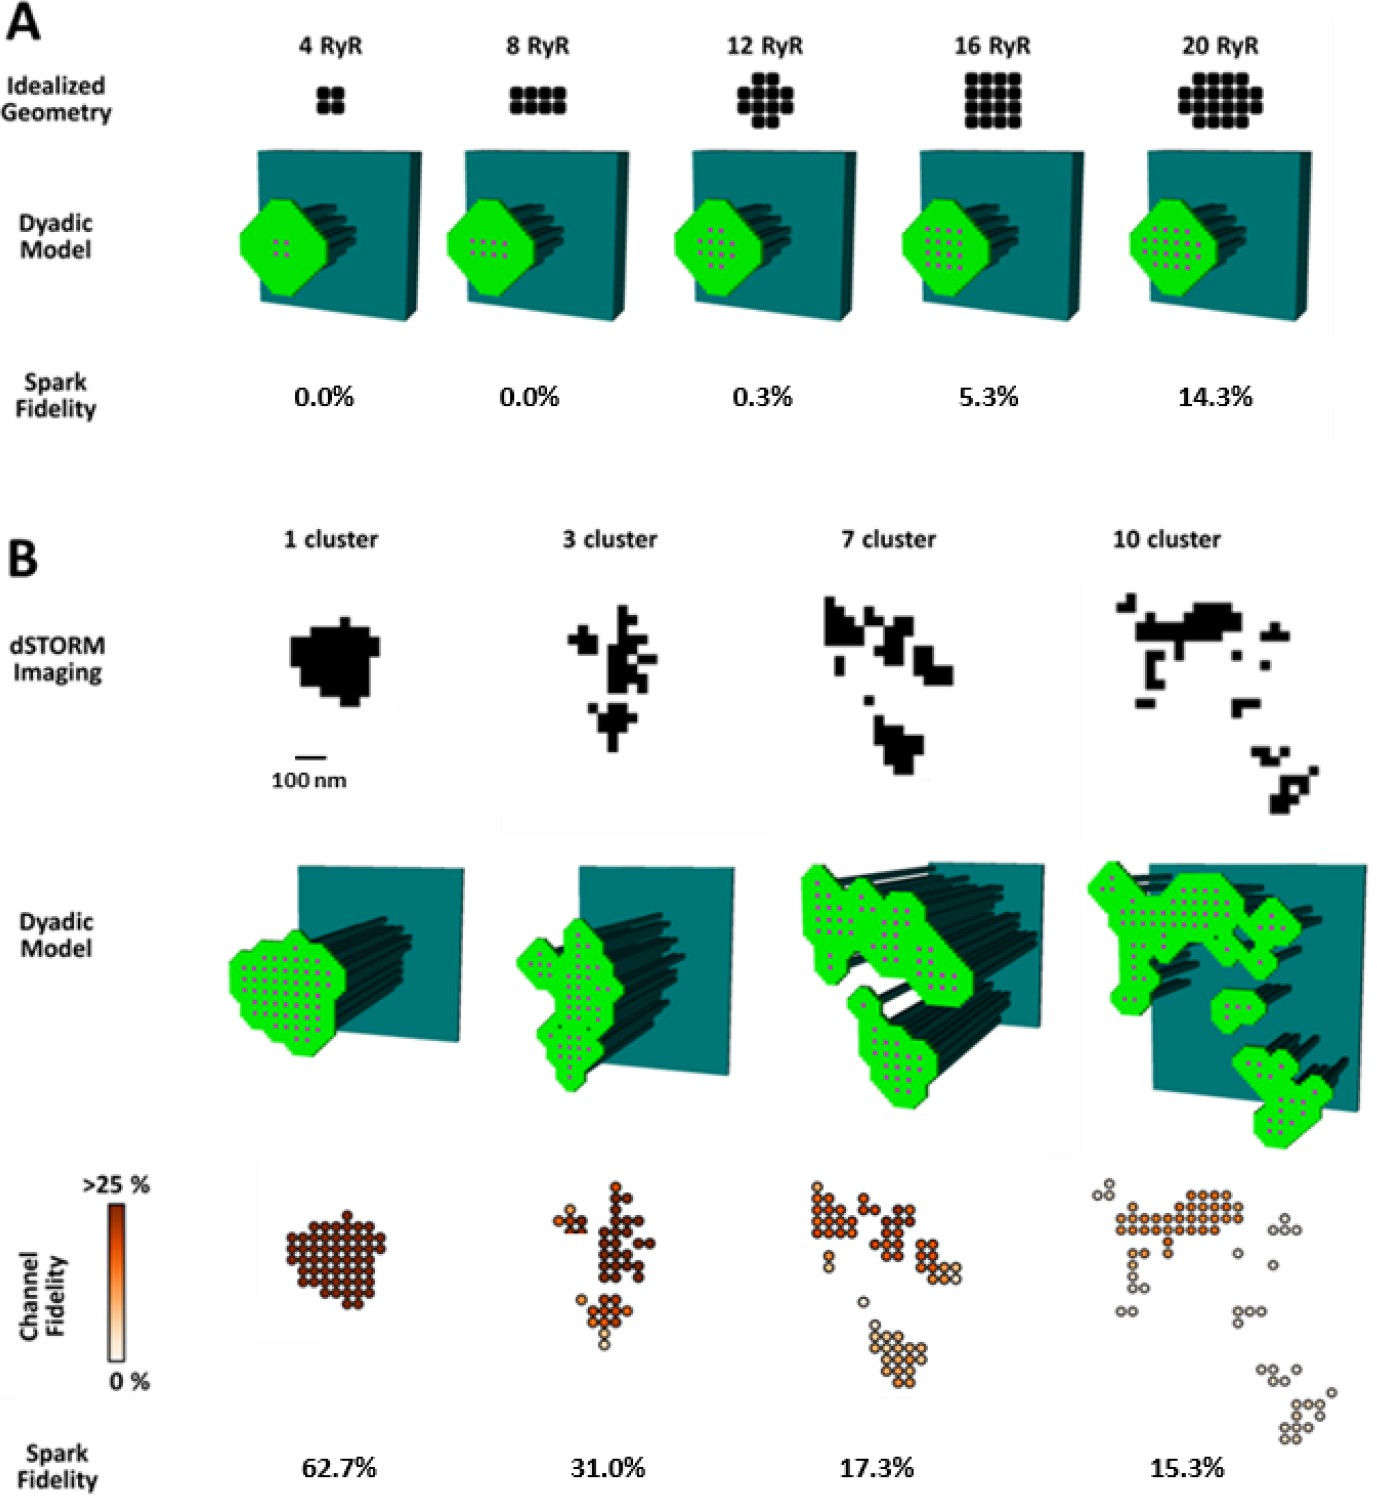
CRU dispersion provides the structural basis for silent RyR leak in HF.
A mathematical model of the dyad was employed to examine the effects of CRU dispersion on Ca2+ sparks and non-spark mediated RyR leak. (A). As dSTORM imaging indicated an increased fraction of small CRUs in HF (Figure 2C), small idealized CRUs were initially modelled with as few as 4 RyRs. Simulated Ca2+ sparks (300 consecutive simulations) were never detected for the smallest CRUs, based on an experimentally determined spark detection threshold of ΔF/F0 = 0.4. Higher probability of visible spark generation (fidelity) was observed for larger CRUs. (B). Real CRU geometries obtained by dSTORM imaging were employed to simulate sparks from larger dyads. Four configurations were modelled with varying numbers of constituent RyR clusters, but similar total RyR number (≈55). While the single-cluster CRU exhibited high Ca2+ spark fidelity, lower probability of spark generation was observed in dispersed, multi-cluster CRUs (fidelity indicated by colour scale). These data support that CRU rearrangement during HF promotes silent RyR leak, due to an increased fraction of both small CRUs as well as larger CRUs with dispersed, irregular configurations.
-
Figure 4—source data 1
Morphological characteristics for the 4 dSTORM-generated geometries.
- https://doi.org/10.7554/eLife.39427.010
Figure 4—figure supplement 1
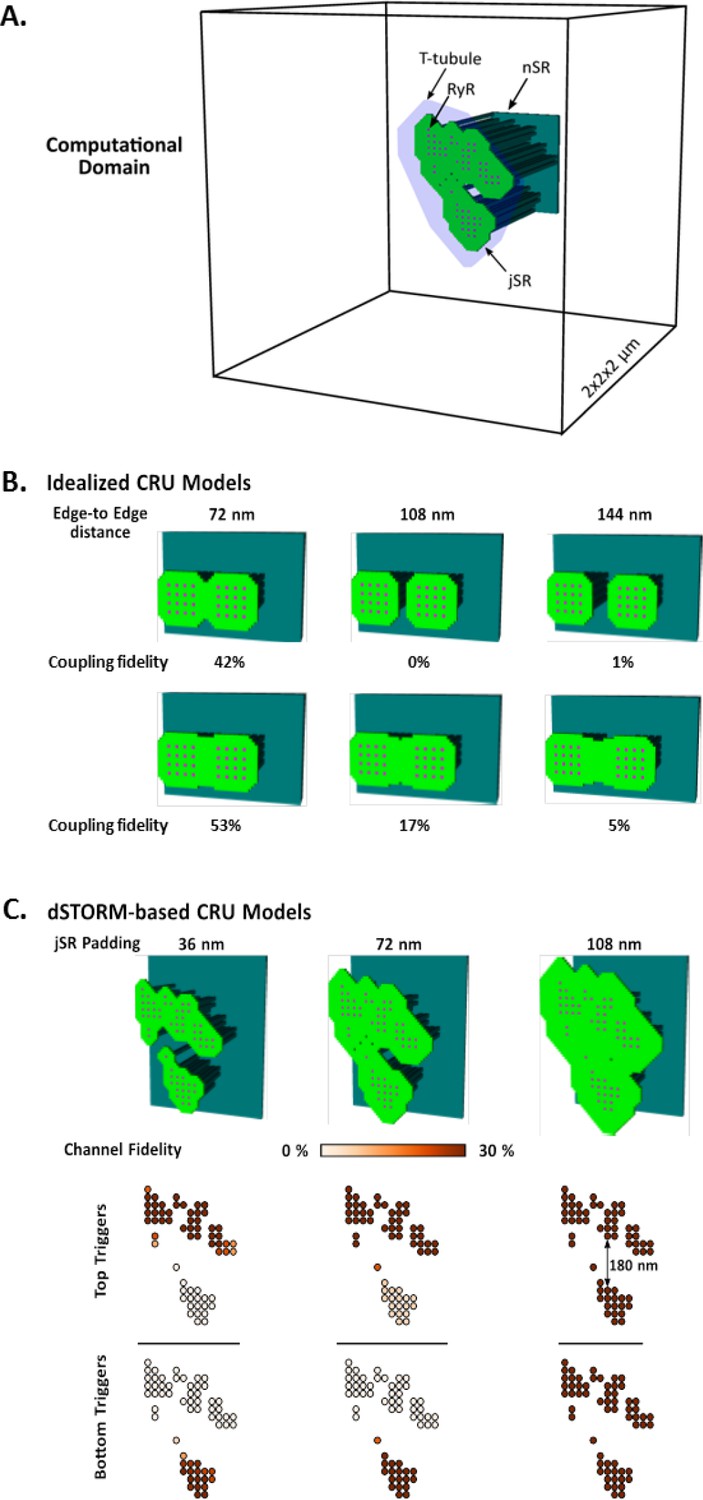
Development and characterization of the mathematical dyadic model.
(A) Graphical representation of the computational domain of the model. The junctional SR (jSR) was shaped to encompass idealized RyR geometries or dSTORM-based CRU contours. (B) To understand the role of the jSR geometry in determining the maximum inter-cluster distance permissive of functional coupling, and thus CRU definition, we spread two square 16-RyR clusters at variable distances up to 144 nm edge-to-edge (i.e. 4 RyR lengths). Coupling could occur at distances up to ~ 150 nm but only when the jSR was contiguous between clusters. (C) Similar effects could be observed in the realistic 7-cluster geometry, where a fully contiguous jSR was sufficient to functionally couple clusters at distances between 100 and 150 nm.
Figure 5

Ca2+ spark kinetics are slowed in HF.
(A) Representative line-scan images of Ca2+ sparks in Sham and HF, selected from the cell-wide scans presented in Figure 3E. Temporal profiles (right panels) show that spark kinetics were generally tightly constrained in Sham, with low values for both time to peak (TTP) and duration (full duration at half maximum, FDHM). Although many sparks were also brief in HF cells, a subset of sparks exhibited slowed kinetics. (B) Distributions of measurements for TTP and FDHM were right-shifted in HF, and mean values were significantly increased. Spark magnitudes tended to be larger in HF than Sham. (nsparks = 130, 100 from 75, 72 cells in Sham, HF; *=P < 0.05 vs Sham).
Figure 6 with 1 supplement
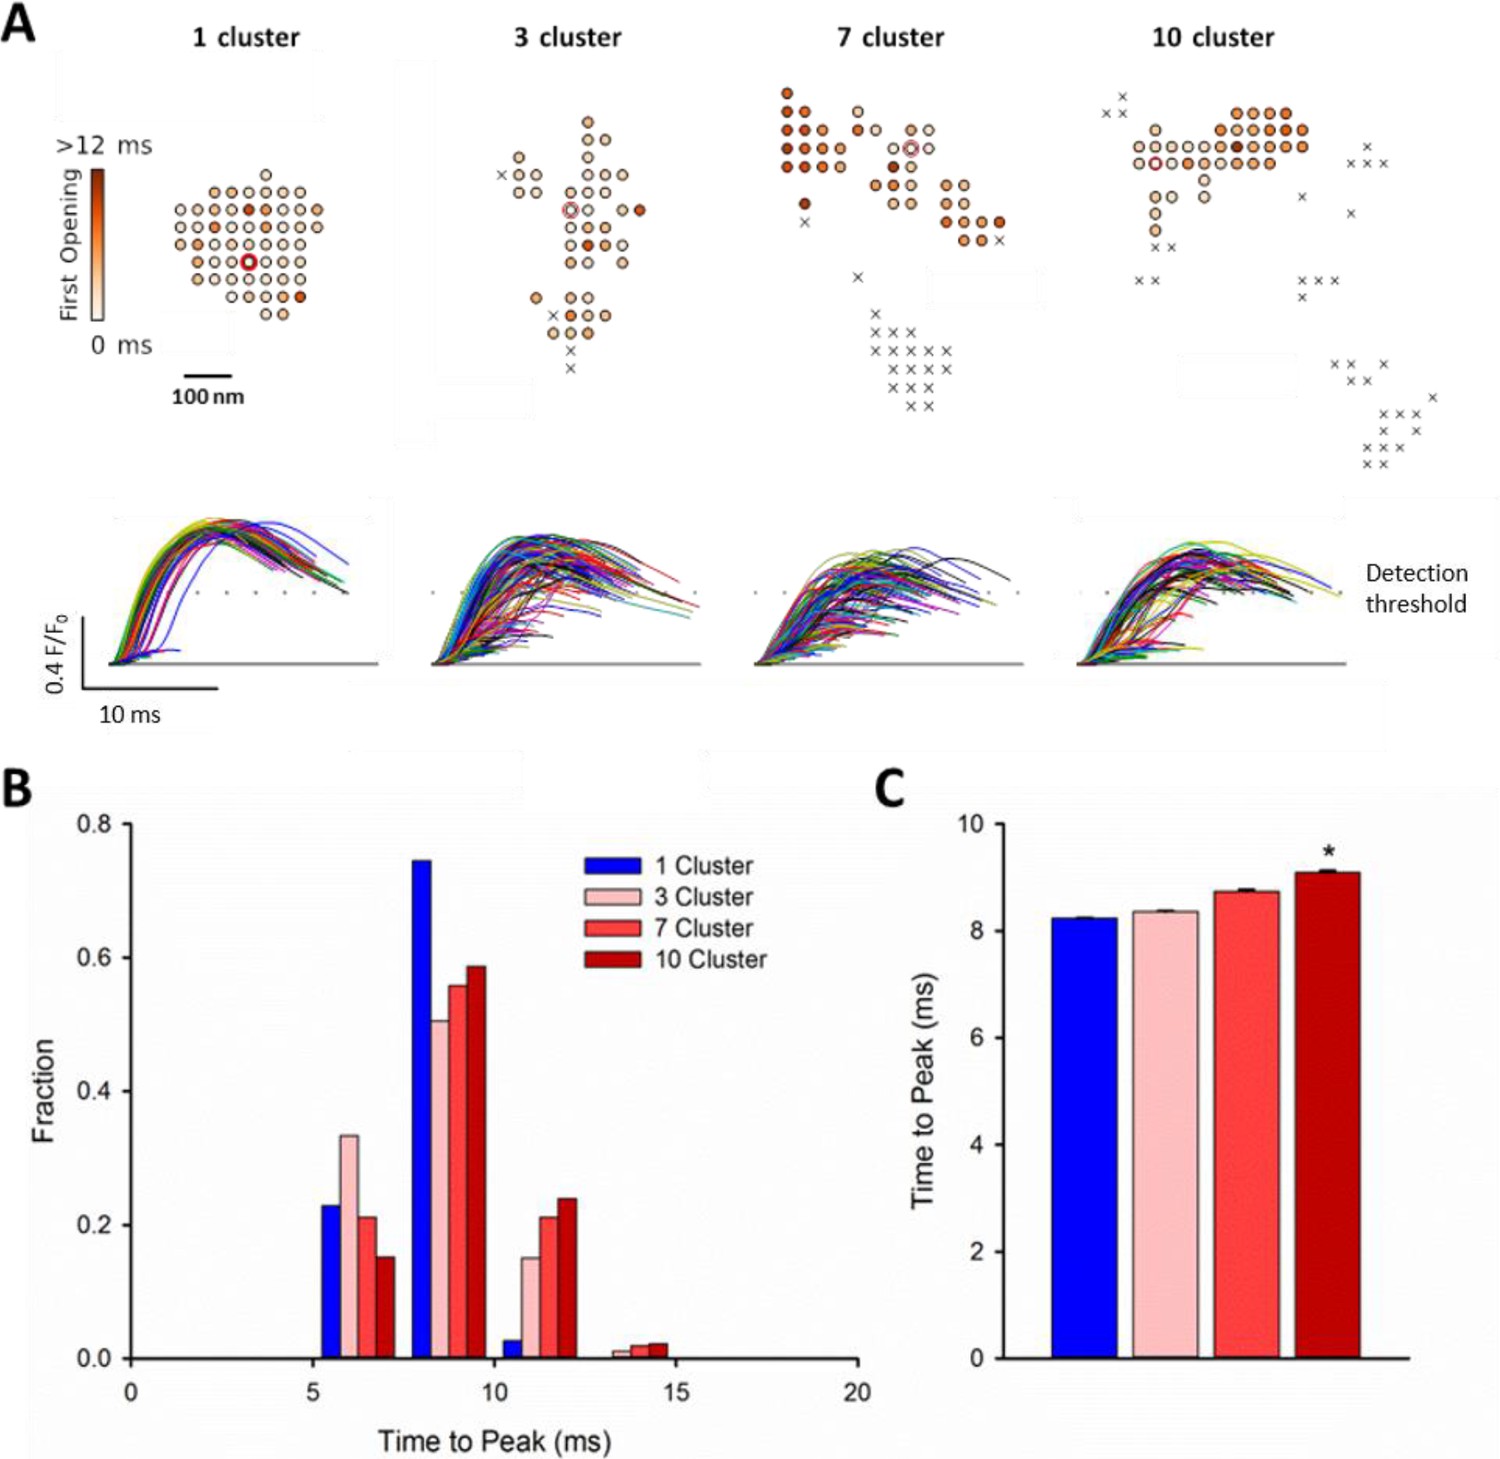
RyR dispersion during HF results in slowing of Ca2+ sparks.
To examine whether altered CRU morphology could slow Ca2+ spark kinetics in HF, spark profiles were simulated for a variety of dSTORM-derived RyR configurations. (A) Sparks were triggered by opening a single RyR (circled) which was randomly placed in consecutive simulations (example RyR opening trajectories are shown in the upper panels, with a family of spark time-courses illustrated below). Time to opening was registered for each RyR in the CRU, and the resultant time course of the Ca2+ spark was plotted until the final RyR closure, at which point the simulation was stopped for computational efficiency. Opening times were similar for individual RyRs within a solid, single cluster CRU, and the overall temporal profile of elicited sparks showed rapid kinetics which were rather consistent between consecutive simulations. By contrast, delayed and variable opening times were observed for individual RyRs in multi-cluster CRUs. This resulted in variable and slowed Ca2+ spark kinetics with these CRU configurations, as indicated by temporal spark profiles (A), a right-shifted distribution of time-to-peak measurements (B) and mean data (C). (*=P < 0.05 vs single-cluster CRU).
-
Figure 6—source data 1
CRU size has little effect on Ca2+spark characteristics in the reported range.
Clusters smaller than 15 – 20 RyR exhibit early spark termination due to stochastic attrition, whereas larger clusters are more capable of supporting regenerative release, for which spark termination becomes relatively consistent in time and dependent on depletion of the releasable Ca2+ store. The simulations were started with all RyRs in the open state and allowed to proceed stochastically. For each RyR number, 50 simulations were performed. The plot shows the mean time from the start of the simulation until all RyRs close. Error bars are standard deviations.
- https://doi.org/10.7554/eLife.39427.014
Figure 6—figure supplement 1
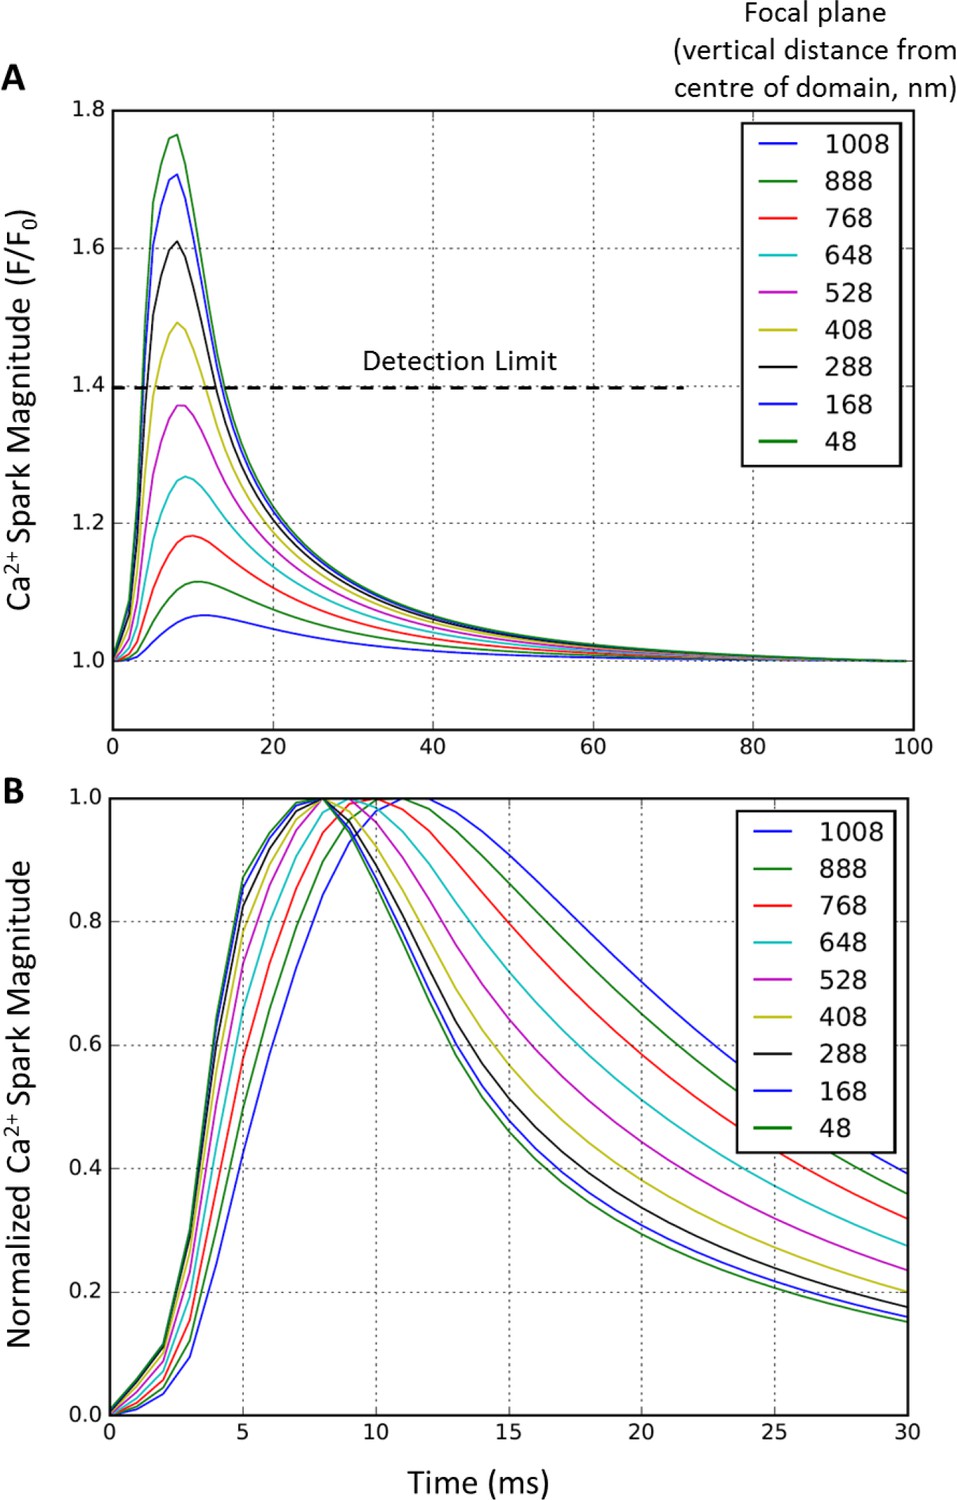
Effect of focal plane on Ca2+ spark detection and kinetics.
To examine whether out-of-focus Ca2+ release events could artefactually alter assessment of Ca2+ spark parameters, simulated Ca2+ release profiles were compared in ‘linescans’ collected at various depths of the 2 × 2 µm computational domain (54 RyR single cluster model). Vertical, stepwise displacement from the central plane resulted in a rapid decrease in measured spark amplitude (A). Indeed, events > 0.5 µm displaced from the focal plan were undetectable. While displacement of the focal plane also slowed apparent Ca2+ spark kinetics, such effects were negligible within the range where sparks were detectable (B).
Figure 7 with 1 supplement
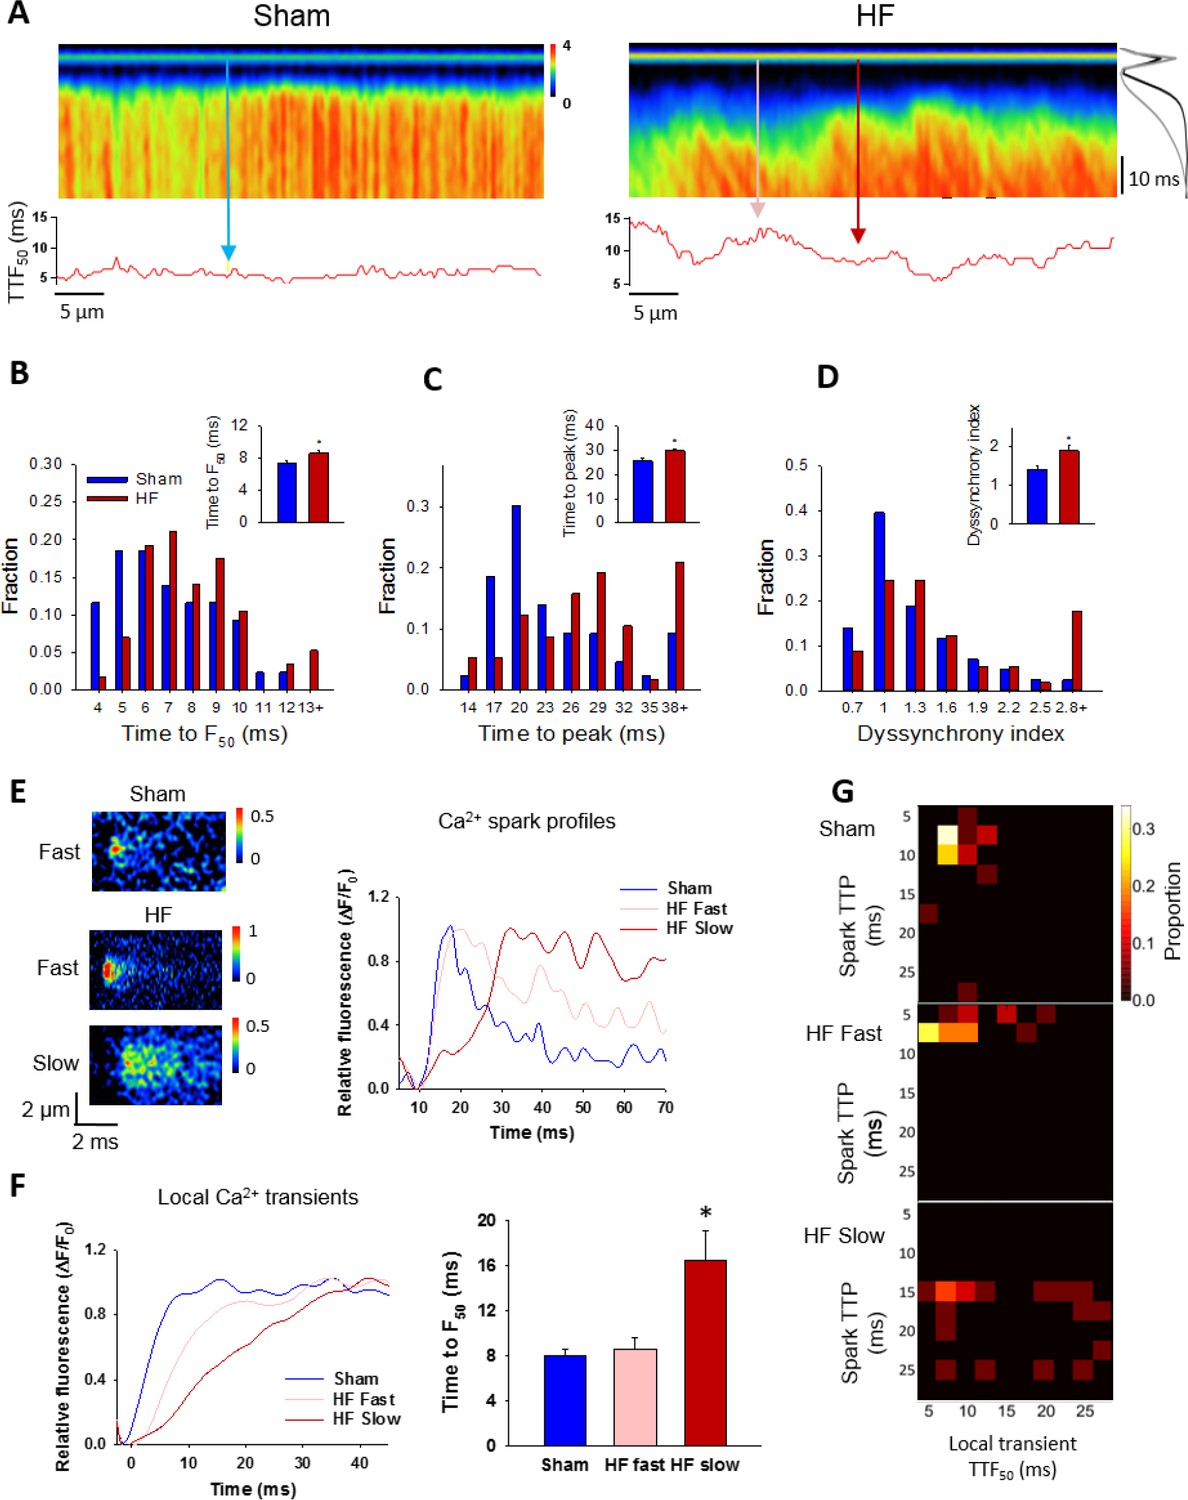
Slow Ca2+ sparks promote slow, desynchronized Ca2+ transients in HF.
(A) Representative confocal linescan images of Ca2+ transients in field-stimulated cells (stimulus illustrated as a horizontal line). The overall Ca2+ transient was slowed in HF compared to Sham, as indicated by plots of spatially-averaged Ca2+ transients (A), right panel), and measurements of half rise time (TTF50, (B)) and time to peak (C). Slowed Ca2+ transient kinetics included de-synchronization of Ca2+ release across HF cells, as indicated by profiles of local TTF50 (lower panels in A). The standard deviation of these values, defined as the dyssynchrony index, (Louch et al., 2006) showed a right-shifted distribution in HF compared to Sham (D). To examine the relationship between slowed Ca2+ spark kinetics and de-synchronized Ca2+ transients in HF, local Ca2+ transients were examined within 2 µm regions of the linescan centered at the location of recorded sparks. Paired representative recordings of sparks and local Ca2+ transients are shown in (E and F), respectively, corresponding to indicated positions in A) (vertical arrows). Local Ca2+ release at ‘slow’ spark locations (rise time > 13 ms) was protracted during the action potential, in comparison with local transients with ‘fast’ sparks in both HF and Sham (F). This association is demonstrated by clustering of locations with slow Ca2+ spark and local transient kinetics in ‘heat maps’ (G), and links slowing of Ca2+ release kinetics at the level of the single CRU and whole cell. (Ca2+ transients: ncells = 43 in Sham, 57 in HF; nfast sparks= 18 in Sham, 19 in HF; nslow sparks= 18 in HF; *=P < 0.05 vs Sham).
Figure 7—figure supplement 1
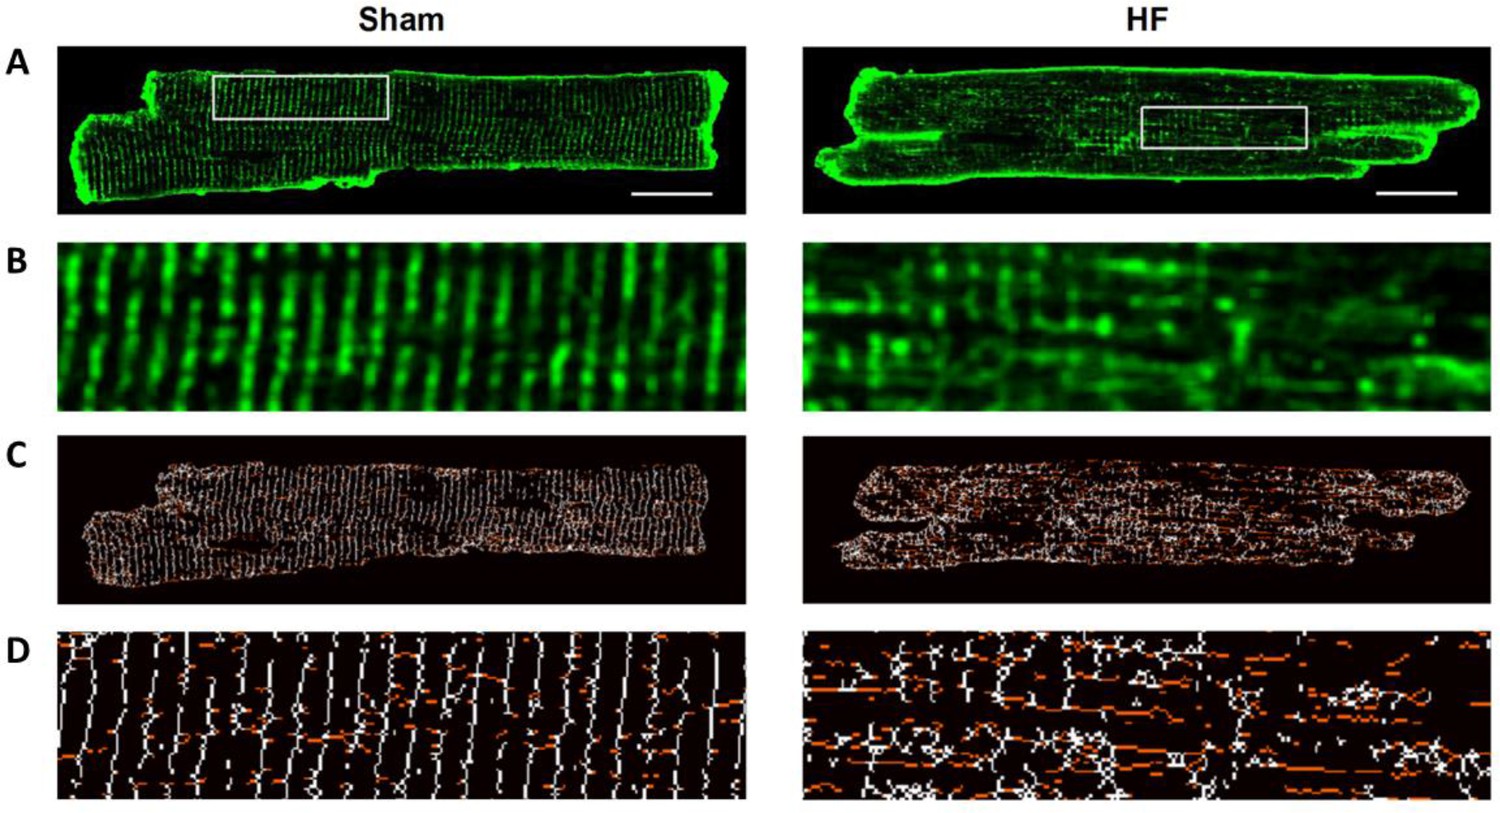
T-tubule structure is disrupted during HF.
Isolated cardiomyocytes were stained with di-8-ANEPPS and examined by confocal microscopy (A) zoomed regions enlarged in (B). In agreement with previous work employing the same post-infarction rat model (Frisk et al., 2016), we observed marked remodeling of t-tubular structure in HF. Skeletonized images (C, D) indicate that this reorganization included a loss of transverse t-tubule elements (colored white) and the appearance of additional longitudinal tubules running in the axial, perpendicular orientation (colored red). Scale bar = 5 µm.
Tables
Key resources table
| Reagent type (species) or resource | Designation | Source or reference | Identifiers | Additional information |
|---|---|---|---|---|
| Strain, strain background (Rattus norvegicus, M) | Male Wistar- Hannover rats | Janvier-labs | RjHan: WI; RGD: 13792727 | |
| Antibody | Mouse-anti-RyR2 primary antibody | ThermoFischer Scientific | Cat# MA3-916; RRID:AB_2183054 | IHC, 1:100; WB, 1:1000 |
| Antibody | Alexa Fluo 647 conjugated goat-anti-mouse secondary Ab | Molecular Probes/Invitrogen | Cat# A-21237; RRID:AB_2535806 | IHC, 1:200 |
| Antibody | Anti-goat IgG-HRP linked whole antibody | R and D Systems | Cat# HAF109; RRID:AB_357236 | WB, 1:3000 |
| Antibody | Mouse IgG HRP linked Whole Ab | GE Healthcare | Cat# NA931V; RRID:AB_772210 | WB, 1:3000 |
| Antibody | Rabbit IgG HRP linked Whole Ab | GE Healthcare | Cat# NA934V; RRID: AB_772206 | WB, 1:3000 |
| aAntibody | Goat Anti-GAPDH Polyclonal antibody | Santa Cruz Biotechnology | Cat# sc-20357; RRID:AB_641107 | WB, 1:500 |
| Antibody | Goat Anti- Junctophilin-2 Polyclonal Antibody | Santa Cruz Biotechnology | Cat# sc-51313; RRID:AB_2296391 | WB, 1:1000 |
| Antibody | BIN1 (Amphiphysin II (2F11) Antibody) | Santa Cruz Biotechnology | Cat# sc-23918; RRID:AB_667901 | WB, 1:500 |
| Software, algorithm | Dense Stochastic Sampling Imaging (DSSI) algorithm | SoftWoRx, GE Healthcare | ||
| Software, algorithm | dSTORM image post-processing algorithm | PMID: 26490742 | Described in the Github repository (Kolstad, 2018; copy archived at https://github.com/elifesciences-publications/Ryanodine_Receptor_Dispersion_during_Heart_Failure) | |
| Software, algorithm | Mathematical Model | PMID: 22495592; PMID: 23708355; this paper | Described in the Github repository (Kolstad, 2018; copy archived at https://github.com/elifesciences-publications/Ryanodine_Receptor_Dispersion_during_Heart_Failure) | |
| Software, algorithm | SigmaPlot | SigmaPlot | RRID:SCR_003210 |
Additional files
-
Supplementary file 1
Buffer Parameters
- https://doi.org/10.7554/eLife.39427.017
-
Supplementary file 2
RyR Rates
- https://doi.org/10.7554/eLife.39427.018
-
Transparent reporting form
- https://doi.org/10.7554/eLife.39427.019
Download links
A two-part list of links to download the article, or parts of the article, in various formats.
Downloads (link to download the article as PDF)
Open citations (links to open the citations from this article in various online reference manager services)
Cite this article (links to download the citations from this article in formats compatible with various reference manager tools)
Ryanodine receptor dispersion disrupts Ca2+ release in failing cardiac myocytes
eLife 7:e39427.
https://doi.org/10.7554/eLife.39427


