KChIP3 coupled to Ca2+ oscillations exerts a tonic brake on baseline mucin release in the colon
- The Barcelona Institute of Science and Technology, Spain
- Pompeu Fabra University, Spain
- Spanish Network for Biomedical Research in Neurodegenerative Diseases, Spain
- National Biotechnology Center, Spain
- Universitat Pompeu Fabra, Spain
- Institució Catalana de Recerca i Estudis Avançats, Spain
Figures
Figure 1 with 2 supplements

KChIP3 levels regulate baseline MUC5AC secretion.
(A) KChIP3 RNA levels from undifferentiated (UD) and differentiated (DF) HT29-18N2 cells normalized by GAPDH values. (B) Control (black circles) and KChIP3 stable knockdown cells (KChIP3-KD) (blue squares) were differentiated and incubated for 30 min at 37°C in the absence or presence of 100 µM ATP. Secreted MUC5AC was collected and dot blotted with an anti-MUC5AC antibody. Data were normalized to actin levels. The y-axis represents normalized values relative to the values of untreated control cells. (C) ATP-dependent MUC5AC secretion was calculated from the data in (B) as the difference between normalized baseline secretion and stimulated secretion for each condition. (D) Secreted MUC5AC from differentiated control (black circles) and KChIP3 overexpressing cells (KChIP3-GFP) (red circles) in the absence or presence of 100 µM ATP. (E) ATP-dependent MUC5AC secretion calculated from the data in (D) for each condition. (F) Immunofluorescence Z-stack projections of control, KChIP3-KD and KChIP3-GFP differentiated HT29-18N2 cells with anti-MUC5AC antibody (green) and DAPI (red). Scale bar = 5 µm. (G) The number of MUC5AC granules for control (black circles), KChIP3-KD (blue squares) and KChIP3-GFP (red circles) cells was quantified from individual immunofluorescence stacks using 3D analysis FIJI software. The y-axis represents the number of 3-D objects detected by the software divided by the number of cells in each field. (H) Volume of control (black), KChIP3-KD (blue) and KChIP3-GFP (red) MUC5AC granules was calculated from individual immunofluorescence stacks using 3D analysis FIJI software. The y-axis represents the volume of the granules in µm3. Abbreviations: UD: Undifferentiated HT29-18N2 cells, DF: Differentiated HT29-18N2 cells. *p<0.05, **p<0.01.
Figure 1—figure supplement 1
KChIP expression levels in HT29-18N2 stable cell lines.
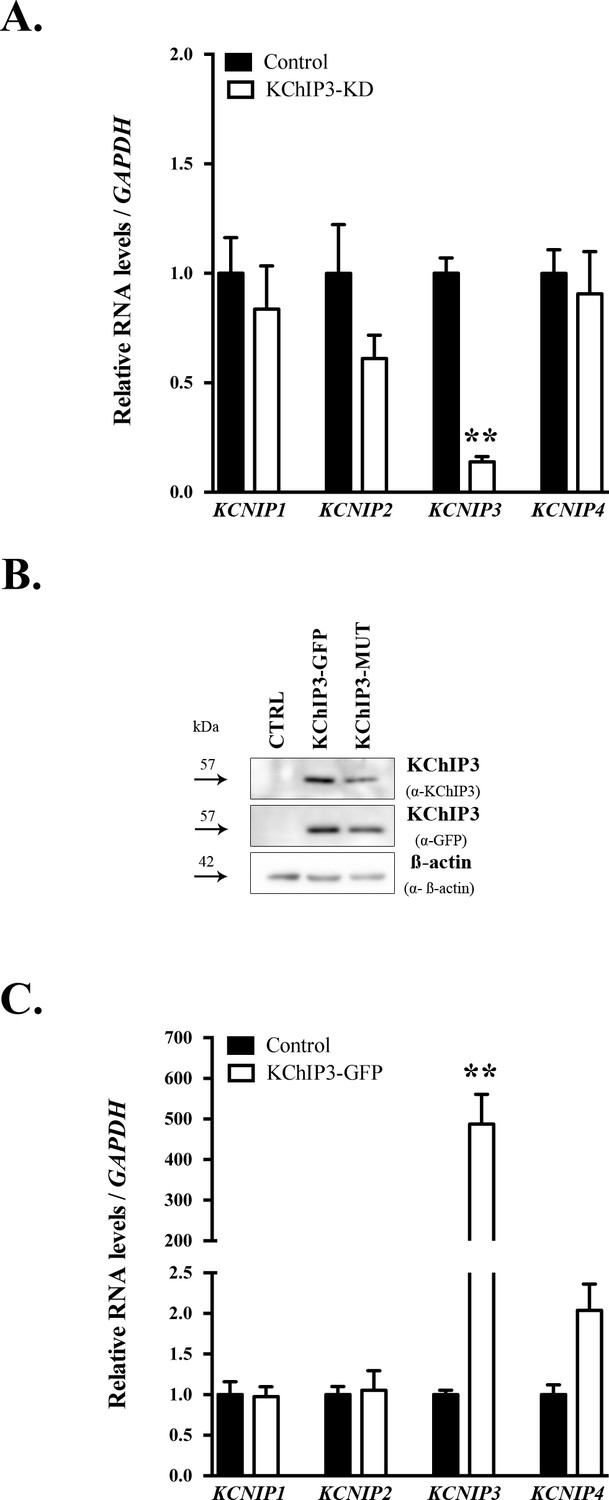
(A) KCNIP1 (KChIP1), KCNIP2 (KChIP2), KCNIP3 (KChIP3) and KCNIP4 (KChIP4) RNA levels normalized to values of GAPDH from control and KChIP3-KD cells. mRNA levels of each gene are represented as relative value compared to control cells. Results are average values ± SEM (N ≥ 3). (B) Cell lysates from control, KChIP3-GFP and KChIP3-MUT HT29-18N2 differentiated cells were analysed by western blot with an anti-KChIP3 and an anti-GFP antibody to test expression levels. Actin was used as a loading control. (C) RNA levels of KCNIP1 (KChIP1), KCNIP2 (KChIP2), KCNIP3 (KChIP3) and KCNIP4 (KChIP4) (normalized to values of the GAPDH) from control and KChIP3-GFP cells. mRNA levels of each gene are represented as relative value compared to control cells. Results are average values ± SEM (N ≥ 3). Abbreviations: CTRL: control cells. **p<0.01.
Figure 1—figure supplement 2
KChIP3 levels regulate MUC2 secretion.
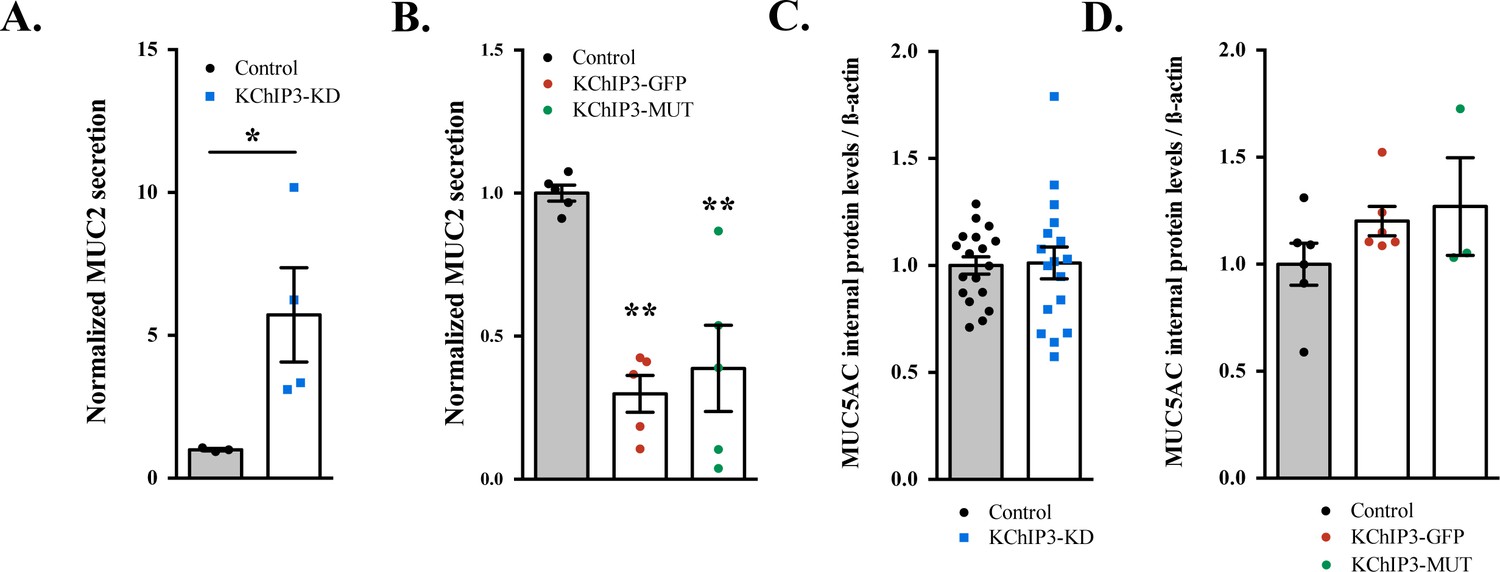
(A) Secreted MUC2 from differentiated control (black circles) and KChIP3 stable knockdown cells (KChIP3-KD) (blue squares) after 30 min incubation at 37°C in normal buffer (1.2 mM CaCl2). Data were normalized to actin levels. The y-axis represents normalized values relative to the values of untreated control cells. Average values +- SEM are plotted as scatter plot with bar graph (N = 3). (B) Secreted MUC2 from differentiated control (black circles), KChIP3-GFP overexpressing cells (KChIP3-GFP) (red circles) and KChIP3-MUT overexpressing cells (KChIP3-MUT) (green circles) after 30 min incubation at 37°C in normal buffer (1.2 mM CaCl2). Data were normalized to actin levels. The y-axis represents normalized values relative to the values of untreated control cells. Average values ± SEM are plotted as scatter plot with bar graph (N = 3). (C) MUC5AC internal protein levels in differentiated control and KChIP3-KD cells normalized to the actin levels. Average values ± SEM are plotted as scatter plot with bar graph (N = 3). (D) MUC5AC internal levels in differentiated control, KChIP3-GFP and KChIP3-MUT cells normalized to actin levels. Average values ± SEM are plotted as scatter plot with bar graph (N = 3). *p<0.05, **p<0.01.
Figure 2 with 1 supplement

Ca2+ oscillations in goblet cells control KChIP3 function.
(A) Time course of Ca2+ responses (normalized FURA-2AM ratio) obtained in differentiated HT29-18N2 cells in resting conditions exposed to different extracellular buffers: 1.2 mM CaCl2 (left), 0.5 mM EGTA (center), or 10 µM dandrolene (right) (n = 30, inset shows a recording obtained from a single cell under each condition). (B) Percentage of cells oscillating in each condition during 10 min. Average values ± SEM are plotted as scatter plot with bar graph (N > 3) (black dots: 1.2 mM CaCl2, blue dots: EGTA, red dots: dandrolene). (C) Secreted MUC5AC collected from differentiated HT29-18N2 cells that were incubated for 30 min at 37°C with different buffers: 1.2 mM CaCl2 (black dots), 0.5 mM EGTA (blue dots) or 10 µM dandrolene (red dots). The y-axis represents relative values with respect to the values of control cells. Average values ± SEM are plotted as scatter plot with bar graph (N > 3). (D) Secreted MUC5AC from differentiated control (black circles) and KChIP3 stable knockdown cells (KChIP3-KD) (blue squares) collected after 30 min incubation at 37°C in the in the presence (1.2 mM CaCl2) or absence (0.5 mM EGTA) of extracellular Ca2+. Data were normalized to intracellular actin levels. The y-axis represents normalized values relative to the values of untreated control cells. (E) Secreted MUC5AC from control (black circles) and KChIP3 stable knockdown cells (KChIP3-KD) (blue squares) that were incubated for 30 min at 37°C with vehicle or 10 µM dandrolene (DAND) in the presence of extracellular Ca2+. Data were normalized to intracellular actin levels. The y-axis represents normalized values relative to the values of untreated control cells. (F) Secreted MUC5AC from differentiated control (black circles), KChIP3-GFP (red circles) and KChIP3-MUT (green circles) cells that were incubated for 30 min at 37°C in the in the presence (1.2 mM CaCl2) or absence (0.5 mM EGTA) of extracellular Ca2+. Data were normalized to intracellular actin levels. The y-axis represents normalized values relative to the values of untreated control cells. (G) Secreted MUC5AC from differentiated control (black circles), KChIP3-GFP (red circles) and KChIP3-MUT (green circles) cells after 30 min incubation at 37°C with vehicle or 10 µM dandrolene (DAND) in the presence of extracellular Ca2+. Data were normalized to intracellular actin levels. The y-axis represents normalized values relative to the values of untreated control cells. Abbreviations: EGTA: Buffer with 0.5 mM EGTA, DAND: 10 µM Dandrolene treatment. *p<0.05, **p<0.01, n.s.: not statistically significant.
Figure 2—figure supplement 1
KChIP3 does not control Ca2+ levels.
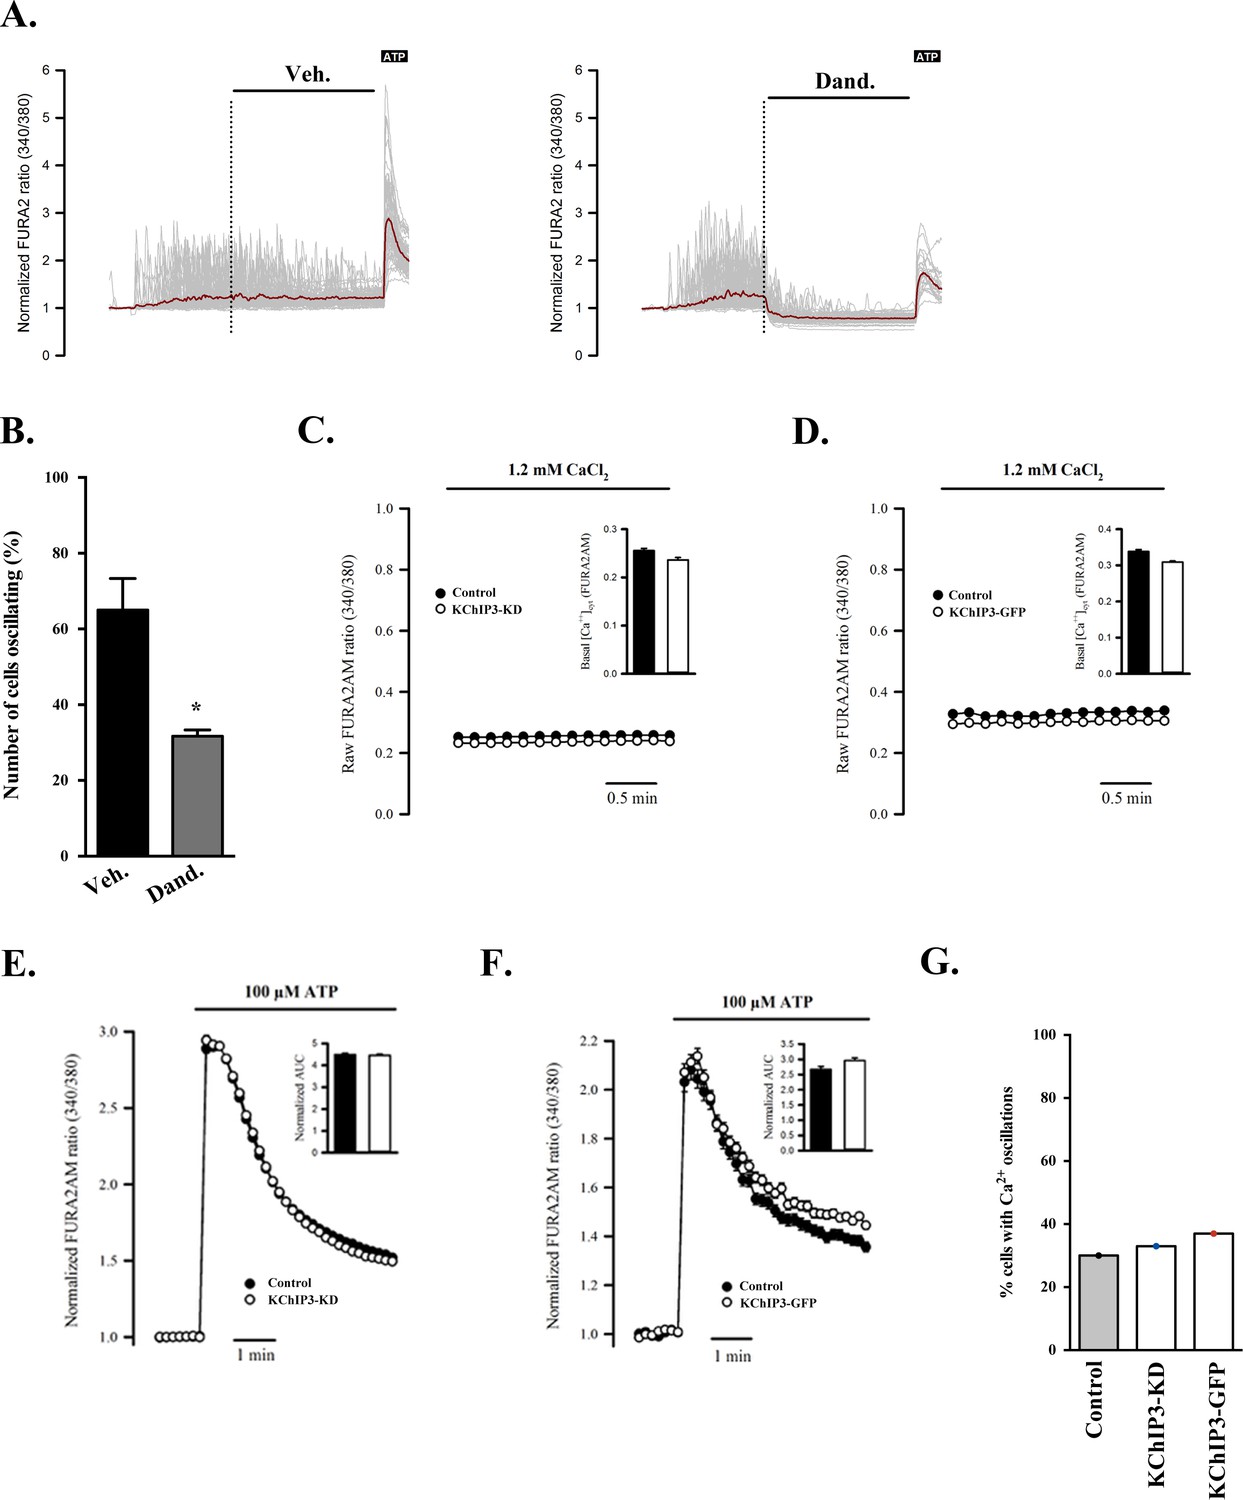
(A) Time course of Ca2+ responses (normalized FURA-2AM ratio) (in grey individual cells, in red average trace) obtained in differentiated HT29-18N2 cells in a buffer containing 0.5 mM EGTA to trigger high levels of Ca2+ oscillations. After 5 min of recording, cells were treated with vehicle (DMSO) (left) or 10 µM dandrolene (right). At minute 15, cells were stimulated with 100 µM ATP. (B) Percentage of cells oscillating in each condition presented in (A) during 10 min after starting the treatment. Results are average values ± SEM (N > 3). (C) Time course of mean basal intracellular Ca2+ levels (normalized FURA-2AM ratio) in KChIP3-KD and control cells. (D) Time course of mean basal intracellular Ca2+ levels (normalized FURA-2AM ratio) in KChIP3-GFP and control cells. (E) Time course of mean Ca2+ responses (normalized FURA-2AM ratio) obtained in differentiated control (black) and KChIP3-KD (white) cells treated with 100 µM ATP (left panel). Average AUC (Area Under the Curve) from the traces are showed as a bar graph. (F) Time course of mean Ca2+ responses (normalized FURA-2AM ratio) obtained in differentiated control (black) and KChIP3-GFP (white) cells treated with 100 µM ATP (left panel). Average AUC (Area Under the Curve) from the traces are showed as a bar graph. (G) Percentage of cells oscillating in KChIP3-KD, KChIP3-GFP and control cells during 10 min in normal buffer (1.2 mM CaCl2). Abbreviations: Veh: Vehicle (DMSO), Dand: dandrolene. *p<0.05.
Figure 3 with 1 supplement
KChIP3 localized to a pool of MUC5AC granules.
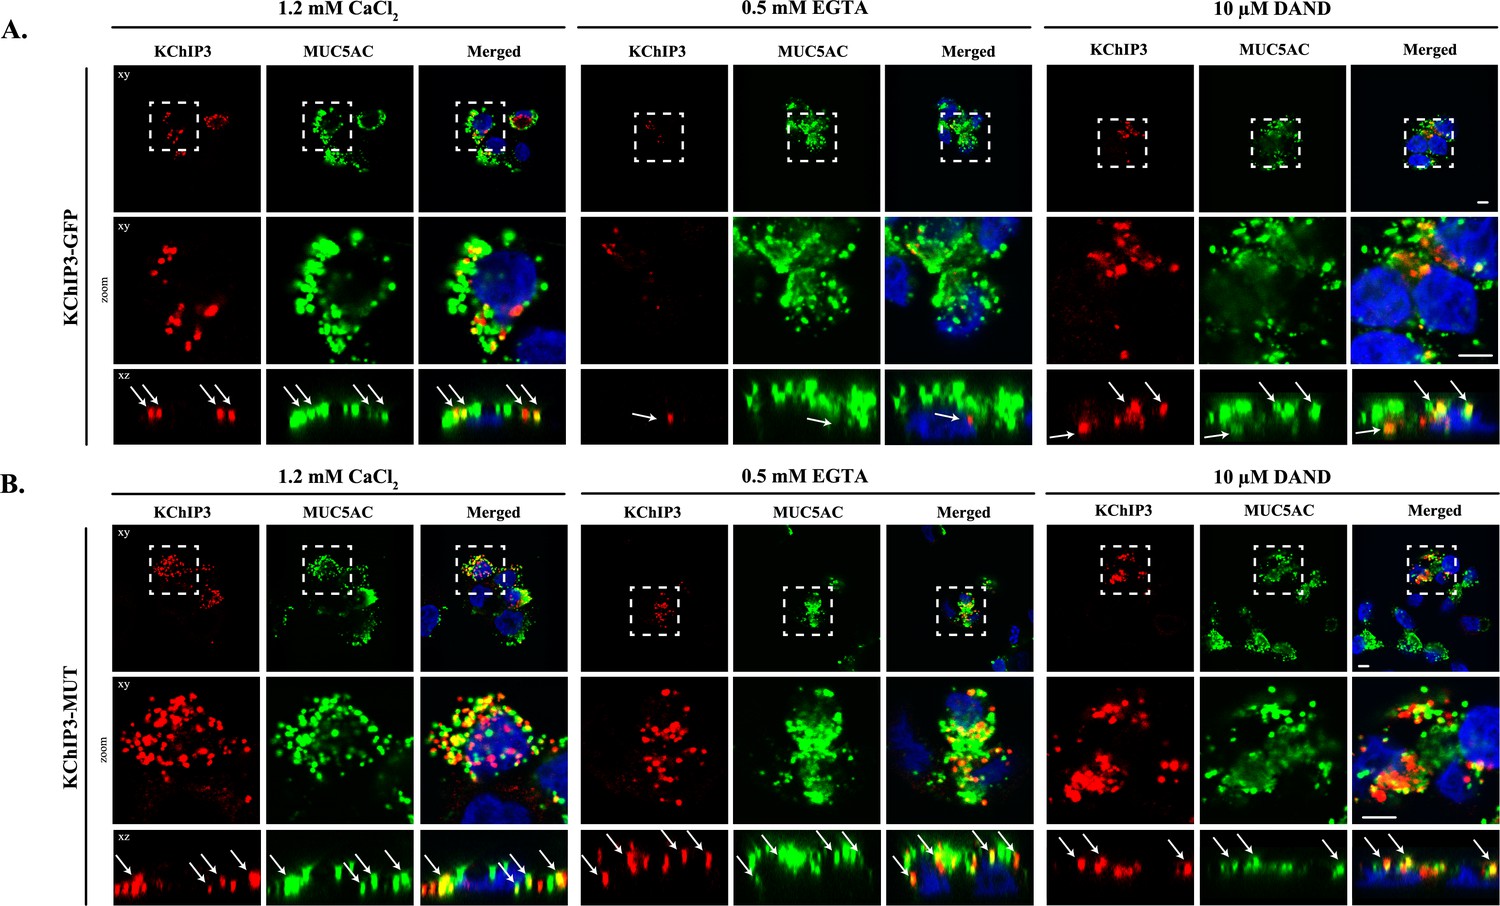
Differentiated KChIP3-GFP (A) and KChIP3-MUT (B) cells were processed for cytosolic washout after 30 min at 37°C of treatment with 1.2 mM CaCl2, 0.5 mM EGTA or 10 µM dandrolene. After fixation and permeabilization, samples were analyzed by immunofluorescence microscopy with an anti-GFP (KChIP3, red), anti-MUC5AC antibody (MUC5AC, green) and DAPI (blue). Images represent a single plane (xy), a zoom of the area within the white square and an orthogonal view of each channel (xz). Scale bar = 5 µm. White arrows point to the colocalization between KChIP3 and MUC5AC. Abbreviations: EGTA: Buffer with 0.5 mM EGTA, DAND: 10 µM dandrolene treatment.
Figure 3—figure supplement 1
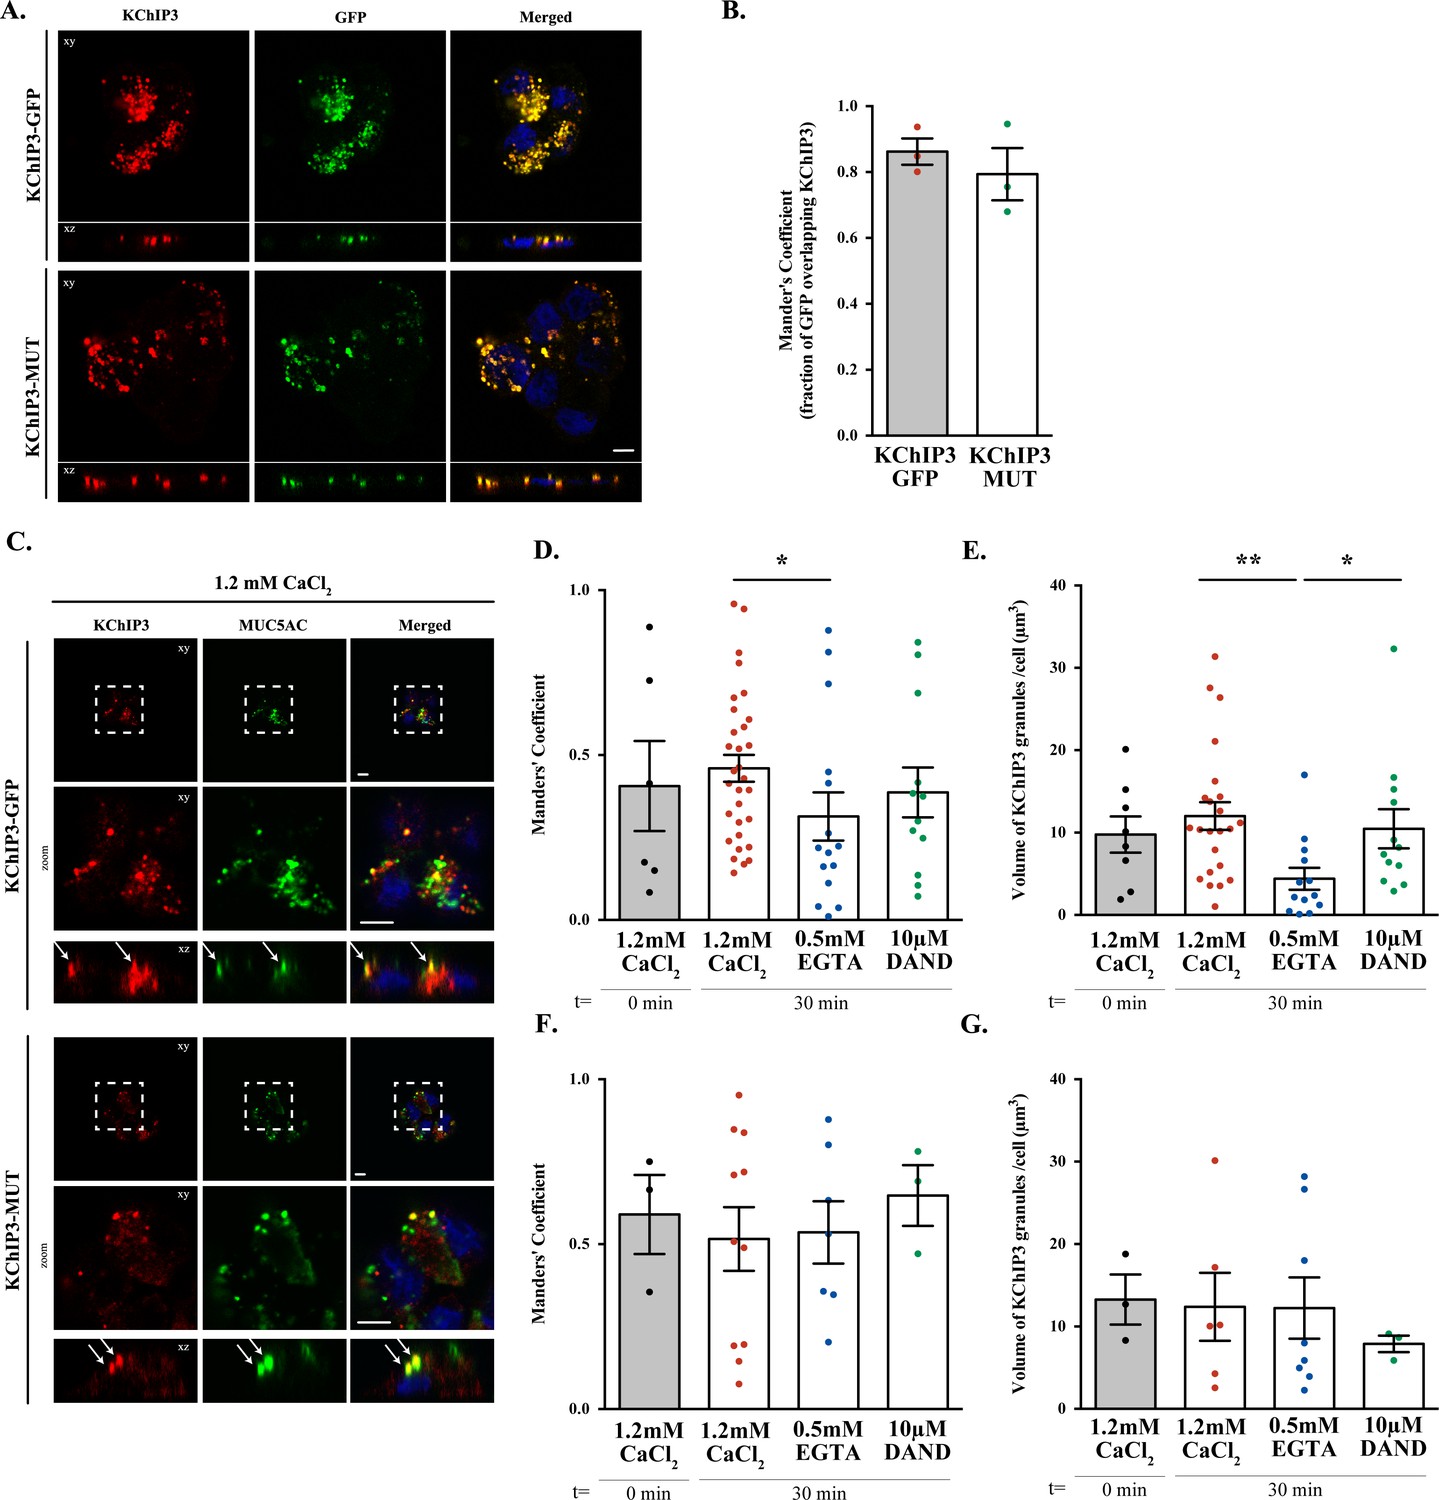
KChIP3 apical localization in HT29-18N2 goblet cells.
(A) Differentiated KChIP3-GFP and KChIP3-MUT cells were processed for cytosolic washout, fixed and permeabilized for analysis by immunofluorescence microscopy with an anti-KChIP3 (red), anti-GFP antibody (green) and DAPI (blue). Images represent a single plane (xy) and an orthogonal view of each channel (xz). Scale bar = 5 µm. (B) Colocalization between KChIP3 and GFP was calculated from immunofluorescence images by Manders’ coefficient using FIJI. Average values ± SEM are plotted as scatter plot with bar graph. The y-axis represents Manders’ coefficient of the fraction of GFP overlapping with KChIP3. (C) Differentiated KChIP3-GFP and KChIP3-MUT cells were processed for cytosolic washout at t = 0. After fixation and permeabilization, samples were analyzed by immunofluorescence microscopy with an anti-GFP (KChIP3, red), anti-MUC5AC antibody (MUC5AC, green) and DAPI (blue). Images represent a single plane (xy), a zoom of the area within the white square and an orthogonal view of each channel (xz). Scale bar = 5 µm. White arrows point to the colocalization between KChIP3 and MUC5AC. (D, F) Colocalization between KChIP3-GFP (D) or KChIP3-MUT (F) (anti-GFP) and MUC5AC at different conditions (t = 0’, t = 30’ 1.2 mM CaCl2, t = 30’ 0.5 mM EGTA, t = 30’ 10 µM DAND) was calculated from immunofluorescence images by Manders’ coefficient using FIJI. Average values ± SEM are plotted as scatter plot with bar graph. The y-axis represents Manders’ coefficient of the fraction of KChIP3 overlapping with MUC5AC. (E, G) Volume of KChIP3-GFP (E) or KChIP3-MUT (G) granules divided by the number of cells per field at different conditions (t = 0’, t = 30’ 1.2 mM CaCl2, t = 30’ 0.5 mM EGTA, t = 30’ 10 µM DAND). Volume was calculated using 3D objects counter from FIJI software. Abbreviations: EGTA: buffer with 0.5 mM EGTA, DAND: 10 µM Dandrolene treatment. *p<0.05.
Figure 4 with 1 supplement
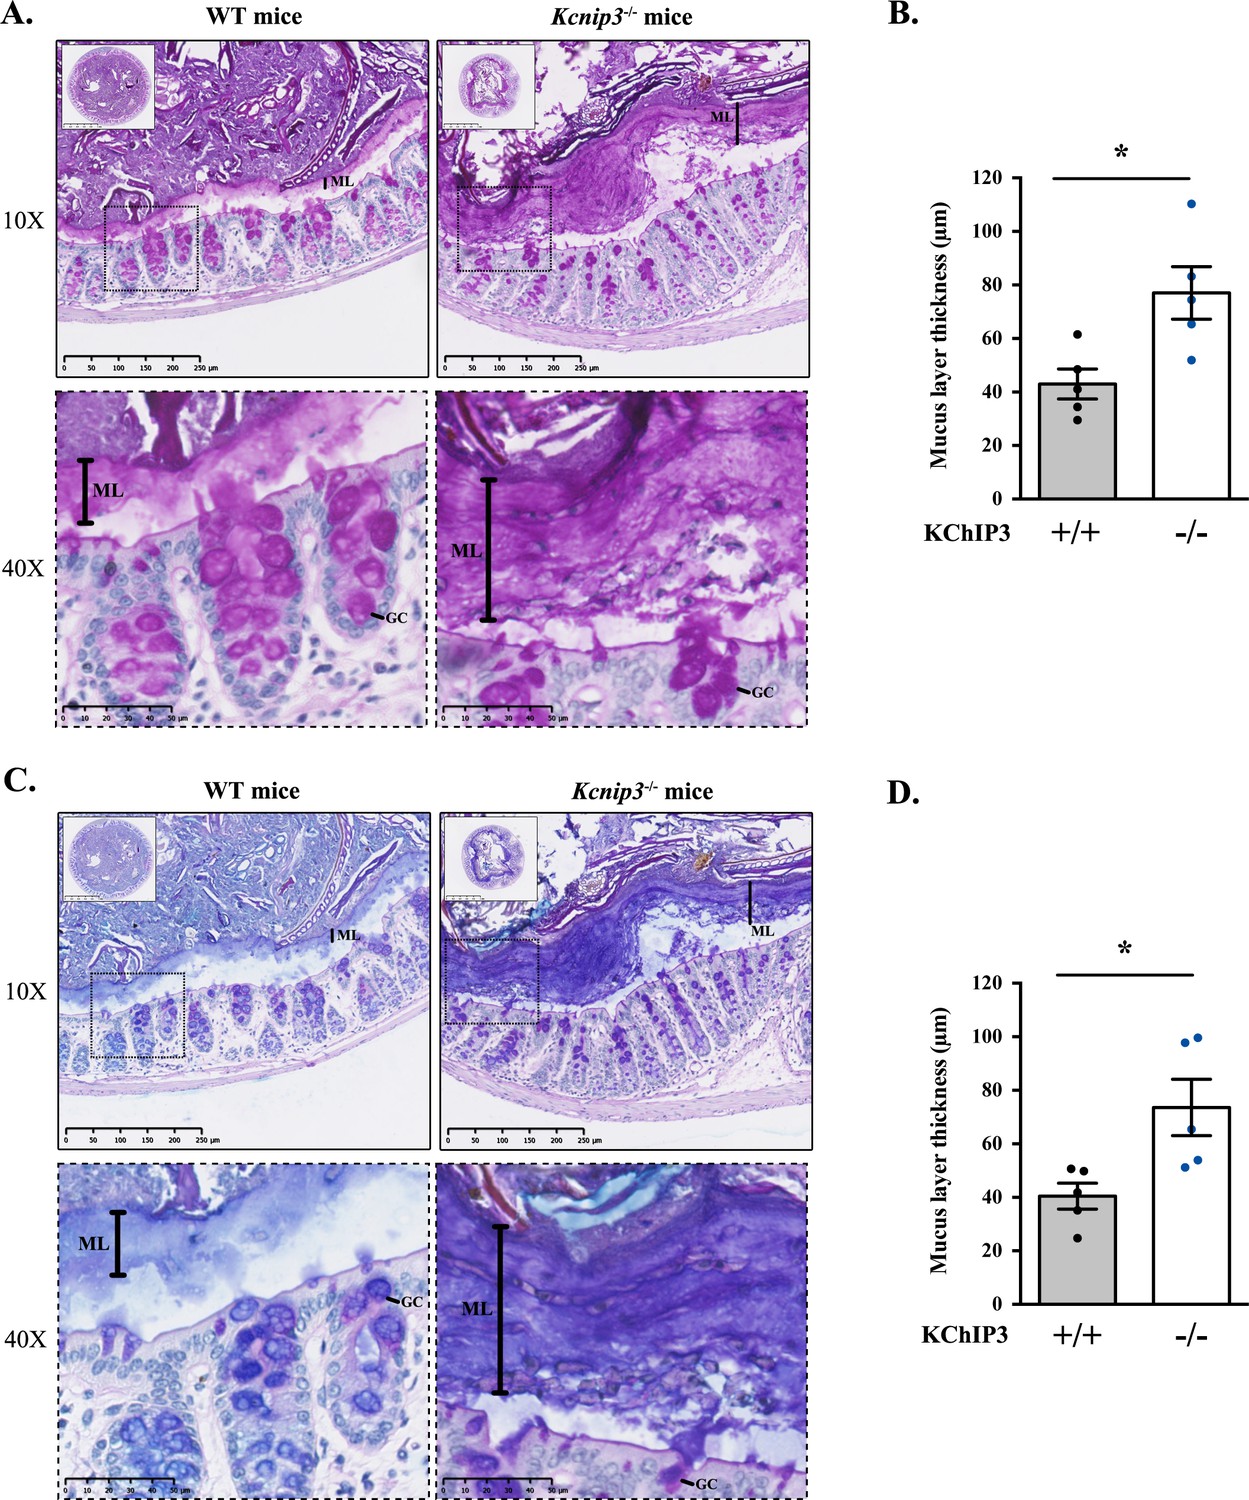
Kcnip3-/- mice show increased mucus layer thickness.
(A, C) Representative distal colons of WT (left panel) and Kcnip3-/- (right panel) mice stained with PAS (A) or PAS-AB (C) at different magnification (2.5X, 10X and 40X). (B, D) Quantification of the mucus layer thickness in the distal colon stained with PAS (B) or PAS-AB (D) of WT (black dots) and Kcnip3-/- (blue dots) mice. Average values ± SEM are plotted as scatter plot with bar graph. The y-axis represents the thickness of the mucus layer in µm. Abbreviations: +/+: WT mice, -/-: Kcnip3-/- mice, ML: Mucus layer, GC: Goblet cell. *p<0.05.
Figure 4—figure supplement 1
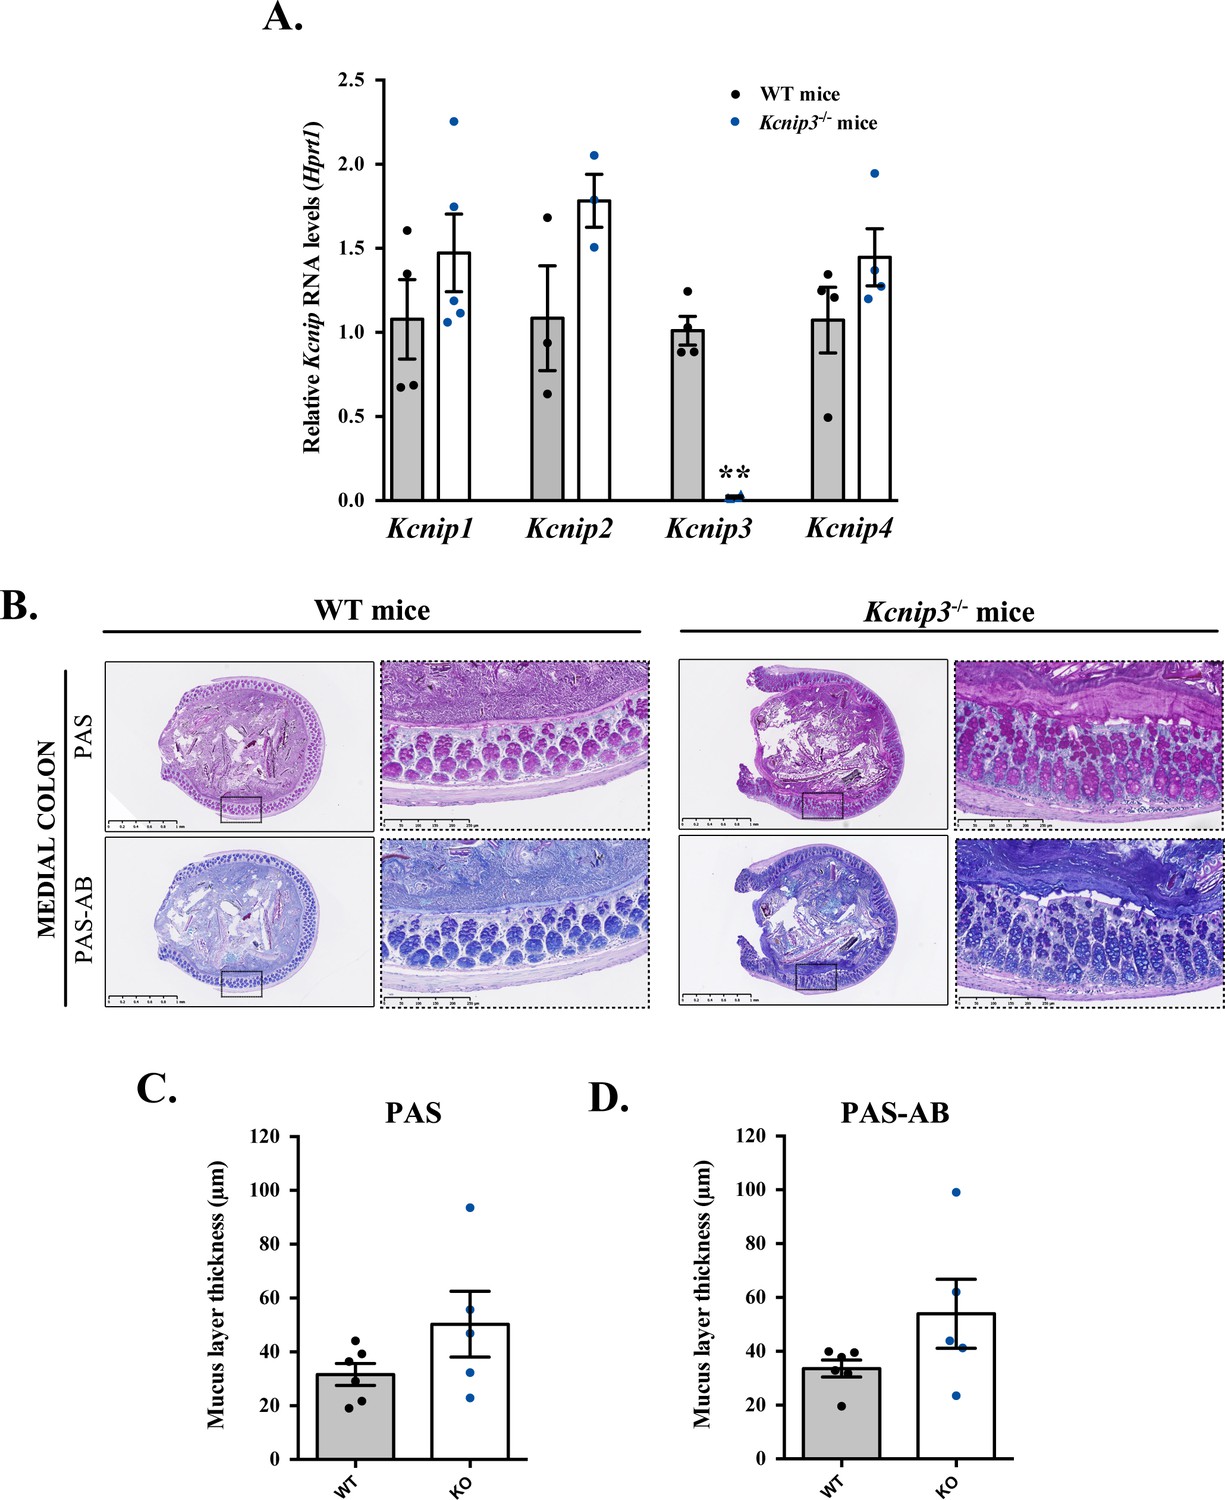
Kcnip3-/- mice show increased mucus layer at the medial colon.
(A) Kcnip1 (KChIP1), Kcnip2 (KChIP2), Kcnip3 (KChIP3) and Kcnip4 (KChIP4) RNA levels were evaluated in the colon of both Kcnip3-/- and WT mice by quantitative real-time PCR and normalized to Hprt1 levels. mRNA levels of each gene are represented as relative value compared to WT mice. Results are average values ± SEM (N ≥ 3). (B) Representative medial colons of WT (left panel) and Kcnip3-/- (right panel) mice stained with PAS or PAS-AB at different magnification (2.5X and 10X). (C,D) Quantification of the mucus layer thickness in the distal colon stained with PAS (C) or PAS-AB (D) of WT (black dots) and Kcnip3-/- (blue dots) mice. Average values ± SEM are plotted as scatter plot with bar graph. The y-axis represents the thickness of the mucus layer in µm. Abbreviations: WT: WT mice, KO: Kcnip3-/- mice.
Figure 5
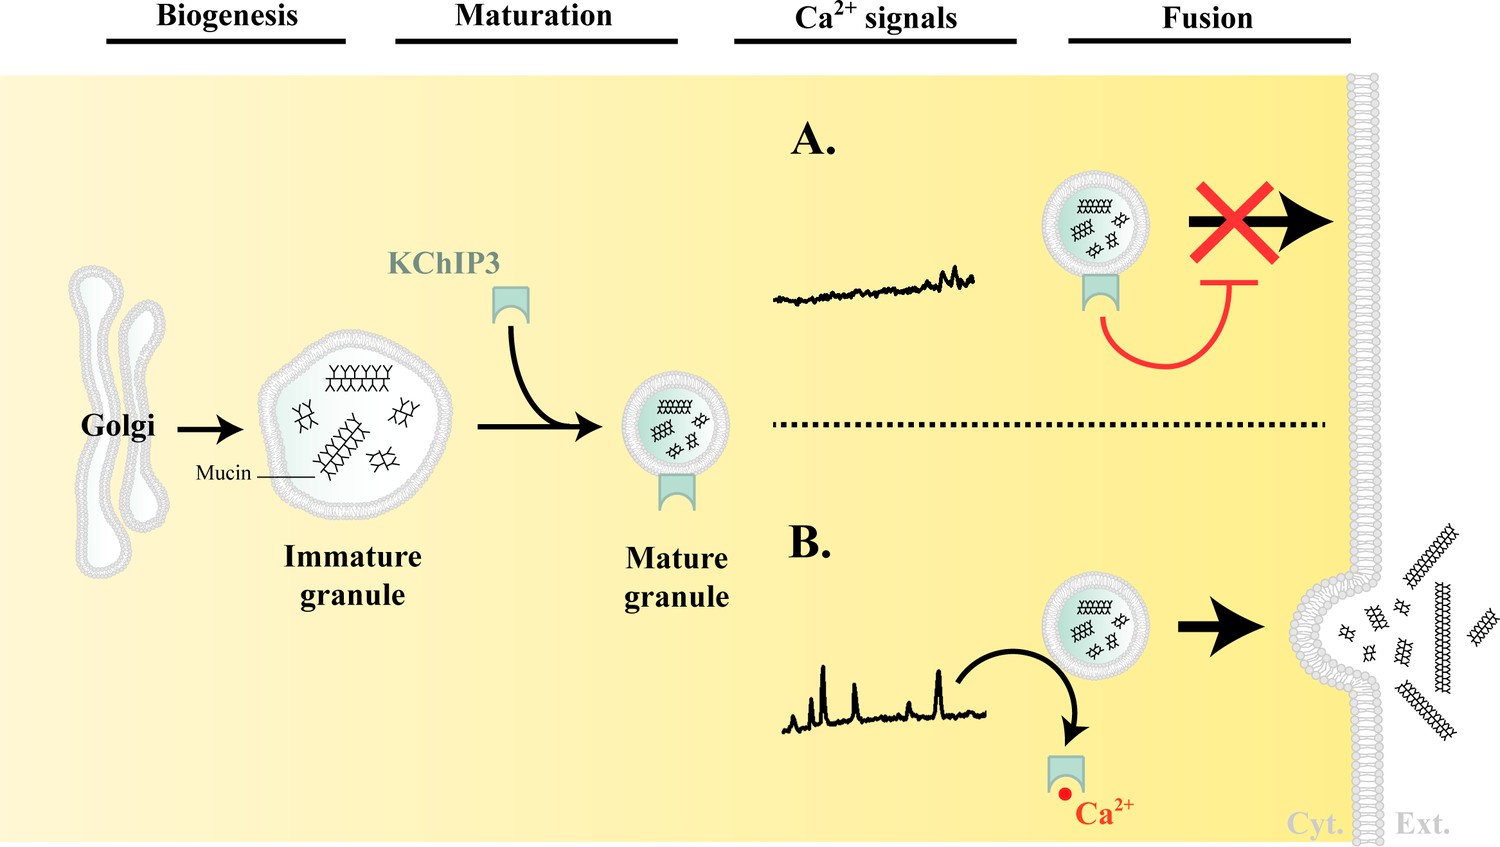
Model of KChIP3 function.
Post biogenesis at the Golgi, mucin granules undergo maturation and are placed on path to fuse with the plasma membrane and release their contents. However, the mature granules recruit KChIP3 (unbound to Ca2+) and this event stalls their fusion to the plasma membrane. KChIP3 recruitment thus acts as a brake to control the number of granules that can fuse with the plasma membrane. Based on our findings we describe two situations: (A) In absence of intracellular Ca2+ oscillations, KChIP3 is bound to the granules preventing their secretion, and (B) Upon a rise in intracellular Ca2+ by RYR-induced Ca2+ oscillations, the KChIP3 on the granules binds Ca2+ and subsequently detaches thereby triggering their SNARE dependent fusion to the plasma membrane. The cells have therefore evolved a mechanism by imposing the recruitment of empty KChIP3 to mucin granules to stall their progression leading to fusion with plasma membrane. Abbreviations: Cyt.: cytosol, Ext.: extracellular medium.
Tables
Table 1
Primer sequences used for detecting mRNA for the respective genes
https://doi.org/10.7554/eLife.39729.012| Gene | Forward primer (5’ - 3’) | Reverse primer (3’ - 5’) |
|---|---|---|
| KCNIP1 | GAAAGACATCGCCTGGTGGTAT | GGCACTCATTTTTGAAGCCTCG |
| KCNIP2 | CAGTTCGCTCCCTTCAGCATTA | TAGGTGCTGGAGTCTCCTTGAG |
| KCNIP3 | ACCCTCCTTCTTGCTAAGTGGT | AGGCTGGCAACAGTTTTCTTCA |
| KCNIP4 | TTGCCCAGTACCTTCTCAGACT | AACACCACTGGGGCATTCATTC |
| HPRT1 | CCTGCTTCTCCTCAGCTTCAG | ACACCCTTTCCAAATCCTCAGC |
| GAPDH | GAAGGTGAAGGTCGGAGTCAAC | CATCGCCCCACTTGATTTTGGA |
Additional files
-
Transparent reporting form
- https://doi.org/10.7554/eLife.39729.013
Download links
A two-part list of links to download the article, or parts of the article, in various formats.
Downloads (link to download the article as PDF)
Open citations (links to open the citations from this article in various online reference manager services)
Cite this article (links to download the citations from this article in formats compatible with various reference manager tools)
KChIP3 coupled to Ca2+ oscillations exerts a tonic brake on baseline mucin release in the colon
eLife 7:e39729.
https://doi.org/10.7554/eLife.39729


